Introduction
Gastric cancer (GC), which ranks fifth in incidence
and fourth in mortality among all types of cancer in the world,
continues to pose a significant health challenge worldwide. Despite
notable advancements in surgery, chemotherapy and radiation
therapy, the mortality rate of GC remains high (1), with >1 million new cases and
769,000 deaths reported worldwide in 2020(2). Immunotherapy has revolutionized the
treatment of many types of human cancers and has been the
cornerstone of success in the treatment of several cancers
(3). Although certain patients
with GC achieve dramatic and durable responses to immunotherapy
with a superior safety profile, only a few patients benefit from
this treatment. The tumor microenvironment, especially immune cell
infiltration, serves an important role in the immunotherapy
response. Considering the promise of immunotherapy, further
research on the tumor microenvironment (TME) is necessary.
N6-methyladenosine (m6A), the most
prevalent internal modification of eukaryotes, was discovered in
the 1970s (4). The formation of
m6A is a dynamic and reversible process. In general, a methyl group
is installed on the N6 position by ‘writers’
[methyltransferase-like (METTL)3, METTL14 and Wilms tumor
1-associated protein] and removed by ‘erasers’ [fat mass and
obesity-associated protein (FTO) and AlkB homolog 5 (ALKBH5)]
(5). These molecules regulate many
biological functions. For example, METTL3/14 regulates the response
of colorectal carcinoma and melanoma to anti-programmed cell death
protein 1 (PD-1) therapy via interferon-γ-signal transducer and
activator of transcription 1-interferon regulatory factor 1
signaling (6). FTO inhibits the
stemness of ovarian cancer cells by enhancing cAMP signaling
(7). ALKBH5 inhibits pancreatic
cancer tumor development and chemosensitization by regulating Wnt
signaling (8). The YTH domain
family, serving as ‘readers’ of m6A, contains five members [YTH
Domain Containing (YTHDC)1, YTHDC2, YTH m6A RNA binding protein
(YTHDF)1, YTHDF2 and YTHDF3], each of which mediate different
functions of m6A-methylated RNAs by recognizing m6A modification.
YTHDC1 serves a pivotal role in RNA splicing and nuclear protein
export (9). YTHDC2, which contains
a helicase domain, maintains a gene expression program that
facilitates meiotic progression by regulating the levels of
m6A-modified germline transcripts (10). YTHDF2 promotes hepatocellular
carcinoma stem cell phenotype and metastasis by regulating
octamer-binding transcription factor 4 mRNA methylation, which is
associated with a poor prognosis (11). YTHDF3 serves a critical role in
breast cancer brain metastasis by enhancing the translation of ST6
N-acetylgalactosaminide α-2,6-sialyltransferase 5 and gap junction
protein α1(12).
YTHDF1 serves a pivotal role in regulating tumor
proliferation and apoptosis (13),
tumorigenesis and metastasis (14), and cell cycle progression and
metabolism (15). In recent years,
emerging evidence has indicated that YTHDF1 serves an important
role in the tumor immune microenvironment (TIME). In breast cancer,
YTHDF1 is closely associated with CD4 T cells, natural killer (NK)
cells, monocytes and macrophages (16). Another study indicated that immune
cell infiltration levels and immune markers in ovarian carcinoma
are closely linked to YTHDF1 expression (17). Previous studies have suggested that
YTHDF1 inhibits the tumor-suppressive effect of p53 and promotes
tumor progression (18). However,
whilst studies have hinted at the involvement of YTHDF1 in several
cancers, a comprehensive understanding of its role in gastric
cancer, particularly in association with p53, remains elusive.
Therefore, the present study aimed to assess the roles of YTHDF1
and p53 in regulating the immune microenvironment of GC. Through an
evaluation of YTHDF1 expression, its association with immune cell
infiltration in GC, and its association with p53 mutations, we
hypothesize, for the first time to the best of our knowledge, that
YTHDF1 serves a crucial role in regulating immune cell infiltration
by interacting with p53 in GC. This novel perspective provides a
promising direction for future research.
Materials and methods
cBioportal database
The cBio Cancer Genomics Portal (https://www.cbioportal.org/) (19), which offers a visualization tool
for the study and analysis of tumor gene data, provides a
comprehensive approach to understanding genetics, epigenetics, gene
expression and proteomics-based on molecular data derived from
tumor tissues and cytology studies. In the present study, the
cBioPortal database was used to analyze genetic alterations in the
YTH family in GC. In brief, the following origin studies were
selected: Gastric cancer (OncoSG, 2018) (20), stomach adenocarcinoma (Pfizer and
UHK, Nature Genetics 2014) (21),
stomach adenocarcinoma (TCGA, Firehose Legacy) (22), stomach adenocarcinoma (University
of Tokyo, Nature Genetics 2014) (23) and stomach adenocarcinoma (UHK,
Nature Genetics 2011) (24).
Subsequently, a query was performed using a gene list comprising
YTHDF1, YTHDF2, YTHDF3, YTHDC1 and YTHDC2.
Tumor Immune Estimation Resource
(TIMER) database analysis
The TIMER database (https://cistrome.shinyapps.io/timer/) (25), which detects the infiltration of
immune cells into tumor tissues, provides six types of immune cell
infiltration levels. Immune cells include B cells, CD4+
T cells, CD8+ T cells, neutrophils, macrophages and
dendritic cells (DCs). This database consists of seven modules. In
the present study, the association between YTHDF1 and immune cell
infiltration was determined using a gene module. The specific
settings were as follows: Gene symbol, YTHDF1; cancer types,
stomach adenocarcinoma (STAD); and immune infiltrates, B cell,
CD8+ T cell, CD4+ T cell, macrophages,
neutrophils and DCs. Additionally, the ‘SCNA’ module was used to
assess immune infiltration levels in GC with varying YTHDF1 copy
number alterations. The parameters for this analysis were as
follows: Gene symbol, YTHDF1; cancer types, STAD; and immune
infiltrates, B cell, CD8+ T cell, CD4+ T
cell, macrophages, neutrophils and DCs. Furthermore, a correlation
module was used to analyze the relationship between YTHDF1 and
several immune markers in GC. The following parameters were set:
Cancer types, STAD; gene symbol (y-axis), YTHDF1; and gene symbol
(x-axis), immune markers.
University of Alabama at Birmingham
Cancer data analysis portal (UALCAN) database
The UALCAN data analysis portal (http://ualcan.path.uab.edu/) (26) is a comprehensive online resource
that can be used to assess tumor subgroup gene expression based on
different features. In the present study, the UALCAN database was
used to analyze the association between YTHDF1 and tumor grade, p53
mutation status and microsatellite instability status in GC. In
brief, the YTHDF1 expression level in stomach adenocarcinoma was
evaluated by inputting the gene symbol. Subsequently, the
expression level was analyzed in relation to tumor grade, p53
mutation status and microsatellite instability status using
Clinical Proteomic Tumor Analysis Consortium (https://ualcan.path.uab.edu/cgi-bin/CPTAC).
Tumor-Immune System Interactions and
Drug Bank (TISIDB) database
The TISIDB database (http://cis.hku.hk/TISIDB/) (27) is a powerful online resource with
extensive data on tumor immunity. The database contains information
on 988 genes associated with antitumor immunity and can precompute
the associations between genes and the immune function of 28
tumor-infiltrating lymphocytes (TILs) for 30 cancer types from The
Cancer Genome Atlas (TCGA). Additionally, the database includes
genomic, transcriptomic and clinical data of 30 TCGA tumors. The
analysis in the present study involved assessing associations
between YTHDF1 expression, gastric tumor grade and molecular
subtype. In brief, YTHDF1 was searched for in the ‘Gene Symbol’
dialog box. Following that, the Lymphocyte module was used to
calculate Spearman's correlation coefficient for YTHDF1 expression
and TILs across several human cancers. Subsequently, the lymphocyte
types for the x-axis and cancer types for the y-axis were selected
to generate a plot for each lymphocyte type in a single cancer.
Additionally, the association between YTHDF1 expression and the
molecular subtypes of gastric cancer were analyzed using the
subtype module.
Kaplan-Meier plotter analysis
The association between YTHDF1 and survival in
multiple cancer types was analyzed using the Kaplan-Meier plotter
(https://kmplot.com/analysis/) (28), which evaluates the correlation
between 70,632 genes and prognosis across 21 human cancers. Using
this database, a pan-cancer RNA-sequencing search was performed
using YTHDF1 (221741_s_at, and an auto selected best cutoff) and
overall survival (OS) to assess the relationship between YTHDF1
expression and OS in multiple human cancer types. Hazard ratios
with 95% confidence intervals (CIs) and log-rank P-values were
calculated to quantify the significance of this association.
Gene expression profiling interactive
analysis (GEPIA) database
The GEPIA database (http://gepia.cancer-pku.cn/) (29) seamlessly integrates gene expression
profiling data from the TCGA and Genotype-Tissue Expression (GTEx)
projects to provide multiple data analyses and visualization
capabilities. The correlation module was used to assess the
relationships between genes related to T-cell exhaustion, namely
PD-1, T-lymphocyte-associated protein 4, T cell immunoglobulin and
mucin-domain-containing-3 (TIM-3), and the expression of YTHDF1.
Associations between the expression of YTHDF1 and gastric
cancer-related genes, such as KRAS, human epidermal growth factor
receptor-2 (HER-2) and TP53, were also analyzed using this module.
Regarding the specific settings, YTHDF1 was designated as Gene A
for the x-axis, whilst individual genes associated with T-cell
exhaustion or gastric cancer served as Gene B for the y-axis.
Spearman's rank correlation coefficient was calculated.
Subsequently, the STAD tumor was selected from ‘TCGA Tumor’ dialog
box, STAD normal from the ‘TCGA Normal’ dialog box and stomach from
the ‘GTEx’ dialog box. These selections were used to compile the
dataset list, upon which the correlation analysis was
performed.
GeneMANIA database
The GeneMANIA database (http://genemania.org/) (30), designed to predict the function of
genes of interest, indexes 2,830 association networks containing
660,554,667 interactions mapped to 166,691 genes from nine
organisms. This database enables users to predict gene-gene
functional interaction networks from a provided gene list. In the
present study, the GeneMANIA database was used to predict the
interactions between YTHDF1 and the p53 pathway by searching for a
gene list that included YTHDF1, p53, p21 and mouse double minute 2
(MDM2).
HitPredict database
HitPredict (http://www.hitpredict.org/) (31) integrates protein-protein
interactions derived from high-throughput or small-scale trials in
the IntAct, BioGRID, HPRD, MINT and DIP databases. In the present
study, an interaction was identified between YTHDF1 and p53 by
querying the HitPredict database with gene symbol YTHDF1 in Homo
sapiens and evaluating the interaction between YTHDF1 and p53
using reliability scores as a metric.
LinkedOmics database
The LinkedOmics database (http://www.linkedomics.org/) (32) includes multiomics and clinical data
for 32 types of cancer and 11,158 patients from TCGA. Initially, an
analysis to identify genes that correlate with YTHDF1 expression in
gastric cancer (GC) was performed through the following process:
The STAD cohort, the HiSeq RNA dataset, YTHDF1 as the dataset
attribute, HiSeq RNA as the target dataset, and the Pearson
correlation test as the statistical method, were selected.
Subsequently, the correlated genes were selected to perform Gene
Ontology and Kyoto Encyclopedia of Genes and Genomes (KEGG)
enrichment analyses using the Gene Set Enrichment Analysis
tool.
Cell lines and cell culture
The GC cell lines, namely HGC-27, AGS and MKN-45,
the human normal gastric mucosa epithelial cell line GES-1, and the
293T cell line, were purchased from the Cell Bank of Type Tissue
Culture Collection of The Chinese Academy of Sciences (Shanghai,
China). All cells were cultured in DMEM (Hyclone; Cytiva) with 10%
FBS (Gibco; Thermo Fisher Scientific, Inc.) and 1%
penicillin/streptomycin in an incubator with 5% CO2 at
37˚C for 24-48 h. All cells were confirmed to be mycoplasma-free
and authenticated using PCR analysis.
Plasmid and transfection
Human YTHDF1 was subcloned into Myc-His-pcDNA3.1.
The full-length cDNA of YTHDF1 was amplified using PCR, with
primers that were designed using the National Center for
Biotechnology Information Primer-BLAST tool (33). Prior to synthesis, protective bases
(CCG) and specific enzyme cleavage sites (Xho I: 5'-CTCGAG-3' for
the forward primer and EcoR I: 5'-GAATTC-3' for the reverse primer)
were appended to the 5' ends of the primers. The sequences of these
primers were as follows: Forward,
5'-CCGCTCGAGATGTCGGCCACCAGCGTGGA-3' and reverse,
5'-CCGGAATTCTCATTGTTTGTTTCGACTCTGC-3'. The PCR assay was executed
utilizing Taq Plus DNA Polymerase (cat. no. P101-01; Vazyme Biotech
Co., Ltd.) in accordance with the following thermocycling
conditions: Pre-denaturation at 95˚C for 8 min, followed by 38
cycles of denaturation at 94˚C for 30 sec, annealing at 55˚C for 30
sec and extension at 72˚C for 2 min. Subsequently, a final
extension step was performed at 72˚C for 7 min. The resulting
products were separated on a 2% agarose gel and visualized using UV
imager (Tanon Science and Technology Co., Ltd.). After PCR
amplification, both the amplified fragment and the empty vector
(Myc-His-pcDNA3.1) underwent enzymatic cleavage. The reaction
mixture (20 µl) consisted of 2 µl New England BioLabs buffer 2.1
(New England BioLabs, Inc.), 1 µl Xho I (New England BioLabs,
Inc.), 1 µl EcoR I (New England BioLabs, Inc.), 2 µg of the
fragment or 1 µg of the empty vector, and an appropriate amount of
double-distilled water (ddH2O). The mixtures were incubated for 2 h
at 37˚C. Subsequently, the cleaved fragment and empty vector were
ligated using T4 ligase. The ligation reaction mixture (10 µl)
contained 1 µl T4 ligase buffer (New England BioLabs, Inc.), 1 µl
T4 ligase (New England BioLabs, Inc.), 20 ng of the empty vector,
120 ng of the fragment, and an appropriate amount of ddH2O. The
ligation mixtures were incubated for 16 h at 16˚C. Myc-His-pcDNA3.1
was used as a negative control in the YTHDF1 overexpression
experiment. The plasmid encoding p53 (pcDNA3.1-p53) was donated by
Professor Xiang Zhou (Fudan University Shanghai Cancer Center) and
plasmids expressing the empty vector (pcDNA3.1) were used as a
negative control. Plasmids (10 µg Myc-His-pcDNA3.1-YTHDF1,
pcDNA3.1-p53 or corresponding empty vector) were transiently
transfected (at 37˚C) into 293T cells that had been seeded
overnight on 10 cm dishes using polyethylenimine (Sigma-Aldrich;
Merck KGaA). The cells were harvested 48 h post-transfection for
subsequent experiments.
Clinical specimens
GC and adjacent normal tissue specimens were
collected after surgery at the First Affiliated Hospital of
Nanchang University (Nanchang, China) and were promptly frozen in
liquid nitrogen and stored in -80˚C until use. All patients
provided signed informed consent before sample collection. The
present study was approved by the Ethics Committee of First
Affiliated Hospital of Nanchang University.
Reverse transcription(RT)-quantitative
(q)PCR
TRIzol™ reagent (Takara Biotechnology Co., Ltd.) was
used to extract total RNA from the GC cell lines. The PrimeScript™
RT reagent kit (cat. no. RR047A; Takara Biotechnology Co., Ltd.)
and TB Green™ premix Ex Taq (cat. no. RR820B Takara Biotechnology
Co., Ltd.) were used to detect the mRNA levels of YTHDF1 according
to the manufacturer's instructions. The fluorophore used in present
study was carboxyfluorescein (MilliporeSigma). The qPCR assay
employed the following thermocycling conditions: An initial
pre-denaturation step at 95˚C for 30 sec, followed by 40 cycles of
denaturation at 95˚C for 30 sec, annealing at 60˚C for 30 sec and
extension at 95˚C for 15 sec. Subsequently, a final extension step
was performed at 60˚C for 60 sec and 95˚C for 15 sec. The relative
expression of YTHDF1 mRNA in GC cell lines was calculated using the
2-ΔΔCq method (34) and normalized to GAPDH. The primers
used were as follows: YTHDF1 (forward) 5'-ACCTGTCCAGCTATTACCCG-3'
and (reverse) 5'-TGGTGAGGTATGGAATCGGAG-3'; GAPDH (forward)
5'-CGCTCTCTGCTCCTCCTGTTC-3' and (reverse)
5'-ATCCGTTGACTCCGACCTTCAC-3'.
Immunoblotting
Proteins from GC tissues or cells were obtained
using RIPA buffer (containing 1% protease/phosphatase inhibitor;
Applygen Technologies, Inc.). The protein concentration was
measured utilizing the BCA protein assay kit (cat. no. P0010;
Beyotime Institute of Biotechnology). The proteins (20 µg) were
separated by 10% SDS-PAGE and electroblotted onto polyvinylidene
difluoride membranes (Bio-Rad Laboratories, Inc.). The membranes
were blocked with 5% milk for 1 h at room temperature and then
incubated with primary antibodies against YTHDF1 (1:1,000; cat. no.
17479-1-AP; Proteintech Group, Inc.) and GAPDH (1:5,000; cat. no.
60004-1-Ig; Proteintech Group, Inc.) overnight at 4˚C. Following a
wash with TBST (containing 0.1% Tween), the membranes were
incubated for 1 h at room temperature with the appropriate
secondary antibodies conjugated to horseradish peroxidase
(HRP-conjugated affinipure goat anti-rabbit IgG; 1:10,000; cat. no.
SA00001-2; or anti-mouse IgG; 1:10,000; cat. no. SA00001-1;
Proteintech Group, Inc.). GAPDH was used as an internal control.
Proteins were visualized with the ECL chemiluminescence reagent
(Shanghai Yeasen Biotechnology, Co., Ltd.).
Immunohistochemistry (IHC) of YTHDF1
and its association with lymphocyte subsets
To assess the relationship between YTHDF1 expression
and lymphocyte subsets in clinical samples, the expression of
YTHDF1 was first assessed in GC tissues using IHC. In brief,
paraffin-embedded sections of GC tissue (5-µm thick sections, fixed
with 4% paraformaldehyde at room temperature for 20 min) were
deparaffinized and rehydrated using different concentrations of
ethanol (anhydrous ethanol for 5 min, 95% ethanol for 5 min, 90%
ethanol for 5 min, 80% ethanol for 3 min and 70% ethanol for 3 min)
at room temperature. Subsequently, the sections were incubated in a
3% H2O2 solution for 10 min at room
temperature to eliminate endogenous peroxidase. Antigen retrieval
was performed by heating the sections in citrate buffer at 95˚C for
1 h. Then sections were blocked with 2% BSA (Origene Technologies,
Inc.) for 20 min at room temperature. Subsequently, the sections
were incubated with rabbit anti-human polyclonal YTHDF1 antibodies
(1:100; cat. no. 17479-1-AP; Proteintech Group, Inc.) in a
humidified box overnight at 4˚C. Sections were then washed thrice
with PBS, followed by incubation with a horseradish peroxidase
system (cat. no. Ab6721; Abcam) and liquid DAB (cat. no. K346889-2;
Dako; Agilent Technologies, Inc.) at room temperature. Finally, the
sections were incubated in PBS containing diaminobenzidine for 10
min at room temperature. A light microscope (Ti-S-Fi1C; Nikon
Corporation) was used for imaging at x100 magnification. The
evaluation criteria were as follows: Staining intensity for YTHDF1
was scored as 0 (negative), 1 (weak), 2 (moderate) and 3 (strong).
Staining extent was scored as 0 (0), 1 (1-25%), 2 (26-50%), 3
(51-75%) and 4 (76-100%). The product of the stain intensity and
extent scores was regarded as the score index (SI). According to
the SI scores, samples with SI score ≥6 were considered to have
high YTHDF1 expression, whilst the rest were considered to have low
YTHDF1 expression. Subsequently, data on lymphocyte subsets,
analyzed by the laboratory department of the First Affiliated
Hospital of Nanchang University using flow cytometry, were
collected from the clinical medical records of each patient. Data
were analyzed using GraphPad Prism 8.0.2 (Dotmatics). Unpaired
Student's t-tests were used to assess the differences between the
high and low YTHDF1 expression groups concerning total lymphocytes,
total T, CD4+ T, CD8+ T, NK and B cells.
Immunoprecipitation
293T cells were transfected with Myc-YTHDF1, p53 or
control for 48 h at 37˚C and treated with 20 µM MG132
(MedChemExpress) for 6 h before being harvested on the ice.
Following that, proteins were extracted using lysis buffer [10 mM
Tris, 150 mM NaCl, 1 mM Na2EDTA.2H2O, 3.5 mM SDS, 1 mM DTT and 1%
NP-40 (pH 7.4)], and immunoprecipitation was performed using the
anti-Myc or anti-p53 antibodies. In brief, 10 µg whole cell lysate
were used as the input. A total of 500 µg protein was incubated
with 2 µg anti-IgG (cat. no. 30000-0-AP; Proteintech Group, Inc.),
2 µg anti-p53 (cat. no. sc-126; Santa Cruz Biotechnology, Inc.) or
2 µg anti-Myc (cat. no. 10828-1-AP; Proteintech Group, Inc.)
antibodies at 4˚C for 4 h. Protein G beads (40 µl) (Santa Cruz
Biotechnology, Inc.) were then added to the mixture, followed by
incubation at 4˚C for an additional 2 h. The beads were washed five
times with 1 ml lysis buffer, with each wash involving
centrifugation at 800 x g for 1 min at 4˚C. Protein complexes were
detected by immunoblotting, as in the aforementioned
description.
Statistical analysis
Most statistical analyses were automatically
performed using online databases, following the statistical methods
outlined in their respective databases. Additionally, the
statistical analysis of experimental data was performed using
GraphPad Prism 8.0.2 (Dotmatics). Specifically, for comparing data
between two groups, an unpaired Student's t-test was used, whereas
one-way ANOVA followed by Tukey's post hoc test was used for
comparing ≥3 groups. P<0.05 was used to indicate a statically
significance difference.
Results
YTHDF1 expression and prognostic value
in GC
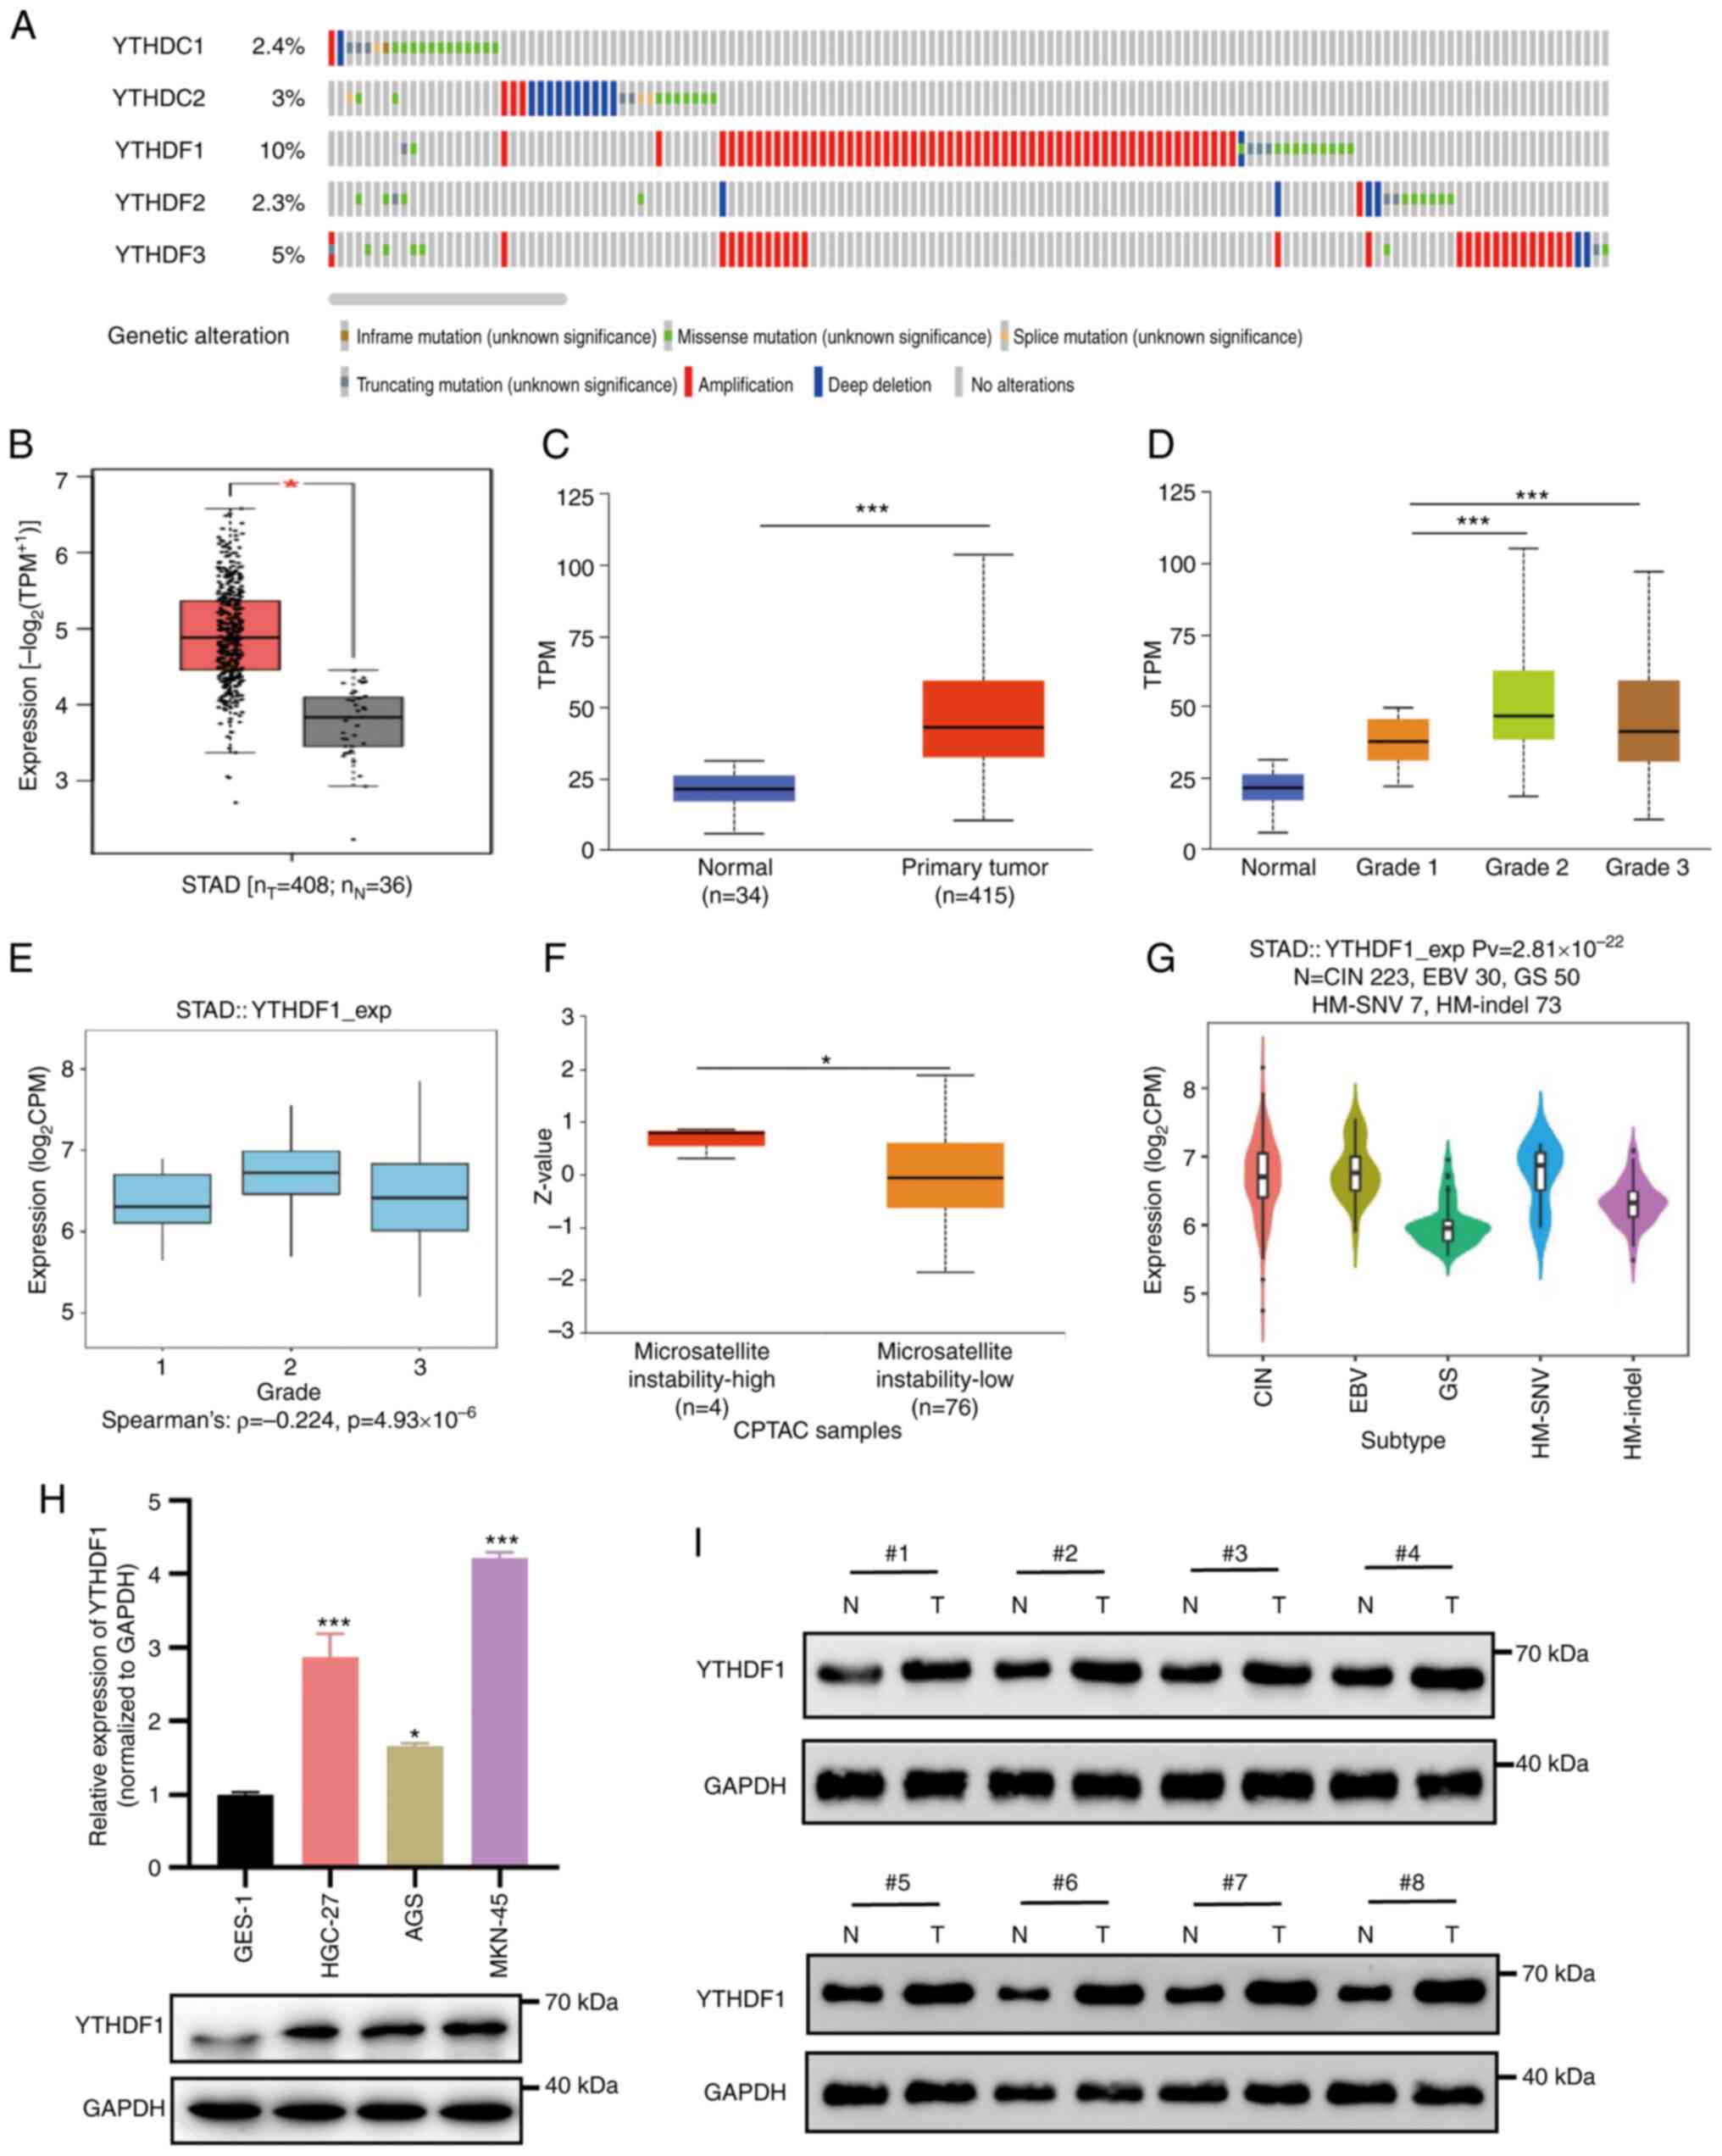
The cBioPortal database was first used to determine
genetic alterations in the YTH domain family among patients with
GC. It was demonstrated that YTHDF1 had the highest alteration
rate, observed in 10% of the cases, followed by YTHDF3, YTHDC2 and
YTHDC1, with alteration rates of 5.0, 3.0 and 2.4%, respectively.
The lowest alteration rate was for YTHDF2, at 2.3% (Fig. 1A).
Subsequently, the expression of YTHDF1 was assessed
using the GEPIA and UALCAN databases. The results revealed a
significant upregulation of YTHDF1 in GC samples compared with that
in normal tissues (Fig. 1B and
C). YTHDF1 expression was
significantly associated with GC tumor grade, demonstrating a
significant increase in poorly differentiated GC (Fig. 1D). Similar results were observed in
the TISIDB database analysis (Fig.
1E). Furthermore, YTHDF1 overexpression was significantly
associated with microsatellite instability-high (MSI-H) status of
GC, compared with microsatellite instability-low status (Fig. 1F). Using the TISIDB database the
associations between YTHDF1 and molecular subtypes of GC were
analyzed. The results revealed that among the molecular subtypes, a
significantly higher expression of YTHDF1 in the chromosomal
instability and Epstein-Barr virus (EBV) subtypes and the lowest in
the genomic stability (GS) subtype (Fig. 1G). Additionally, the expression of
YTHDF1 was assessed in GC cell lines and tissues. The results
demonstrated that YTHDF1 was markedly upregulated in GC cell lines
and GC samples compared with that in the normal gastric mucosa
epithelial cell line GES-1 (Fig.
1H) and normal tissues (Fig.
1I).
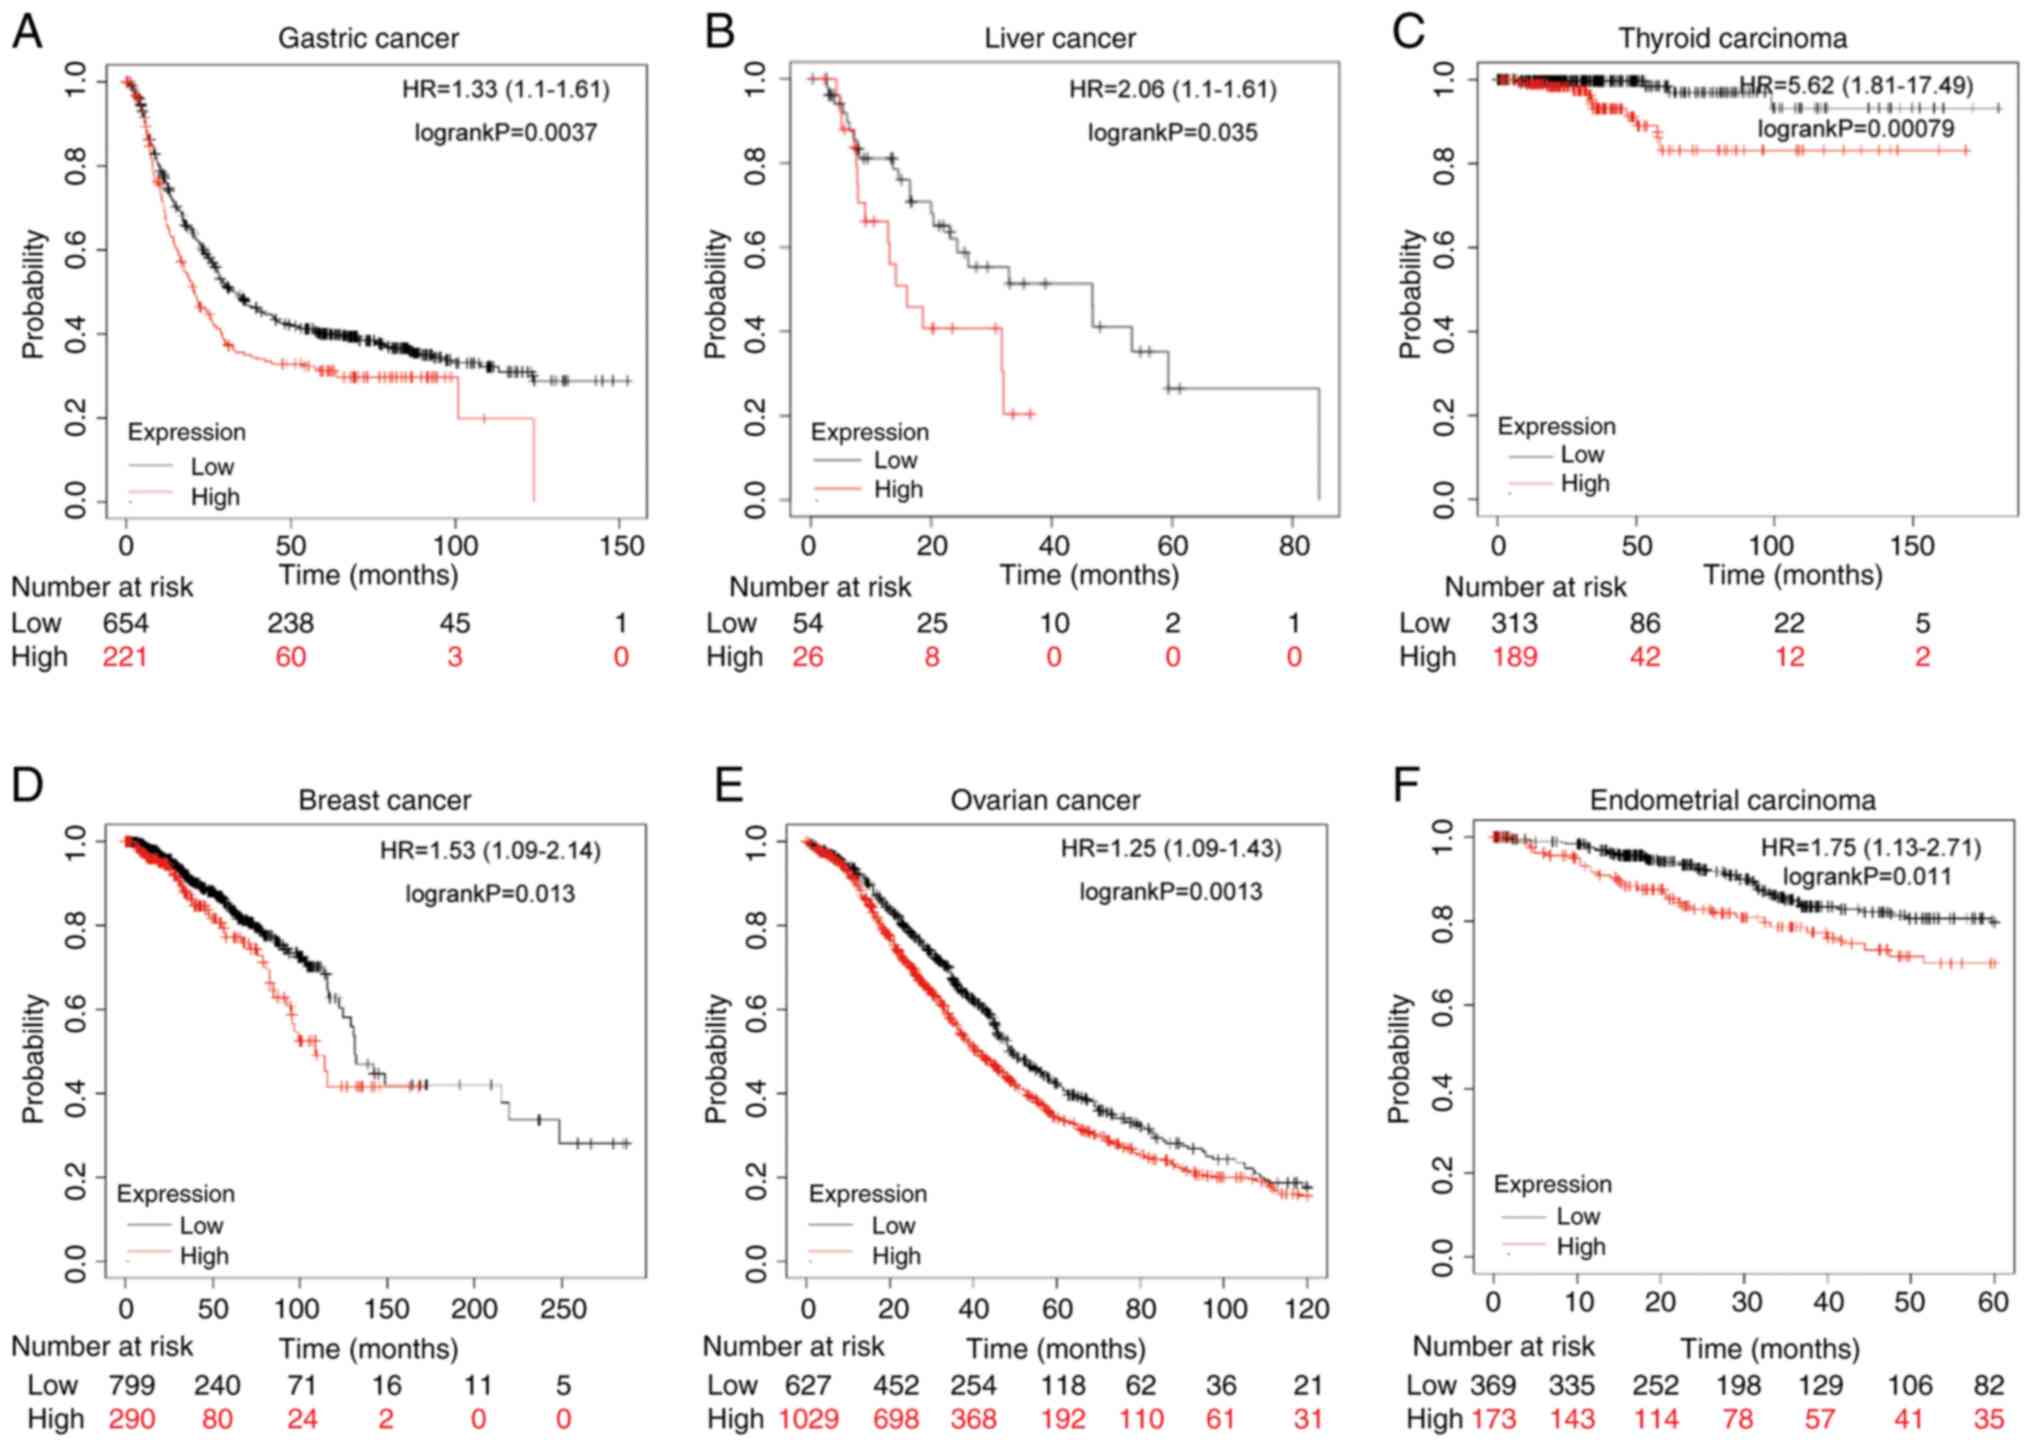
Finally, the association between YTHDF1 expression
and cell survival was evaluated. Kaplan-Meier analysis suggested
that patients with GC with high YTHDF1 expression had significantly
worse survival than those with low YTHDF1 expression (Fig. 2A). Furthermore, overexpression of
YTHDF1 was linked to a significantly worse prognosis in liver
cancer, thyroid carcinoma, breast cancer, ovarian cancer, and
endometrial carcinoma for those with high YTHDF1 expression
compared with those with low expression (Fig. 2B-F). Overall, the findings indicate
that YTHDF1 is markedly upregulated and is associated with poor
survival in patients with GC.
Associations between YTHDF1 and the
immune infiltration level in GC
YTHDF1 overexpression was observed in MSI-H and
EBV-associated GC. Considering the association between MSI-H and
EBV with GC immunotherapy (35),
the present study assessed the association between YTHDF1
expression and immune infiltration levels in GC. The correlation
between YTHDF1 expression and TILs was evaluated using the TISIDB
database. Fig. 3A shows the
Spearman's correlations between YTHDF1 and TILs across 30 human
tumors. Furthermore, YTHDF1 expression demonstrated a significant
negative correlation with the levels of activated CD8 T cells
(ρ=-0.174; P=0.00037), central memory CD8 T cells (ρ=-0.27;
P=2.6x10⁻⁸), effector memory CD8 T cells (ρ=-0.46;
P<2.2x10⁻¹⁶), central memory CD4 T cells (ρ=-0.302;
P=3.87x10⁻¹⁰), effector memory CD4 T cells (ρ=-0.468;
P<2.2x10⁻¹⁶), activated B cells (ρ=-0.412;
P<2.2x10⁻¹⁶), immune B cells (ρ=-0.452;
P<2.2x10⁻¹⁶), macrophages (ρ=-0.406;
P<2.2x10⁻¹⁶), activated DCs (ρ=-0.226;
P=3.41x10⁻⁶), monocytes (ρ=-0.211;
P=1.53x10⁻⁵), regulatory T cells (Tregs) (ρ=-0.3;
P=5.33x10⁻¹⁰) and myeloid-derived suppressor cells
(MDSCs; ρ=-0.351; P=2.29x10⁻¹³) in GC (Fig. 3B-K).
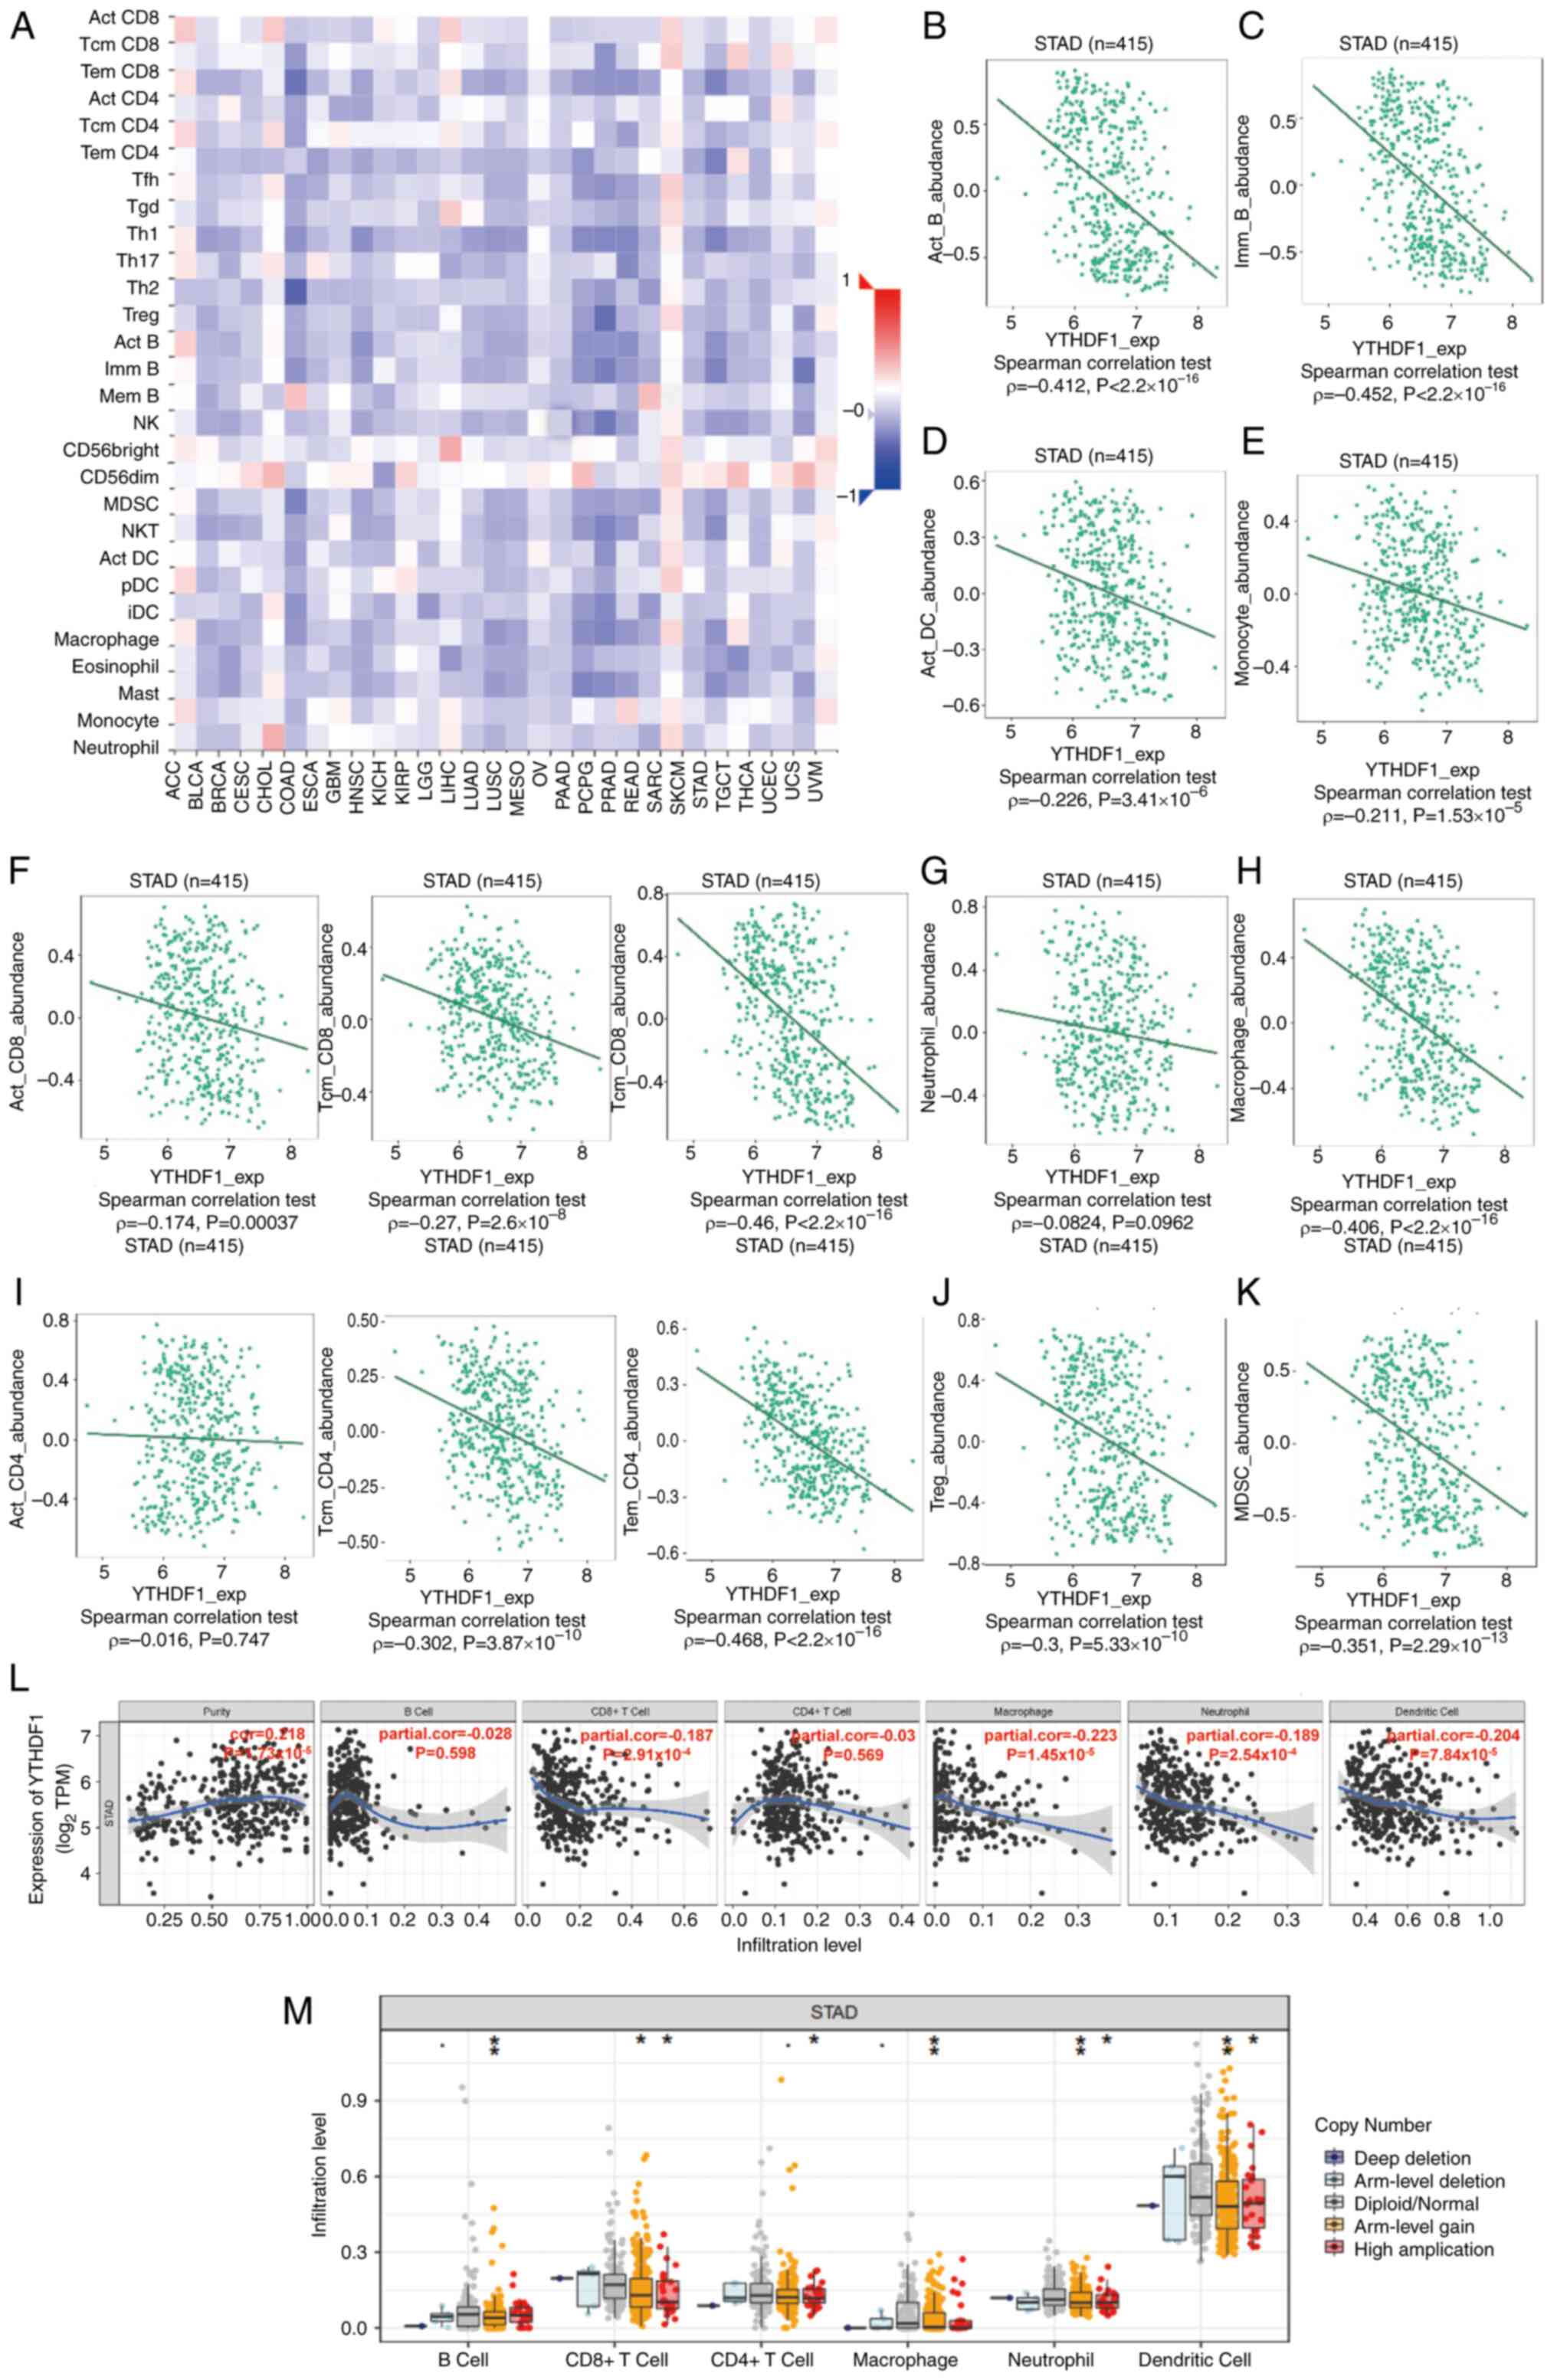 | Figure 3Correlation between YTHDF1 expression
and immune infiltration level. (A) Spearman's correlations between
YTHDF1 expression and TILs across several human cancer types.
Correlations between YTHDF1 expression and specific immune cell
types in gastric cancer, including (B) B cells, (C) macrophages,
(D) DCs, (E) monocytes, (F) CD8+ T cells, (G) neutrophils, (H)
Tregs, (I) CD4+ T cells, (J) Treg cells and (K) MDSC cells, were
analyzed using the Tumor-Immune System Interactions and Drug Bank
database. (L) Correlation between YTHDF1 expression and immune
infiltration levels in gastric cancer was analyzed using the TIMER
database. (M) Comparison of immune infiltration levels between
gastric cancer with or without YTHDF1 copy number alterations was
performed using the SCNA module of the TIMER database.
*P<0.05; **P<0.01. YTHDF1, YTH
N6-methyladenosine RNA binding protein 1; TILs,
tumor-infiltrating lymphocytes; DCs, dendritic cells; Tregs,
regulatory T cells; MDSCs, myeloid-derived suppressor cells; TIMER,
Tumor Immune Estimation Resource; STAD, stomach adenocarcinoma;
Act_CD8, activated CD8 T cells; Tcm_CD8, central memory CD8 T
cells; Tem_CD8, effector memory CD8 T cells; Tcm_CD4, central
memory CD4 T cells; Tem_CD4, effector memory CD4 T cells; Act_B,
activated B cells; Imm_B, immune B cells; TPM, transcripts per
million. |
Using the TIMER database, the correlation between
YTHDF1 and immune cell infiltration levels in GC were further
assessed. The results revealed a significant negative correlation
between YTHDF1 expression and infiltrating CD8+ T cells
(cor=-0.187; P=2.91x10⁻⁴), macrophages (cor=-0.223;
P=1.45x10⁻⁵), neutrophils (cor=-0.189;
P=2.54x10⁻⁴) and DCs (cor=-0.204;
P=7.48x10⁻⁵; Fig. 3L).
Notably, the correlation between YTHDF1 and CD4+ T cells
did not reach statistical significance (Fig. 3L), which differed from the results
of the TISIDB database. Additionally, in response to copy number
alterations in YTHDF1 cells, the infiltration levels of several
immune cells were significantly decreased compared with the cells
without such variations (Fig.
3M).
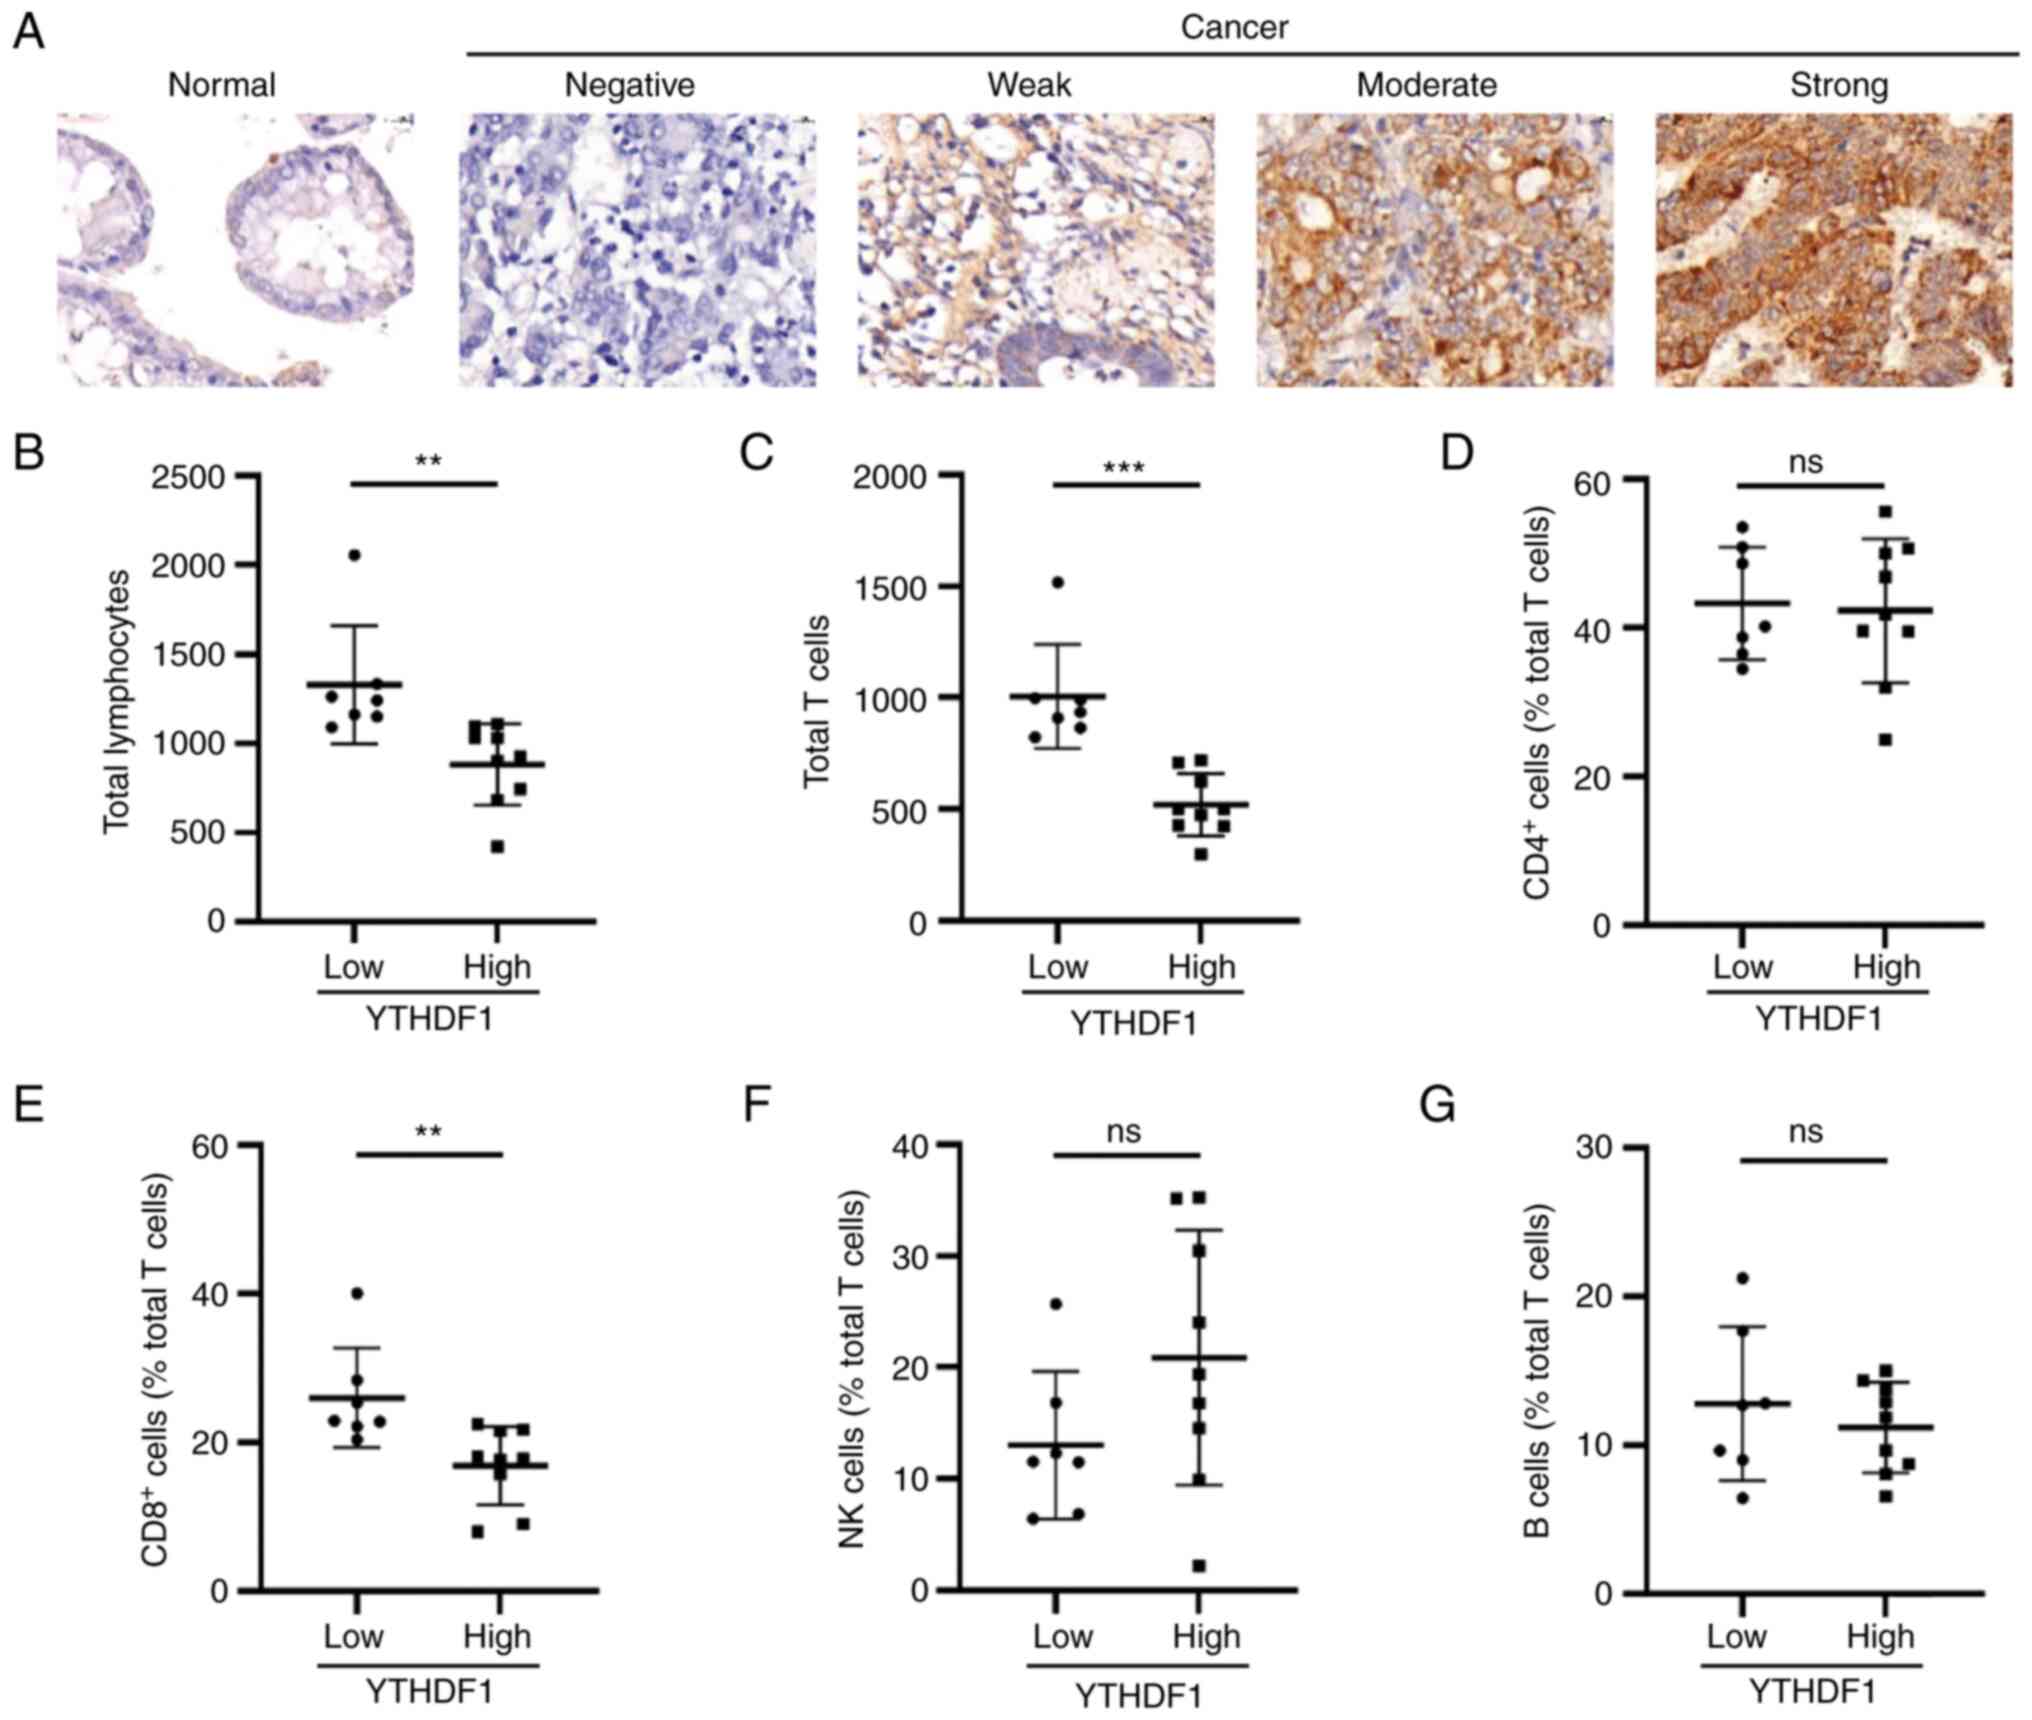
To further evaluate these findings in clinical GC
samples, 16 GC specimens were collected to assess the expression of
YTHDF1 using IHC (Fig. 4A). The
specimens were categorized into the high and low YTHDF1 expression
groups according to their SI scores. Subsequently, lymphocyte
subset data obtained from the clinical records of each patient were
analyzed. Differences between the high and low YTHDF1 expression
groups concerning lymphocytes were analyzed using GraphPad Prism
8.0.2. The results demonstrated that total lymphocytes and T cells
were significantly more abundant in the low YTHDF1 expression group
compared with the high YTHDF1 expression group (Fig. 4B and C). Regarding the lymphocyte subsets,
significantly higher levels of CD8+ T cells were
observed in the low YTHDF1 expression group compared with that in
the high YTHDF1 expression group, whereas the levels of
CD4+ T, NK and B cells were not significantly different
(Fig. 4D-G).
Correlation between YTHDF1 and immune
markers
To gain further insight into the association between
YTHDF1 and TILs in GC, the relationship between YTHDF1 and immune
markers was analyzed. The results revealed a significant positive
correlation between YTHDF1 expression and tumor associate
macrophage (TAM)-related markers such as colony-stimulating factor
1, signal transducer and activator of transcription 3, signal
transducer and activator of transcription 6 and CD274 [programmed
death-ligand 1 (PD-L1); Fig. 5A].
Conversely, markers associated with DC demonstrated a significantly
negative correlation with YTHDF1 expression (Fig. 5B). Additionally, a significant
positive correlation was observed between YTHDF1 and Treg markers
(Fig. 5C-E) and T cell exhaustion
markers (Fig. 5F-H).
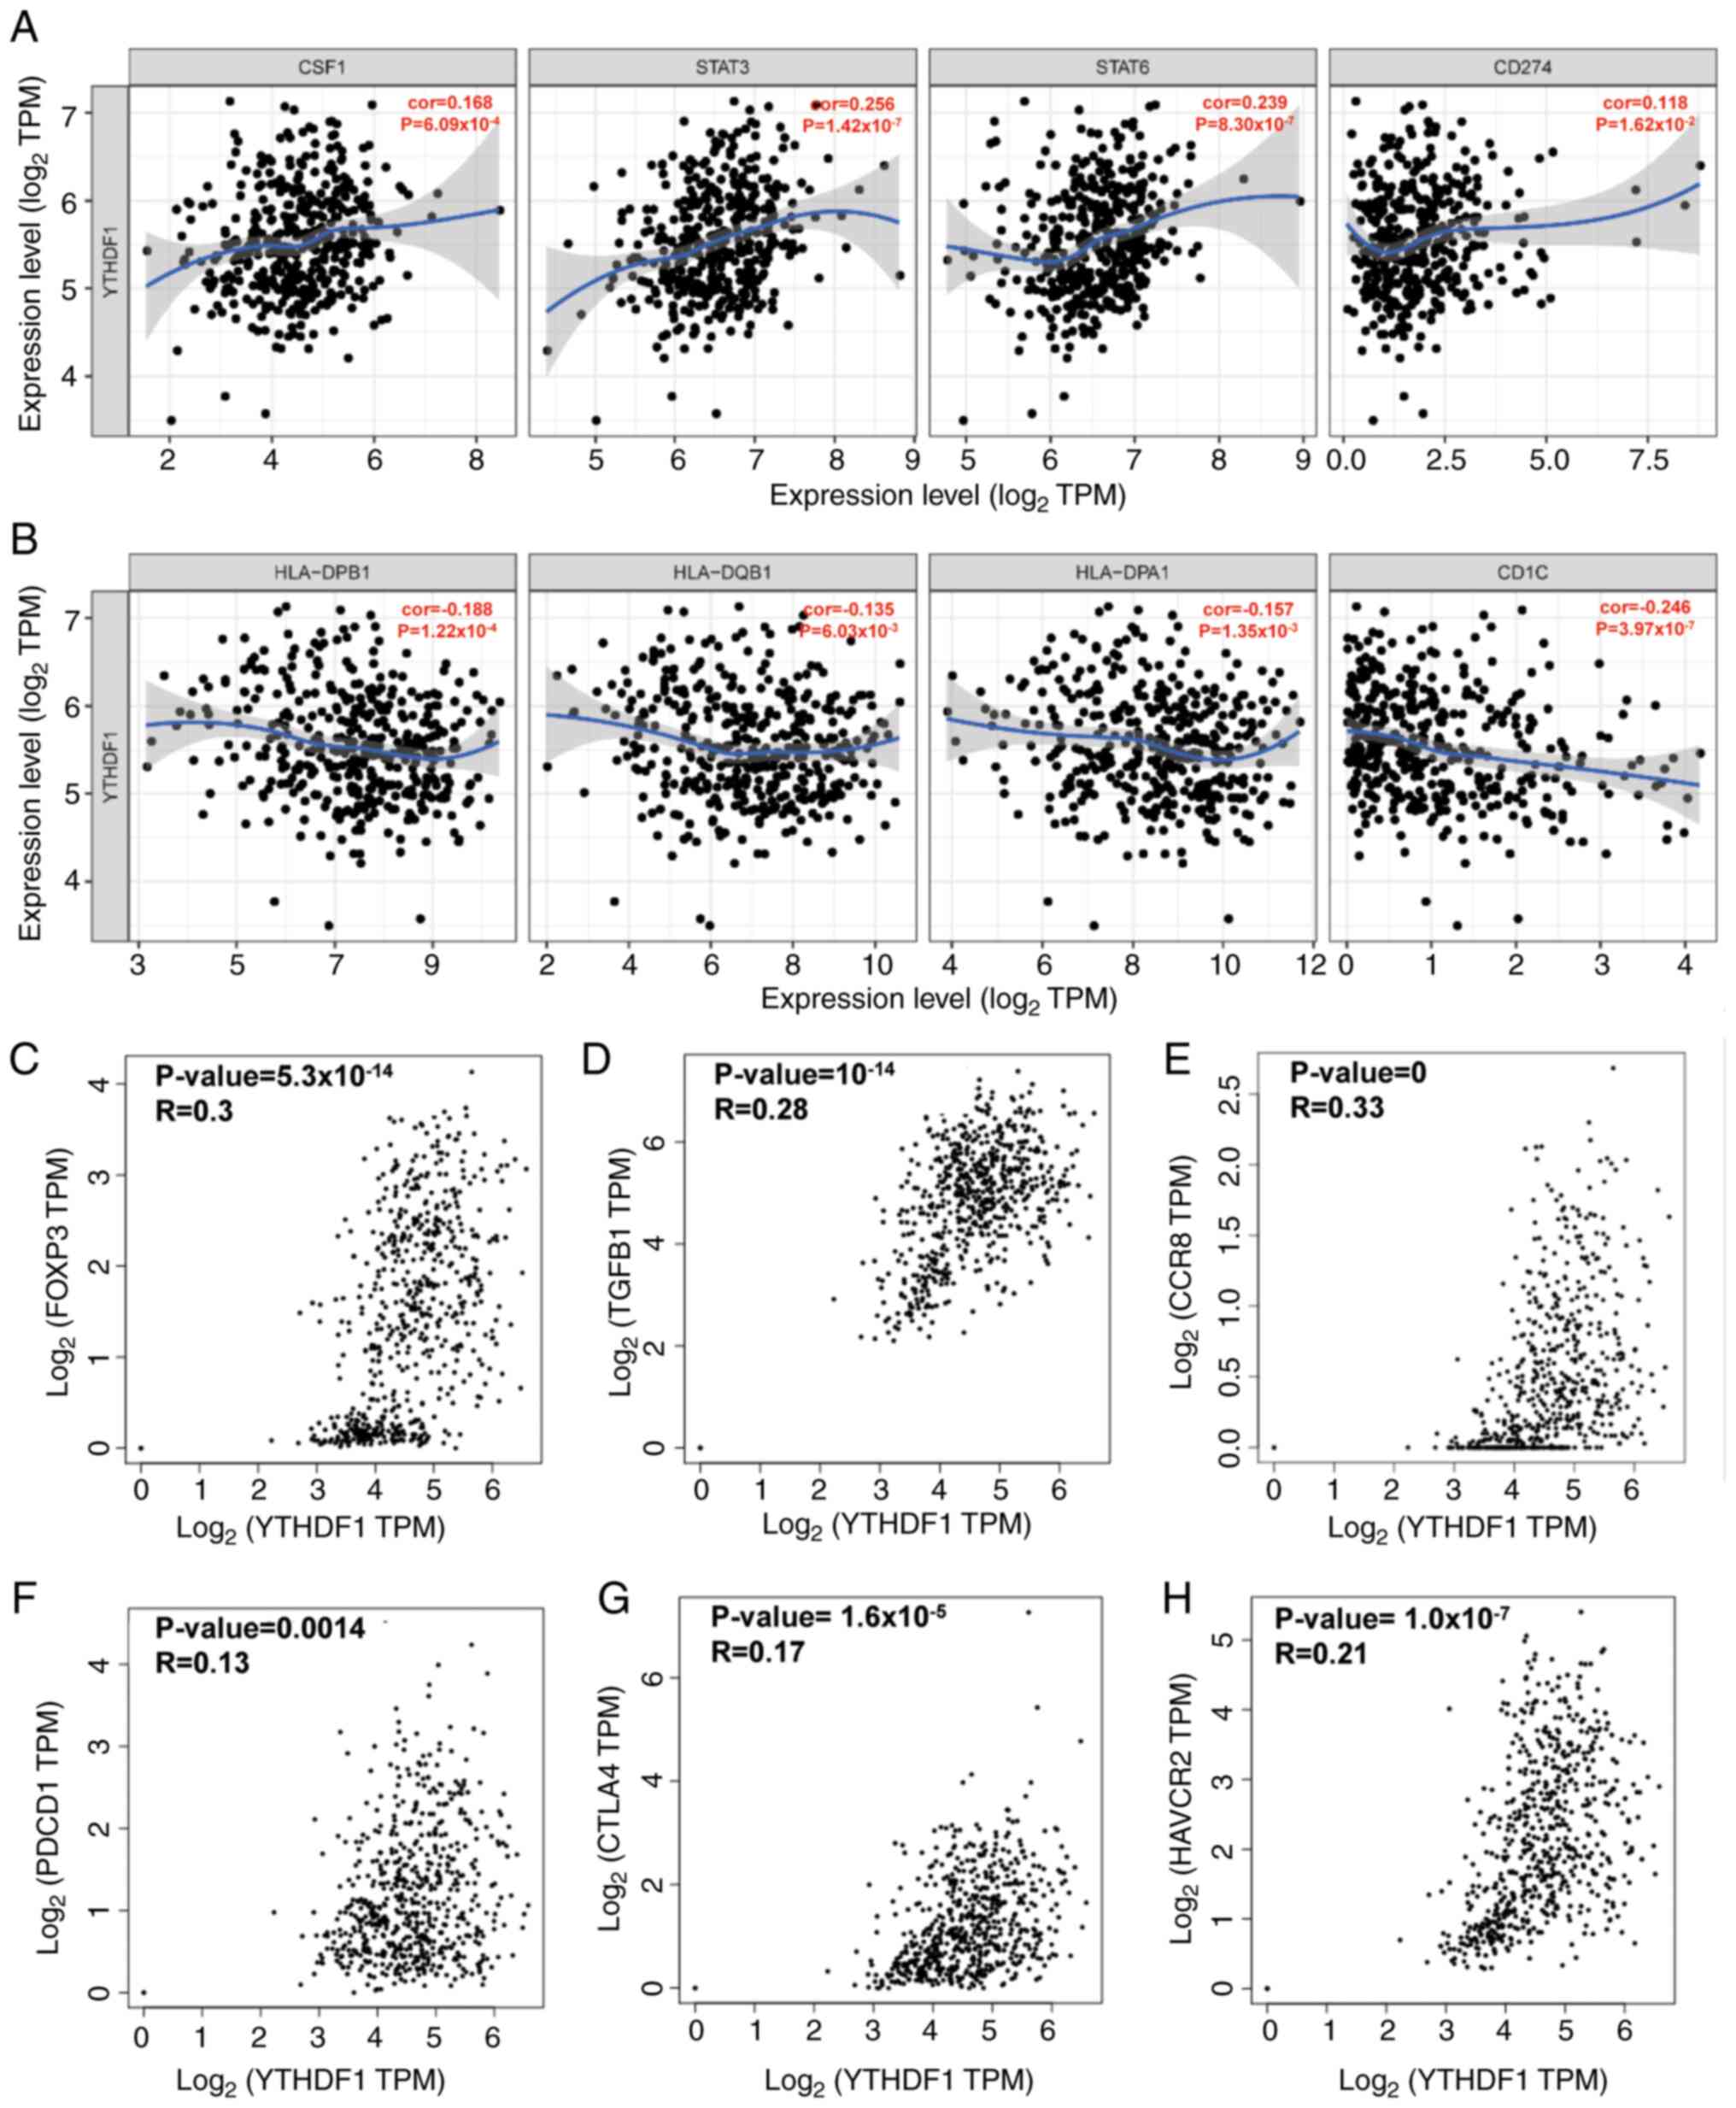 | Figure 5Correlation between YTHDF1 and
markers of immune cells in gastric cancer. Correlation between
YTHDF1 and (A) tumor associate macrophage-related genes and markers
and (B) DC markers were analyzed using the Gene module of the Tumor
Immune Estimation Resource database. Correlation between YTHDF1 and
Treg markers, including (C) Foxp3, (D) TGFB1 and (E) CCR8 were
analyzed using the GEPIA database. Correlation between YTHDF1 and T
cell exhaustion markers, namely (F) PDCD1, (G) CTLA4 and (H) HAVCR2
(T cell immunoglobulin and mucin-domain-containing-3) were analyzed
using the GEPIA database. YTHDF1, YTH N6-methyladenosine
RNA binding protein 1; CSF1, colony-stimulating factor 1; STAT,
signal transducer and activator of transcription; TPM, transcripts
per million; DC, dendritic cell; Foxp3, forkhead box P3; TGFB1,
transforming growth factor-β1; CCR8, C-C motif chemokine receptor;
PDCD1, programmed cell death 1; CTLA-4, T-lymphocyte-associated
protein 4; HAVCR2, hepatitis A virus cellular receptor 2; GEPIA,
Gene Expression Profiling Interactive Analysis. |
YTHDF1 interacts with p53
To assess the mechanism of YTHDF1 in GC, the
association between YTHDF1 and GC-related gene expression was first
evaluated. The results indicated a significant positive correlation
between YTHDF1 expression and p53 (R=0.38; P<0.0001; Fig. 6A), HER-2 (R=0.21;
P=6.7x10⁻⁸; Fig. 6B)
and KRAS (R=0.21; P=9.1x10⁻⁸; Fig. 6C), with p53 exhibiting the
strongest correlation with YTHDF1 expression. As p53 is a tumor
suppressor gene and mutant p53 acts as an oncogene (36), the differential expression of
YTHDF1 between GC with wild-type p53 and with mutant p53 was also
assessed. These results suggested that YTHDF1 was significantly
upregulated in GC with mutant p53 compared with GC with wild-type
p53 (Fig. 6D). Furthermore, immune
infiltration levels were significantly downregulated in GC with
mutant p53 compared with GC with wild-type p53 (Fig. 6E).
 | Figure 6Interactions between YTHDF1 and p53.
Correlation between YTHDF1 and the gastric-related genes (A) TP53,
(B) ERBB2 (HER-2) and (C) KRAS were analyzed using the Gene
Expression Profiling Interactive Analysis database. (D) YTHDF1
expression was elevated in TP53 mutant gastric cancer compared with
TP53 nonmutant gastric cancer, as analyzed using the University of
Alabama at Birmingham Cancer data analysis portal database. (E)
TP53 mutation was associated with decreased immune cell
infiltration levels in gastric cancer, as analyzed by the Tumor
Immune Estimation Resource database. (F) p53 interaction with
YTHDF1 was analyzed using the GeneMANIA database. (G) p53
interaction with YTHDF1 was analyzed using the HitPredict database.
(H) Interactions between YTHDF1 and p53 were assessed using
immunoprecipitation assays in 293T cells transfected with plasmids,
followed by co-immunoprecipitation assays using anti-Myc
antibodies. (I) Interactions between YTHDF1 and p53 were assessed
using immunoprecipitation assays in 293T cells transfected with
plasmids, followed by co-immunoprecipitation assays using anti-p53
antibodies. *P<0.05; **P<0.01;
***P<0.001. YTHDF1, YTH N6-methyladenosine
RNA binding protein 1; TP53, tumor protein p53; ERBB2, erb-b2
receptor tyrosine kinase 2; HER-2, human epidermal growth factor
receptor-2; KRAS, KRAS proto-oncogene; TPM, transcripts per
million; TCGA, The Cancer Genome Atlas; WT, wild type; STAD,
stomach adenocarcinoma. |
Subsequently, the protein-protein interactions of
YTHDF1 were evaluated. First, the GeneMANIA database was used to
determine the interaction between YTHDF1 and p53. The results
revealed interactions between YTHDF1 and p53, p21 and MDM2
(Fig. 6F). The HitPredict database
further confirmed the interaction between YTHDF1 and p53 with high
confidence, with an interaction score of 0.479 (Fig. 6G).
Furthermore, the transfection efficiency of plasmids
overexpressing p53 or YTHDF1 in 293T cells through RT-qPCR and WB
experiments (Fig. S1).
Subsequently, co-immunoprecipitation assays were performed to
confirm the interaction between YTHDF1 and p53. The results
revealed that Myc-YTHDF1 co-immunoprecipitated with p53 using an
anti-p53 antibody, and p53 co-immunoprecipitated with Myc-YTHDF1
using an anti-Myc antibody (Fig.
6H and I). These results
suggest that p53 is a potential target of YTHDF1.
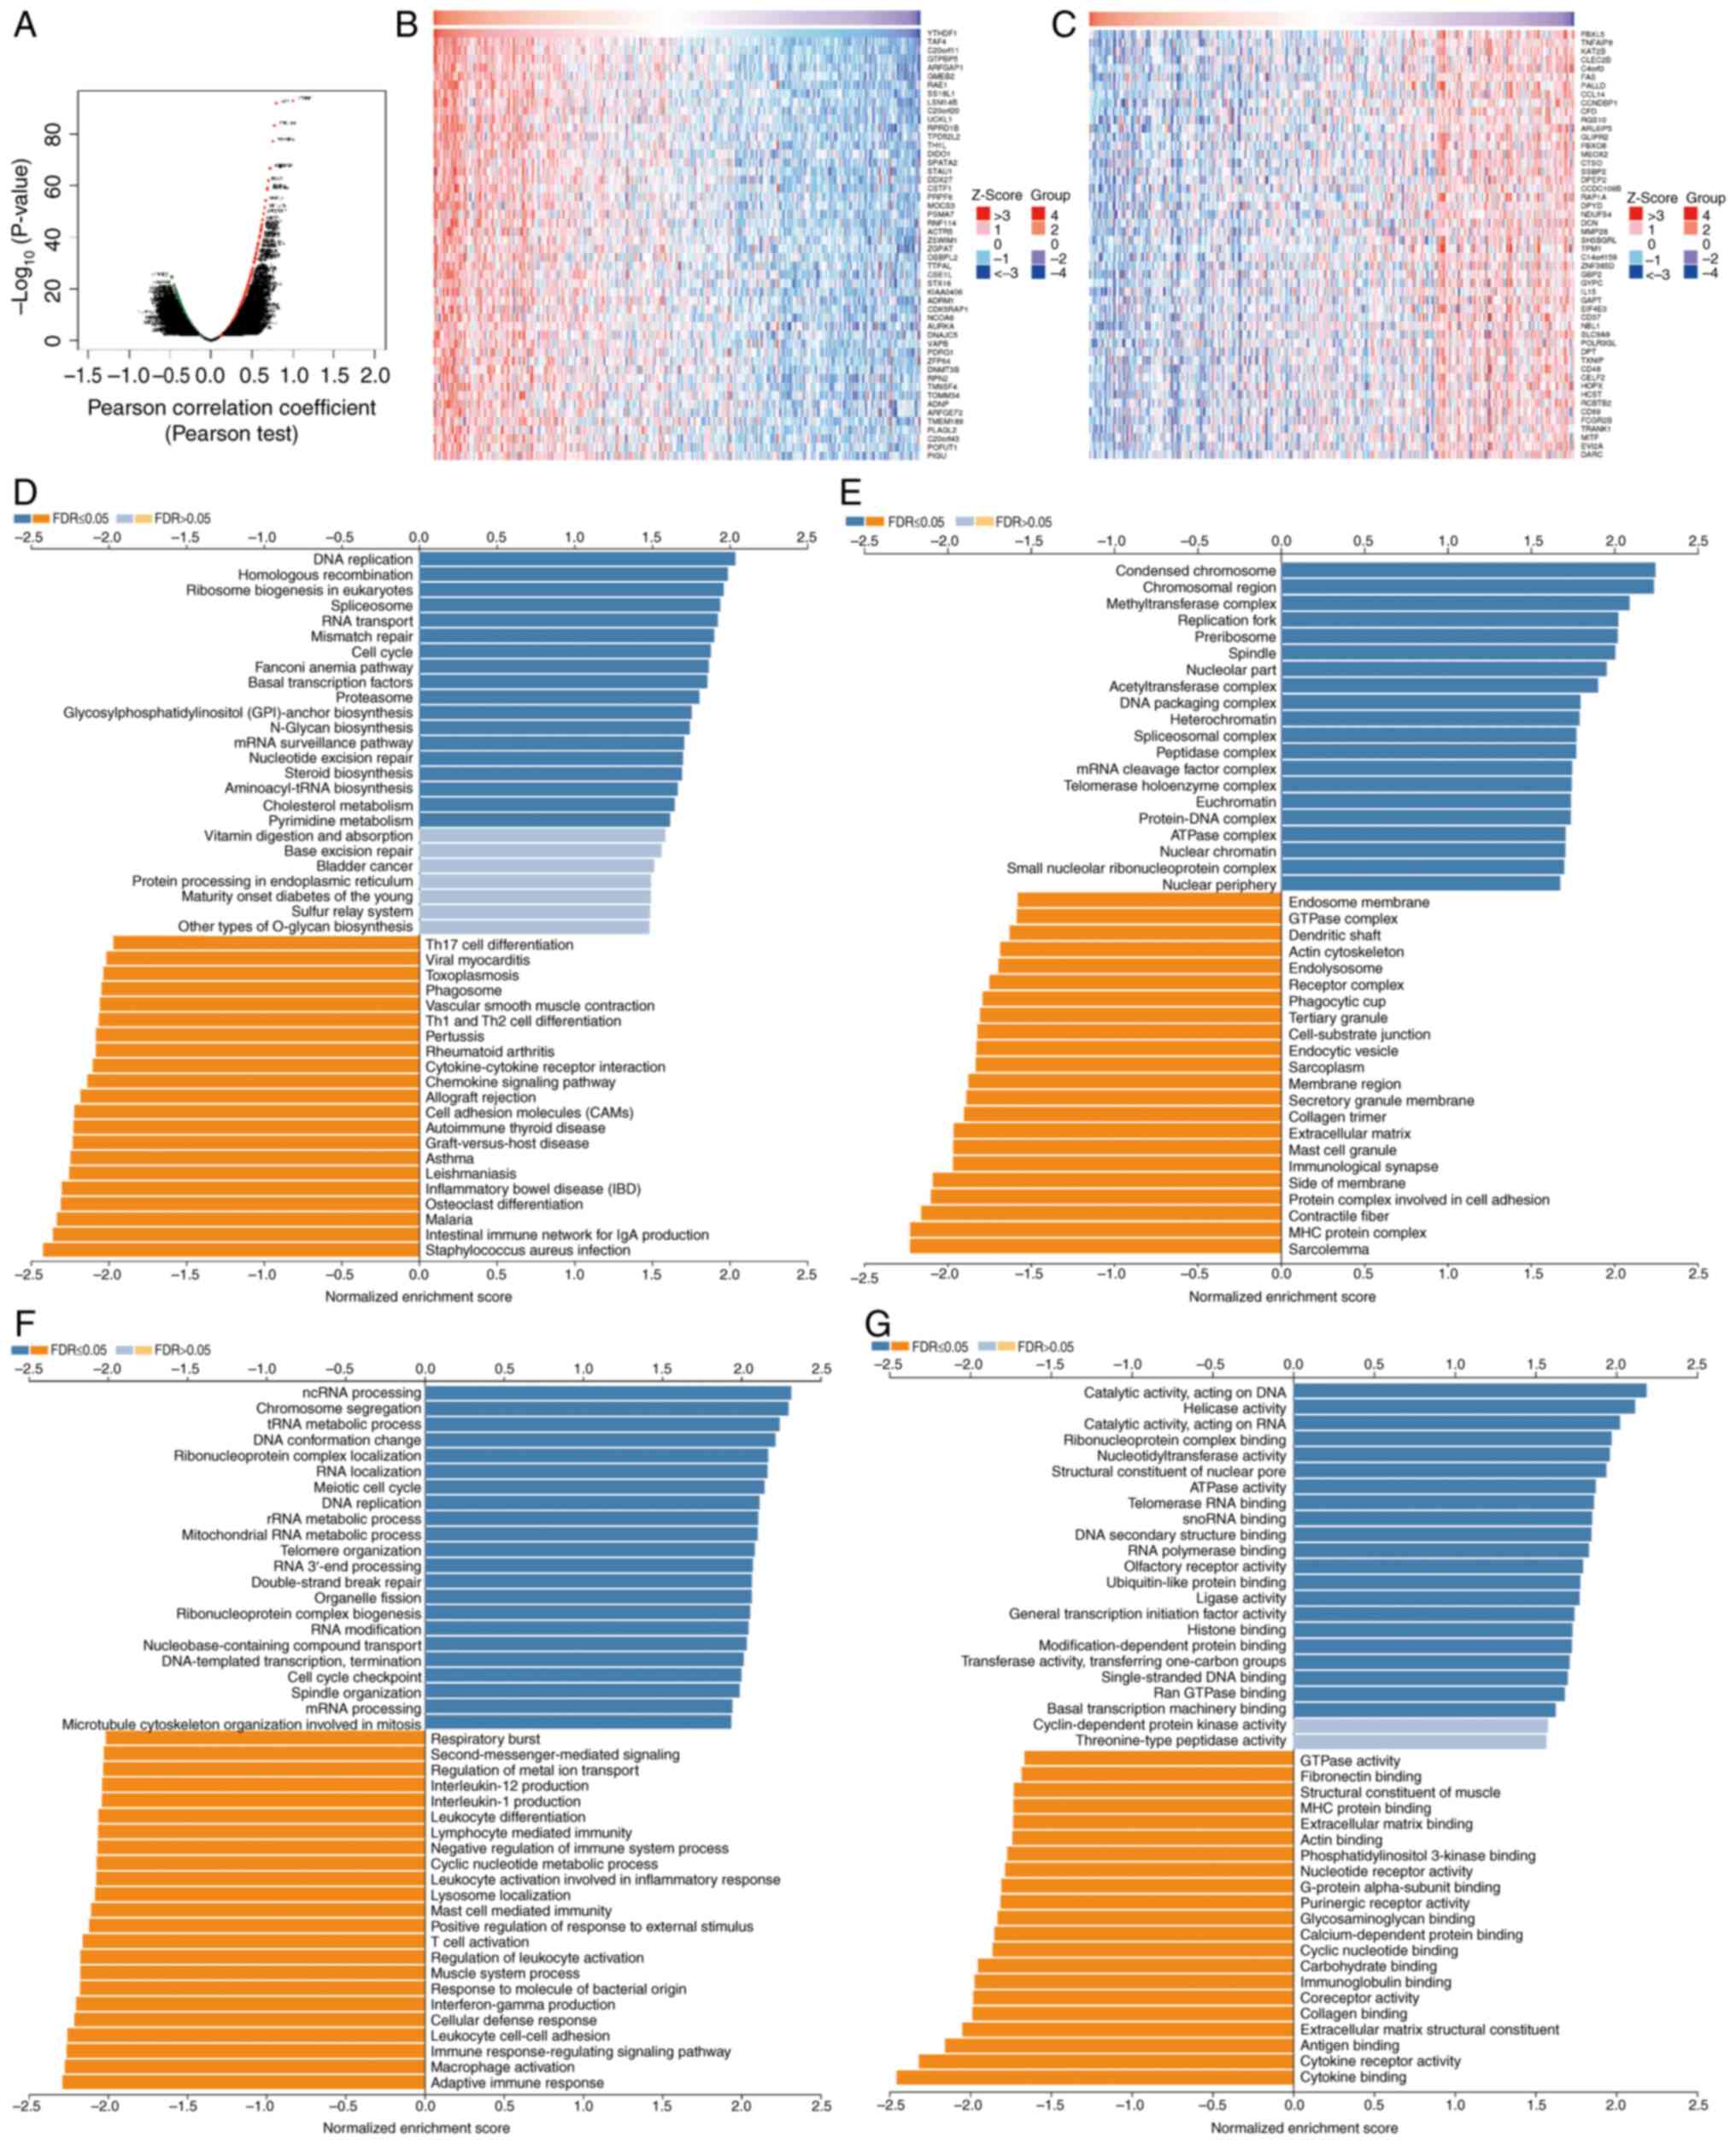
Enrichment analysis of YTHDF1
functional networks in GC
The LinkedOmics database was used to assess the
YTHDF1 mRNA sequence in GC. Genes that were positively and
negatively correlated with YTHDF1 are depicted in a volcano plot
(Fig. 7A). The top 50
significantly differentially expressed genes are presented in
Fig. 7B and C. Subsequently, KEGG and Gene Ontology
analyses were performed using these related genes. The KEGG
analysis suggested that YTHDF1 was associated with DNA replication,
RNA transport, mismatch repair and the cell cycle (Fig. 7D). Cellular component analysis
suggested that YTHDF1 was associated with condensed chromosomes,
methyltransferase complexes, replication forks, acetyltransferase
complexes, DNA packaging complexes, protein-DNA complexes and
ATPase complexes (Fig. 7E).
Biological process analysis revealed that YTHDF1 was associated
with non-coding (nc)RNA processing, mRNA processing, chromosome
segregation, transfer RNA metabolic processes, ribosomal RNA
metabolic processes, RNA localization, meiotic cell cycle, DNA
replication and cell cycle checkpoints (Fig. 7F). Molecular function analysis
demonstrated that YTHDF1 was associated with catalytic activity,
acting on DNA, catalytic activity, acting on RNA, helicase
activity, nucleotidyltransferase activity, ATPase activity,
ribonucleoprotein complex binding, telomerase RNA binding, RNA
polymerase binding, ubiquitin-like protein binding and histone
binding (Fig. 7G).
Discussion
The m6A reader YTHDF1 has been assessed in several
types of human tumors; however, the role of YTHDF1 in GC remains
unclear. In the present study, the expression of YTHDF1 in GC was
evaluated, and the results suggest that YTHDF1 is upregulated in
GC, demonstrating an association with tumor grade, microsatellite
status and molecular subtype. Furthermore, the association between
YTHDF1 and the immune microenvironment was assessed. The findings
revealed that the infiltration levels of many TIL subsets were
significantly lower in GC with high YTHDF1 expression than in GC
with low YTHDF1 expression. Conversely, the levels of markers
associated with T cell exhaustion were significantly higher.
Mechanistically, high YTHDF1 expression was strongly associated
with p53 mutations. Protein-protein interaction analysis revealed
an interaction between YTHDF1 and p53. Therefore, we hypothesize
that YTHDF1 regulates immune cell infiltration in GC through its
interaction with p53.
The avoidance of immune destruction is a hallmark of
cancer (37). Alteration of the
TME is an important mechanism through which tumors evade immunity
(38). Several studies have
reported an association between changes in immune cell infiltration
and tumor formation, progression, prognosis and overall immune
response. The upregulation of certain oncogenes or downregulation
of tumor suppressor genes may affect tumor occurrence and
development by altering the TME and immune cell infiltration
(17,39). Qi et al (40) reported that in an hepatocellular
carcinoma cohort with improved survival, immune cells were enriched
in both tumors and normal tissues. Moreover, the density of
PD-L1-expressing tumor cells was higher in this cohort, which may
benefit more from PD-1 treatment (40). In addition, anticancer treatments
can remodel the TIME. Zetrini et al (41) used the bioreactivity of novel
polymer-lipid manganese dioxide nanoparticles (PLMDs) to remodel
the TIME. The study reported that intravenous injection of PLMDs
suppressed the recruitment of Tregs and MDSCs, whilst radiation
alone enhanced these processes. Pretreatment with PLMDs followed by
radiation downregulated programmed death ligand 1 and promoted the
infiltration of antitumor CD8+ T cells and M1
macrophages into tumor sites (41). Furthermore, a recent bioinformatics
analysis constructed a risk model based on eight necrosis-related
long non-coding (lnc)RNAs [all eight lncRNAs were highly expressed
in patients with esophageal carcinoma (ESCA)], which divided
patients with ESCA into high- and low-risk groups based on their
scores. Analysis of the relationship between risk score and immune
cell infiltration revealed that the high-risk group had more
abundant neutrophils and Th2 cells, whereas the low-risk group had
more abundant macrophages and NK cells. Furthermore, most immune
checkpoints (TNFRSF18, BTNL2, CD276, CD40, CD86, CD44 and TNFSF18)
were more activated in the low-risk group (42). In the present study, a significant
reduction in immune cell infiltration was observed in the YTHDF1
expression group. YTHDF1 demonstrated a negative correlation with
antitumor CD8+ T cells, macrophages and NK cells, but a
positive correlation with immune suppressor markers related to TAM
and Treg markers. Collectively, these findings, along with prior
research, underscore the important role of the TME and immune cell
infiltration in tumors.
YTHDF1 has been confirmed to be an oncogene in
specific types of human tumors and is associated with a poor
prognosis. Liu et al (14)
reported that YTHDF1 is overexpressed in ovarian cancer, and
patients with high YTHDF1 expression experienced shorter survival.
Mechanistically, YTHDF1 enhances eukaryotic initiation factor 3C
(EIF3C) translation by binding to the m6A site of EIF3C mRNA,
thereby facilitating the tumorigenesis and metastasis of ovarian
cancer (14). Similarly, YTHDF1
enhances forkhead box protein M1 (FOXM1) translation by recognizing
and binding to the m6A-modified FOXM1 mRNA, which promotes breast
cancer metastasis and leads to shorter survival (43). Similar results have been observed
for GC. Pi et al (44)
suggested that YTHDF1 is highly expressed in GC and associated with
poor survival, and further showed that YTHDF1 hyperactivates the
Wnt/β-catenin pathway by enhancing the translation of frizzled 7, a
key Wnt signaling receptor, leading to stomach carcinogenesis
(44). Another study reported that
YTHDF1 enhances ubiquitin-specific protease 14 translation, thus
promoting GC carcinogenesis and metastasis (45). The present study demonstrated that
YTHDF1 is the m6A reader with the highest mutation frequency and is
highly expressed in GC tissues. Survival analysis suggested that
patients with high YTHDF1 expression had a poor prognosis. This is
consistent with previous studies and confirms the carcinogenic role
of YTHDF1 in GC. However, the precise role of YTHDF1 in GC remains
unclear.
Previous studies have demonstrated the association
of YTHDF1 with immune cell infiltration in different tumor types.
Liu et al (46) reported a
positive correlation between YTHDF1 and B cells and macrophages in
esophageal carcinomas. Tsuchiya et al (47) assessed the relationship between
YTHDF1 expression and four TIL subsets (PD-1+,
CD8+, Foxp3+ and CD45RO+) in
non-small cell lung cancer. Their findings suggested that the TIL
levels of the four lymphocyte subsets were strongly upregulated in
high YTHDF1- and YTHDF2-expressing tumors (47). Contrary to these results, the
present study demonstrated a negative association between YTHDF1
and CD8+ T cells, macrophages, neutrophils, central
memory CD4+ T cells, effector memory CD4+ T
cells and activated B cells. Immune cell infiltration was
significantly reduced in GC cells with high YTHDF1 expression.
Furthermore, YTHDF1 copy number alteration downregulated the
infiltration levels of immune cells. Han et al (48) reported an association between
YTHDF1 and DCs, demonstrating that YTHDF1 regulates durable
neoantigen-specific immunity in YTHDF1 wild type mice. In classical
DCs, deletion of YTHDF1 increases the cross-presentation of tumor
antigens. In addition, the loss of YTHDF1 enhances cross-priming of
CD8+ T cells (48).
Furthermore, in gastric cancers, YTHDF1 is associated with DCs. Bai
et al (49) reported that
YTHDF1-knockout in GC led to recruitment of mature DCs and enhanced
the infiltration of CD4+ and CD8+ T cells
(49). In the present study,
YTHDF1 expression demonstrated a negative correlation with the
number of DCs in GC. Levels of dendritic cell markers were
significantly lower in gastric cells with high YTHDF1 expression.
This finding is consistent with previous studies demonstrating the
immunosuppressive effect of YTHDF1 in GC.
Tregs, which are essential for maintaining T cell
tolerance to autoantigens and inhibiting T cell immunity to
tumor-associated antigens, are a population of T cells that
functionally inhibit immune responses by affecting the activity of
other cell types (50). Tregs
represent a population of
CD4+CD25+FOXP3+ T cells derived
from the thymus. High Treg infiltration is markedly associated with
unfavorable outcomes across several human cancer types (51-54).
The transcription factor FOXP3 is the most important marker of
Tregs and aids in their identification (55). The results from the present study
suggest a positive association between YTHDF1 and FOXP3 expression.
Furthermore, YTHDF1 was positively associated with other Treg
markers, such as transforming growth factor-β1 and C-C motif
chemokine receptor. These findings suggest that YTHDF1 may
contribute to poor prognosis in GC by upregulating Treg
infiltration.
T-cell exhaustion is a state of T-cell dysfunction,
characterized by continuous expression of inhibitory receptors and
leading to reduced cytokine secretion and effector function. These
inhibitory receptors include programmed cell death 1, cytotoxic
T-lymphocyte associated protein 4 (CTLA4), and hepatitis A virus
cellular receptor 2 (also known as T cell immunoglobulin and
mucin-domain-containing-3; TIM-3). Several studies have reported
that T-cell exhaustion is linked to poor prognosis and
immunotherapy response (56,57).
Therefore, reversing T-cell exhaustion has become an important
method in tumor immunotherapy (58). In the present study, a significant
increase in the expression of inhibitory receptors PD-1, CTLA4 and
TIM-3 was demonstrated in GC cells with high YTHDF1 expression,
indicating that YTHDF1 may promote the expression of these
inhibitory receptors. Therefore, targeting YTHDF1 may reverse the T
cell exhaustion status, which would provide a new target for
improving the response to immunotherapy in GC.
p53 is an important tumor suppressor and is closely
related to the immune microenvironment (39). Several studies have reported that
YTHDF1 expression is associated with p53 expression. Li et
al (18) reported that YTHDF1
and heterogeneous nuclear ribonucleoprotein A2/B1 inhibit the role
of p53 in suppressing carcinogenesis and melanoma development by
upregulating genes involved in the p53 signaling pathway. Zhao
et al (59) reported that
YTHDF1 increased the expression of Yin-Yang 1 and MDM2, two
negative p53 regulators, by increasing their transcription levels;
this led to the inhibition of p53 activity to regulate
arsenite-induced human keratinocyte transformation (59). Furthermore, in hepatocellular
carcinoma, YTHDF1 expression and the p53 signaling pathway were
correlated (15). In the present
study, a positive association was demonstrated between YTHDF1 and
p53 expression in GC. Furthermore, compared with p53 wild-type GC,
YTHDF1 expression was significantly increased, and the level of
immune cell infiltration was significantly reduced in p53 mutant
GC. Protein-protein interaction analysis confirmed the interaction
between YTHDF1 and p53. Previous studies have reported that genetic
alterations in m6A regulators, including METTL3/14, YTHDF1, YTHDF2,
FTO and ALKBH5, strongly correlate with p53 mutations (60,61).
Therefore, we hypothesize that YTHDF1 interacts with mutant p53 in
GC. Enrichment analysis revealed the association between YTHDF1
with DNA replication, RNA transport, mismatch repair, cell cycle
and ncRNA processing - all of which are also related to p53.
Activating p53 is an important strategy in tumor treatment
(62). Based on the results of the
present study, selecting appropriate p53 agonists by detecting the
expression status of YTHDF1 may enhance the antitumor effect of p53
agonists, and this may be a potential strategy for improving the
efficacy of gastric cancer immunotherapy. In addition, the present
study revealed a positive correlation between YTHDF1, KRAS and
HER-2. However, no previous studies have explored this association,
to the best of our knowledge. Both KRAS and HER-2 serve crucial
roles as therapeutic targets in the occurrence and development of
GC (63); however, further
investigation is required to determine whether YTHDF1, KRAS and
HER-2 are involved in the progression of GC.
Whilst this study exhibits promising potential, it
also presents certain limitations. Most of the results in the
present study are obtained from online database analyses, and
although they have been partially validated through small clinical
samples, further cellular and animal experiments should be
performed in the future to verify the findings. Additionally, in
terms of mechanisms of action, the present study identified that
YTHDF1 can bind to p53, yet the specific regulatory mechanisms
remain elusive. We hypothesize that there are several possible
mechanisms: YTHDF1 regulates the expression of downstream target
genes by binding to p53; YTHDF1 affects the activity of the p53
pathway by binding to p53, thereby interactively regulating
signaling pathways related to tumor immunity; YTHDF1 influences the
methylation level of p53 by binding to it; and upstream targets
affect the interaction between YTHDF1 and p53. Further in
vitro and in vivo experiments are required to validate
these regulatory mechanisms.
In conclusion, the present study confirmed that
YTHDF1 is associated with a poor prognosis. We hypothesize, for the
first time to the best of our knowledge, that YTHDF1 regulates
immune cell infiltration by interacting with p53 in GC, providing a
promising direction for future research.
Supplementary Material
Verification of transfection
efficiency for overexpression of p53 and YTHDF1 in 293T cells.
Reverse transcription-quantitative PCR and western blot analyses
assessed p53 expression levels in 293T cells transfected with an
empty vector or (A) pcDNA3.1-p53 and (B) pcDNA3.1-YTHDF1.
***P<0.001. YTHDF1, YTH N6-methyladenosine
RNA binding protein 1; PCR, Polymerase Chain Reaction.
Acknowledgements
Not applicable.
Funding
Funding: The present work was supported by the National Natural
Science Foundation of China (grant no. 82160459) and the Key
Laboratory of Jiangxi Province (grant no. 20202BCD42011).
Availability of data and materials
The data generated in the present study may be
requested from the corresponding author.
Authors' contributions
QL designed the study, performed the data analysis
and wrote the manuscript. JX conceived and designed the study, and
revised the manuscript. All authors have reviewed and approved the
final manuscript. QL and JX confirm the authenticity of all the raw
data.
Ethics approval and consent to
participate
The present study was approved by the Ethics
Committee of the First Affiliated Hospital of Nanchang University
[2023; approval no. CDYFYYLK(03-011)]. All patients provided signed
informed consent before sample collection.
Patient consent for publication
Not applicable.
Competing interests
The authors declare that they have no competing
interests.
References
|
1
|
Joshi SS and Badgwell BD: Current
treatment and recent progress in gastric cancer. CA Cancer J Clin.
71:264–279. 2021.PubMed/NCBI View Article : Google Scholar
|
|
2
|
Sung H, Ferlay J, Siegel RL, Laversanne M,
Soerjomataram I, Jemal A and Bray F: Global Cancer statistics 2020:
GLOBOCAN estimates of incidence and mortality worldwide for 36
cancers in 185 countries. CA Cancer J Clin. 71:209–249.
2021.PubMed/NCBI View Article : Google Scholar
|
|
3
|
Gong J, Chehrazi-Raffle A, Reddi S and
Salgia R: Development of PD-1 and PD-L1 inhibitors as a form of
cancer immunotherapy: A comprehensive review of registration trials
and future considerations. J Immunother Cancer. 6(8)2018.PubMed/NCBI View Article : Google Scholar
|
|
4
|
Desrosiers R, Friderici K and Rottman F:
Identification of methylated nucleosides in messenger RNA from
Novikoff hepatoma cells. Proc Natl Acad Sci USA. 71:3971–3975.
1974.PubMed/NCBI View Article : Google Scholar
|
|
5
|
Zaccara S, Ries RJ and Jaffrey SR:
Reading, writing and erasing mRNA methylation. Nat Rev Mol Cell
Biol. 20:608–624. 2019.PubMed/NCBI View Article : Google Scholar
|
|
6
|
Wang L, Hui H, Agrawal K, Kang Y, Li N,
Tang R, Yuan J and Rana TM: m6A RNA methyltransferases
METTL3/14 regulate immune responses to anti-PD-1 therapy. EMBO J.
39(e104514)2020.PubMed/NCBI View Article : Google Scholar
|
|
7
|
Huang H, Wang Y, Kandpal M, Zhao G,
Cardenas H, Ji Y, Chaparala A, Tanner EJ, Chen J, Davuluri RV and
Matei D: FTO-dependent N 6-methyladenosine modifications
inhibit ovarian cancer stem cell self-renewal by blocking cAMP
signaling. Cancer Res. 80:3200–3214. 2020.PubMed/NCBI View Article : Google Scholar
|
|
8
|
Tang B, Yang Y, Kang M, Wang Y, Wang Y, Bi
Y, He S and Shimamoto F: m6A demethylase ALKBH5 inhibits
pancreatic cancer tumorigenesis by decreasing WIF-1 RNA methylation
and mediating Wnt signaling. Mol Cancer. 19(3)2020.PubMed/NCBI View Article : Google Scholar
|
|
9
|
Xiao W, Adhikari S, Dahal U, Chen YS, Hao
YJ, Sun BF, Sun HY, Li A, Ping XL, Lai WY, et al: Nuclear
m6A reader YTHDC1 regulates mRNA splicing. Mol Cell.
61:507–519. 2016.PubMed/NCBI View Article : Google Scholar
|
|
10
|
Wojtas MN, Pandey RR, Mendel M, Homolka D,
Sachidanandam R and Pillai RS: Regulation of m6A
transcripts by the 3'→5' RNA helicase YTHDC2 is essential for a
successful meiotic program in the mammalian germline. Mol Cell.
68:374–387.e12. 2017.PubMed/NCBI View Article : Google Scholar
|
|
11
|
Zhang C, Huang S, Zhuang H, Ruan S, Zhou
Z, Huang K, Ji F, Ma Z, Hou B and He X: YTHDF2 promotes the liver
cancer stem cell phenotype and cancer metastasis by regulating OCT4
expression via m6A RNA methylation. Oncogene. 39:4507–4518.
2020.PubMed/NCBI View Article : Google Scholar
|
|
12
|
Chang G, Shi L, Ye Y, Shi H, Zeng L,
Tiwary S, Huse JT, Huo L, Ma L, Ma Y, et al: YTHDF3 induces the
translation of m6A-enriched gene transcripts to promote breast
cancer brain metastasis. Cancer Cell. 38:857–871.e7.
2020.PubMed/NCBI View Article : Google Scholar
|
|
13
|
Jia R, Chai P, Wang S, Sun B, Xu Y, Yang
Y, Ge S, Jia R, Yang YG and Fan X: m6A modification
suppresses ocular melanoma through modulating HINT2 mRNA
translation. Mol Cancer. 18(161)2019.PubMed/NCBI View Article : Google Scholar
|
|
14
|
Liu T, Wei Q, Jin J, Luo Q, Liu Y, Yang Y,
Cheng C, Li L, Pi J, Si Y, et al: The m6A reader YTHDF1 promotes
ovarian cancer progression via augmenting EIF3C translation.
Nucleic Acids Res. 48:3816–3831. 2020.PubMed/NCBI View Article : Google Scholar
|
|
15
|
Zhao X, Chen Y, Mao Q, Jiang X, Jiang W,
Chen J, Xu W, Zhong L and Sun X: Overexpression of YTHDF1 is
associated with poor prognosis in patients with hepatocellular
carcinoma. Cancer Biomark. 21:859–868. 2018.PubMed/NCBI View Article : Google Scholar
|
|
16
|
Hu Y, Pan Q, Wang M, Ai X, Yan Y, Tian Y,
Jing Y, Tang P and Jiang J: m6A RNA methylation
regulator YTHDF1 correlated with immune microenvironment predicts
clinical outcomes and therapeutic efficacy in breast cancer. Front
Med (Lausanne). 8(667543)2021.PubMed/NCBI View Article : Google Scholar
|
|
17
|
Wang Q, Zhang Q, Li Q and Zhang J and
Zhang J: Clinicopathological and immunological characterization of
RNA m6A methylation regulators in ovarian cancer. Mol
Genet Genomic Med. 9(e1547)2021.PubMed/NCBI View Article : Google Scholar
|
|
18
|
Li T, Gu M, Deng A and Qian C: Increased
expression of YTHDF1 and HNRNPA2B1 as potent biomarkers for
melanoma: A systematic analysis. Cancer Cell Int.
20(239)2020.PubMed/NCBI View Article : Google Scholar
|
|
19
|
Gao J, Aksoy BA, Dogrusoz U, Dresdner G,
Gross B, Sumer SO, Sun Y, Jacobsen A, Sinha R, Larsson E, et al:
Integrative analysis of complex cancer genomics and clinical
profiles using the cBioPortal. Sci Signal. 6(pl1)2013.PubMed/NCBI View Article : Google Scholar
|
|
20
|
Huang KK, Ramnarayanan K, Zhu F,
Srivastava S, Xu C, Tan ALK, Lee M, Tay S, Das K, Xing M, et al:
Genomic and epigenomic profiling of high-risk intestinal metaplasia
reveals molecular determinants of progression to gastric cancer.
Cancer Cell. 33:137–150.e5. 2018.PubMed/NCBI View Article : Google Scholar
|
|
21
|
Wang K, Yuen ST, Xu J, Lee SP, Yan HH, Shi
ST, Siu HC, Deng S, Chu KM, Law S, et al: Whole-genome sequencing
and comprehensive molecular profiling identify new driver mutations
in gastric cancer. Nat Genet. 46:573–582. 2014.PubMed/NCBI View Article : Google Scholar
|
|
22
|
Cancer Genome Atlas Research Network.
Comprehensive molecular characterization of gastric adenocarcinoma.
Nature. 513:202–209. 2014.PubMed/NCBI View Article : Google Scholar
|
|
23
|
Kakiuchi M, Nishizawa T, Ueda H, Gotoh K,
Tanaka A, Hayashi A, Yamamoto S, Tatsuno K, Katoh H, Watanabe Y, et
al: Recurrent gain-of-function mutations of RHOA in diffuse-type
gastric carcinoma. Nat Genet. 46:583–587. 2014.PubMed/NCBI View Article : Google Scholar
|
|
24
|
Wang K, Kan J, Yuen ST, Shi ST, Chu KM,
Law S, Chan TL, Kan Z, Chan AS, Tsui WY, et al: Exome sequencing
identifies frequent mutation of ARID1A in molecular subtypes of
gastric cancer. Nat Genet. 43:1219–1223. 2011.PubMed/NCBI View Article : Google Scholar
|
|
25
|
Li T, Fan J, Wang B, Traugh N, Chen Q, Liu
JS, Li B and Liu XS: TIMER: A web server for comprehensive analysis
of tumor-infiltrating immune cells. Cancer Res. 77:e108–e110.
2017.PubMed/NCBI View Article : Google Scholar
|
|
26
|
Chandrashekar DS, Bashel B, Balasubramanya
SAH, Creighton CJ, Ponce-Rodriguez I, Chakravarthi BVSK and
Varambally S: UALCAN: A portal for facilitating tumor subgroup gene
expression and survival analyses. Neoplasia. 19:649–658.
2017.PubMed/NCBI View Article : Google Scholar
|
|
27
|
Ru B, Wong CN, Tong Y, Zhong JY, Zhong
SSW, Wu WC, Chu KC, Wong CY, Lau CY, Chen I, et al: TISIDB: An
integrated repository portal for tumor-immune system interactions.
Bioinformatics. 35:4200–4202. 2019.PubMed/NCBI View Article : Google Scholar
|
|
28
|
Lánczky A and Győrffy B: Web-based
survival analysis tool tailored for medical research (KMplot):
Development and implementation. J Med Internet Res.
23(e27633)2021.PubMed/NCBI View
Article : Google Scholar
|
|
29
|
Tang Z, Li C, Kang B, Gao G, Li C and
Zhang Z: GEPIA: A web server for cancer and normal gene expression
profiling and interactive analyses. Nucleic Acids Res. 45:W98–W102.
2017.PubMed/NCBI View Article : Google Scholar
|
|
30
|
Warde-Farley D, Donaldson SL, Comes O,
Zuberi K, Badrawi R, Chao P, Franz M, Grouios C, Kazi F, Lopes CT,
et al: The GeneMANIA prediction server: Biological network
integration for gene prioritization and predicting gene function.
Nucleic Acids Res. 38:W214–W220. 2010.PubMed/NCBI View Article : Google Scholar
|
|
31
|
Patil A, Nakai K and Nakamura H:
HitPredict: A database of quality assessed protein-protein
interactions in nine species. Nucleic Acids Res. 39:D744–D749.
2011.PubMed/NCBI View Article : Google Scholar
|
|
32
|
Vasaikar SV, Straub P, Wang J and Zhang B:
LinkedOmics: Analyzing multi-omics data within and across 32 cancer
types. Nucleic Acids Res. 46:D956–D963. 2018.PubMed/NCBI View Article : Google Scholar
|
|
33
|
Ye J, Coulouris G, Zaretskaya I,
Cutcutache I, Rozen S and Madden TL: Primer-BLAST: A tool to design
target-specific primers for polymerase chain reaction. BMC
Bioinformatics. 13(134)2012.PubMed/NCBI View Article : Google Scholar
|
|
34
|
Livak KJ and Schmittgen TD: Analysis of
relative gene expression data using real-time quantitative PCR and
the 2(-Delta Delta C(T)) method. Methods. 25:402–408.
2001.PubMed/NCBI View Article : Google Scholar
|
|
35
|
Li K, Zhang A, Li X, Zhang H and Zhao L:
Advances in clinical immunotherapy for gastric cancer. Biochim
Biophys Acta Rev Cancer. 1876(188615)2021.PubMed/NCBI View Article : Google Scholar
|
|
36
|
Zhang C, Liu J, Xu D, Zhang T, Hu W and
Feng Z: Gain-of-function mutant p53 in cancer progression and
therapy. J Mol Cell Biol. 12:674–687. 2020.PubMed/NCBI View Article : Google Scholar
|
|
37
|
Hanahan D: Hallmarks of cancer: New
dimensions. Cancer Discov. 12:31–46. 2022.PubMed/NCBI View Article : Google Scholar
|
|
38
|
Pitt JM, Marabelle A, Eggermont A, Soria
JC, Kroemer G and Zitvogel L: Targeting the tumor microenvironment:
Removing obstruction to anticancer immune responses and
immunotherapy. Ann Oncol. 72:1482–1492. 2016.PubMed/NCBI View Article : Google Scholar
|
|
39
|
Cui Y and Guo G: Immunomodulatory function
of the tumor suppressor p53 in host immune response and the tumor
microenvironment. Int J Mol Sci. 17(1942)2016.PubMed/NCBI View Article : Google Scholar
|
|
40
|
Qi F, Li J, Qi Z, Zhang J, Zhou B, Yang B,
Qin W, Cui W and Xia J: Comprehensive metabolic profiling and
genome-wide analysis reveal therapeutic modalities for
hepatocellular carcinoma. Research (Wash D C).
6(0036)2023.PubMed/NCBI View Article : Google Scholar
|
|
41
|
Zetrini AE, Lip H, Abbasi AZ, Alradwan I,
Ahmed T, He C, Henderson JT, Ranth AM and Wu X: Remodeling tumor
immune microenvironment by using polymer-lipid-manganese dioxide
nanoparticles with radiation therapy to boost immune response of
castration-resistant prostate cancer. Research (Wash D C).
6(0247)2023.PubMed/NCBI View Article : Google Scholar
|
|
42
|
Duan X, Du H, Yuan M, Liu L, Liu R and Shi
J: Bioinformatics analysis of necroptosis-related lncRNAs and
immune infiltration, and prediction of the prognosis of patients
with esophageal carcinoma. Exp Ther Med. 26(331)2023.PubMed/NCBI View Article : Google Scholar
|
|
43
|
Chen H, Yu Y, Yang M, Huang H, Ma S, Hu J,
Xi Z, Guo H, Yao G, Yang L, et al: YTHDF1 promotes breast cancer
progression by facilitating FOXM1 translation in an m6A-dependent
manner. Cell Biosci. 12(19)2022.PubMed/NCBI View Article : Google Scholar
|
|
44
|
Pi J, Wang W, Ji M, Wang X, Wei X, Jin J,
Liu T, Qiang J, Qi Z, Li F, et al: YTHDF1 Promotes Gastric
Carcinogenesis by Controlling Translation of FZD7. Cancer
Res. 81:2651–2665. 2021.PubMed/NCBI View Article : Google Scholar
|
|
45
|
Chen XY, Liang R, Yi YC, Fan HN, Chen M,
Zhang J and Zhu JS: The m6A reader YTHDF1 facilitates
the tumorigenesis and metastasis of gastric cancer via USP14
translation in an m6A-dependent manner. Front Cell Dev
Biol. 9(647702)2021.PubMed/NCBI View Article : Google Scholar
|
|
46
|
Liu XS, Kui XY, Gao Y, Chen XQ, Zeng J,
Liu XY, Zhang Y, Zhang YH and Pei ZJ: Comprehensive analysis of
YTHDF1 immune infiltrates and ceRNA in human esophageal carcinoma.
Front Genet. 13(835265)2022.PubMed/NCBI View Article : Google Scholar
|
|
47
|
Tsuchiya K, Yoshimura K, Inoue Y, Iwashita
Y, Yamada H, Kawase A, Watanabe T, Tanahashi M, Ogawa H, Funai K,
et al: YTHDF1 and YTHDF2 are associated with better patient
survival and an inflamed tumor-immune microenvironment in
non-small-cell lung cancer. OncoImmunology.
10(1962656)2021.PubMed/NCBI View Article : Google Scholar
|
|
48
|
Han D, Liu J, Chen C, Dong L, Liu Y, Chang
R, Huang X, Liu Y, Wang J, Dougherty U, et al: Anti-tumour immunity
controlled through mRNA m6A methylation and YTHDF1 in
dendritic cells. Nature. 566:270–274. 2019.PubMed/NCBI View Article : Google Scholar
|
|
49
|
Bai X, Wong CC, Pan Y, Chen H, Liu W, Zhai
J, Kang W, Shi Y, Yamamoto M, Tsukamoto T, et al: Loss of YTHDF1 in
gastric tumors restores sensitivity to antitumor immunity by
recruiting mature dendritic cells. J Immunother Cancer.
10(e003663)2022.PubMed/NCBI View Article : Google Scholar
|
|
50
|
Shevach EM: Fatal attraction: Tumors
beckon regulatory T cells. Nat Med. 10:900–901. 2004.PubMed/NCBI View Article : Google Scholar
|
|
51
|
Petersen RP, Campa MJ, Sperlazza J, Conlon
D, Joshi MB, Harpole DH Jr and Patz EF Jr: Tumor infiltrating
Foxp3+ regulatory T-cells are associated with recurrence in
pathologic stage I NSCLC patients. Cancer. 107:2866–2872.
2006.PubMed/NCBI View Article : Google Scholar
|
|
52
|
Bates GJ, Fox SB, Han C, Leek RD, Garcia
JF, Harris AL and Banham AH: Quantification of regulatory T cells
enables the identification of high-risk breast cancer patients and
those at risk of late relapse. J Clin Oncol. 24:5373–5380.
2006.PubMed/NCBI View Article : Google Scholar
|
|
53
|
Gao Q, Qiu SJ, Fan J, Zhou J, Wang XY,
Xiao YS, Xu Y, Li YW and Tang ZY: Intratumoral balance of
regulatory and cytotoxic T cells is associated with prognosis of
hepatocellular carcinoma after resection. J Clin Oncol.
25:2586–2593. 2007.PubMed/NCBI View Article : Google Scholar
|
|
54
|
Perrone G, Ruffini PA, Catalano V, Spino
C, Santini D, Muretto P, Spoto C, Zingaretti C, Sisti V,
Alessandroni P, et al: Intratumoural FOXP3-positive regulatory T
cells are associated with adverse prognosis in radically resected
gastric cancer. Eur J Cancer. 44:1875–1882. 2008.PubMed/NCBI View Article : Google Scholar
|
|
55
|
Georgiev P, Charbonnier LM and Chatila TA:
Regulatory T cells: The many faces of Foxp3. J Clin Immunol.
39:623–640. 2019.PubMed/NCBI View Article : Google Scholar
|
|
56
|
Terranova-Barberio M, Pawlowska N, Dhawan
M, Moasser M, Chien AJ, Melisko ME, Rugo H, Rahimi R, Deal T, Daud
A, et al: Exhausted T cell signature predicts immunotherapy
response in ER-positive breast cancer. Nat Commun.
11(3584)2020.PubMed/NCBI View Article : Google Scholar
|
|
57
|
Jin K, Cao Y, Gu Y, Fang H, Fei Y, Wang J,
Liu X, Lv K, He X, Lin C, et al: Poor clinical outcomes and
immunoevasive contexture in CXCL13+CD8+ T cells enriched gastric
cancer patients. Oncoimmunology. 10(1915560)2021.PubMed/NCBI View Article : Google Scholar
|
|
58
|
Zarour HM: Reversing T-cell dysfunction
and exhaustion in cancer. Clin Cancer Res. 22:1856–1864.
2016.PubMed/NCBI View Article : Google Scholar
|
|
59
|
Zhao T, Sun D, Zhao M, Lai Y, Liu Y and
Zhang Z: N6-methyladenosine mediates arsenite-induced
human keratinocyte transformation by suppressing p53 activation.
Environ Pollut. 259(113908)2020.PubMed/NCBI View Article : Google Scholar
|
|
60
|
Kwok CT, Marshall AD, Rasko JE and Wong
JJ: Genetic alterations of m6A regulators predict poorer
survival in acute myeloid leukemia. J Hematol Oncol.
10(39)2017.PubMed/NCBI View Article : Google Scholar
|
|
61
|
Xu A, Liu M, Huang MF, Zhang Y, Hu R,
Gingold JA, Liu Y, Zhu D, Chien CS, Wang WC, et al: Rewired
m6A epitranscriptomic networks link mutant p53 to
neoplastic transformation. Nat Commun. 14(1694)2023.PubMed/NCBI View Article : Google Scholar
|
|
62
|
Hassin O and Oren M: Drugging p53 in
cancer: One protein, many targets. Nat Rev Drug Discov. 22:127–144.
2023.PubMed/NCBI View Article : Google Scholar
|
|
63
|
Zeng Y and Jin RU: Molecular pathogenesis,
targeted therapies, and future perspectives for gastric cancer.
Semin Cancer Biol. 86:566–582. 2022.PubMed/NCBI View Article : Google Scholar
|