Introduction
Gastric cancer (GC) is a common primary tumor of the
digestive system. In 2020, >1 million new cases of GC were
reported worldwide and it accounted for 769,000 deaths, rendering
it the fifth most common cancer and the fourth leading cause of
cancer-associated death globally (1). Incidence and mortality of GC have
increased with changes in living habits and environmental factors
(2). Numerous studies have shown
that the development of GC is associated with Helicobacter
pylori infection (2), dietary
habits (3), genetic factors
(4), and the local and regional
environment (5), and these factors
are associated with each other. The human gastrointestinal
microecosystem is one of the most complex microecosystems in the
body, and the relative dynamic balance is closely related to health
status. When body functions are disturbed by certain factors such
as ulcerative colitis, the dynamic balance of microbiota in the
body is disrupted, which can lead to the formation of
gastrointestinal microecosystem dysfunction between the host and
the flora (6). In addition, tumor
progression may occur due to the presence of bacteria that have not
yet been detected, whereas the gut microbial community may also
shape the microbiota for tumor survival such as induce DNA damage,
enhance inflammatory response, and affect the tumor
microenvironment to promote tumor growth (7). Therefore, investigation of the
association between the changes in intestinal flora and the
development of GC is important for the early detection, clinical
symptomatic treatment and improvement of survival of patients with
GC.
Randomized controlled trials (RCTs) are the gold
standard for inferring causality in epidemiology; however, given
the ethical constraints and moral limitations such as inappropriate
use of placebos, there are difficulties in implementing RCTs
(8). Mendelian randomization (MR)
studies comprise a statistical method that has been primarily
applied to infer causality in epidemiological diseases such as
Coronavirus Disease 2019(9).
Different genotypes represent different intermediate phenotypes;
when the phenotype represents an exposure characteristic such as
intestinal flora, the association effect between a genotype and a
disease can represent the influence of exposure factors on the
disease. Since alleles follow the principle of random distribution,
traditional epidemiology does not consider confounding and reverse
causality (10). With the public
release of large-scale gene-wide association data, a large number
of reliable genetic variants are available for MR studies (11). Therefore, the present study
analyzed the causal association between gut flora and GC to aid the
development of novel strategies for the clinical intervention of
GC.
Materials and methods
Study population
The present study performed two-sample MR to
investigate the causal association between the gut microbiome
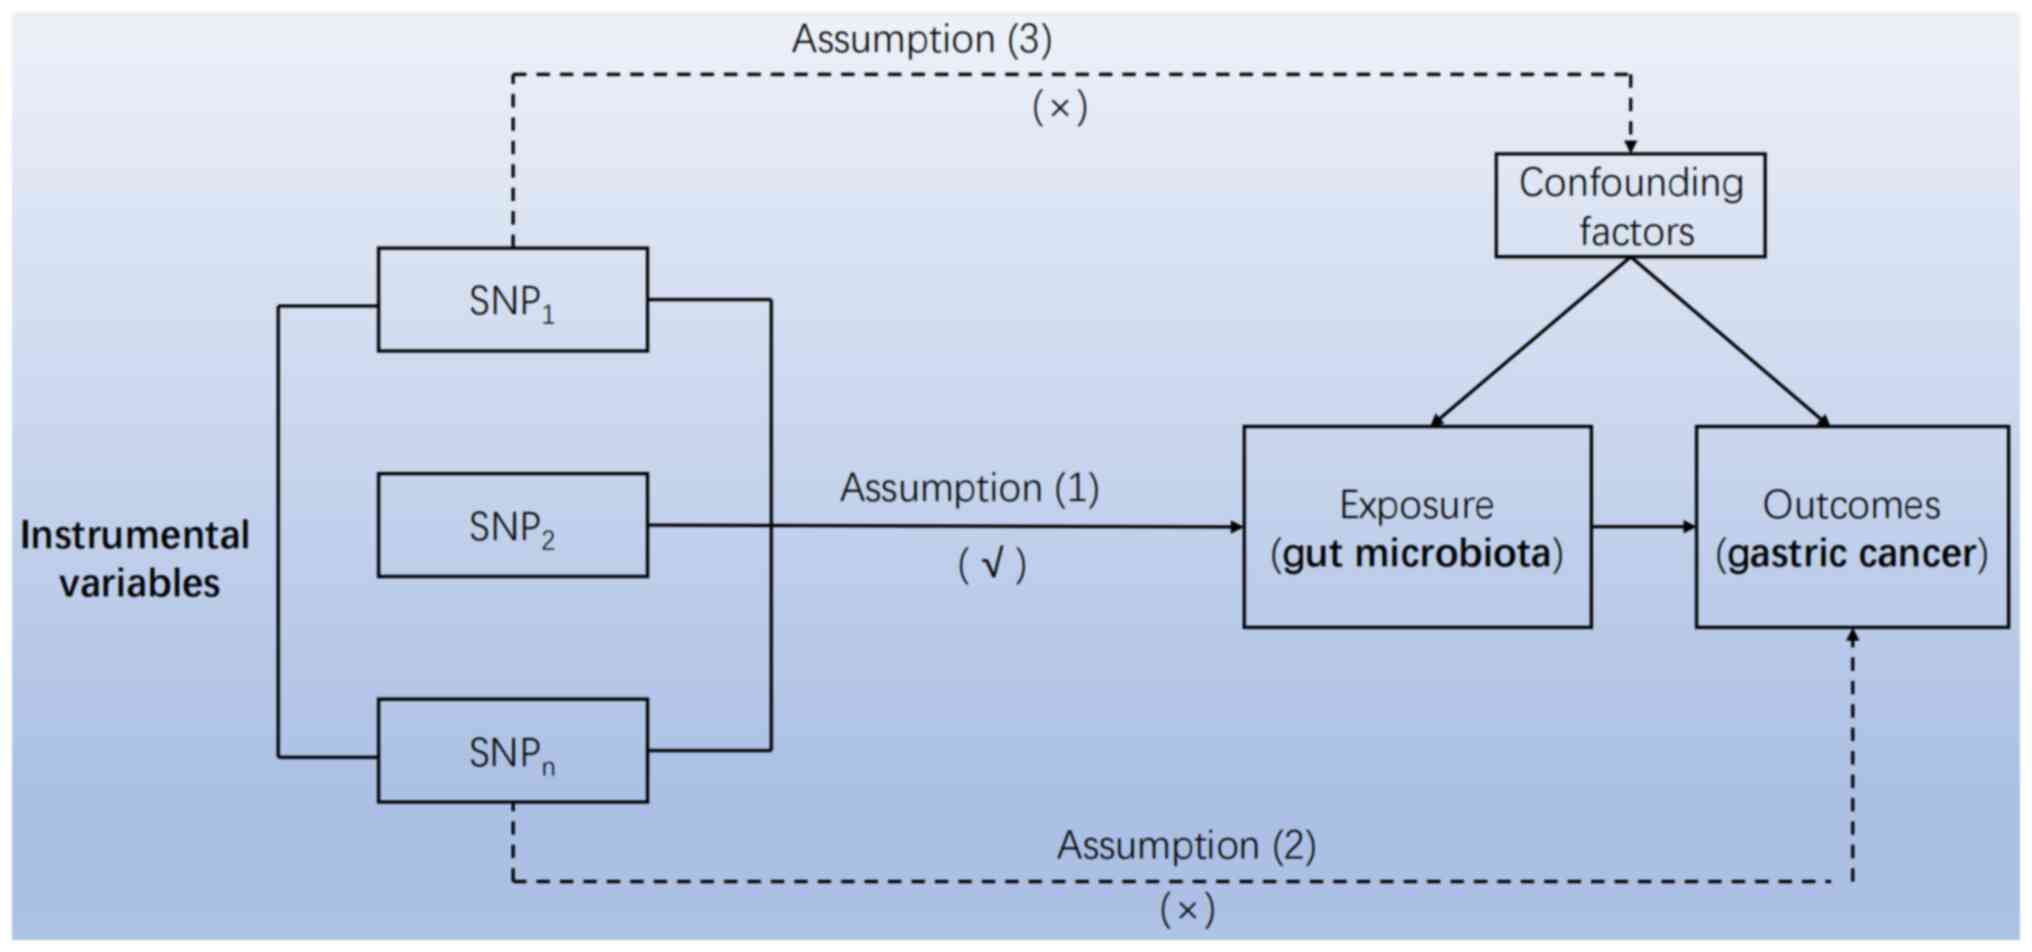
(fnngen.f/en) and GC (nealelab.is/uk-biobank). Mendelian randomization
studies require three core assumptions: i) Extracted instrumental
variable single nucleotide polymorphism (SNP) must be closely
related to exposure; ii) The instrumental variable SNP should not
be associated with any confounding factors [Exposure(gut
microbiota) and Outcomes(gastric cancer)] of the expose-outcome
relationship; iii) Instrumental variable SNP can only affect
results through exposure (Fig. 1).
Quality control, such as heterogeneity and genetic pleiotropy
tests, were performed to verify the reliability of causal
results.
The main exposure factor in the present study was
the gut microbiome human genetics. The study of the gut microbiome
was based on an international consortium MiBioGen (fnngen.f/en). In
the present study, the human gut microbiome genome-wide association
study (GWAS) data involved 18,340 individuals from 24
population-based cohorts.
The primary endpoint was GC and the GWAS dataset
related to GC was derived from the UK Biobank Project (nealelab.is/uk-biobank). The UK Biobank project
collected genetic and phenotypic data from ~500,000 participants
across the UK. Genome-wide genotype data for all participants were
collected from health and medical records to provide follow-up
information.
Single nucleotide polymorphism (SNP)
selection
A total of 196 SNPs that were significantly
associated with the relative abundance of the gut microbiota were
selected as available instrumental variables) IVs. The selection of
IVs was based on the results of IVW, MR-Egger and WME methods,
which considered P<1x10⁻⁵ to be significant. The
standard of linkage disequilibrium was set as
r2<0.001 and genetic distance was 10,000 kb. Highly
correlated(P<0.05) SNPs were excluded to ensure their
independence. Finally, SNPs associated with the relative abundance
of intestinal flora were projected into data of GC and the
corresponding SNPs were extracted. Based on statistical parameters
with the same loci in the relative abundance of gut microbes and
GWAS results for GC, the data were coordinated so that the exposure
and outcome effect values corresponded to the same effect alleles
(harmonization).
Statistical analysis
Inverse-variance weighted (IVW), MR-Egger and
weighted median (WME) methods were used to estimate the causal
association between the gut microbiome and GC. P-value<0.05 used
to indicate statistical significance. The IVW method assumes that
all genetic variants are valid IVs and the ratio method is used to
calculate the causal effect value of the individual IVs. Each
estimate is aggregated in weighted linear regression to obtain the
total effect value (12). The
primary difference between the MR-Egger and IVW methods is that
MR-Egger considers the existence of intercept terms (13). The WME method uses the intermediate
effects of all available genetic variants and is obtained by
weighting the inverse variance of each SNP associated with the
result (14). The IVW method has
higher test efficiency than the other MR methods. The preferred
causal effect estimation method was the IVW method. β-values
obtained from the results were converted to odds ratios (ORs) when
calculating 95% confidence intervals (CI). The strength of IVs was
assessed using the F-statistic. The following formula was used:
F=R2(n-K-1)/k(1-R2), where R2 represents the variance explained by
IV (for each gut microbiome), n is the sample size and K represents
the number of tool variables. R2 was estimated using the minor
allele frequency (MAF) and the B-value (effect size of SNPs on
exposure factors) was calculated using the following formula: R2=2
x MAF x (1-MAF) x B2.
To assess the stability and reliability of the
results, quality control included sensitivity analysis,
heterogeneity and gene diversity tests. The leave-one-out method
was used for sensitivity analysis and the combined effect value of
remaining SNPs was calculated sequentially by deleting individual
SNPs(9). SNP heterogeneity was
determined by Cochran Q test. The horizontal gene pleiotropy test
assessed whether IVs affected the outcome by means other than
exposure using the intercept term of the MR-Egger regression and
Mendelian Randomization Pleiotropy RESidual Sum and Outlier
(MRPRESSO) (15). Finally, reverse
MR was used to analyze whether a reverse causality was present
between GC and significant gut microbiota. MR analysis and quality
control were analyzed using R version 4.0.3 (r-project.org) and TwoSample MR Software package
version 0.5.6 (github.com/MRCIEU/TwoSampleMR), respectively.
Results
Two-sample MR analysis
The results of the 196 intestinal flora studied in
relation to GC are presented in Table SI. The F-statistics of the
intestinal flora ranged from 18.667 to 32.374 and all met the
threshold of >10, suggesting that they were unlikely to be
affected by weak instrumental bias (Table SI).
Gut microbiota and GC
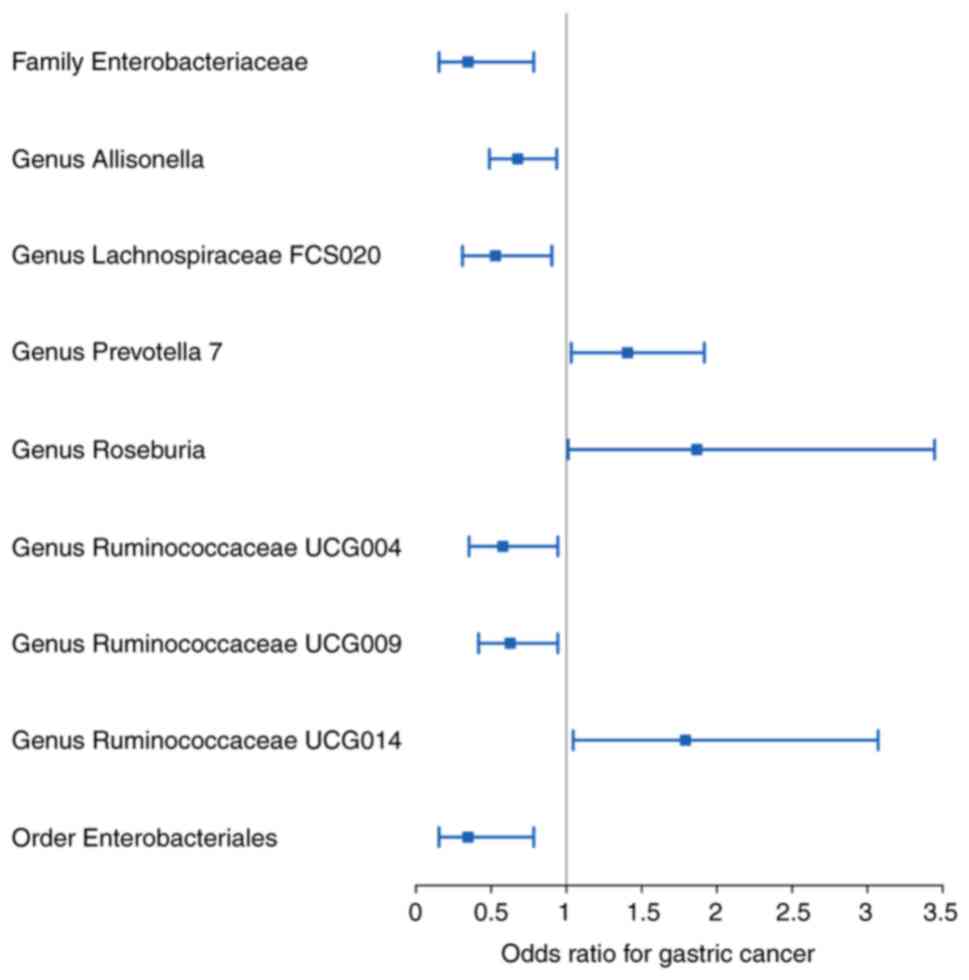
Overall, nine bacterial genera were associated with
the risk of developing GC in the primary MR analysis, suggesting
that bacterial genera may have an impact on GC (Fig. 2; Table
I). Elevated abundances of the genera Prevotella 7,
Roseburia and Ruminococcaceae UCG014 were positively
associated with an increased risk of developing GC (OR: 1.406, 95%
CI: 1.032-1.917, P=0.031 for Prevotella 7; OR:1.867, 95%
CI=1.011-3.446, P=0.046 for Roseburia; and OR:1.791, 95%
CI=1.045-3.071, P=0.034 for Ruminococcaceae UCG014) whereas
the family Enterobacteriaceae, the genera
Allisonella, Lachnospiraceae FCS020,
Ruminococcaceae UCG004 and Ruminococcaceae UCG009,
and the order Enterobacteriales were increased in abundance with
decreasing GC incidence (OR: 0.346, 95% CI: 0.153-0.783, P=0.011
for Enterobacteriaceae; OR: 0.676, 95% CI=0.488-0.936,
P=0.019 for Allisonella; OR: 0.528, 95% CI=0.309-0.903,
P=0.020 for Lachnospiraceae FCS020; OR: 0.577, 95%
CI=0.353-0.943, P=0.028 for Ruminococcaceae UCG004; OR:
0.626, 95% CI=0.416-0.943, P=0.025 for Ruminococcaceae
UCG009; and OR: 0.346, 95% CI=0.153-0.783, P=0.011 for
Enterobacteriales)(Table I).
 | Table IEffect estimates of the associations
between 196 bacterial traits and the risk of gastric cancer in MR
analysis. |
Table I
Effect estimates of the associations
between 196 bacterial traits and the risk of gastric cancer in MR
analysis.
| A, Family
Enterobacteriaceae (7 SNPs) |
|---|
| Method | OR | 95% CI | P-value |
|---|
| MR-Egger | 2.314 | 0.015-368.544 | 0.759 |
| Weighted
median | 0.249 | 0.084-0.739 | 0.012 |
| Inverse-variance
weighted | 0.346 | 0.153-0.783 | 0.011 |
| Simple mode | 0.245 | 0.064-0.939 | 0.086 |
| Weighted mode | 0.250 | 0.061-1.015 | 0.101 |
| B, Genus
Allisonella (8 SNPs) |
| Method | OR | 95% CI | P-value |
| MR-Egger | 0.341 | 0.037-3.113 | 0.377 |
| Weighted
median | 0.703 | 0.461-1.070 | 0.100 |
| Inverse-variance
weighted | 0.676 | 0.488-0.936 | 0.019 |
| Simple mode | 0.712 | 0.387-1.309 | 0.310 |
| Weighted mode | 0.697 | 0.358-1.355 | 0.323 |
| C, Genus
Lachnospiraceae FCS020 (12 SNPs) |
| Method | OR | 95% CI | P-value |
| MR-Egger | 0.291 | 0.070-1.208 | 0.120 |
| Weighted
median | 0.456 | 0.224-0.928 | 0.030 |
| Inverse-variance
weighted | 0.528 | 0.309-0.903 | 0.020 |
| Simple mode | 0.456 | 0.142-1.466 | 0.214 |
| Weighted mode | 0.430 | 0.140-1.325 | 0.170 |
| D, Genus
Prevotella 7 (11 SNPs) |
| Method | OR | 95% CI | P-value |
| MR-Egger | 2.009 | 0.335-12.032 | 0.464 |
| Weighted
median | 1.275 | 0.844-1.926 | 0.249 |
| Inverse-variance
weighted | 1.406 | 1.032-1.917 | 0.031 |
| Simple mode | 1.313 | 0.652-2.642 | 0.463 |
| Weighted mode | 1.343 | 0.692-2.606 | 0.404 |
| E, Genus
Roseburia (13 SNPs) |
| Method | OR | 95% CI | P-value |
| MR-Egger | 2.809 | 0.444-17.781 | 0.296 |
| Weighted
median | 2.363 | 1.025-5.450 | 0.044 |
| Inverse-variance
weighted | 1.867 | 1.011-3.446 | 0.046 |
| Simple mode | 3.275 | 0.795-13.495 | 0.126 |
| Weighted mode | 3.349 | 0.717-15.633 | 0.150 |
| F, Genus
Ruminococcaceae UCG004 (11 SNPs) |
| Method | OR | 95% CI | P-value |
| MR-Egger | 1.057 | 0.066-17.006 | 0.970 |
| Weighted
median | 0.688 | 0.348-1.363 | 0.284 |
| Inverse-variance
weighted | 0.577 | 0.353-0.943 | 0.028 |
| Simple mode | 0.803 | 0.257-2.504 | 0.713 |
| Weighted mode | 0.861 | 0.258-2.869 | 0.812 |
| G, Genus
Ruminococcaceae UCG009 (12 SNPs) |
| Method | OR | 95% CI | P-value |
| MR-Egger | 0.859 | 0.167-4.405 | 0.859 |
| Weighted
median | 0.668 | 0.379-1.179 | 0.164 |
| Inverse-variance
weighted | 0.626 | 0.416-0.943 | 0.025 |
| Simple mode | 0.730 | 0.304-1.753 | 0.496 |
| Weighted mode | 0.720 | 0.315-1.649 | 0.454 |
| H, Genus
Ruminococcaceae UCG014 (11 SNPs) |
| Method | OR | 95% CI | P-value |
| MR-Egger | 2.112 | 0.591-7.551 | 0.280 |
| Weighted
median | 1.654 | 0.800-3.422 | 0.175 |
| Inverse-variance
weighted | 1.791 | 1.045-3.071 | 0.034 |
| Simple mode | 1.484 | 0.484-4.549 | 0.505 |
| Weighted mode | 1.674 | 0.710-3.942 | 0.266 |
| I, Order
Enterobacteriales (7 SNPs) |
| Method | OR | 95% CI | P-value |
| MR-Egger | 2.314 | 0.015-368.544 | 0.759 |
| Weighted
median | 0.249 | 0.092-0.676 | 0.006 |
| Inverse-variance
weighted | 0.346 | 0.153-0.783 | 0.011 |
| Simple mode | 0.245 | 0.063-0.958 | 0.090 |
| Weighted mode | 0.250 | 0.068-0.917 | 0.082 |
The WME method indicated similar results as the IVW
method (OR: 0.249, 95% CI=0.084-0.739, P=0.012 for
Enterobacteriaceae; OR: 0.703, 95% CI=0.461-1.070, P=0.100
for Allisonella; OR: 0.456, 95% CI=0.224-0.928, P=0.030 for
Lachnospiraceae FCS020; OR: 1.275, 95% CI=0.844-1.926,
P=0.249 for Prevotella 7; OR: 2.363, 95% CI=1.025-5.450,
P=0.044 for Roseburia; OR: 0.688, 95% CI=0.348-1.363,
P=0.284 for Ruminococcaceae UCG004; OR: 0.668, 95%
CI=0.379-1.179, P=0.164 for Ruminococcaceae UCG009; OR:
1.654, 95% CI=0.800-3.422, P=0.175 for Ruminococcaceae
UCG014; and OR: 0.249, 95% CI=0.092-0.676, P=0.006 for
Enterobacteriales; Table II),
albeit with wider CIs. In addition, MR-Egger regression intercept
showed no heterogeneity in the diversity of these gut microbiota in
GC. MRPRESSO regression normality was used and heterogeneity
analysis confirmed the accuracy (Table II). Concomitantly, leave-one-out
sensitivity analysis confirmed the robustness of the data,
indicating a consistent negative association between 9 gut flora
and GC risk (Fig. S1, Fig. S2, Fig. S3, Fig. S4, Fig. S5, Fig. S6, Fig. S7, Fig. S8 and Fig. S9).
| Table IISensitivity analysis between gut
microbiota and gastric cancer analyzed using the inverse-variance
weighted method. |
Table II
Sensitivity analysis between gut
microbiota and gastric cancer analyzed using the inverse-variance
weighted method.
| Gut microbiota | Q-value | P-value | Intercept | P-value | MRPRESSO |
|---|
| Family
Enterobacteriaceae | 6.133 | 0.293 | -0.140 | 0.490 | 0.090 |
| Genus
Allisonella | 4.167 | 0.654 | 0.098 | 0.563 | 0.808 |
| Genus
Lachnospiraceae FCS020 | 5.240 | 0.875 | 0.048 | 0.396 | 0.880 |
| Genus Prevotella
7 | 4.591 | 0.868 | -0.051 | 0.701 | 0.945 |
| Genus
Roseburia | 6.133 | 0.293 | -0.140 | 0.490 | 0.852 |
| Genus
Ruminococcaceae UCG004 | 9.301 | 0.410 | -0.052 | 0.674 | 0.521 |
| Genus
Ruminococcaceae UCG009 | 7.668 | 0.661 | -0.032 | 0.705 | 0.866 |
| Genus
Ruminococcaceae UCG0014 | 5.172 | 0.819 | -0.016 | 0.786 | 0.939 |
| Order
Enterobacteriales | 6.133 | 0.293 | -0.140 | 0.490 | 0.079 |
Reverse MR analysis
In the reverse MR analysis, GC was used as the
exposure factor, and gut flora, which was associated with GC, was
the outcome variable. The IVW results of MR study did not support a
causal relationship between GC and altered gut flora (Table SII).
Discussion
In the present study, the MR method was utilized to
explore the causal relationship between the relative abundance of
gut microbes and GC. Trillions of symbiotic bacteria colonize the
gut and serve a key role in body homeostasis and host defense
against pathogenic invasion (16).
A healthy microbiota resists colonization and invasion by harmful
microorganisms through direct and indirect mechanisms (17,18).
For example, short-chain fatty acids (SCFAs), a major metabolite
produced by microorganisms, induce the production of antimicrobial
peptides by inhibiting the activity of histone deacetylase-3,
thereby enhancing the antibacterial activity in infected mouse
models (19,20).
Multiple studies have shown decreased diversity of
intragastric flora in patients with GC (21-23);
however, other studies have suggested a quantitative difference in
the composition of the flora between patients with GC and those
with dyspepsia (24,25). Aviles-Jimenez et al
(22) demonstrated a decrease in
the abundance of Porphyromonas, Neisseria and
Streptococcus buglossi, and an increase in the abundance of
Lactobacillus spp. and Trichosporon spp. during the
disease progression of GC. Demiryas et al (25) demonstrated that patients with GC
with increased homogeneity and diversity of flora compared with
healthy controls. A study of 276 patients with GC demonstrated that
the abundance of Streptococcus spp., Clostridium
spp., Crescentomonas spp., Propionibacterium spp. and
Corynebacterium spp. is increased in cancerous tissues
(26). A Korean study concluded
that Prevotella and Propionibacterium acnes are
causative agents of GC, whereas Lactococcus lactis serves a
protective role in the development of GC (27). Furthermore, H. pylori
infection is a major risk factor for gastric carcinogenesis;
however, the majority of infected individuals do not develop GC and
significant genomic diversity of strains is associated with
virulence factors (28).
Alterations in the gut microbiota may increase the
susceptibility to GC through several mechanisms. Gastrointestinal
flora produce a number of metabolites and enhance inflammatory
responses, antagonize the development of tumors and activate
alternative mechanisms via PI3K/AKT, MAPK, JAK-STAT and other
signaling pathways, which can lead to disruption of the intestinal
flora and further contribute to development of GC (29). The gastric microbiome and
metabolome profiles of 37 cases of GC and matched non-tumor tissue
were previously characterized by 16S ribosomal RNA technology. The
relative abundance of amino acids, carbohydrates, carbohydrate
conjugation, glycerophospholipids and nucleosides in GC tissue was
revealed to be higher than that in non-tumor tissues (30). Furthermore, the combination of
1-methylnicotinamide and n-acetyl-D-glucosamine 6-phosphate is a
reliable biomarker to distinguish GC from normal tissue (31). SCFAs mainly comprise acetic,
butyric and propionic acids; these metabolites are important energy
sources for gut microbes and epithelial cells, in addition to their
different immunomodulatory functions (32). Previous studies have demonstrated
that SCFAs serve a tumorigenic role by blocking activation of the
NF-κB signaling pathway and inducing the differentiation of
regulatory T cells (33,34). Among them, butyrate not only
promotes energy metabolism and maintains a low-oxygen environment
in the intestinal lumen, but also activates peroxisome
proliferator-activated receptor γ in intestinal cells, inhibits
expression of the nitric oxide synthase 2 gene and the synthesis of
inducible nitric oxide synthase, decreases nitrate production and
restricts proliferation of pathogenic anaerobic bacteria, thus
inhibiting gastrointestinal tract inflammation and carcinogenesis
(35). Bile reflux-generated bile
acids are high-risk factors for GC and secondary bile acids promote
GC cell proliferation (36).
Therefore, the incidence of GC may be decreased by regulating
specific types of bile acid.
To the best of our knowledge, the present study is
the first to identify a causal association between gut
microorganisms and GC, in which elevated abundance of the genera
Prevotella 7, Roseburia and Ruminococcaceae
UCG014 may increase the risk of GC. In addition, the family
Enterobacteriaceae, the genera Allisonella,
Lachnospiraceae FCS020, Ruminococcaceae UCG004 and
Ruminococcaceae UCG009, and the order Enterobacteriales
decreased the risk of GC. Ruminococcus is one of the
earliest discovered gastric bacteria and serves a crucial role in
metabolism. Cellulose is broken down by rumen bacteria to obtain
nutrients. Ruminococcus is also capable of fermenting
glucose and xylose. In addition to this function, it is able to
stabilize the intestinal barrier, prevent diarrhea, reduce the risk
of colorectal cancer, reduce kidney stone formation and increase
energy (37).
Ruminalococcus spp. has decreased abundance in ulcerative
colitis, allergic disease and cerebral palsy, indicating its
function as a beneficial bacterium (38). Notably, the results of the present
reverse MR study did not support a causal association between GC
and altered intestinal flora.
The causal relationship identified in the present
study may provide candidate gut microbiota for subsequent
functional studies. However, there are limitations. First, the
threshold for screening the gut microbiome IVs was
P<1x10⁻⁵ and although measures were taken to ensure
validity by calculating the F-statistic for each SNP, there is the
possibility of false-negative errors due to insufficient
statistical validity. Second, while the majority of patients in the
GWAS pooled data were European, only a small number of gut
microbiome data came from other ethnicities, which could lead to
biased estimates and could affect generalizability. Third, due to
the strict threshold, a number of genetic locus of the gut
microbiota were excluded at the IV selection stage, which may have
led to some results being missed.
In conclusion, the causal association between
intestinal microorganisms and GC was investigated in the present
study using MR analysis. The genera Prevotella 7,
Roseburia and Ruminococcaceae UCG014 were associated
with increased risk of GC, whereas the family
Enterobacteriaceae, the genera Allisonella,
Lachnospiraceae FCS020, Ruminococcaceae UCG004 and
Ruminococcaceae UCG009, and the order Enterobacteriales
reduced the risk of GC development, suggesting that intestinal
microorganisms serve a role in the process of GC development and
may have potential for the treatment of GC.
Supplementary Material
Scatter and leave-one-out plot of the
family Enterobacteriaceae. MR, Mendelian randomization; SNP,
single nucleotide polymorphism.
Scatter and leave-one-out plot of the
genus Allisonella. MR, Mendelian randomization; SNP, single
nucleotide polymorphism.
Scatter and leave-one-out plot of
genus Lachnospiraceae FCS020. MR, Mendelian randomization;
SNP, single nucleotide polymorphism.
Scatter and leave-one-out plot of
genus the Prevotella 7. MR, Mendelian randomization; SNP,
single nucleotide polymorphism.
Scatter and leave-one-out plot of the
genus Roseburia. MR, Mendelian randomization; SNP, single
nucleotide polymorphism.
Scatter and leave-one-out plot of the
genus Ruminococcaceae UCG004. MR, Mendelian randomization;
SNP, single nucleotide polymorphism.
Scatter and leave-one-out plot of the
genus Ruminococcaceae UCG009. MR, Mendelian randomization;
SNP, single nucleotide polymorphism.
Scatter and leave-one-out plot of the
genus Ruminococcaceae UCG014. MR, Mendelian randomization;
SNP, single nucleotide polymorphism.
Scatter and leave-one-out plot of the
order Enterobacteriales. MR, Mendelian randomization; SNP, single
nucleotide polymorphism.
Characteristics of the genetic
instrument variables for the nine gut microbiota at the genome-wide
significance level (P<1x10⁻⁵).
Effect estimates of the associations
between gastric cancer and risk of nine bacterial traits in the
reverse MR analyses.
Acknowledgements
Not applicable.
Funding
Funding: The present study was supported by the 2021 Natural
Science Foundation of Gansu Province (grant no. 21JR7RA670).
Availability of data and materials
The data generated in the present study may be
requested from the corresponding author.
Authors' contributions
JZ and CD designed the study. YL analyzed the data
and wrote the manuscript. LS and JM collected the data. RH and HW
revised the manuscript. JZ and YL confirm the authenticity of all
the raw data. All authors have read and approved the final
manuscript.
Ethics approval and consent to
participate
Not applicable.
Patient consent for publication
Not applicable.
Competing interests
The authors declare that they have no competing
interests.
References
|
1
|
Sung H, Ferlay J, Siegel RL, Laversanne M,
Soerjomataram I, Jemal A and Bray F: Global cancer statistics 2020:
GLOBOCAN estimates of incidence and mortality worldwide for 36
cancers in 185 countries. CA Cancer J Clin. 71:209–249.
2021.PubMed/NCBI View Article : Google Scholar
|
|
2
|
Lee YC, Chiang TH, Chou CK, Tu YK, Liao
WC, Wu MS and Graham DY: Association between helicobacter pylori
eradication and gastric cancer incidence: A systematic review and
meta-analysis. Gastroenterology. 150:1113–1124.e5. 2016.PubMed/NCBI View Article : Google Scholar
|
|
3
|
van den Brandt PA: The impact of a healthy
lifestyle on the risk of esophageal and gastric cancer subtypes.
Eur J Epidemiol. 37:931–945. 2022.PubMed/NCBI View Article : Google Scholar
|
|
4
|
Ohashi M, Kanai F, Ueno H, Tanaka T,
Tateishi K, Kawakami T, Koike Y, Ikenoue T, Shiratori Y, Hamada H
and Omata M: Adenovirus mediated p53 tumour suppressor gene therapy
for human gastric cancer cells in vitro and in vivo. Gut.
44:366–371. 1999.PubMed/NCBI View Article : Google Scholar
|
|
5
|
Oliveira C, Pinheiro H, Figueiredo J,
Seruca R and Carneiro F: Familial gastric cancer: Genetic
susceptibility, pathology, and implications for management. Lancet
Oncol. 16:e60–e70. 2015.PubMed/NCBI View Article : Google Scholar
|
|
6
|
Zhou B, Yuan Y, Zhang S, Guo C, Li X, Li
G, Xiong W and Zeng Z: Intestinal flora and disease mutually shape
the regional immune system in the intestinal tract. Front Immunol.
11(575)2020.PubMed/NCBI View Article : Google Scholar
|
|
7
|
Perez-Lopez A, Behnsen J, Nuccio SP and
Raffatellu M: Mucosal immunity to pathogenic intestinal bacteria.
Nat Rev Immunol. 16:135–148. 2016.PubMed/NCBI View Article : Google Scholar
|
|
8
|
Hariton E and Locascio JJ: Randomised
controlled trials-the gold standard for effectiveness research:
Study design: Randomised controlled trials. Bjog.
125(1716)2018.PubMed/NCBI View Article : Google Scholar
|
|
9
|
Birney E: Mendelian randomization. Cold
Spring Harb Perspect Med. 12(a041302)2022.PubMed/NCBI View Article : Google Scholar
|
|
10
|
Kuper H, Nicholson A, Kivimaki M,
Aitsi-Selmi A, Cavalleri G, Deanfield JE, Heuschmann P, Jouven X,
Malyutina S, Mayosi BM, et al: Evaluating the causal relevance of
diverse risk markers: Horizontal systematic review. BMJ.
339(b4265)2009.PubMed/NCBI View Article : Google Scholar
|
|
11
|
Graham SE, Clarke SL, Wu KH, Kanoni S,
Zajac GJM, Ramdas S, Surakka I, Ntalla I, Vedantam S, Winkler TW,
et al: The power of genetic diversity in genome-wide association
studies of lipids. Nature. 600:675–679. 2021.PubMed/NCBI View Article : Google Scholar
|
|
12
|
Boehm FJ and Zhou X: Statistical methods
for mendelian randomization in genome-wide association studies: A
review. Comput Struct Biotechnol J. 20:2338–2351. 2022.PubMed/NCBI View Article : Google Scholar
|
|
13
|
Burgess S and Thompson SG: Interpreting
findings from mendelian randomization using the MR-Egger method.
Eur J Epidemiol. 32:377–389. 2017.PubMed/NCBI View Article : Google Scholar
|
|
14
|
Bowden J, Davey Smith G, Haycock PC and
Burgess S: Consistent estimation in mendelian randomization with
some invalid instruments using a weighted median estimator. Genet
Epidemiol. 40:304–314. 2016.PubMed/NCBI View Article : Google Scholar
|
|
15
|
Lin L, Luo P, Yang M, Wang J, Hou W and Xu
P: Causal relationship between osteoporosis and osteoarthritis: A
two-sample mendelian randomized study. Front Endocrinol (Lausanne).
13(1011246)2022.PubMed/NCBI View Article : Google Scholar
|
|
16
|
Kim S, Covington A and Pamer EG: The
intestinal microbiota: Antibiotics, colonization resistance, and
enteric pathogens. Immunol Rev. 279:90–105. 2017.PubMed/NCBI View Article : Google Scholar
|
|
17
|
Pamer EG: Resurrecting the intestinal
microbiota to combat antibiotic-resistant pathogens. Science.
352:535–538. 2016.PubMed/NCBI View Article : Google Scholar
|
|
18
|
Trompette A, Gollwitzer ES, Yadava K,
Sichelstiel AK, Sprenger N, Ngom-Bru C, Blanchard C, Junt T, Nicod
LP, Harris NL and Marsland BJ: Gut microbiota metabolism of dietary
fiber influences allergic airway disease and hematopoiesis. Nat
Med. 20:159–166. 2014.PubMed/NCBI View Article : Google Scholar
|
|
19
|
Zhao C, Bao L, Zhao Y, Wu K, Qiu M, Feng
L, Zhang N, Hu X and Fu Y: A fiber-enriched diet alleviates
staphylococcus aureus-induced mastitis by activating the
HDAC3-mediated antimicrobial program in macrophages via butyrate
production in mice. PLoS Pathog. 19(e1011108)2023.PubMed/NCBI View Article : Google Scholar
|
|
20
|
Hu X, Guo J, Zhao C, Jiang P, Maimai T,
Yanyi L, Cao Y, Fu Y and Zhang N: The gut microbiota contributes to
the development of staphylococcus aureus-induced mastitis in mice.
ISME J. 14:1897–1910. 2020.PubMed/NCBI View Article : Google Scholar
|
|
21
|
Coker OO, Dai Z, Nie Y, Zhao G, Cao L,
Nakatsu G, Wu WK, Wong SH, Chen Z, Sung JJY and Yu J: Mucosal
microbiome dysbiosis in gastric carcinogenesis. Gut. 67:1024–1032.
2018.PubMed/NCBI View Article : Google Scholar
|
|
22
|
Aviles-Jimenez F, Vazquez-Jimenez F,
Medrano-Guzman R, Mantilla A and Torres J: Stomach microbiota
composition varies between patients with non-atrophic gastritis and
patients with intestinal type of gastric cancer. Sci Rep.
4(4202)2014.PubMed/NCBI View Article : Google Scholar
|
|
23
|
Ferreira RM, Pereira-Marques J,
Pinto-Ribeiro I, Costa JL, Carneiro F, Machado JC and Figueiredo C:
Gastric microbial community profiling reveals a dysbiotic
cancer-associated microbiota. Gut. 67:226–236. 2018.PubMed/NCBI View Article : Google Scholar
|
|
24
|
Dicksved J, Lindberg M, Rosenquist M,
Enroth H, Jansson JK and Engstrand L: Molecular characterization of
the stomach microbiota in patients with gastric cancer and in
controls. J Med Microbiol. 58:509–516. 2009.PubMed/NCBI View Article : Google Scholar
|
|
25
|
Demiryas S, Caliskan R, Saribas S, Akkus
S, Gareayaghi N, Kirmusaoglu S, Kepil N, Dinc H, Dag H, Dagdeviren
E, et al: The association between cagL and cagA, vacAs-m, babA
genes in patients with gastric cancer, duodenal ulcer, and
non-ulcer dyspepsia related to helicobacter pylori. Acta
Gastroenterol Belg. 83:385–392. 2020.PubMed/NCBI
|
|
26
|
Liu X, Shao L, Liu X, Ji F, Mei Y, Cheng
Y, Liu F, Yan C, Li L and Ling Z: Alterations of gastric mucosal
microbiota across different stomach microhabitats in a cohort of
276 patients with gastric cancer. EBioMedicine. 40:336–348.
2019.PubMed/NCBI View Article : Google Scholar
|
|
27
|
Gunathilake MN, Lee J, Choi IJ, Kim YI,
Ahn Y, Park C and Kim J: Association between the relative abundance
of gastric microbiota and the risk of gastric cancer: A
case-control study. Sci Rep. 9(13589)2019.PubMed/NCBI View Article : Google Scholar
|
|
28
|
Brawner KM, Morrow CD and Smith PD:
Gastric microbiome and gastric cancer. Cancer J. 20:211–216.
2014.PubMed/NCBI View Article : Google Scholar
|
|
29
|
Meng C, Bai C, Brown TD, Hood LE and Tian
Q: Human gut microbiota and gastrointestinal cancer. Genomics
Proteomics Bioinformatics. 16:33–49. 2018.PubMed/NCBI View Article : Google Scholar
|
|
30
|
Lawrie CH, Marafioti T, Hatton CS,
Dirnhofer S, Roncador G, Went P, Tzankov A, Pileri SA, Pulford K
and Banham AH: Cancer-associated carbohydrate identification in
hodgkin's lymphoma by carbohydrate array profiling. Int J Cancer.
118:3161–3166. 2006.PubMed/NCBI View Article : Google Scholar
|
|
31
|
Dai D, Yang Y, Yu J, Dang T, Qin W, Teng
L, Ye J and Jiang H: Interactions between gastric microbiota and
metabolites in gastric cancer. Cell Death Dis.
12(1104)2021.PubMed/NCBI View Article : Google Scholar
|
|
32
|
Rooks MG and Garrett WS: Gut microbiota,
metabolites and host immunity. Nat Rev Immunol. 16:341–352.
2016.PubMed/NCBI View Article : Google Scholar
|
|
33
|
Smith PM, Howitt MR, Panikov N, Michaud M,
Gallini CA, Bohlooly-Y M, Glickman JN and Garrett WS: The microbial
metabolites, short-chain fatty acids, regulate colonic treg cell
homeostasis. Science. 341:569–573. 2013.PubMed/NCBI View Article : Google Scholar
|
|
34
|
Fang Y, Yan C, Zhao Q, Xu J, Liu Z, Gao J,
Zhu H, Dai Z, Wang D and Tang D: The roles of microbial products in
the development of colorectal cancer: A review. Bioengineered.
12:720–735. 2021.PubMed/NCBI View Article : Google Scholar
|
|
35
|
Byndloss MX, Olsan EE, Rivera-Chávez F,
Tiffany CR, Cevallos SA, Lokken KL, Torres TP, Byndloss AJ, Faber
F, Gao Y, et al: Microbiota-activated PPAR-γ signaling inhibits
dysbiotic enterobacteriaceae expansion. Science. 357:570–575.
2017.PubMed/NCBI View Article : Google Scholar
|
|
36
|
Dodd D, Spitzer MH, Van Treuren W, Merrill
BD, Hryckowian AJ, Higginbottom SK, Le A, Cowan TM, Nolan GP,
Fischbach MA and Sonnenburg JL: A gut bacterial pathway metabolizes
aromatic amino acids into nine circulating metabolites. Nature.
551:648–652. 2017.PubMed/NCBI View Article : Google Scholar
|
|
37
|
Crost EH, Coletto E, Bell A and Juge N:
Ruminococcus gnavus: Friend or foe for human health. FEMS Microbiol
Rev. 47(fuad014)2023.PubMed/NCBI View Article : Google Scholar
|
|
38
|
La Reau AJ and Suen G: The Ruminococci:
Key symbionts of the gut ecosystem. J Microbiol. 56:199–208.
2018.PubMed/NCBI View Article : Google Scholar
|