Introduction
Kidney cancer is a common urological malignancy that
accounted for almost 3% of adult malignancies in 2007 (1). Statistics for 2010 indicated that
>90,000 mortalities are caused by kidney cancer annually
(2). Renal cell carcinoma, one of
the most common subtypes of kidney cancer, originates in the lining
of the proximal renal tubule and represents ~80% of cases of kidney
cancer (3). For the treatment of
renal cell carcinoma, surgery is the most common therapy, followed
by chemotherapy and radiotherapy (4). However, the outcomes of these
treatments are not satisfactory with a high recurrence rate of
20–40% (5). The lack of biomarkers
for early detection and follow-up may lead to late diagnosis and
subsequently to poor prognosis. Hence, a clear understanding of the
pathogenesis of renal cell carcinoma is required in order to
develop predictive biomarkers and target therapies.
Several important genes that participate in tumor
development have been identified. One-allele inactivation of the
von Hippel-Lindau (VHL) gene was identified in >90% of cases of
non-inherited renal cell carcinoma (6). The inactivation of the VHL gene led
to the production of a defective VHL protein, which would
ordinarily degrade hypoxia-inducible factor (HIF) (7). A build-up of HIF led to its
translocation to the nucleus, where it promotes the transcription
of various genes critical to tumor development (8). Inactivated SET domain, bifurcated 1
and lysine-specific demethylase C, which are involved in histone
modification, has been identified by sequencing in a previous study
(9). These genes modify the
methylation state of the lysine residues of histone H3 and regulate
chromatin structure. The SWItch/sucrose nonfermentable chromatin
remodeling complex gene and protein polybromo-a have also been
implicated in the development of renal cell carcinoma (10).
These renal cell carcinoma-associated genes mainly
regulate the expression of transcription factors and therefore
influence tumor development. The estrogen receptor (ER), a
hormone-regulated transcription factor, has been widely studied,
and previous studies have demonstrated ER-regulated cell division
and differentiation in the ovary, breast and uterus (11). Deregulation of ER transcriptional
activity may lead to an increase in proliferation and cancer onset
(12). Novel technologies,
including high-throughput sequencing and microarray, have enabled a
better understanding of ER regulatory mechanisms (13), and chromatin immunoprecipitation
sequencing has been used to demonstrate that the ER binding sites
are heterogeneous in human breast cancer cell lines and tissues
(14,15). The binding sites of the ER in the
chromosome are accompanied by multi-transcription factors
(ER-cooperation factors) (11).
Several ER target genes that participate in the cell cycle and cell
proliferation have been previously identified, including
cyclin-dependent kinase 6, CCAAT/enhancer binding protein alpha,
disabled homolog 2, mitogen-responsive phosphoprotein and Janus
kinase 2 (16).
Although the mechanism of the ER in breast cancer
has been widely studied, its regulatory mechanisms in renal cell
carcinoma development have not been investigated. In the present
study, ER-regulated DEGs were identified, and were subsequently
subjected to functional enrichment analysis. Furthermore, the
interaction network between the transcription factors and their
target genes was analyzed. The identification and function analysis
of ER-specific genes may aid in the discovery of biomarkers for
early detection and follow-up of renal cell carcinoma.
Materials and methods
Gene expression profiles
Gene expression data GSE12090 (17) were downloaded from the gene
expression omnibus database (http://www.ncbi.nlm.nih.gov/geo/). The data were
obtained from a total of 18 samples; 9 chromophobe renal cell
carcinoma and 9 oncocytoma samples.
Data preprocessing
The gene expression profiles (CEL format) were
converted into expression values using the affy package in
Bioconductor (18). The probe
signal was converted into the corresponding gene symbol based on
the microarray platform GPL570 [HG-U133_Plus_2] (Human Genome U133
Plus Array, version 2.0, Affymetrix, Santa Clara, CA, USA) using
Bioconductor. For the genes corresponding to multiple probe sets,
the average expression levels were used.
DEG screening
The DEGs were identified using the significance
analysis of microarray method (19) within the siggenes package. The
criteria for selection were Δ=2.3 and a false discovery rate
(FDR)<0.004. The Database for Annotation Visualization and
Integrated Discovery (DAVID) online tool was used to perform the
functional and pathway enrichment of DEGs in the present study.
DAVID has integrated statistical methods for P-value adjustment,
and the Benjamini method was used to adjust the P-value.
Functional and pathway enrichment of the
DEGs
Functional and pathway enrichment analysis of the
DEGs were carried out using Database for Annotation Visualization
and Integrated Discovery (20)
software, based on the gene ontology (GO)and Kyoto Encyclopedia of
Genes and Genomes (KEGG) pathway databases. P<0.05 was
considered to indicate a statistically significant difference.
Transcription regulatory network
construction
The regulatory network between DEGs and
transcription factors was constructed based on the target genes
predicted using the University of California, Santa Cruz (UCSC)
genome browser database (21). The
regulatory network of the ER and its target genes was also
constructed. Analysis of the network was conducted using Cytoscape
software (version 3.0.0) (22).
Functional enrichment analysis of ER
target genes
The ER target genes were identified, and the
upregulated and downregulated genes were subjected to GO functional
enrichment analysis using the GO Enrichment Analysis Software
Toolkit (23). P<0.05 was
considered to indicate a statistically significant difference.
Results
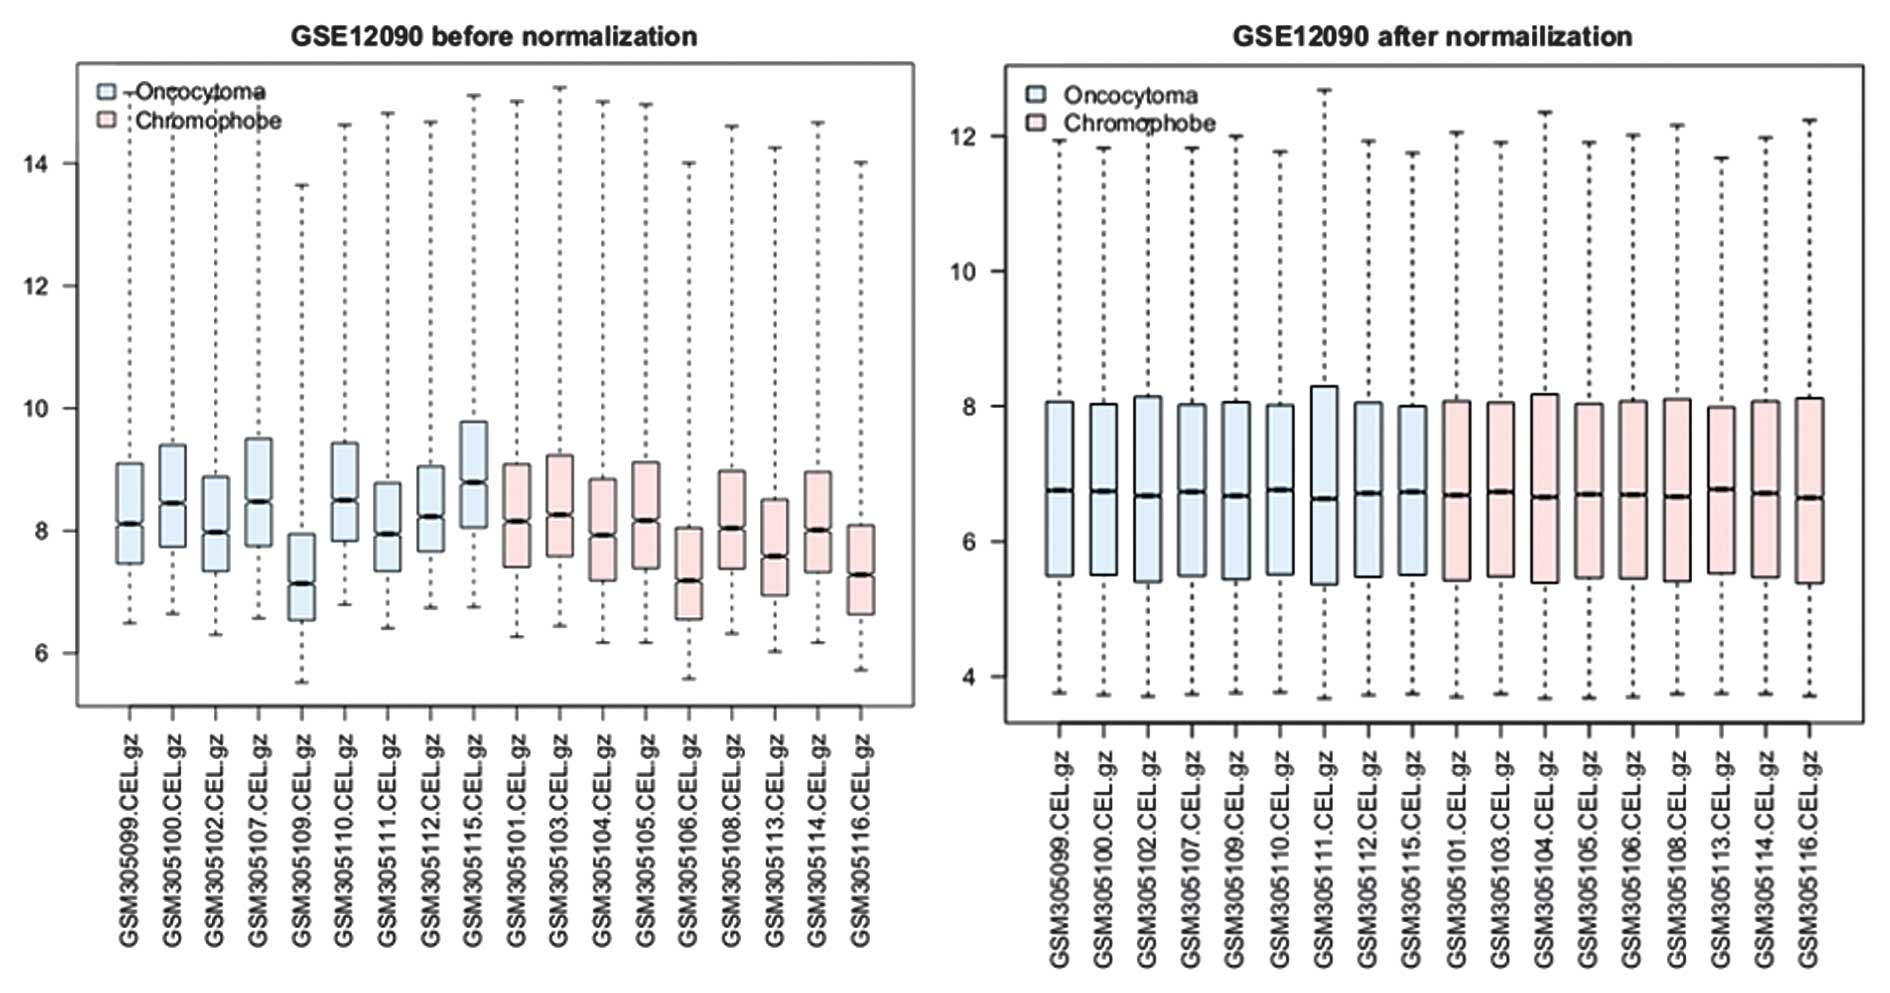
Data preprocessing
A total of 19,944 gene expression values were
obtained from the 18 samples following data preprocessing. The
normalized gene expression data were compared with the raw data in
subsequent analysis (Fig. 1). The
median expression values were nearly the same following
normalization.
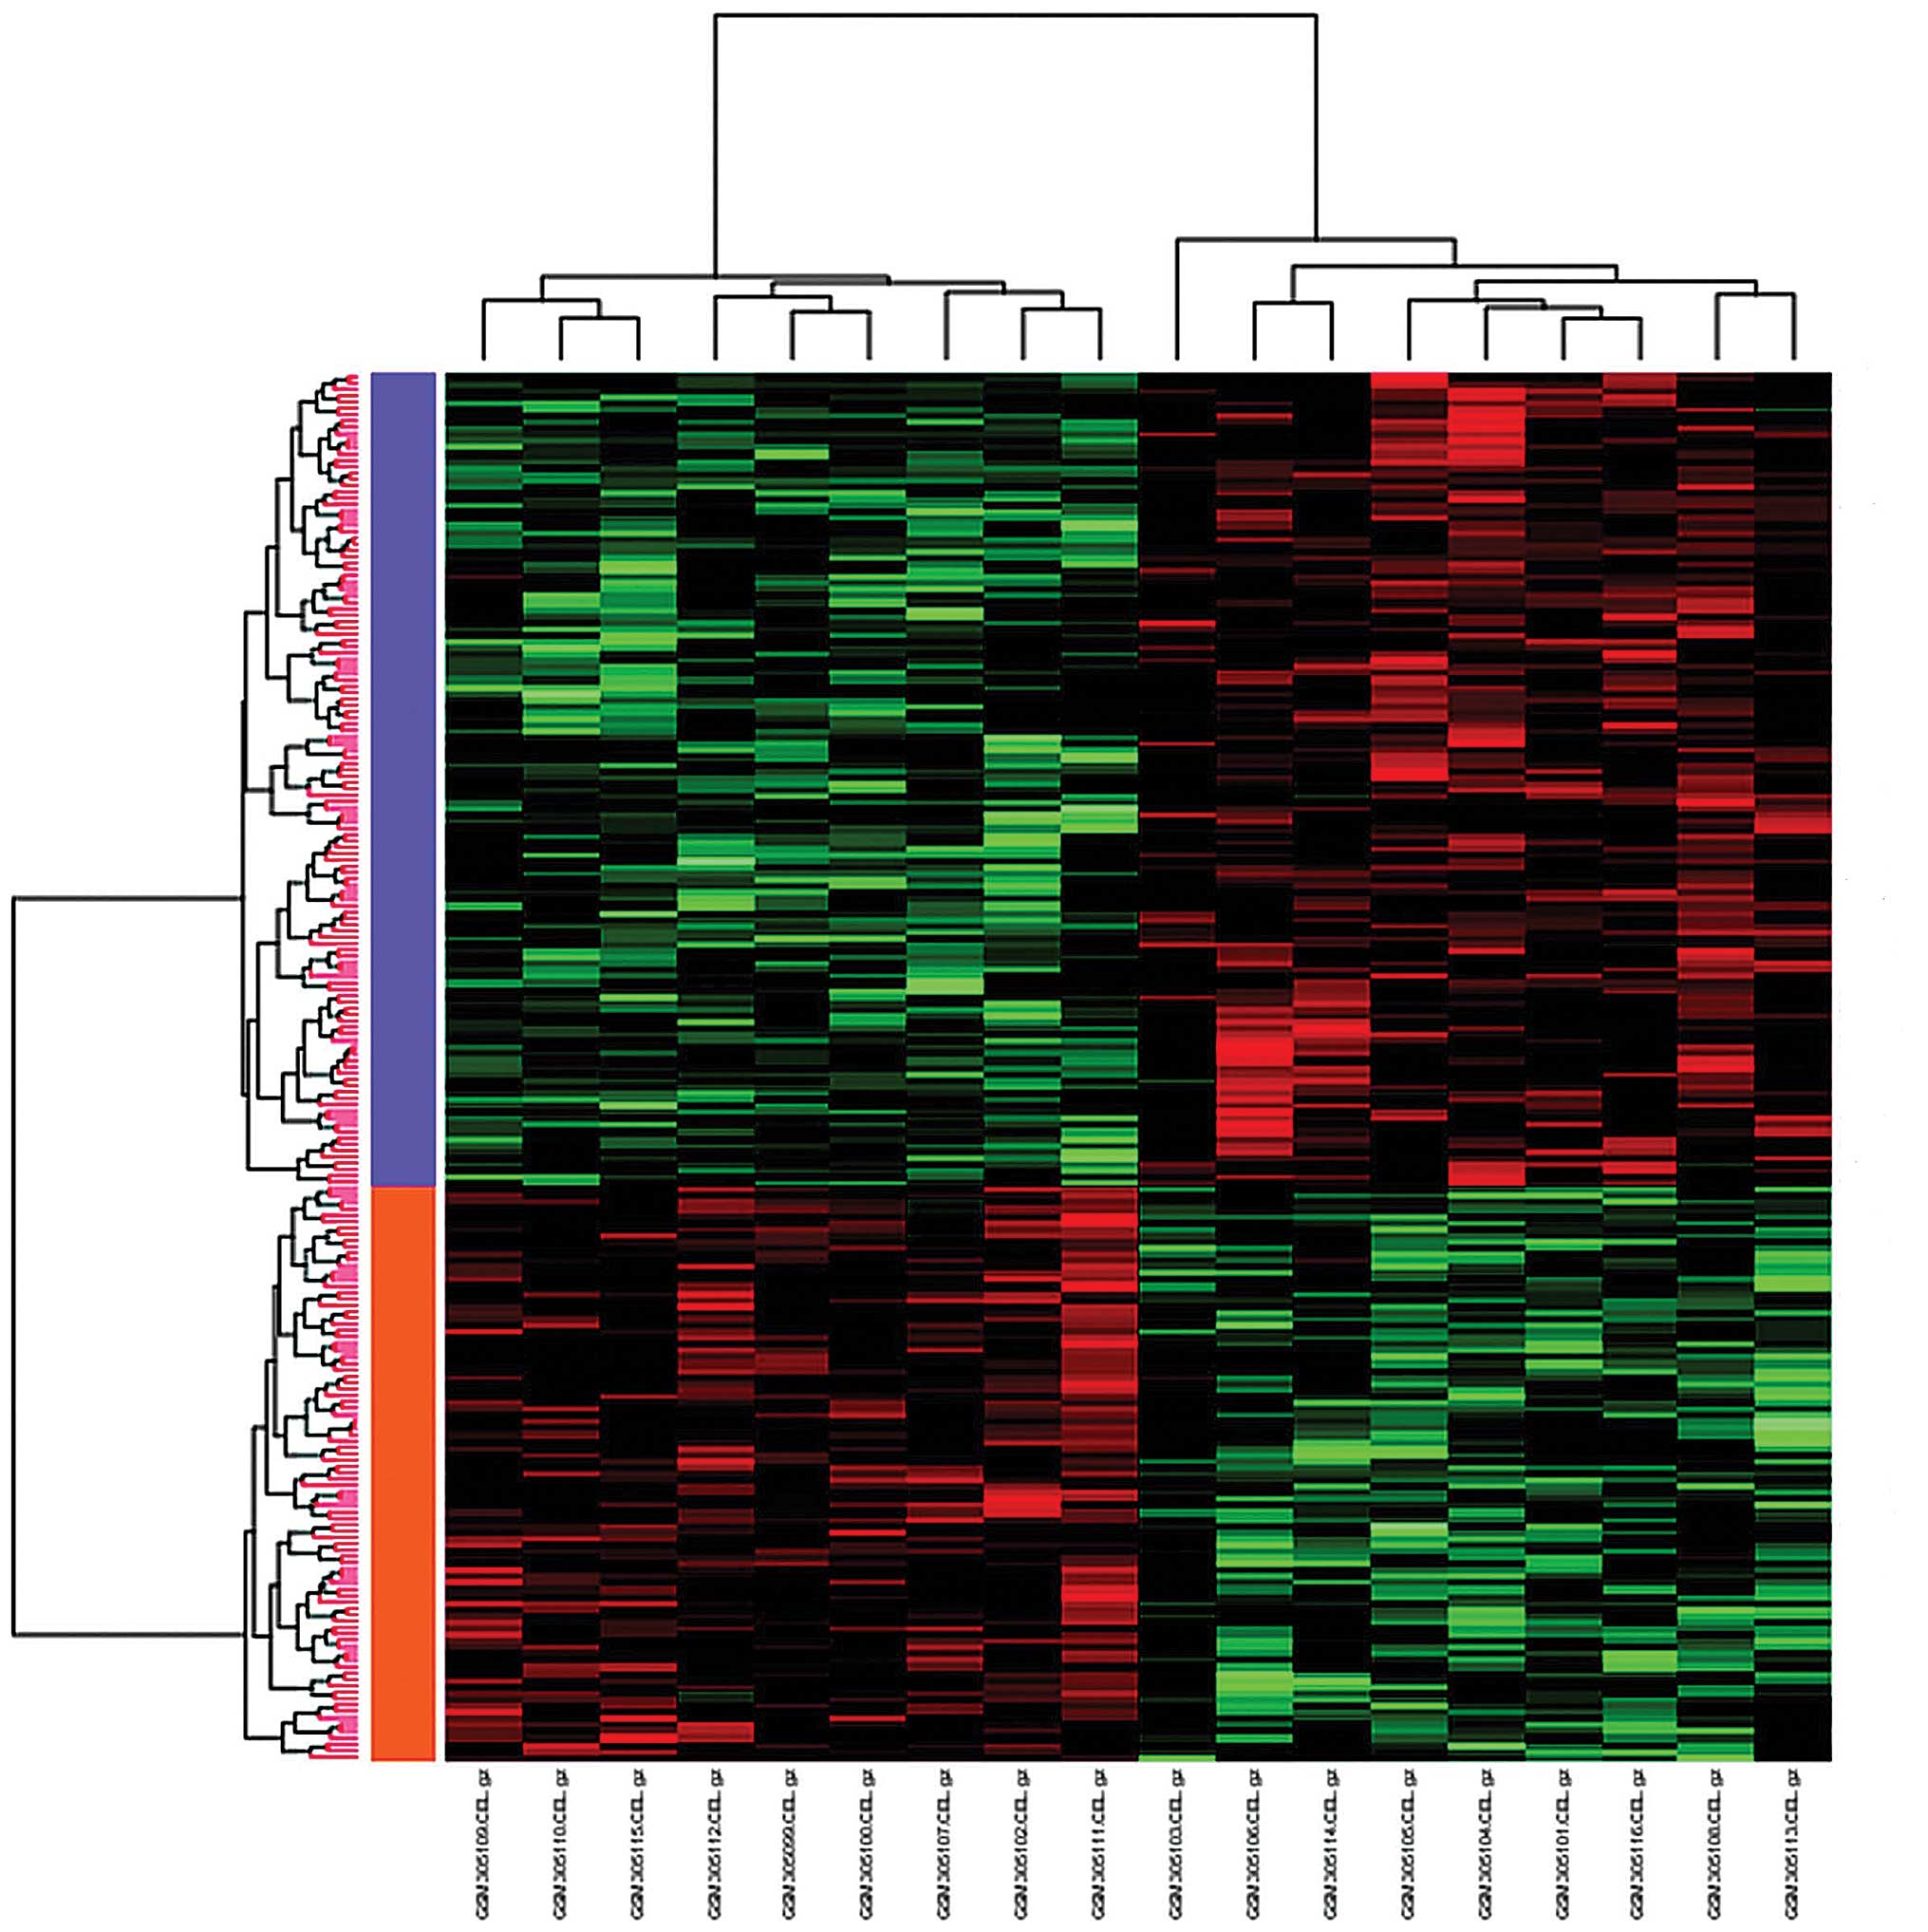
DEG screening
A total of 215 DEGs were identified with the
abovementioned criteria (Δ=2.3 and FDR<0.004) between the
chromophobe renal cell carcinoma and oncocytoma samples. Among
those DEGs, 126 genes were upregulated and 89 genes were
downregulated (Table I). The DEGs
were then subjected to clustering analysis: The samples were
clustered into two groups, namely the upregulation group and the
downregulation group (Fig. 2). The
upregulated genes were labeled in orange, while the downregulated
genes were labeled in purple.
 | Table IThe top 10 of up- and downregulated
DEGs. |
Table I
The top 10 of up- and downregulated
DEGs.
| Number | Gene | D-value |
|---|
| Upregulated |
| 1 | ESRP1 | 24.25 |
| 2 | MAL2 | 19.79 |
| 3 | AP1M2 | 18.69 |
| 4 | PRSS8 | 15.42 |
| 5 | CLDN7 | 12.53 |
| 6 | SPINT1 | 11.46 |
| 7 | TMC4 | 10.71 |
| 8 | BSPRY | −10.61 |
| 9 | KRT7 | 9.56 |
| 10 | CDS1 | 9.12 |
| Downregulated |
| 1 | NBL1 | −11.01 |
| 2 | KANK2 | −10.61 |
| 3 | DOCK1 | −8.72 |
| 4 | DIP2C | −8.35 |
| 5 | RANGRF | −8.16 |
| 6 | MAPRE3 | −7.63 |
| 7 | IGFBP1 | −7.34 |
| 8 | EXOSC1 | −7.32 |
| 9 | ITGB3 | −7.26 |
| 10 | LPAR1 | −7.08 |
Functional and pathway enrichment
analysis of DEGs
The top 10 GO terms of the upregulated and
downregulated DEGs are presented in Table II. Nearly one quarter of the DEGs
were associated with the plasma membrane. Pathway enrichment
analysis indicated that the upregulated genes were enriched in two
KEGG pathways: Cell conjunction and phosphatidylinositol signaling
conduction. However, the downregulated genes were not significantly
enriched in any KEGG pathway.
| Table IIGO and KEGG pathway enrichment
results. |
Table II
GO and KEGG pathway enrichment
results.
| A, Upregulated
DEGs |
|---|
|
|---|
| Category | Term and
function | Count (n) | P-value |
|---|
| GOTERM_CC_FAT | GO:0005923~tight
junction | 5 | 0.00 |
| GOTERM_CC_FAT |
GO:0070160~occluding junction | 5 | 0.00 |
| GOTERM_CC_FAT | GO:0009898~internal
side of plasma membrane | 8 | 0.00 |
| GOTERM_CC_FAT | GO:0043296~apical
junction complex | 5 | 0.00 |
| GOTERM_CC_FAT |
GO:0016327~apicolateral plasma
membrane | 5 | 0.00 |
| GOTERM_CC_FAT |
GO:0005911~cell-cell junction | 6 | 0.01 |
| GOTERM_CC_FAT | GO:0044459~plasma
membrane part | 23 | 0.01 |
| GOTERM_CC_FAT | GO:0005886~plasma
membrane | 34 | 0.01 |
| GOTERM_CC_FAT | GO:0000267~cell
fraction | 14 | 0.01 |
| GOTERM_CC_FAT |
GO:0005626~insoluble fraction | 11 | 0.03 |
| KEGG_PATHWAY | hsa04530:Tight
junction | 6 | 0.00 |
|
| B, Downregulated
DEGs |
|
| Category | Term | Count (n) | P-value |
|
| GOTERM_CC_FAT |
GO:0015630~microtubule cytoskeleton | 9 | 0.00 |
| GOTERM_CC_FAT | GO:0042612~MHC
class I protein complex | 3 | 0.01 |
| GOTERM_MF_FAT | GO:0070728~leucine
binding | 2 | 0.01 |
| GOTERM_MF_FAT |
GO:0004353~glutamate dehydrogenase
[NAD(P)+] activity | 2 | 0.01 |
| GOTERM_MF_FAT |
GO:0000166~nucleotide binding | 18 | 0.02 |
| GOTERM_BP_FAT |
GO:0045137~development of primary sexual
characteristics | 4 | 0.02 |
| GOTERM_BP_FAT | GO:0000077~DNA
damage checkpoint | 3 | 0.02 |
| GOTERM_BP_FAT | GO:0031570~DNA
integrity checkpoint | 3 | 0.02 |
| GOTERM_BP_FAT | GO:0006974~response
to DNA damage stimulus | 6 | 0.03 |
| GOTERM_CC_FAT |
GO:0044430~cytoskeletal part | 10 | 0.03 |
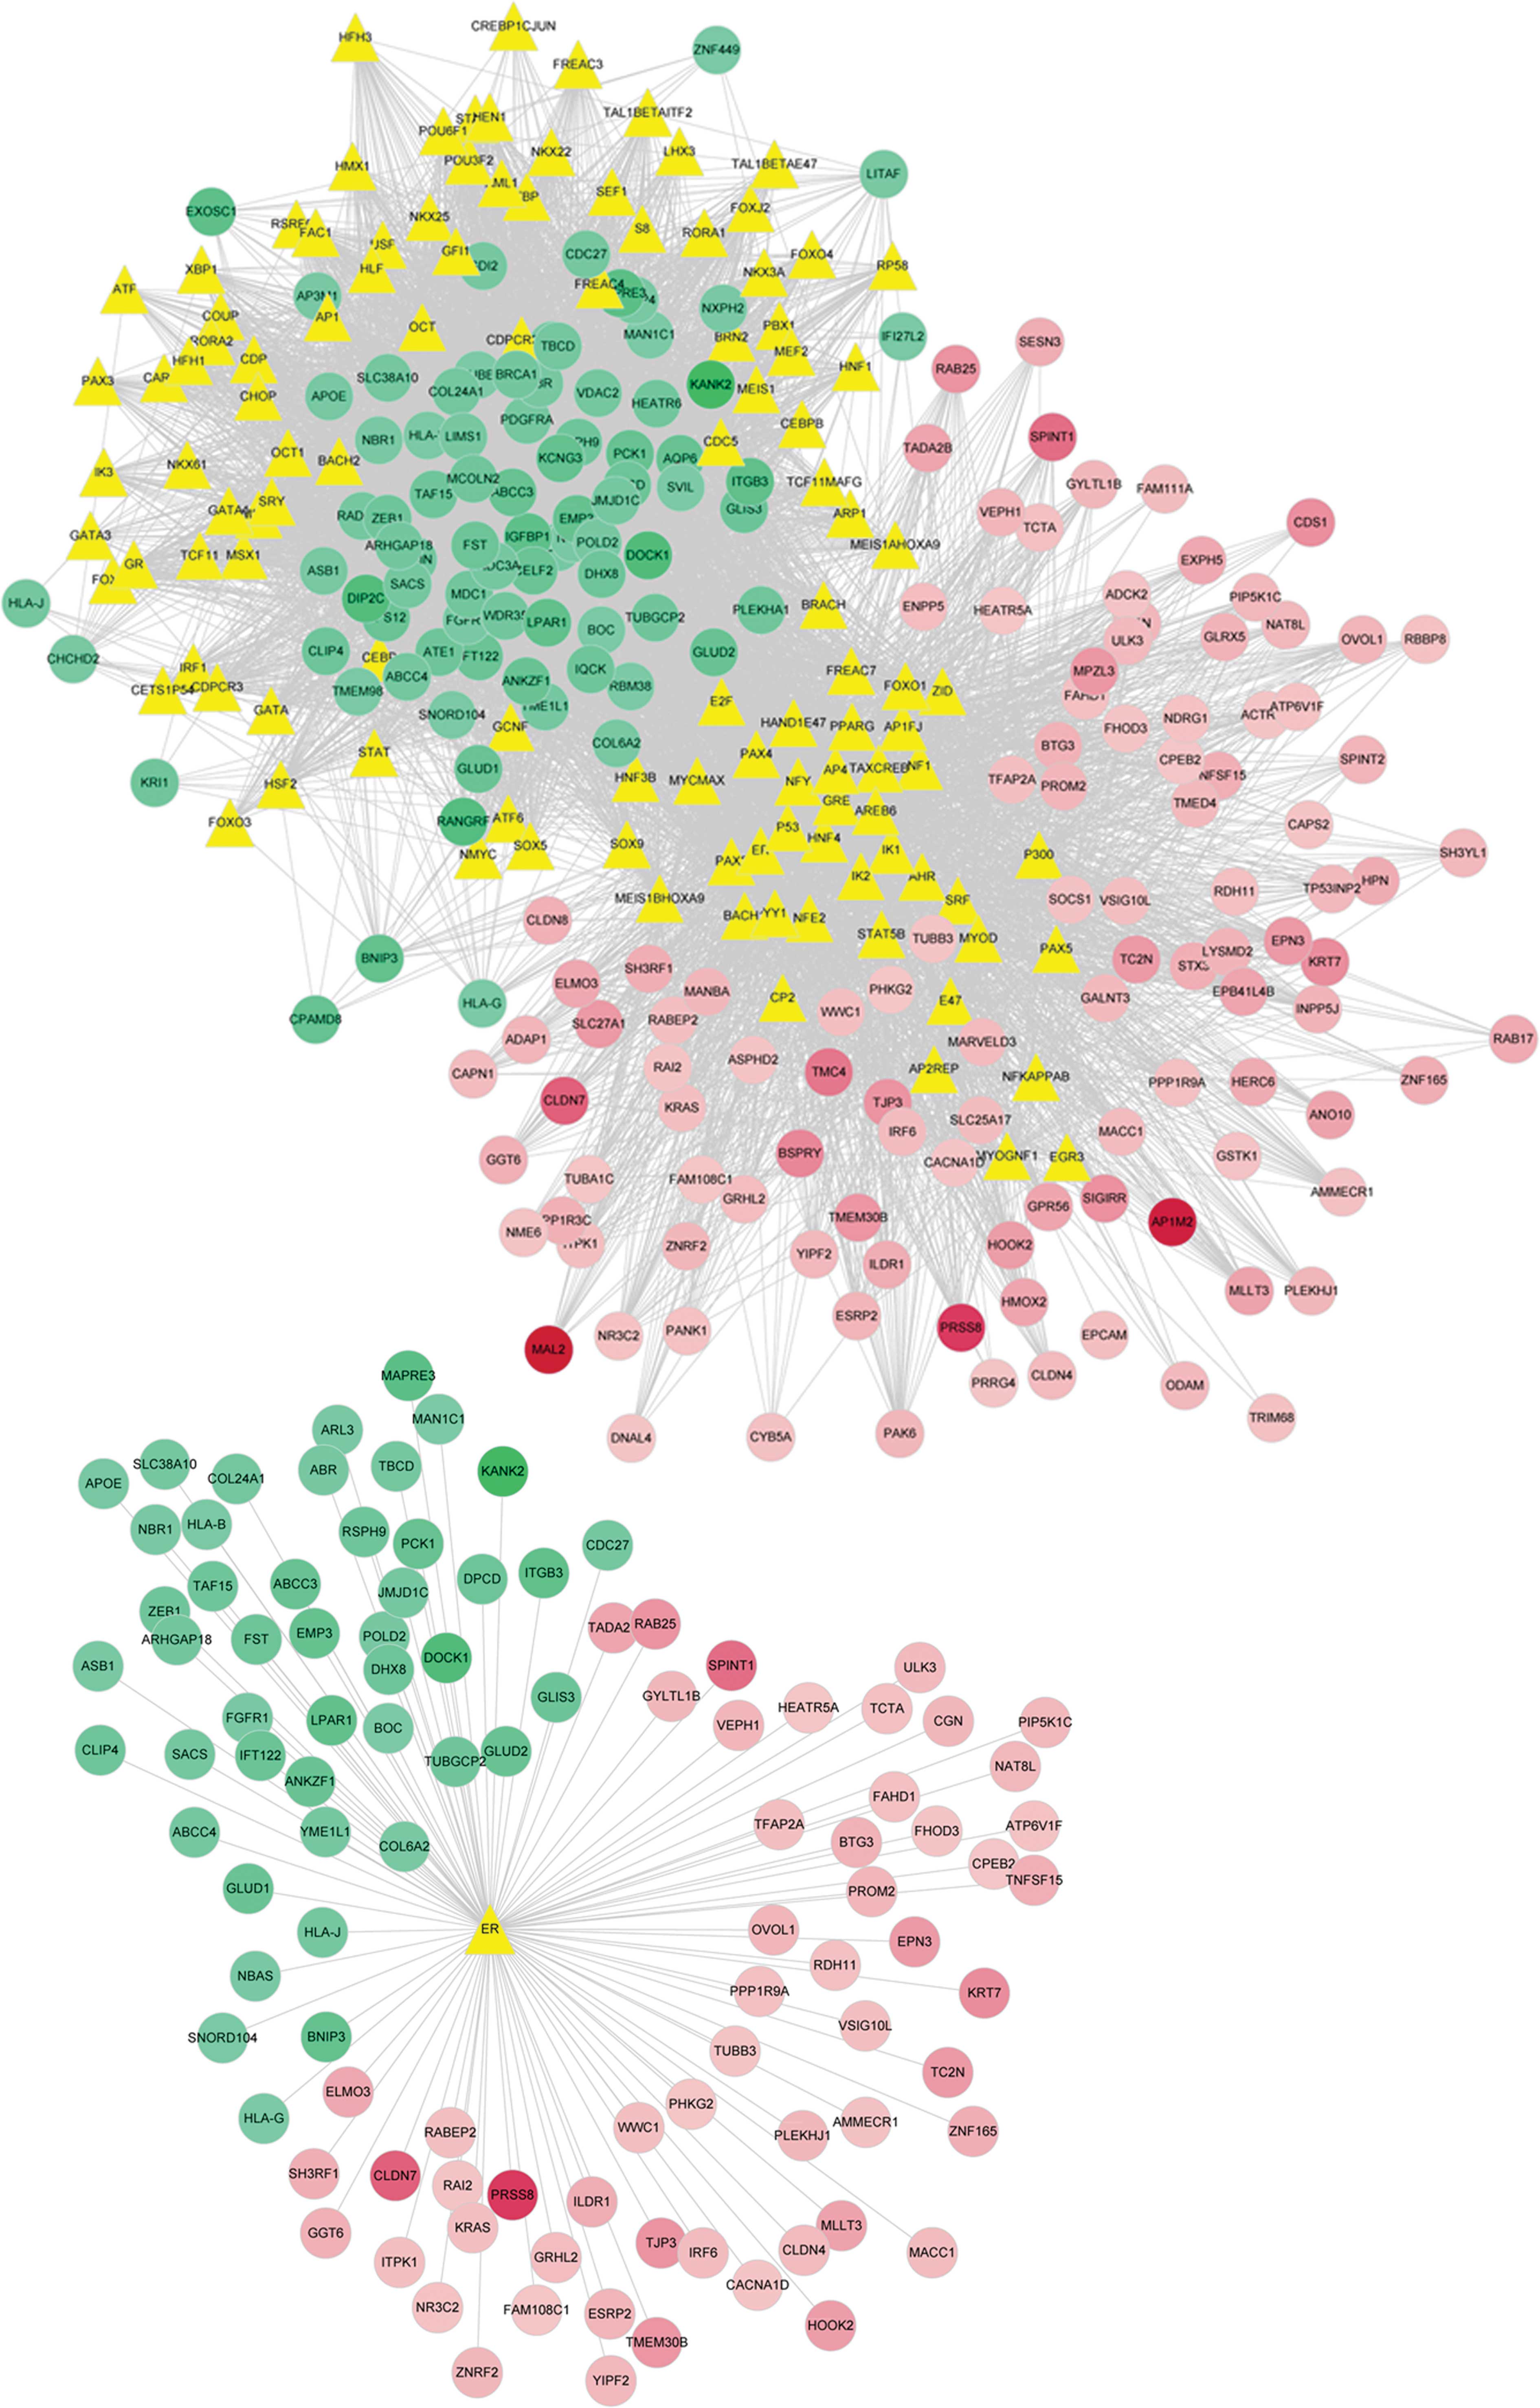
Transcriptional regulatory network
construction
The transcription factors that regulate DEG
expression were predicted using the UCSC database. A total of 115
transcription factors were identified, and the interaction network
between the transcription factors and DEGs was constructed
(Fig. 3). Further analysis
indicated that the ER participated in the regulation of 105 DEGs,
of which 59 were upregulated and 46 were downregulated. Based on
analysis of the regulatory network of the ER and DEGs, it was
possible to deduce that the ER is involved in the regulation of
oncogene and tumor suppressor gene expression (Fig. 3).
GO functional enrichment analysis of ER
target genes
The DEGs regulated by the ER were subjected to GO
functional enrichment analysis (Table III). The downregulated genes were
demonstrated to be involved in oxidoreductase activity, leucine
binding and glutamate dehydrogenase-NAD(P)+ activity;
while the upregulated genes were associated with occluded and tight
junctions as well as apical junction complexes.
| Table IIIGO enrichment analysis of the ER
target genes. |
Table III
GO enrichment analysis of the ER
target genes.
| A, Downregulated ER
target genes |
|---|
|
|---|
| Category | Term | Count (n) | P-value |
|---|
| GOTERM_CC_FAT | GO:0042612~MHC
class I protein complex | 3 | 0.00207 |
| GOTERM_MF_FAT |
GO:0016639~oxidoreductase activity, acting
on the CH-NH2 group of donors, NAD or NADP as
acceptor | 2 | 0.00477 |
| GOTERM_MF_FAT | GO:0070728~leucine
binding | 2 | 0.00477 |
| GOTERM_MF_FAT |
GO:0004353~glutamate dehydrogenase
[NAD(P)+] activity | 2 | 0.00477 |
| GOTERM_MF_FAT |
GO:0004352~glutamate dehydrogenase
activity | 2 | 0.00477 |
| GOTERM_CC_FAT | GO:0042611~MHC
protein complex | 3 | 0.00836 |
| GOTERM_CC_FAT |
GO:0015630~microtubule cytoskeleton | 6 | 0.00966 |
| GOTERM_MF_FAT | GO:0001883~purine
nucleoside binding | 10 | 0.01032 |
| GOTERM_MF_FAT |
GO:0001882~nucleoside binding | 10 | 0.01078 |
| GOTERM_BP_FAT |
GO:0006538~glutamate catabolic
process | 2 | 0.01455 |
|
| B, Upregulated ER
target genes |
|
| Category | Term | Count (n) | P-value |
|
| GOTERM_CC_FAT |
GO:0070160~occluding junction | 4 | 0.00086 |
| GOTERM_CC_FAT | GO:0005923~tight
junction | 4 | 0.00086 |
| GOTERM_CC_FAT | GO:0043296~apical
junction complex | 4 | 0.00208 |
| GOTERM_CC_FAT |
GO:0016327~apicolateral plasma
membrane | 4 | 0.00226 |
| GOTERM_CC_FAT | GO:0044459~plasma
membrane part | 13 | 0.00668 |
| GOTERM_CC_FAT | GO:0009898~internal
side of plasma membrane | 5 | 0.00852 |
| GOTERM_CC_FAT | GO:0030054~cell
junction | 6 | 0.00995 |
| GOTERM_CC_FAT |
GO:0005911~cell-cell junction | 4 | 0.01271 |
| GOTERM_BP_FAT | GO:0010324~membrane
invagination | 4 | 0.02042 |
| GOTERM_BP_FAT |
GO:0006897~endocytosis | 4 | 0.02042 |
Discussion
In the present study, 215 DEGs were identified, of
which 126 were upregulated and 89 downregulated. Functional
enrichment analysis indicated that 25% of the DEGs were
significantly enriched in functions associated with the plasma
membrane. Among those DEGs, 105 were possibly regulated by the ER.
Following regulatory network analysis, it was demonstrated that the
ER mainly regulated the expression of oncogenes and tumor
suppressor genes. The DEGs that were regulated by the ER were then
subjected to systematic analysis.
Several DEGs have been demonstrated to be associated
with tumor development, including protease serine 8 (PRSS8),
claudin 7 (CLDN7) and Ras-related protein Rab-25
(RAB25). These three genes were most significantly
upregulated in renal cell carcinoma and may be important in tumor
development.
PRSS8 encodes a trypsinogen protein that belongs to
the trypsin family of serine proteases. Serine proteases are
involved in the regulation of snail family zinc finger 2 and
E-cadherin expression in cancer cells (24,25).
Additionally, the differential expression of PRSS8 has been
identified in prostate, breast, gastric and ovarian cancer cases
(26), and the downregulation of
PRSS8 in these cases of epithelial cancer was attributed to
DNA hypermethylation (27,28). Hence, the upregulation of
PRSS8 by the ER is likely to have enhanced DNA
hypermethylation and led to the regulation of the expression of
genes associated with renal cell carcinoma.
CLDN7 is an integral membrane protein that has been
observed to be differentially expressed in ovarian and esophageal
squamous cell carcinoma cells (29,30).
In a previous study, CLDN7 was demonstrated to be significantly
differentially expressed in ovarian carcinoma, based on CLDN7
expression analysis at the mRNA and protein levels in 110 patients
with epithelial ovarian carcinoma (31). In esophageal squamous cell
carcinoma cells, CLDN7 is often absent or localized to the
cytoplasm, rather than confined to the cell membrane as in normal
esophageal cells (32) In
addition, the dysregulation of CLDN7 may lead to decreased
E-cadherin expression, loss of epithelial architecture and an
increase in the invasion observed in squamous cell carcinoma. This
evidence indicates that CLDN7 may promote tumor development by
disrupting the cell adhesion process.
RAB25 belongs to the RAS superfamily and serves a
crucial function in vesicle trafficking, signal transduction and
receptor recycling (33). RAB25
has been observed to be upregulated in prostate and ovarian cancer,
and is correlated with poor prognosis (34). However, up- and downregulation of
RAB25 has been documented in breast cancer (35). The overexpression of RAB25 may
promote cellular bioenergetics and hence inhibit apoptosis and
autophagy (36). Another study
suggested that RAB25, when combined with the chloride intracellular
channel 3, regulates tumor invasiveness and mediates the recycling
of α5β1-integrin to the plasma membrane from a late endosomal
compartment (37). This evidence
indicates that RAB25 is crucial in determining tumor development,
progression and aggressiveness (38). Therefore, the upregulation of RAB25
in renal cell carcinoma may promote tumor development.
The DEG function analysis conducted in the present
study indicated that the regulatory mechanism of ER in renal cell
carcinoma is complex. The functional enrichment analysis
demonstrated that the ER target genes mainly regulated
transmembrane receptor and protein tyrosine kinase activity, which
may serve a pivotal role in multiple diseases. The transmembrane G
protein-coupled receptors are widely used as drug targets for
various diseases, and particularly for cancer (39). The ER participates in the
regulation of protein tyrosine kinase activity, which is an
important signaling pathway in cell proliferation. The
dysregulation of tyrosine kinases has verified its association with
breast cancer and diverse biological functions (40). Sun et al (41) observed that multiple
proto-oncogenic tyrosine kinases were activated by loss of the
PTPN12 (protein tyrosine phosphatase non-receptor type 12)
phosphatase in breast cancer. Therefore, the regulation of ER
target genes may significantly influence the development of renal
cell carcinoma.
In conclusion, the DEGs regulated by the ER in renal
cell carcinoma were identified and analyzed in the present study.
The interaction network and functional enrichment analysis
demonstrated that the ER regulates the expression of oncogenes and
tumor suppressor genes. Therefore, the present study enhanced the
understanding of the mechanism of the regulation of the ER during
tumor development and may aid in the discovery of predictive
markers for renal cell carcinoma.
References
|
1
|
Gottardo F, Liu CG, Ferracin M, et al:
Micro-RNA profiling in kidney and bladder cancers. Urol Oncol.
25:387–392. 2007. View Article : Google Scholar : PubMed/NCBI
|
|
2
|
Chow TF, Youssef YM, Lianidou E, et al:
Differential expression profiling of microRNAs and their potential
involvement in renal cell carcinoma pathogenesis. Clin Biochem.
43:150–158. 2010. View Article : Google Scholar : PubMed/NCBI
|
|
3
|
Yi ZJ, Fu YR, Zhao SS, et al: Differential
expression of miRNA patterns in renal cell carcinoma and
nontumorous tissues. J Cancer Res Clin Oncol. 136:855–862. 2010.
View Article : Google Scholar : PubMed/NCBI
|
|
4
|
Ljungberg B, Cowan NC, Hanbury DC, et al:
EAU guidelines on renal cell carcinoma: the 2010 update. Euro
Urology. 58:398–406. 2010. View Article : Google Scholar : PubMed/NCBI
|
|
5
|
Janzen NK, Kim HL, Figlin RA, et al:
Surveillance after radical or partial nephrectomy for localized
renal cell carcinoma and management of recurrent disease. Urologic
Clinics of North America. 30:843–852. 2003. View Article : Google Scholar : PubMed/NCBI
|
|
6
|
Kondo K, Yao M, Yoshida M, et al:
Comprehensive mutational analysis of the VHL gene in sporadic renal
cell carcinoma: relationship to clinicopathological parameters.
Genes, Chromosomes and Cancer. 34:58–68. 2002. View Article : Google Scholar : PubMed/NCBI
|
|
7
|
Maxwell PH, Wiesener MS, Chang GW, et al:
The tumour suppressor protein VHL targets hypoxia-inducible factors
for oxygen-dependent proteolysis. Nature. 399:271–275. 1999.
View Article : Google Scholar : PubMed/NCBI
|
|
8
|
Rini BI, Campbell SC and Escudier B: Renal
cell carcinoma. Lancet. 373:1119–1132. 2009. View Article : Google Scholar : PubMed/NCBI
|
|
9
|
Dalgliesh GL, Furge K, Greenman C, et al:
Systematic sequencing of renal carcinoma reveals inactivation of
histone modifying genes. Nature. 463:360–363. 2010. View Article : Google Scholar
|
|
10
|
Varela I, Tarpey P, Raine K, et al: Exome
sequencing identifies frequent mutation of the SWI/SNF complex gene
PBRM1 in renal carcinoma. Nature. 469:539–542. 2011. View Article : Google Scholar : PubMed/NCBI
|
|
11
|
Fiorito E, Katika MR and Hurtado A:
Cooperating transcription factors mediate the function of estrogen
receptor. Chromosoma. 122:1–12. 2013. View Article : Google Scholar : PubMed/NCBI
|
|
12
|
Musgrove EA and Sutherland RL: Biological
determinants of endocrine resistance in breast cancer. Nat Rev
Cancer. 9:631–643. 2009. View
Article : Google Scholar : PubMed/NCBI
|
|
13
|
Harigopal M, Heymann J, Ghosh S,
Anagnostou V, Camp RL and Rimm DL: Estrogen receptor co-activator
(AIB1) protein expression by automated quantitative analysis (AQUA)
in a breast cancer tissue microarray and association with patient
outcome. Breast Cancer Res Treat. 115:77–85. 2009. View Article : Google Scholar
|
|
14
|
Ross-Innes CS, Stark R, Teschendorff AE,
et al: Differential oestrogen receptor binding is associated with
clinical outcome in breast cancer. Nature. 481:389–393.
2012.PubMed/NCBI
|
|
15
|
Ross-Innes CS, Stark R, Holmes KA, et al:
Cooperative interaction between retinoic acid receptor-alpha and
estrogen receptor in breast cancer. Genes Dev. 24:171–182. 2010.
View Article : Google Scholar : PubMed/NCBI
|
|
16
|
Grober OM, Mutarelli M, Giurato G, et al:
Global analysis of estrogen receptor beta binding to breast cancer
cell genome reveals an extensive interplay with estrogen receptor
alpha for target gene regulation. BMC Genomics. 12:362011.
View Article : Google Scholar : PubMed/NCBI
|
|
17
|
Tan MH, Wong CF, Tan HL, et al: Genomic
expression and single-nucleotide polymorphism profiling
discriminates chromophobe renal cell carcinoma and oncocytoma. BMC
Cancer. 10:1962010. View Article : Google Scholar : PubMed/NCBI
|
|
18
|
Gentleman RC, Carey VJ, Bates DM, et al:
Bioconductor: open software development for computational biology
and bioinformatics. Genome Biol. 5:R802004. View Article : Google Scholar : PubMed/NCBI
|
|
19
|
Schwender H, Krause A and Ickstadt K:
Identifying interesting genes with siggenes [J]. The Newsletter of
the R Project. 6:45–50. 2006.
|
|
20
|
Dennis G Jr, Sherman BT, Hosack DA, et al:
DAVID: Database for annotation, visualization, and integrated
discovery. Genome Biol. 4:P32003. View Article : Google Scholar : PubMed/NCBI
|
|
21
|
Fujita PA, Rhead B, Zweig AS, et al: The
UCSC genome browser database: update 2011. Nucleic Acids Res.
39:D876–D882. 2011. View Article : Google Scholar : PubMed/NCBI
|
|
22
|
Shannon P, Markiel A, Ozier O, et al:
Cytoscape: a software environment for integrated models of
biomolecular interaction networks. Genome Res. 13:2498–2504. 2003.
View Article : Google Scholar : PubMed/NCBI
|
|
23
|
Zheng Q and Wang XJ: GOEAST: a web-based
software toolkit for Gene Ontology enrichment analysis. Nucleic
Acids Res. 36:W358–W363. 2008. View Article : Google Scholar : PubMed/NCBI
|
|
24
|
Chen M, Chen LM, Lin CY and Chai KX: The
epidermal growth factor receptor (EGFR) is proteolytically modified
by the Matriptase-Prostasin serine protease cascade in cultured
epithelial cells. BBA-Mol Cell Res. 1783:896–903. 2008.
|
|
25
|
Chen M, Fu YY, Lin CY, Chen LM and Chai
KX: Prostasin induces protease-dependent and independent molecular
changes in the human prostate carcinoma cell line PC-3. Bioch
Biophys Acta. 1773:1133–1140. 2007. View Article : Google Scholar : PubMed/NCBI
|
|
26
|
Chen LM, Verity NJ and Chai KX: Loss of
prostasin (PRSS8) in human bladder transitional cell carcinoma cell
lines is associated with epithelial-mesenchymal transition (EMT).
BMC Cancer. 9:3772009. View Article : Google Scholar : PubMed/NCBI
|
|
27
|
Sakashita K, Mimori K, Tanaka F, et al:
Clinical significance of low expression of Prostasin mRNA in human
gastric cancer. J Surg Oncol. 98:559–564. 2008. View Article : Google Scholar : PubMed/NCBI
|
|
28
|
Chen LM, Zhang X and Chai KX: Regulation
of prostasin expression and function in the prostate. Prostate.
59:1–12. 2004. View Article : Google Scholar : PubMed/NCBI
|
|
29
|
Zhu Y, Brännström M, Janson PO, et al:
Differences in expression patterns of the tight junction proteins,
claudin 1, 3, 4 and 5, in human ovarian surface epithelium as
compared to epithelia in inclusion cysts and epithelial ovarian
tumours. Int J cancer. 118:1884–1891. 2006. View Article : Google Scholar
|
|
30
|
Usami Y, Chiba H, Nakayama F, et al:
Reduced expression of claudin-7 correlates with invasion and
metastasis in squamous cell carcinoma of the esophagus. Hum Pathol.
37:569–577. 2006. View Article : Google Scholar : PubMed/NCBI
|
|
31
|
Tassi RA, Bignotti E, Falchetti M, et al:
Claudin-7 expression in human epithelial ovarian cancer. Int J
Gynecol Cancer. 18:1262–1271. 2008. View Article : Google Scholar : PubMed/NCBI
|
|
32
|
Lioni M, Brafford P, Andl C, et al:
Dysregulation of claudin-7 leads to loss of E-cadherin expression
and the increased invasion of esophageal squamous cell carcinoma
cells. Am J Pathol. 170:709–721. 2007. View Article : Google Scholar : PubMed/NCBI
|
|
33
|
Cheng KW, Lahad JP, Kuo WL, et al: The
RAB25 small GTPase determines aggressiveness of ovarian and breast
cancers. Nat Med. 10:1251–1256. 2004. View
Article : Google Scholar : PubMed/NCBI
|
|
34
|
Calhoun BC and Goldenring J: Rab proteins
in gastric parietal cells: evidence for the membrane recycling
hypothesis. Yale J Biol Med. 69:1–8. 1996.PubMed/NCBI
|
|
35
|
Cheng JM, Volk L, Janaki DK, Vyakaranam S,
Ran S and Rao KA: Tumor suppressor function of Rab25 in
triple-negative breast cancer. Int J Cancer. 126:2799–2812.
2010.PubMed/NCBI
|
|
36
|
Cheng KW, Agarwal R, Mitra S, et al: Rab25
increases cellular ATP and glycogen stores protecting cancer cells
from bioenergetic stress. EMBO Mol Med. 4:125–141. 2012. View Article : Google Scholar : PubMed/NCBI
|
|
37
|
Dozynkiewicz MA, Jamieson NB, MacPherson
I, et al: Rab25 and CLIC3 collaborate to promote integrin recycling
from late endosomes/lysosomes and drive cancer progression. Dev
Cell. 22(1): 131–145. 2012. View Article : Google Scholar : PubMed/NCBI
|
|
38
|
Amornphimoltham P, Rechache K, Thompson J,
et al: Rab25 regulates invasion and metastasis in head and neck
cancer. Clin Cancer Res. 19:1375–1388. 2013. View Article : Google Scholar : PubMed/NCBI
|
|
39
|
Lappano R and Maggiolini M: G
protein-coupled receptors: novel targets for drug discovery in
cancer. Nat Rev Drug Discov. 10:47–60. 2011. View Article : Google Scholar : PubMed/NCBI
|
|
40
|
Mócsai A, Ruland J and Tybulewicz VL: The
SYK tyrosine kinase: a crucial player in diverse biological
functions. Nat Rev Immunol. 10:387–402. 2010.PubMed/NCBI
|
|
41
|
Sun T, Aceto N, Meerbrey KL, et al:
Activation of multiple proto-oncogenic tyrosine kinases in breast
cancer via loss of the PTPN12 phosphatase. Cell. 144:703–718. 2011.
View Article : Google Scholar : PubMed/NCBI
|