Introduction
Traumatic brain injury (TBI), often termed the
‘silent epidemic’ presents significant health challenges due to its
overlooked nature and severe repercussions. Annually, TBI results
in disability for 6–10 million individuals, globally, with ~60% of
survivors developing neurological or psychiatric disorders
(1). This leads to substantial
psychological distress and societal and familial burdens (2). TBI can directly impair brain tissue,
with neuronal injuries and cell death impacting nerve conduction
and leading to cognitive deficits such as impaired memory and
attention (3). Additionally,
vascular damage and blood supply issues can further exacerbate
brain tissue damage (4). Notably,
after injury, inflammatory response imbalances can aggravate
neuronal damage and hinder the repair process, potentially
resulting in long-term functional deficits (5). Psychological conditions, including
depression and anxiety, are also frequent among TBI patients
(6).
The pathophysiology of TBI is multifaceted,
encompassing various cellular and sub-cellular events, such as
trauma response, inflammation, damaged area clearance, neural stem
cell activation, synaptic remodeling and angiogenesis. A crucial
factor in TBI prognosis is the role of glial cells, particularly
microglia. Microglia can phagocytose and break down damaged cells
and neuron fragments to clear the damaged area and maintain
neuroglial homeostasis and neurovascular integrity. However,
prolonged and excessive microglial activation can harm adjacent
healthy neurons. The excessive release of cytokines and chemical
mediators during an overactive inflammatory response can further
harm brain tissue, creating an ‘inflammatory storm’ that
exacerbates brain damage (7,8).
When microglia are activated, they can release neurotoxic chemicals
such as reactive oxygen species, nitric oxide, cyclooxygenase and
excitatory amino acids. These chemicals can exacerbate neuronal
damage or dysfunction, and cell death (9,10).
Transmembrane DNAX-activation protein 12, also known
as TYRO protein tyrosine kinase-binding protein (TYROBP), serves an
important role in the control of inflammatory responses and is
responsible for maintaining a stable neural micro-environment and
preventing neuron death. TYROBP is mostly found in immune cells and
neurons. It is an adapter protein which modulates immune receptor
signal transduction which effects how immune cells and neurons are
activated (11,12). For instance, previous studies have
reported that the abnormal expression of TYROBP in
neurodegenerative diseases, such as Alzheimer's and Parkinson's
disease may relate to disease development and progression (13,14).
TYROBP is also linked to autoimmune encephalitis and other
neuro-immunological diseases. However, the precise role and
mechanism of TYROBP in TBI remains unclear, with research
presenting contradictory results, possibly due to factors like
different experimental models and sample sizes, and disease
complexity (15). The function of
TYROBP may also vary across cell types and neurological conditions,
complicating research interpretations. Further investigation of the
role of TYROBP is essential for understanding neurodegenerative
diseases and inflammatory responses in brain injuries and is
crucial for developing novel therapies, advancing personalized
medicine and overcoming current research limitations.
The present study aims to explore the mechanisms of
the neuroinflammatory response induced by TBI and to investigate
potential therapeutic targets. To elucidate the mechanisms of the
role of TYROBP following TBI, the bioinformatics analysis
identified key signaling nodes centered around TYROBP. These nodes
make up a regulatory network that has an impact on neuronal
ferroptosis, apoptosis and autophagy. After TBI, neurons engage in
paracrine secretion through the CXCL and CCL signaling pathways,
activating microglia. These activated microglia can worsen brain
injury pathology by releasing TNF-a, VEGF and transforming growth
factor β (TGF-β) via the NF-κB pathway. Inhibiting the TYROBP gene
in microglia can decrease this interaction and lower neuron
mortality rates. The present study underscores the role of TYROBP
in TBI and offers novel insights into therapeutic approaches
targeting microglial cells.
Materials and methods
Data sorting and differential
analysis
TBI-related RNA expression profiling micro-arrays
and high-throughput sequencing datasets were sourced from the Gene
Expression Omnibus (GEO) database (https://www.ncbi.nlm.nih.gov/geo). The selection
criterion mandated the use of a mouse model developed via the
controlled cortical impact method, which mimics brain injuries from
impacts or blows similar to those in accidents, traffic collisions,
falls and sports injuries (16).
Studies involving controlled impacts to the cerebral cortex under
craniotomy conditions, employing mechanical, hydraulic or free-fall
shocks, were included. Other modeling techniques; such as,
closed-skull impact and puncture methods, were excluded. The
control group comprised mice subjected to sham surgery involving
craniotomies without brain injury impacts.
Sequencing data was processed on the R project
platform (https://cloud.r-project.org; version
4.3.2). The ‘ComBat’ function from the ‘Surrogate Variable
Analysis’ package was used for dataset integration and batch effect
elimination (17). Samples were
normalized using the ‘normalizeBetweenArrays’ function.
Differential analysis was performed using the ‘DESeq2’ package,
with P<0.05 and log fold change (logFC) >0.5 as significance
thresholds. After batch effect removal, the two microarray datasets
were analyzed using the ‘limma’ package (18). Heat maps were generated via the
‘pheatmap’ function from the ‘ComplexHeatmap’ packages and volcano
maps were created using tools available on the Chiplot website
(https://www.chiplot.online).
Enrichment analysis
Differentially expressed genes related to TBI from
both sequencing and microarray datasets were imported into
MetaScape (https://metascape.org, version
2022-10-01) for comprehensive enrichment analysis (19). This involved pathway and process
enrichment analysis using ontology sources, including the Kyoto
Encyclopedia of Genes and Genomes (KEGG) pathway, Gene Ontology
(GO) Biological Processes, Reactome Gene Sets, Canonical Pathways,
Comprehensive Resource of Mammalian protein complexes (CORUM),
WikiPathways and Protein Analysis Through Evolutionary
Relationships (PANTHER). Analysis was focused on clusters of terms
with P<0.01, a minimum count of 3 and an enrichment factor
>1.5, based on shared characteristics and membership
similarities.
For enhanced insight into term relationships, a
subset of enriched terms was selected and represented in a network
plot generated by MetaScape, highlighting the complex interactions
among them. Terms with a similarity score >0.3 were
connected.
Subsequently, to further investigate the
protein-protein interaction (PPI) within these terms, databases
such as Search Tool for the Retrieval of Interacting Genes/Proteins
(STRING, http://cn.string-db.org/), BioGrid
(https://thebiogrid.org), OmnIPath (https://github.com/saezlab/Omnipath_Cytoscape) and
InWeb IM (http://www.intomics.com/inbio/map) were used. This
process produced a network visualizing the interconnectedness of
proteins and the Molecular Complex Detection (MCODE) algorithm was
applied to identify and emphasize densely interconnected network
components.
Immune infiltration score
RNA sequencing data was converted into Transcripts
Per Million (TPM) format for streamlined analysis. The ‘CIBERSORT’
package in R was used to analyze the types and proportions of
immune cell infiltration in brain tissue. For data visualization,
the ‘ggpubr’ package was used. The degree of immune infiltration of
each sample was assessed using the Estimation of Stromal and Immune
cells in Malignant Tumours using Expression data (ESTIMATE)
score.
The sequencing dataset was classified into two main
groups based on treatment, the TBI group and the Sham operation
group. The dataset was further divided based on detection time
after treatment, resulting in three distinct time-frames, 1 week, 1
month and 3 months. Additionally, the data was categorized by
tissue type, including the cortex, thalamus, hypothalamus and
hippocampus. Statistical significance between these groups was
determined using unpaired Student's t-test.
Weighted gene co-expression network
analysis (WGCNA)
Inflammatory responses following brain trauma
involve multiple immune-related genes. WGCNA was used to find the
gene group that was most linked to neuroinflammation after brain
injury and to explain key immune mechanisms (20).
The ‘WGCNA’ package in R was used to load and clean
the data, remove missing values, outliers and duplicates, compare
visual phenotypic data with gene expression data, build a sample
clustering tree, create a network and find modules, chose the
correct soft threshold and average connectivity, linked modules to
phenotypic data, and identify the gene set most relevant to the
immune response.
The ‘blockwiseModules’ function in WGCNA was used
for efficient network construction and module detection in large
gene datasets. To identify the genes important for immune
regulation for TBI, a PPI network was constructed from the gene set
that WGCNA identified in the STRING database, the interaction score
requirement was set to high confidence, selecting key genes with a
node degree ≥5 for further cluster analysis.
Cell death
From the GSEA database (https://www.gsea-msigdb.org) we selected five gene
sets related to cell death, including apoptosis
(ALCALA_APOPTOSIS.v2022.1.Hs), necrosis (GOBP_NECROSIS.v2022.1.Hs),
autophagy (GOBP_AUTOPHAGY.v2022.1.Hs), ferroptosis
(WP_FERROPTOSIS.v2022.1.Hs) and pyroptosis
(GOBP_PYROPTOSIS.v2022.1.Hs). These selections were informed by
validated literature and expert insights. In the present analysis
of experimental data using GSEA software, gene sets demonstrating
statistically significant enrichment were focused on, thus ensuring
the scientific integrity and quality of the selection process.
Using the different levels of expression of these
gene sets in the sequencing data, five different cell death scores
after TBI were assigned. These scores compared the extent and type
of cell death between the Sham and TBI groups. Additionally, the
TBI group samples were subdivided by detection time and tissue type
for comparative analysis using cell death scores. Unpaired
Student's t-test was used to assess the statistical significance of
differences across these groups.
Cluster analysis
The aim of the cluster analysis was to divide TBI
samples into groups based on the immune-related gene set that was
found, allowing a link between immune-related genes and cell death
scores to be established. This analysis employed the
‘ConsensusClusterPlus’ package (21) on the R project platform.
Firstly, the gene matrix was normalized then the
‘ConsensusClusterPlus’ function was used for consistent clustering.
This process included constructing cluster consensus and
item-consensus matrices, followed by generating visual
representations of these matrices.
In the final step, a box plot to represent different
groups and their respective cell death modes was created. Unpaired
Student's t-test was used to evaluate statistical significance in
variations in cell death among these groups.
Single-cell sequencing analysis
Three single-cell sequencing datasets relevant to
TBI (GSE180862, GSE160763 and GSE101901) were downloaded from the
GEO database. These datasets underwent quality control, adhering to
the specific criteria that feature RNA (count) must be >200 but
<2,500, and mitochondrial content must be <5%.
These datasets were combined using the ‘merge’
function, then the Harmony method (https://github.com/immunogenomics/harmony; version
1.2.0) was applied to reduce batch effects. For dimensionality
reduction, the t-distributed stochastic neighbor embedding (tSNE)
method was used. The ‘monocle2’ package (22) was used to create a time-series
analysis of microglia in the TBI group to better understand the
role of microglia subgroups in TBI.
This approach to comparing expression differences
among various cell clusters in single-cell data included conducting
gene set variation analysis (GSVA). The RNA of all cells in each
cluster was averaged using the ‘AverageExpression’ package,
representing the gene expression profile for each cluster.
Subsequently, GSVA was then used to explore variations in
biological processes among clusters, with results presented as heat
maps. Using the ‘plot_genes_in_pseudotime’ function, gene
expression pseudotime plots were also made to assess the role of
immune cell surface activating receptors after TBI.
The remaining data sorting procedures followed the
standard protocol of the ‘Seurat’ package (23). The ‘FeaturePlot’ function was used
to generate visual charts that integrated single-cell expression
profiles with Uniform Manifold Approximation and Projection (UMAP),
which provided a clear display of the expression of the genes of
interest in various cell types. Conversely, the ‘VlnPlot’ function
presented a quantitative view of gene expression in each cell type,
enabling more effective comparisons.
The seven key immune node genes previously
identified with WGCNA and the STRING database are crucial in the
pathology of TBI. It is vital to locate and analyze them at the
cellular level. The ‘FeaturePlot’ function was applied to
illustrate the distribution of key immune node genes across cells
and the ‘VlnPlot’ function was applied to create a violin plot of
key node gene distribution differences.
GSVA was used to evaluate gene expression
differences between the Sham and TBI groups. This was followed by
enrichment analysis using the KEGG dataset.
Finally, the ‘SCENIC’ package was employed to
identify transcription factors that regulate gene expression
changes in brain tissue following TBI, uncovering key roles and
mechanisms.
Cell-cell communication analysis
For the cell communication analysis, the ‘CellChat’
package (24) on the R project
platform was used. The sorted single-cell data was classified into
two groups, the Sham group and the TBI group. From these, the gene
expression matrix and meta data were extracted. The
‘createCellChat’ function was then used to construct the CellChat
object for further analysis.
After loading the CellChatDB-mouse database
(http://www.cellchat.org), the ‘Secret Signaling’
sub-database was used to study intercellular communication. The
established CellChat procedure was followed for subsequent steps.
To facilitate comprehensive analysis, the ‘mergeCellChat’ function
was employed to consolidate the two CellChat datasets.
Furthermore, the ‘compareInteractions’ function was
used to evaluate the quantity and intensity of interactions between
the Sham and TBI group. The changes in communication between innate
immune cells and central nervous system cells were highlighted. The
‘RankNet’ function, a ranking-based neural network model, was used
to compare intercellular communication pathways between the Sham
and TBI groups. This method allowed the identification and
quantification of differences in signaling dynamics between the two
groups, showcasing the effects of TBI on cellular communication.
The ‘NetVisual_diffInteraction’ function was used to demonstrate
the differences in cell communication in the TBI group compared
with the Sham group.
To provide a detailed view of the inferred
intercellular communication network for each signaling pathway or
ligand-receptor pair, a hierarchy plot was made using the
‘netVisual_individual’ function. Here the directional and strength
changes in CCL pathway signal transduction were analyzed. The
‘identifyCommunicationPatterns’ function was applied to understand
how certain cell populations and signaling pathways interacted.
In the present study, the ‘netAnalysis_river’
function was utilized to create a Sankey diagram that provided a
visually intuitive representation of the data, illustrating the
associations and interactions among genes within different cell
groups and how these contribute to the overall communication
network in the datasets of the TBI group.
Mechanical injury method to establish
an in vitro TBI model
To model TBI in vitro, two distinct
co-culture systems were developed, a non-contact co-culture,
designed to assess microglial cell activation, and a contact
co-culture system, aimed at evaluating neuronal cell survival.
These systems allowed the assessment of microglial cell activation
states and neuronal cell apoptosis ratios. In the non-contact
system, RAW264.7 cells, a type of mouse mononuclear macrophage
leukemia cell, can mimic the polarization, phagocytosis, and
cytokine secretion functions of various macrophage subtypes,
including microglia. (cat. no. CL-0481; Procell Life Science &
Technology Co., Ltd.), and PC12 cells, which are rat
pheochromocytoma cells of the adrenal gland capable of
differentiating into neuron-like cells (cat. no. CL-0190; Procell
Life Science & Technology Co., Ltd.), were cultured in a
Transwell culture dish. The cells were arranged in a 1:5 ratio with
RAW264.7 cells on the lower layer and PC12 cells on the upper
layer, separated by a polycarbonate membrane with 3 µm pores.
Conversely, the contact co-culture system involved directly mixing
the two cell types in a 1:5 ratio and seeding them together in the
culture dish. Cells were cultured in high-glucose DMEM medium (cat.
no. SH30023; Univ-Bio, Inc.), supplemented with 1% penicillin, 1%
streptomycin and 10% fetal bovine serum (cat. no. SH30406;
Univ-Bio, Inc.), and incubated at 37°C in a 5% CO2
environment for 24 h to promote adhesion and growth.
In order to create a TBI cell model after growth,
the mechanical injury model as previously described by Liu et
al (25) was used. This
involved mechanically injuring the PC12 cells to trigger activation
in the RAW264.7 cells. Specifically, sterile pipette tips (0.5–10
µl; cat. no. 4901; Corning, Inc.) were used to scratch the PC12
cells manually, 11 scratches per 6-well culture dish were made,
forming a grid measuring 3×3mm. During this process, the culture
medium was not changed. Cells without scratches served as controls.
The dishes were then returned to the incubator for further
cultivation.
After 24 h, RAW264.7 cells were collected from a
non-contact co-culture by aspirating the medium, detaching them
with 0.25% trypsin-EDTA (cat. no. 25200056), neutralizing with
serum-rich medium, centrifuging at 300 × g for 5 min at 4°C and
resuspending the pellet for analysis. In the contact co-culture
system, the initial step involved treating the culture medium with
a low concentration of trypsin-EDTA (0.05%; cat. no. 25300054) for
1 min. This procedure aimed to selectively detach the more loosely
adherent PC12 cells, facilitating their separation from the
co-cultured cells with minimal disruption.
Cell experiments and grouping
Cells were grouped into five different treatment
groups as follows: The natural control group (NC group); the TBI
model group (TBI group); the empty plasmid (EMP group) group; the
TYROBP gene knockout group (TYROBP group) and the negative control
group (TPCA1 group). TPCA-1, is a highly effective and selective
IKK-2 inhibitor, which inhibits IKK-2, a key kinase in activating
NF-κB. This inhibition is important for controlling inflammatory
and immune responses (26). In the
NC group, cells were cultured in an ideal environment without any
mechanical damage to the PC12 cells. The TBI group used mechanical
cutting to establish the TBI model. In the non-contact co-culture
system, only the underlying PC12 cells were mechanically damaged,
whereas in the contact co-culture system, both cell types were
subjected to mechanical damage. For the TYROBP group, RAW264.7
cells, in which the TYROBP gene had been knocked out using
CRISPR-Cas technology, were used alongside the same PC12 cell line.
The EMP group, serving as a control, used RAW264.7 cells
transfected with an empty plasmid.
Gene knockout
The knockout of the TYROBP gene was performed using
plasmids (TYROBP-KO guide RNA (gRNA) in
pCRISPR-Cas9-U6-gRNA-CMV-Cas9-2A-Puro-RFP Vector; target sequence:
100 ACGGAAGAACAGTCGCATCT; TYROBP-Exon-1, corresponds to the ITAM
domain) purchased from Applied Biological Materials Inc (cat. no.
48895114). Any empty vector control (EMP) group, using a blank
plasmid with Cas9 and non-specific gRNA was used as a control.
RAW264.7 cells in the logarithmic growth phase were cultured in a
12-well plate. When cell density reached 70–80%, the complete
culture medium was replaced with serum-free culture medium. Mixed
plasmids, including three different genomic DNA constructs designed
for specific gene targeting, were transfected into the RAW264.7
cells using Lipofectamine 3000 (cat. no. L3000015; Thermo Fisher
Scientific, Inc.) according to the manufacturer's instructions, and
after a series of subsequent screenings, the plasmid that
demonstrated the most effective gene modulation was selected for
further experimentation. The transfection status was assessed under
a fluorescence microscope 24 h after transfection. To isolate
single clone cell strains with the TYROBP gene knockout, the
culture medium was supplemented with 1.0 mg/l puromycin.
qPCR analysis demonstrated a 91% reduction in TYROBP
mRNA levels following gene knockout and western blotting
demonstrated a marked decrease in TYROBP protein expression levels,
these results indicated the substantial and specific effect of the
gene knockout. In the EMP group, TYROBP mRNA and protein levels
demonstrated no apparent difference compared to the untransfected
negative control (NC), which indicated that the transfection
process alone had no effect on TYROBP expression.
Reverse transcription-quantitative
polymerase chain reaction (RT-qPCR)
Total RNA of RAW264.7 cells was extracted using
TRIzol® reagent (cat. no. 15596026; Thermo Fisher
Scientific, Inc.) and reverse-transcribed into cDNA using the
BeyoRT TM III First Strand cDNA Synthesis Kit. The experiment was
conducted according to the manufacturer's protocol. qPCR was
performed using a real-time fluorescence quantitative PCR
instrument (QuantStudio™ 5 Dx; Thermo Fisher Scientific, Inc.) and
the PowerUPTM SYBRTM Green Master Mix kit (Thermo Fisher
Scientific, Inc.; cat. no. A25743). The PCR reaction system was 10
µl in total, including 4 µl cDNA, 5 µl SYBR Green Mix and 0.5 µl of
each primer. The PCR conditions were as follows: Initial heating at
50°C for 2 min then initial denaturation at 95°C for 2 min;
followed by 40 cycles of denaturation at 95°C for 15 sec, annealing
at 60°C for 1 min, and extension at 72°C for 30 sec. mRNA levels
were quantified using the 2−ΔΔCq method (27) and normalized to GAPDH, which was
used as the internal reference gene. The primer sequences for qPCR
were obtained from the PrimerBank database (https://pga.mgh.harvard.edu/primerbank) and validated
in experiments (Table SI).
Western blotting
After 24 h of co-culture, RAW264.7 cells were
collected from the Transwell chamber and total proteins were
extracted using RIPA lysis buffer (Thermo Fisher Scientific, Inc.;
cat. no. 89900). Proteins were separated by SDS-PAGE and
transferred onto a PVDF membrane, which were then incubated with
primary antibodies for NF-kB p65 (1:700; Affinity Biosciences; cat.
no. AF5006), Phospho-NF-kB p65 Ser536 (1:500; Affinity Biosciences;
cat. no. AF2006), TYROBP (1:1,000; Abcam; cat. no. ab280568) and
GAPDH (1:500; Affinity Biosciences; cat. no. AF7021) overnight at
4°C. The membrane was then treated with a horseradish
peroxidase-conjugated secondary antibody (1:1,000; Affinity
Biosciences; cat. no. S0001) for 2 h at room temperature. After
washing with PBS, the membrane was developed in an X-ray film
cassette, and the films were scanned and analyzed using QuantityOne
software (version 4.6.8; Bio-Rad Laboratories, Inc.). GAPDH was
used as the loading control for normalizing target protein
expression. Each experiment was performed in triplicate.
Immunofluorescence
RAW264.7 cells from the Transwell chamber were fixed
in a chilled methanol-acetone mixture (1:1; 4°C; 1 h) and
permeabilized with a 0.5% Triton X-100/PBS solution. After rinsing,
the cells were incubated overnight at 4°C with NF-κB primary
antibodies (1:1,000; Affinity Biosciences; cat. no. AF5006). The
cells were washed with PBS, then treated with an Alexa
Fluor® 488-conjugated secondary antibody (1:100; Abcam;
cat. no. ab150077) at room temperature for 1 h. DAPI was used for
nuclear staining and incubated with the cells for 5 min at room
temperature. Finally, an anti-fade mounting agent (Beijing Solarbio
Science & Technology; cat. no. S2100) was added and images were
captured using a fluorescence microscope.
Enzyme-linked immunosorbent assay
(ELISA)
Following the co-cultivation of RAW264.7 and PC12
cells, the cell culture supernatant was collected and centrifuged
(4°C; 300 × g; 10 min) to remove cell debris. The resulting
supernatant samples were diluted and used directly for the ELISA
assays of TNF-α, CXCL8 and CCL2 using Mouse SimpleStep
ELISA® kits (Abcam; cat. nos. ab208348, ab46032 and
ab100777). Freshly prepared, diluted standards for each protein
were used in each experiment. Standards and samples were added to
the antibody-pre-coated micro-plate wells, followed by the
introduction of the corresponding antibody cocktail, and incubated
at room temperature. Several washing steps were performed to remove
unbound materials. Next, 3,3′,5,5′-Tetramethylbenzidine (TMB)
substrate was added, and the mixture was incubated in darkness. The
reaction was stopped with Stop Solution, and the absorbance was
measured using a micro-plate reader. A standard curve, generated
from the absorbance of the standards, was used to determine the
concentrations of TNF-α, CXCL8 and CCL2 in the samples. All
experiments were duplicated to ensure data reliability and
consistency. Protein expression levels were calculated, with each
experiment independently replicated six times. All experiments were
conducted strictly according to the manufacturer's
instructions.
Cell counting assay
A Cell Counting Kit-8 (CCK-8) assay (cat. no.
E-CK-A362; Elabscience Biotechnology, Inc.) was used to measure the
survival rate of neuronal cells after a TBI. PC12 cells and
RAW264.7 cells were co-cultured in a 5:1 ratio in a 96-well plate,
with each well containing 5×10³ cells. Cells were
incubated for 24 h, then a mechanical transection method was used
to mimic TBI, and the cells cultured for 24 h (37°C; 5%
CO2). Then, 10 µl of CCK-8 solution was added to each
well and incubated for 1 h at 37°C. Absorbance (OD) at 450 nm was
measured using a Thermo Fisher Scientific, Inc. micro-plate reader.
The average OD of six control wells was used as the reference for
100% cell survival. Blank wells (with culture medium but no cells)
were also included as a control. Cell viability was calculated as
follows: (sample OD-blank OD/control OD-blank OD) × 100. Each
experiment was independently replicated six times.
Annexin V/PI cell apoptosis assay
The annexin V/PI cell apoptosis assay uses the
combination of annexin V and Propidium Iodide (PI) for staining,
which distinguishes between apoptotic and necrotic cells in a cell
population. The FITC Annexin V Apoptosis Detection Kit I (cat. no.
556547; BD Biosciences) was used according to the manufacturer's
instructions. Briefly, PC12 and RAW264.7 cells were harvested after
24 h of co-culture, the medium from six-well plates was discarded
and the cells washed thrice with cold 1X PBS, then the cells were
resuspended and a suspension of one million cells in 100 µl 1X
binding buffer was prepared. A total of 5 µl each of annexin V and
PI was added to the suspension, followed by a 30 min incubation in
the dark at room temperature before the suspension volume was
adjusted to 500 µl with 1X binding buffer. Analysis was performed
within 1 h using BD FACSCalibur™ Flow Cytometer (BD Biosciences),
ensuring the cells remained in the dark until assessment. Data were
processed using FlowJo (version 10.8.1; Becton, Dickinson and
Company). Untreated cells were identified on the Forward
Scatter-Side Scatter plot, and the proportion of cells in each
quadrant was calculated.
Statistical analysis
Data analysis and graph plotting were performed
using GraphPad 9.0 software (Dotmatics). All experiments were
independently repeated six times. Quantitative data, adhering to a
normal distribution, were expressed as mean ± standard deviation.
Comparisons between two groups were performed using an unpaired
t-test, while multiple group comparisons were performed with
one-way ANOVA, followed by post hoc pairwise comparisons with the
Bonferroni test. P<0.05 was considered to indicate a
statistically significant difference.
Results
Data sorting and difference
analysis
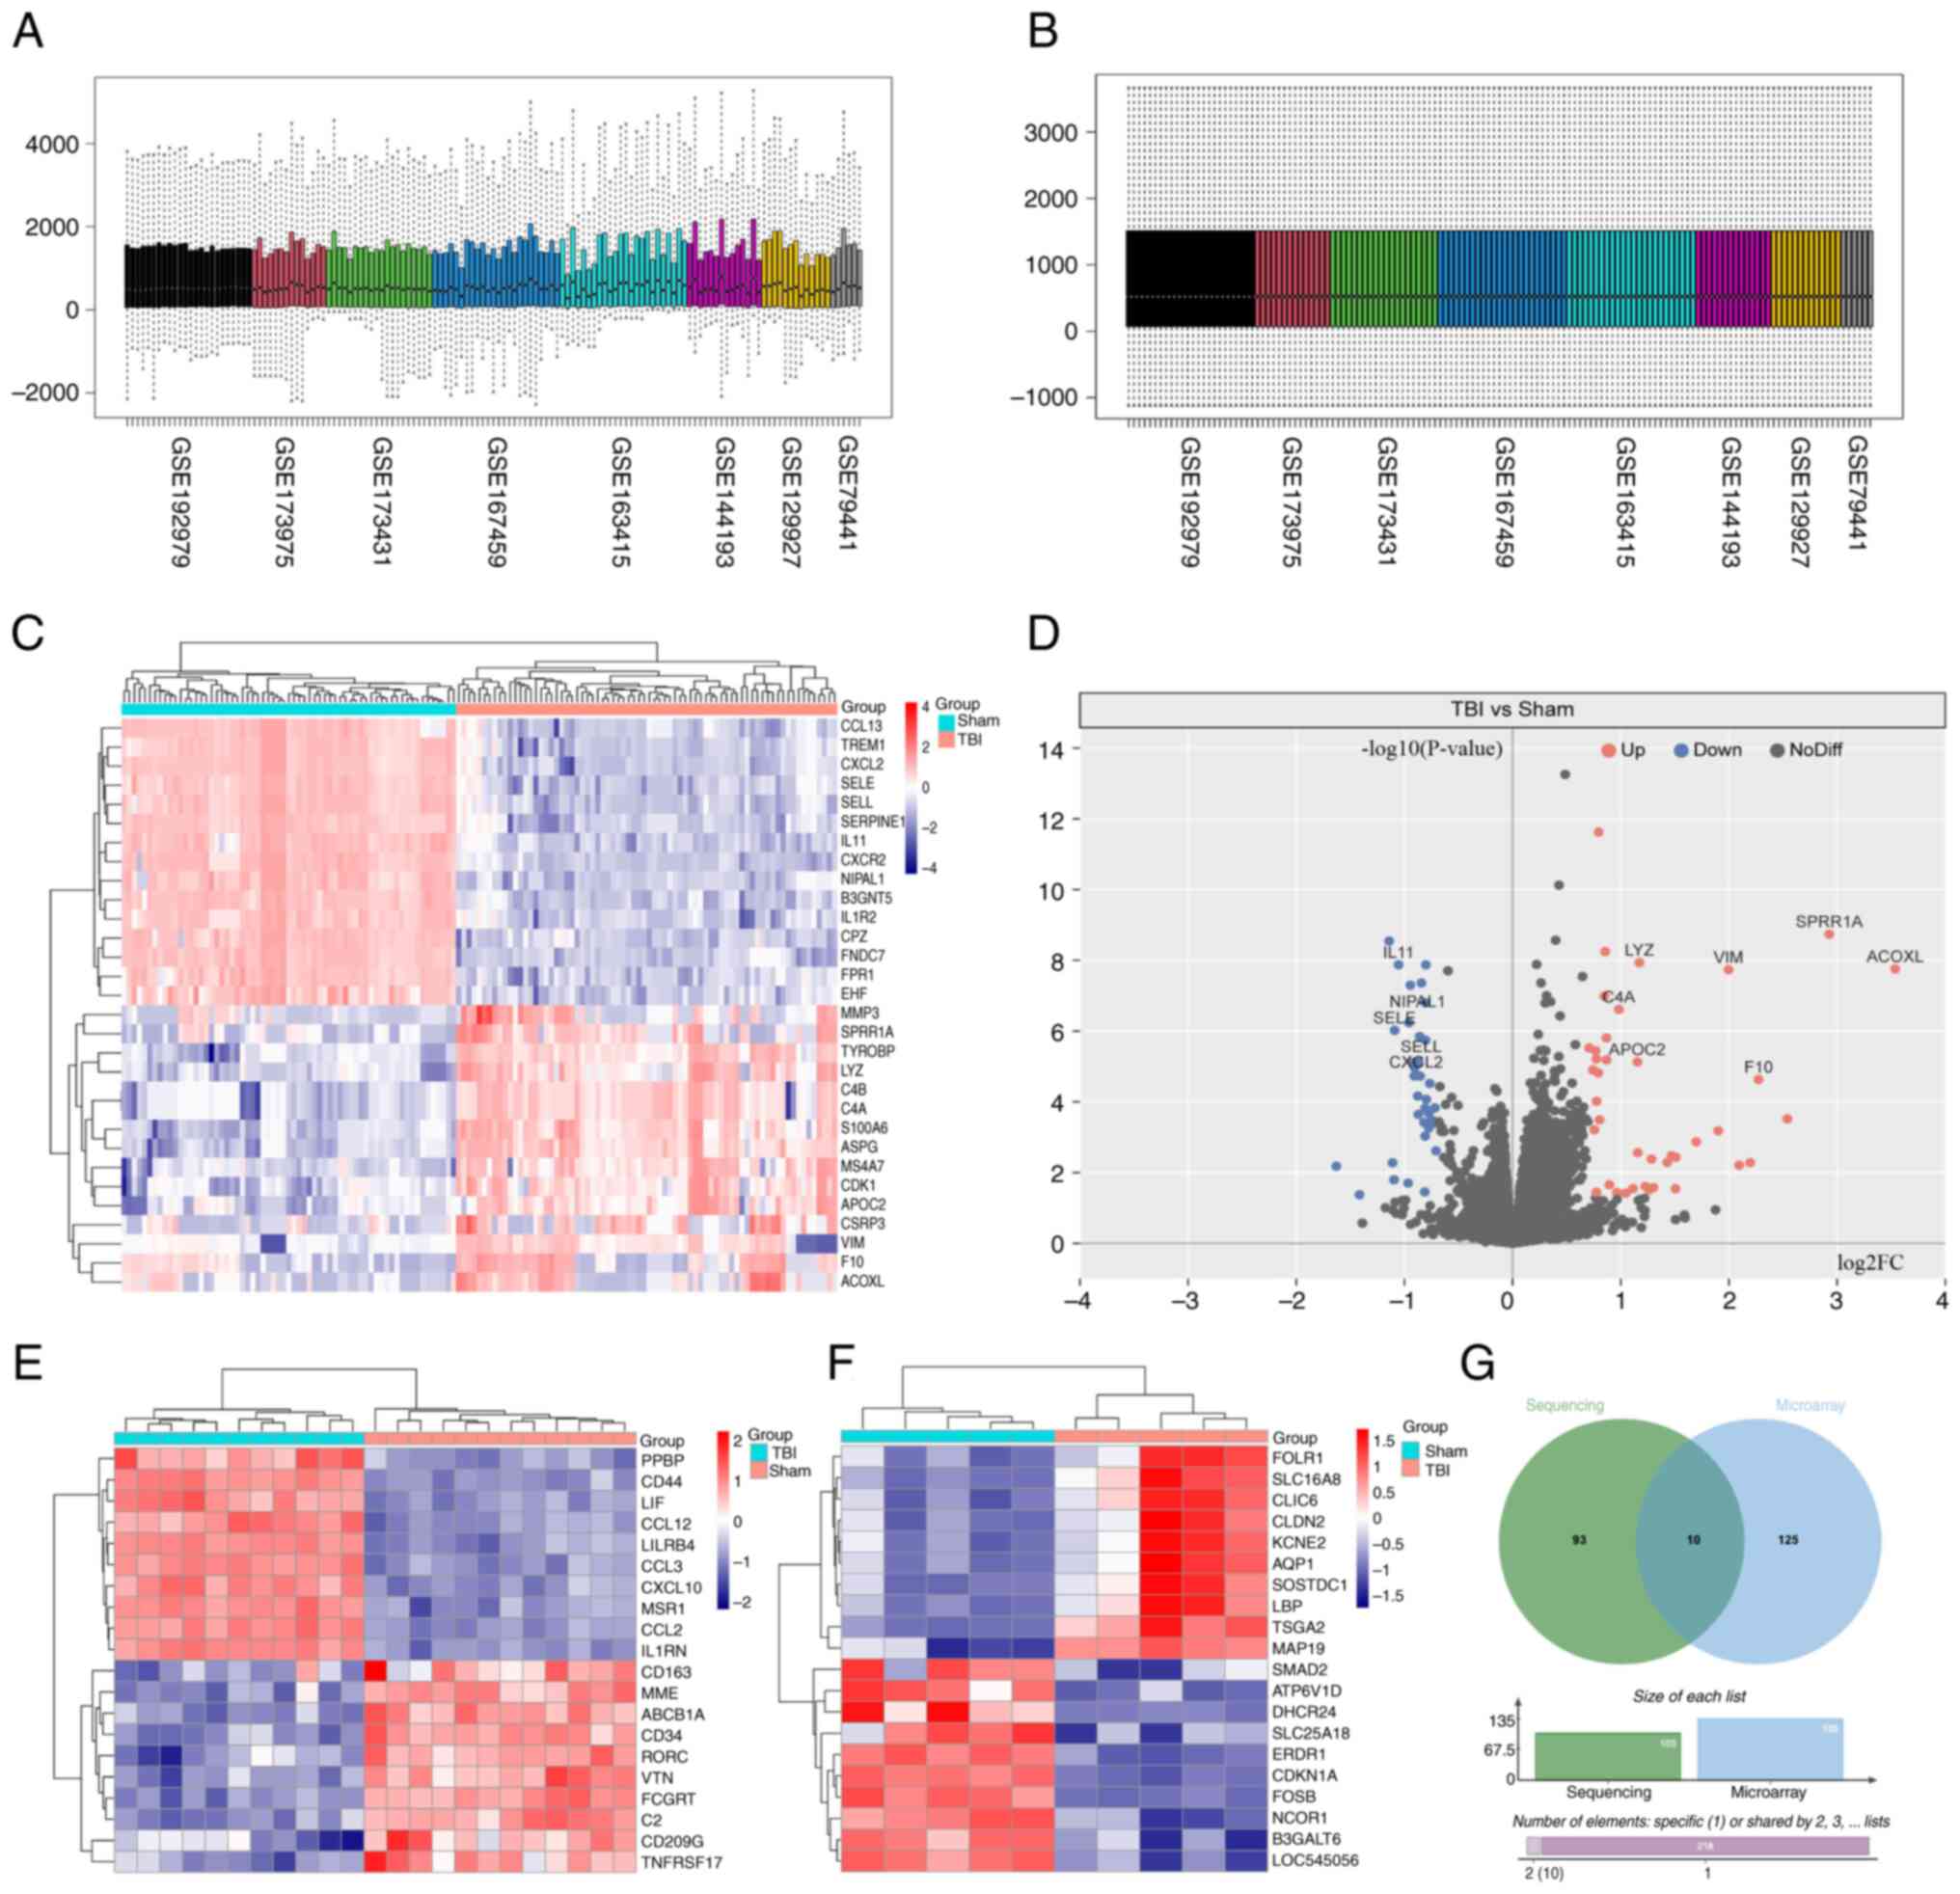
Eight RNA sequencing datasets (GSE192979, GSE173975,
GSE167459, GSE163415, GSE173431, GSE144193, GSE129927 and GSE79441)
and two microarray datasets (GSE180811 and GSE71846) (Table SII) were converted to a count
format for differential analysis. Batch effects arising from
differences in experimental conditions lead to variations in total
RNA expression levels among different samples in the original data,
making direct comparisons between datasets challenging (Fig. 1A). After applying standardization
techniques, the total expression levels across all samples became
uniform, eliminating disparities and enabling accurate comparisons
(Fig. 1B). The purpose of this
correction was to ensure that subsequent analyses accurately
reflected true biological differences between samples, eliminating
biases introduced by experimental variability.
Differential analysis using the ‘DESeq2’ package
identified 103 differentially expressed genes in the RNA sequencing
datasets, with 40 genes down-regulated and 63 up-regulated after
brain trauma. A notable difference in gene expression was
demonstrated in CCL13, TREM1, CXCL2 and SELE between the Sham and
TBI groups (Fig. 1C and D).
Analysis of the two microarray datasets using the
‘limma’ package identified 135 differentially expressed genes. The
top 10 genes have already been displayed such as PPBP, CD77, LIF
and CCL12 (Fig. 1E and F).
Furthermore, ten genes were differentially expressed in both the
RNA sequencing and microarray datasets, namely: CCL13, CXCL2,
MARCO, IL1R2, CXCR2, SELL, TREM1, C4A, C4B and S100A8 (Fig. 1G).
These gene expression changes highlight the complex
immune and inflammatory responses induced by TBI, particularly
impacting microglial cells. The upregulation of activating
receptors such as TREM1, MARCO, IL1R2 and CXCR2 suggests activation
and recruitment of microglia, monocytes and macrophages, essential
for clearing damaged tissue and initiating repair. The increased
expression of adhesion molecules and chemokines such as SELL, CXCL2
and CCL13 suggests the migration of immune cells to the injured
brain tissue. C4A and C4B RNA expression are associated with
complement system activation, which contributes to tissue clearance
and infection defense. Likewise, the RNA expression of S100A8, by
stimulating Toll-like receptors on microglial cells, serves a role
in mediating inflammatory signal transduction.
Enrichment analysis
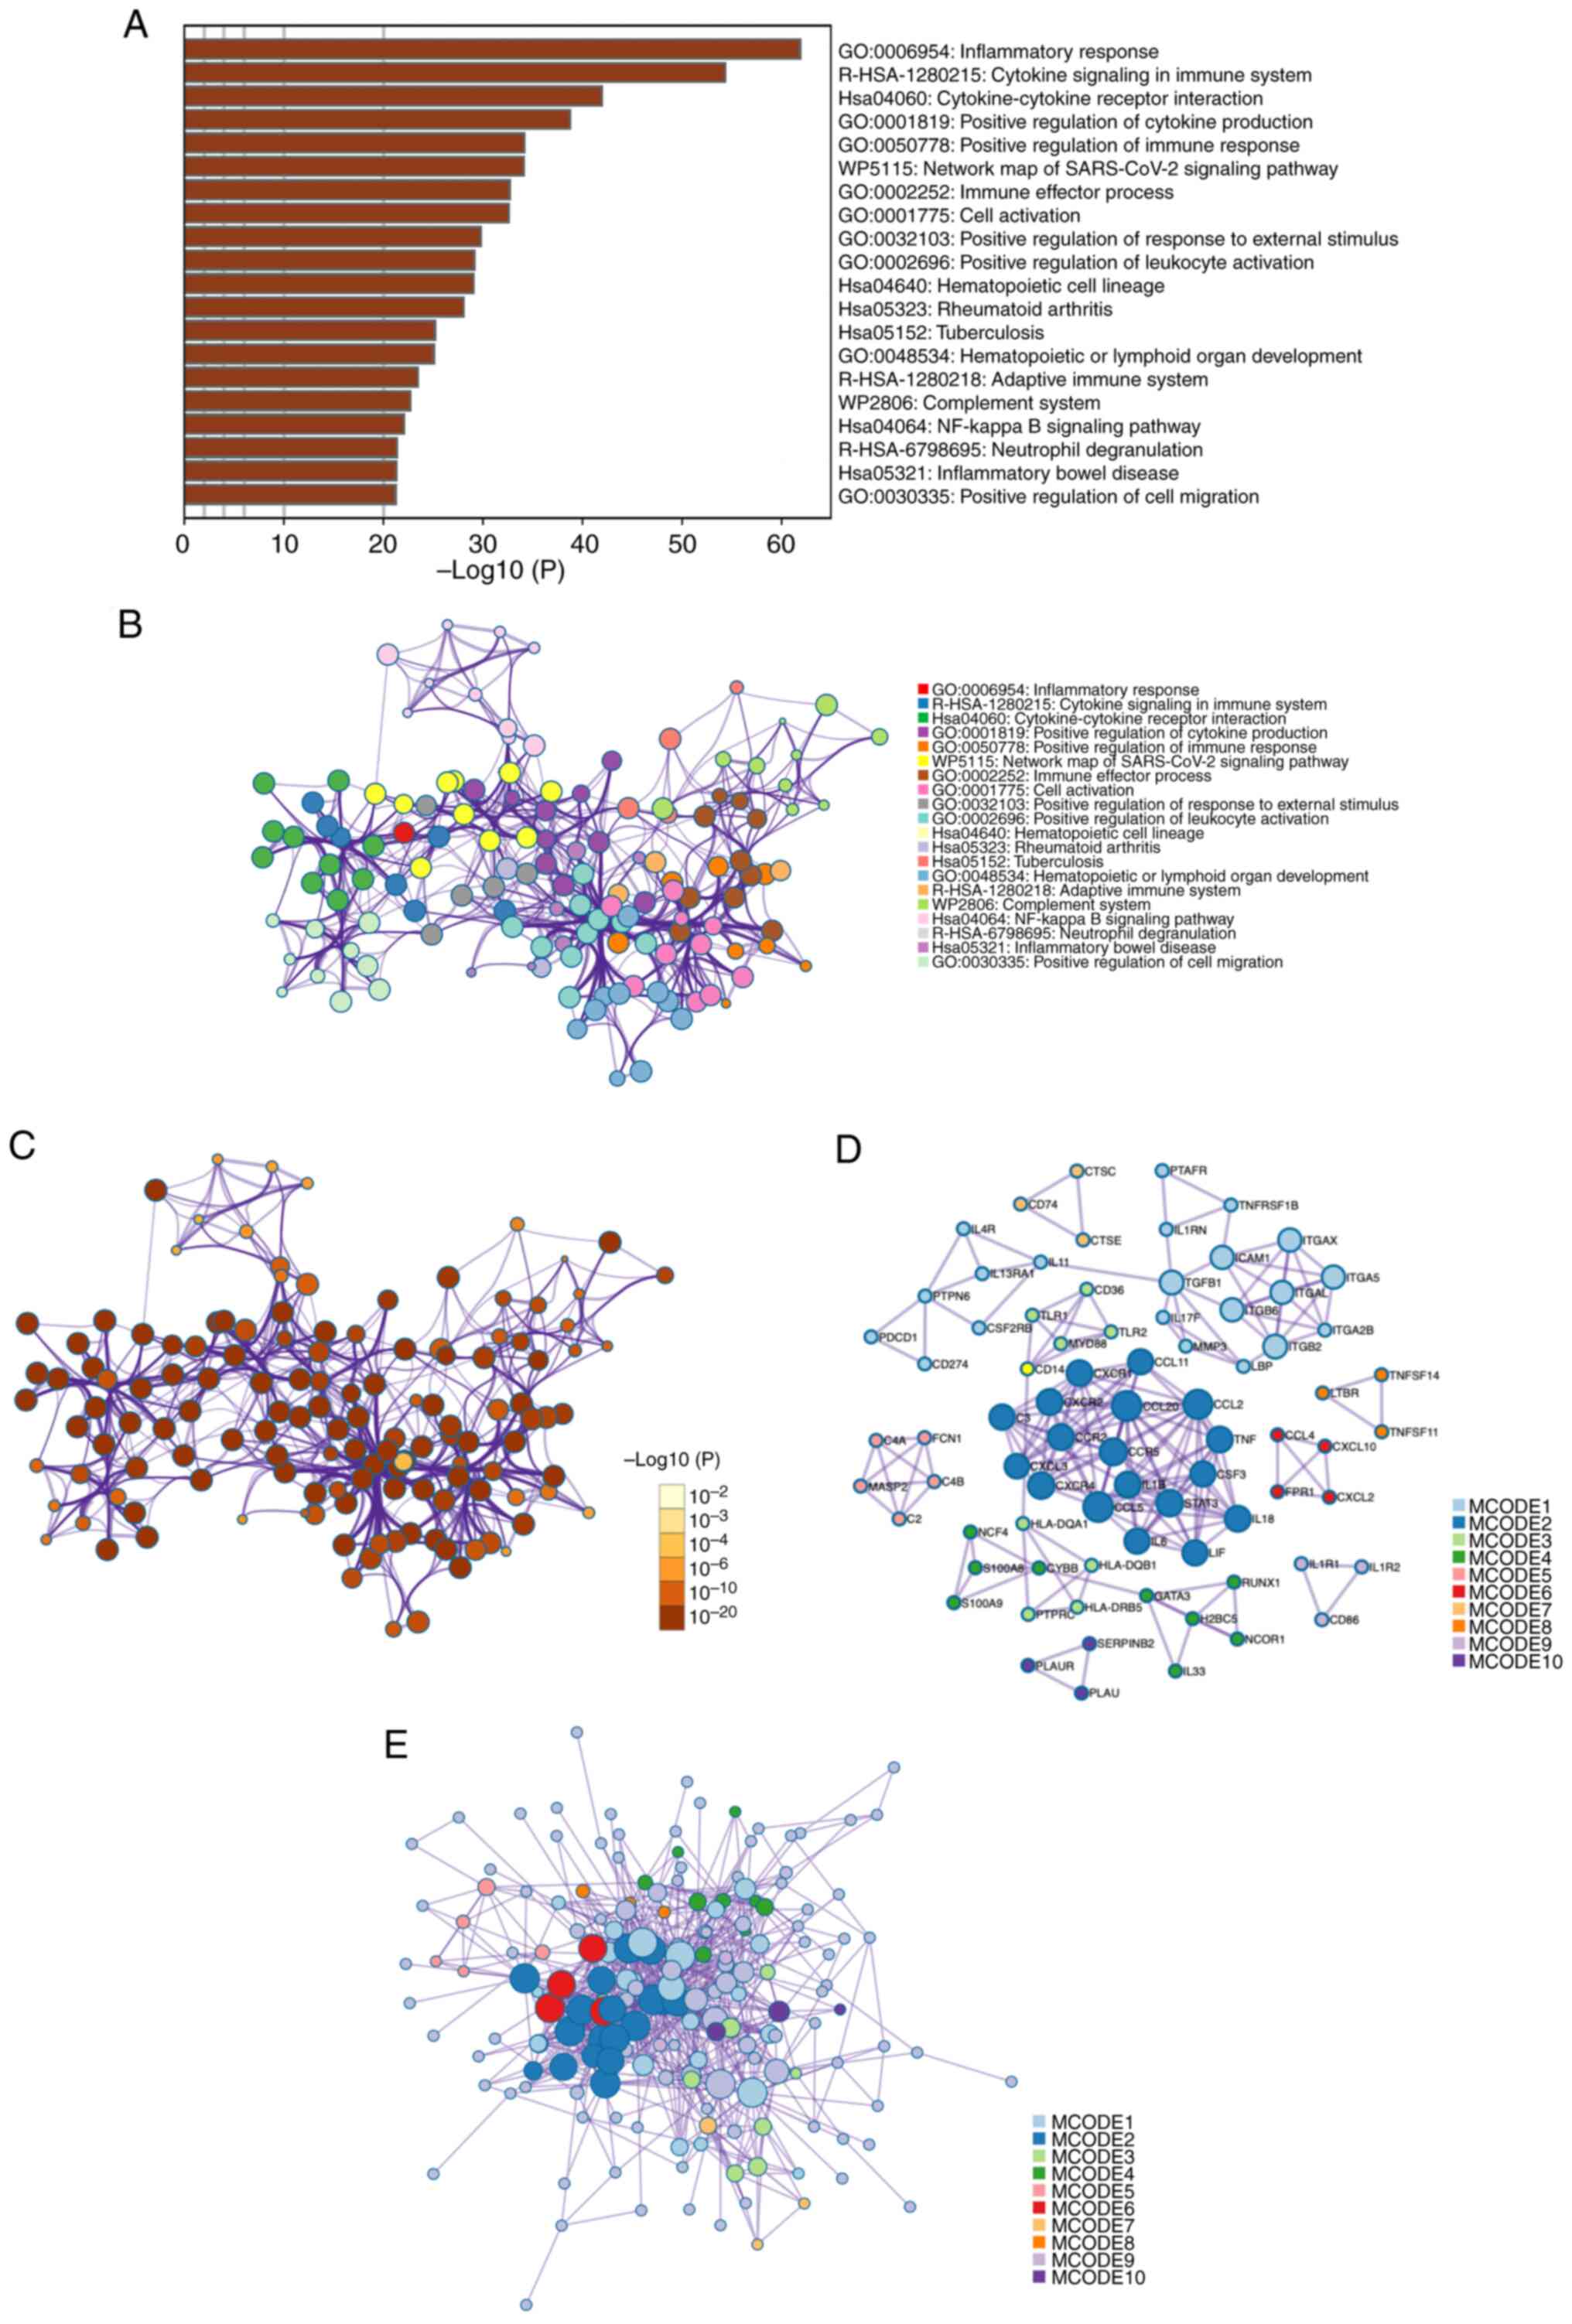
Metascape enrichment analysis demonstrated the most
significantly associated pathways with the differentially expressed
gene set from the previous analyses were: ‘inflammatory response’
(GO: 0006954); ‘cytokine signaling in immune system’
(R-HSA-1280215); ‘Cytokine-cytokine receptor interaction’
(hsa04060) and ‘positive regulation of cytokine production’ (GO:
0001819) (Fig. 2A). These findings
show that many immune response pathways are activated after a TBI.
They also show how important cytokine-mediated intercellular
communication is for inflammation.
An enriched-term network was constructed to more
effectively visualize the connections between each signaling
pathway. Key nodes such as ‘positive regulation of response to
external stimulus’ and ‘positive regulation of leukocyte
activation’ were identified as crucial due to their central roles
in the network. This highlighted their significance in regulating
biological processes and disease states, especially in immune
response and activation. Through this network analysis, researchers
can better understand complex biological mechanisms and identify
potential intervention points. Notable were the enrichments related
to the NF-κB signaling pathway and neutral degranulation (Fig. 2B), because they are key to
understanding how cells respond to external stimuli and regulate
immune responses. Network nodes were color-coded by P-values in a
further visualization, which demonstrated the statistically
significant difference of most terms (Fig. 2C).
PPI enrichment analysis was performed to evaluate
the interactions among differentially expressed genes at the
protein level. Using the MCODE algorithm, the PPI network nodes
were divided into ten modules, ranked by importance. This ranking
was determined by considering various factors such as the density
of connections among genes within a module, the size of the module,
and its overall connectivity to key differentially expressed genes
identified in the present study. For example, Module 1 involved
signaling by interleukins, and Module 2 included cytokine-cytokine
receptor interaction (Fig. 2D and
E).
These analyses indicated that the inflammatory
response predominated after brain injury. This involves varied
intercellular signaling within the micro-environment of the nervous
system, immune cell accumulation and activation of inflammatory
pathways such as NF-κB.
Immune infiltration score
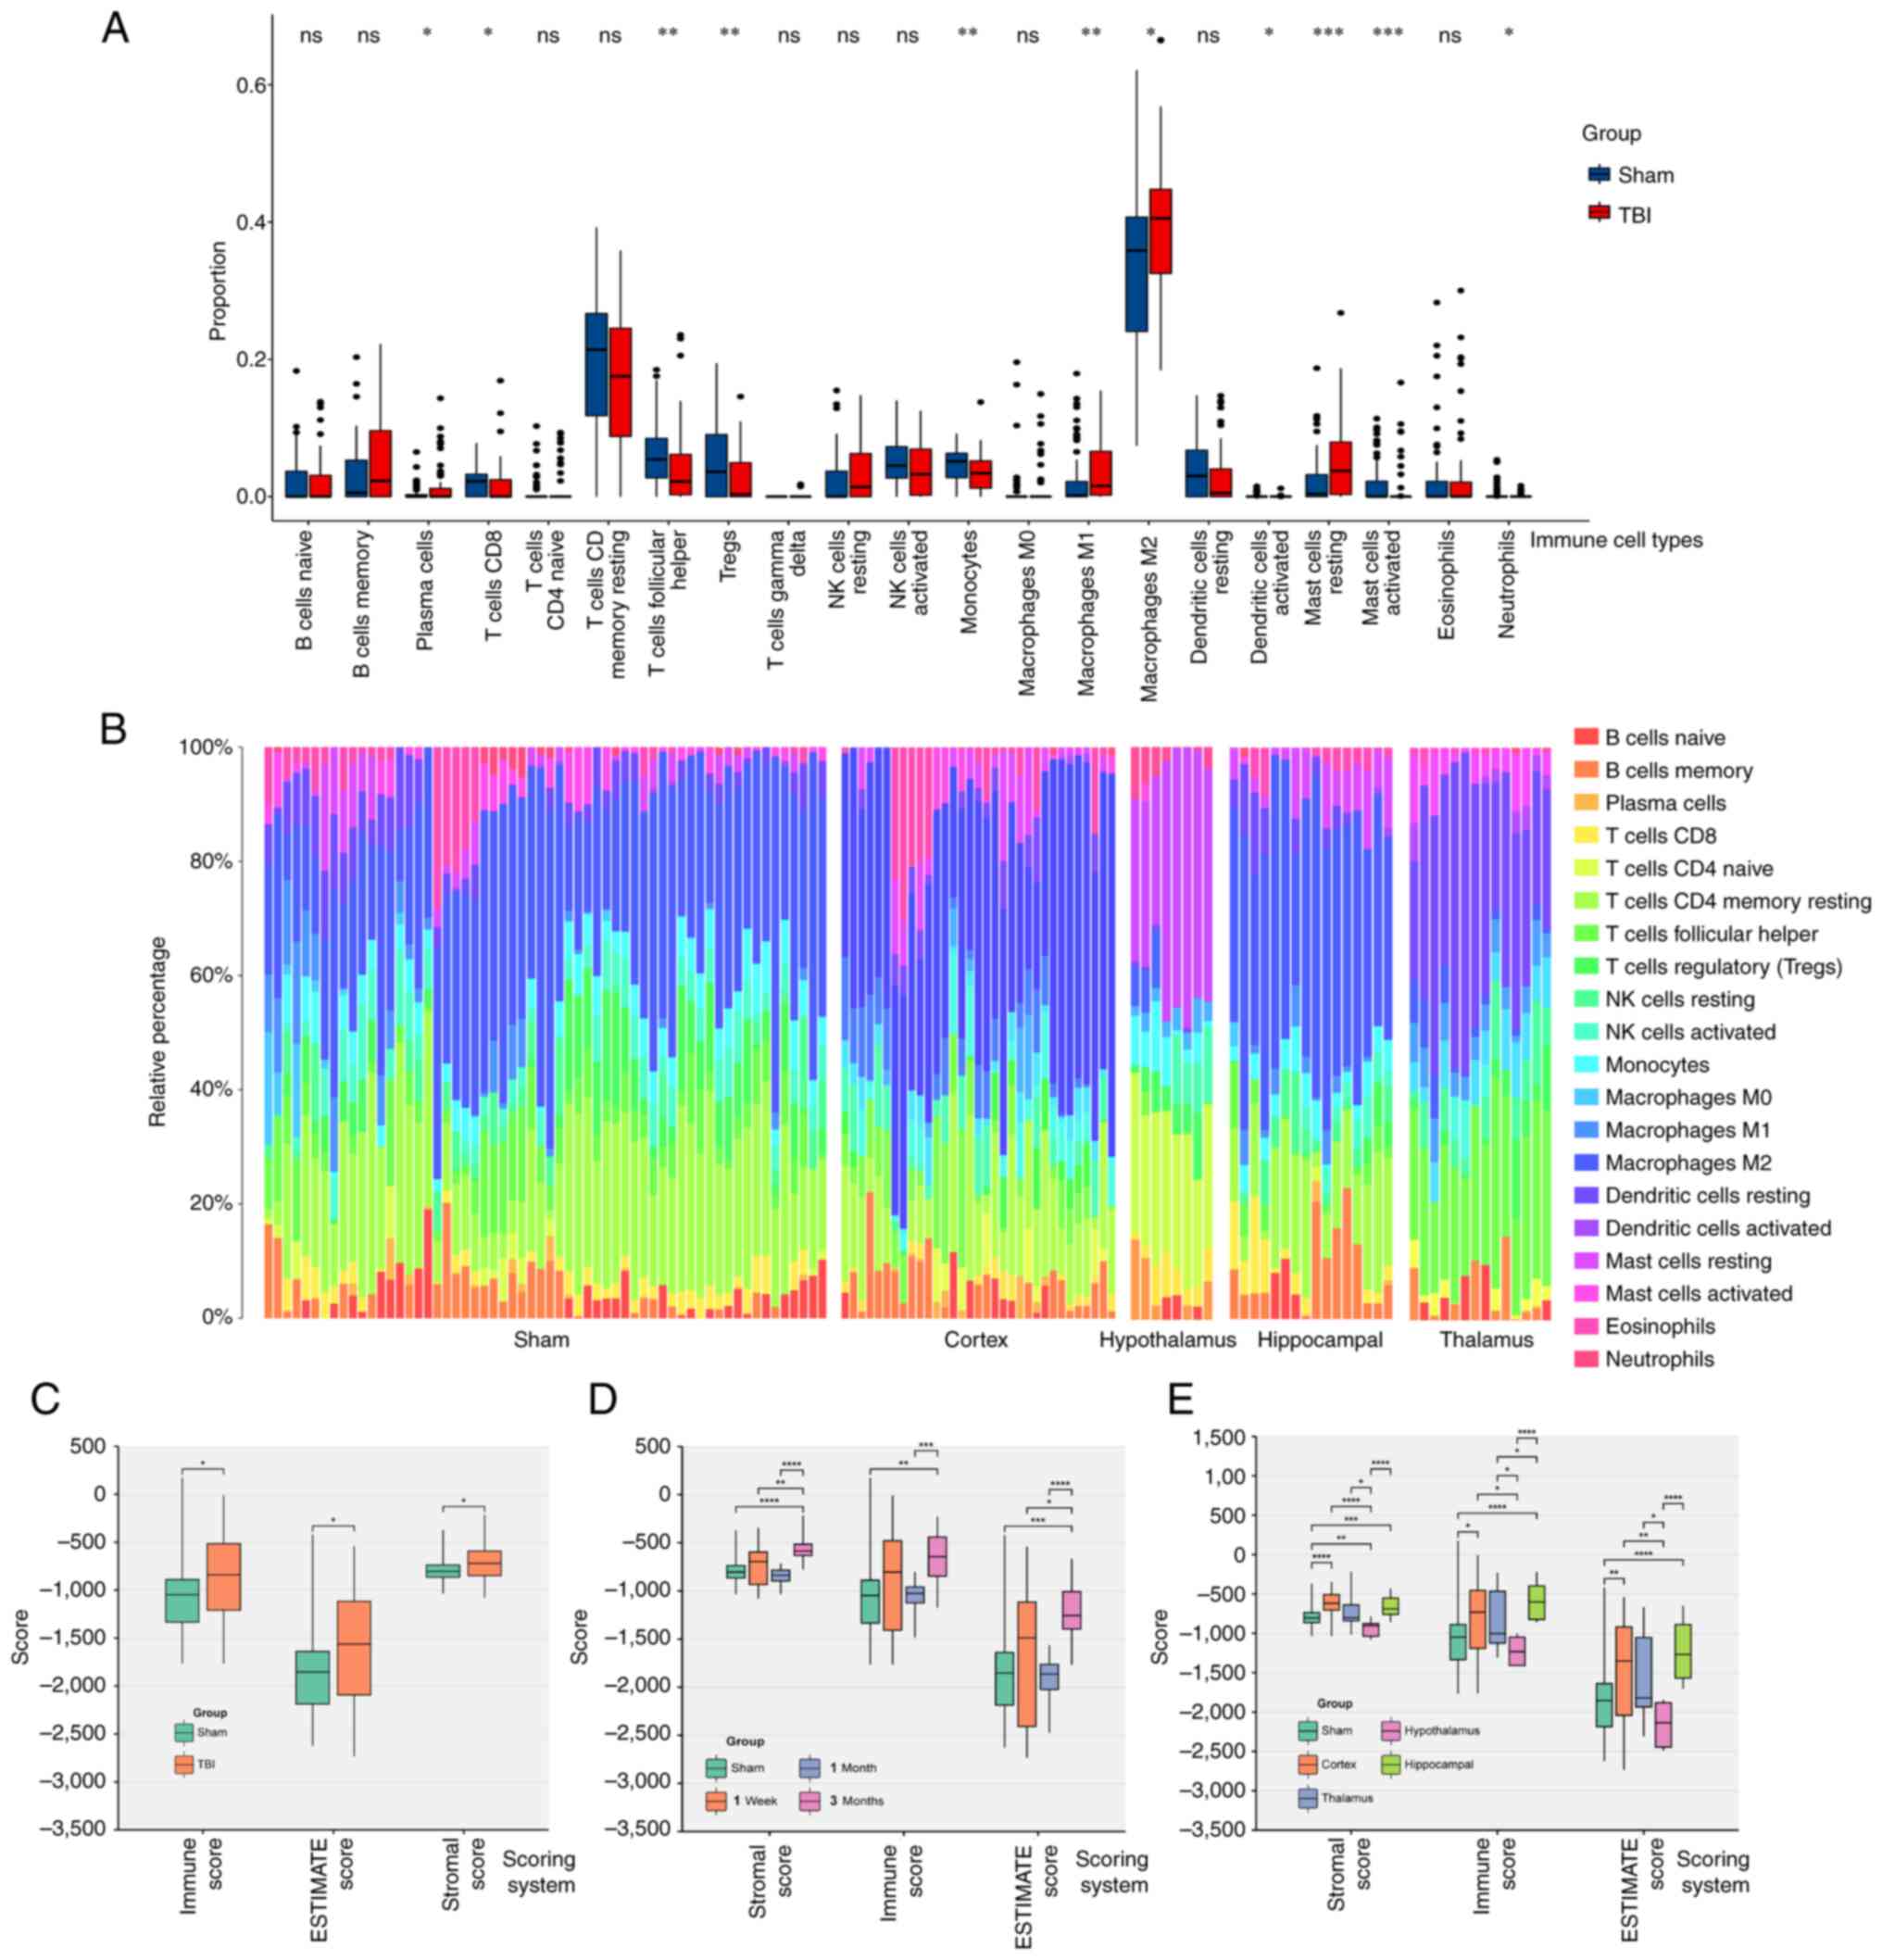
CIBERSORT analysis indicated significant increases
in the number of macrophages M1 and M2, plasma cells and resting
mast cells in the TBI group compared with the Sham group.
Conversely, Treg cell, CD8 T cell, monocyte, follicular helper T
cell, activated dendritic cell, activated mast cell and neutrophil
levels were significantly decreased compared with the sham group
(Fig. 3A). Furthermore, the cortex
and hippocampus showed relatively higher macrophage proportions
compared with the Sham group, and activated mast cells had a higher
relative percentage in the hypothalamus than the Sham group
(Fig. 3B).
The ESTIMATE method assessed overall immune
infiltration, demonstrating significantly higher scores in the TBI
group across all three metrics (ESTIMATE, immune score and stromal
score) compared with the Sham group (Fig. 3C).
Immune infiltration increased slightly within one
week following injury and declined over one month (no significant
difference compared with the sham group; P>0.05). However, it
gradually increased again during the chronic phase (2–3 months;
significantly different compared with the sham group; P<0.05;
Fig. 3D). The hippocampus
exhibited the highest immune score, followed by the cerebral cortex
(significantly different compared with the sham group; P<0.05).
The thalamus and hypothalamus showed lower scores, with no
significant differences between the TBI and Sham groups in these
regions (Fig. 3E).
In summary, the immune and inflammatory responses
following TBI are complex and multifaceted. Increases in macrophage
levels, including the M1 and M2 sub-types, decreases in regulatory
T cells and follicular helper T cells, and the enrichment of mast
cells in specific brain regions indicate a dysregulation of the
immune system and an amplified inflammatory response, especially
during the chronic phase (3 months after the brain injury) after
TBI. These dynamic changes in immune cell profiles and variations
in immune scores across different brain regions highlight the need
for personalized and targeted inflammation modulation in TBI
treatment.
WGCNA
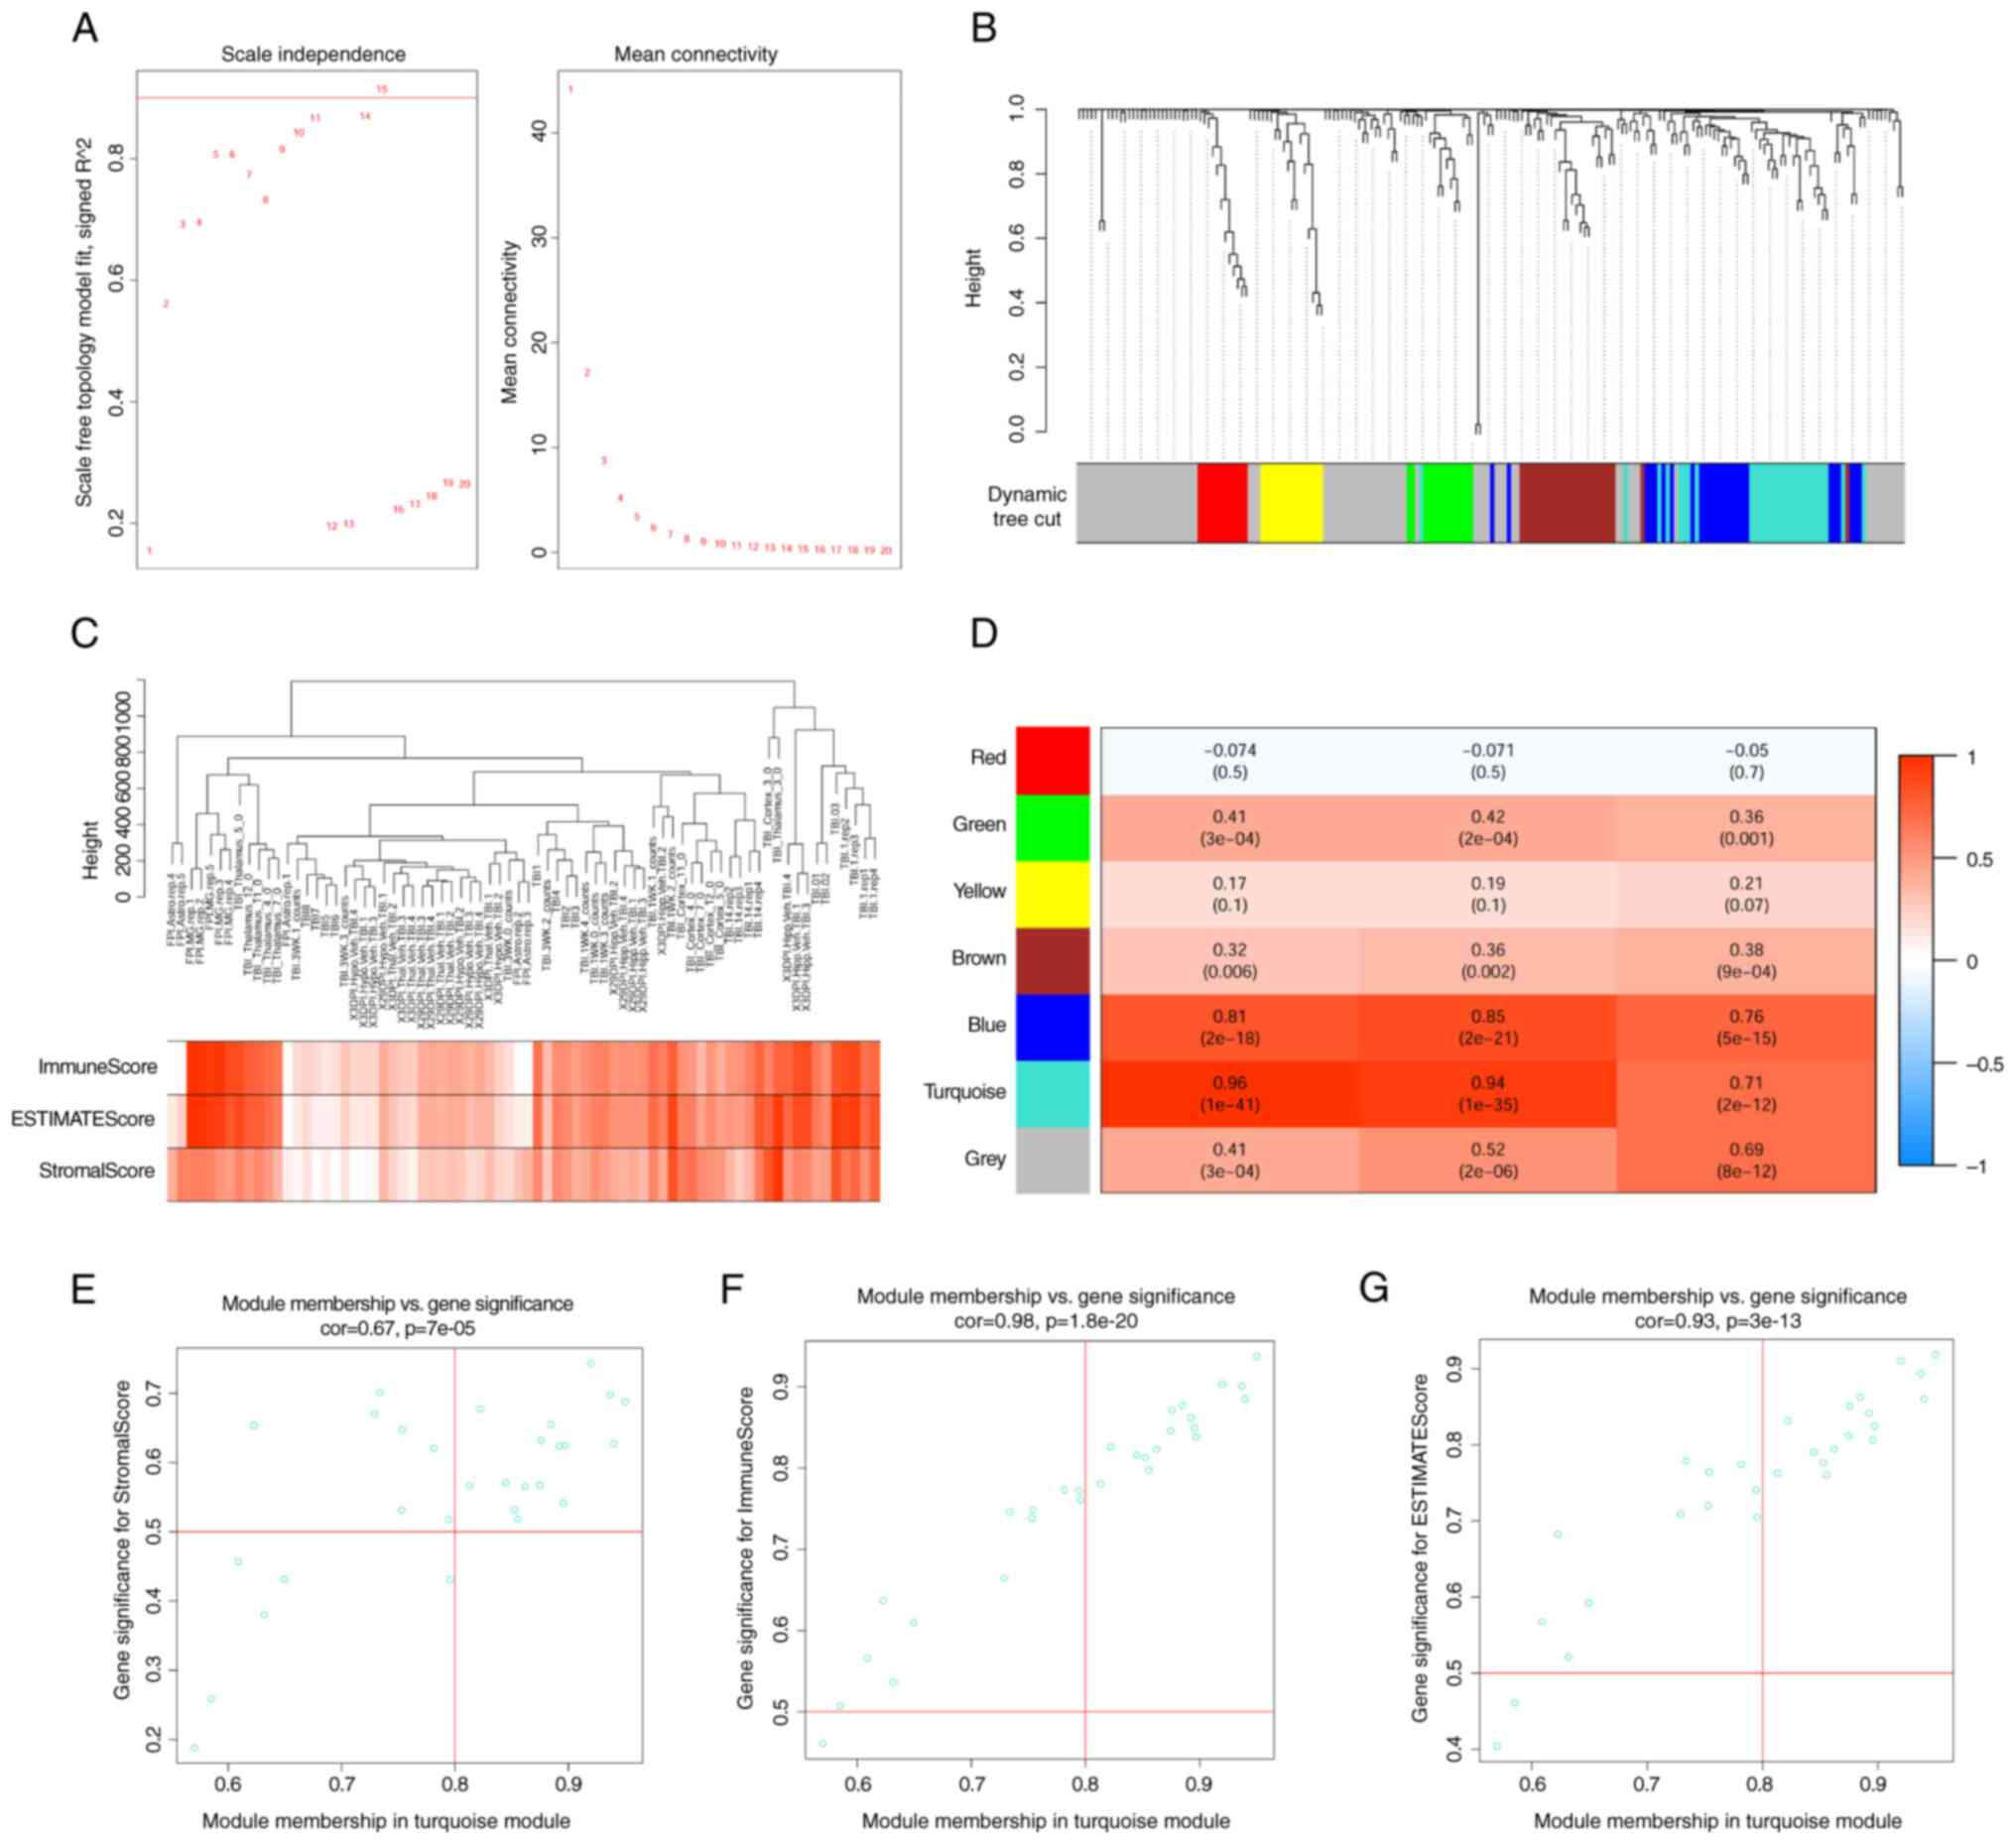
The data from the RNA sequencing datasets processing
revealed no missing values or outliers within the datasets.
Following the construction of an automatic network and module
detection, a soft threshold of 15 was recommended. In this network,
nodes represent genes, and edges represent co-expression
relationships between genes. Modules are clusters of genes closely
related within the network. The soft threshold plays a role in
filtering co-expression relationships in gene co-expression network
analysis, aiding in determining the strength of network
connections, thus influencing the results of module detection. The
curve begins to flatten at this threshold, suggesting satisfactory
average connectivity (Fig. 4A).
Using the ‘blockwiseModules’ function, 228 differentially expressed
genes were classified after TBI into seven co-expression modules. A
hierarchical clustering tree diagram was generated for module
identification (Fig. 4B).
Module-phenotype data analysis indicated that the
turquoise module had the highest correlation with the immune score
(Fig. 4C and D). This module
contained 29 co-expressed genes, including LYZ, TYROBP, CDK1, PDCD1
and RGS1. From this a gene significance-module membership, a
scatter plot for these genes was created. This plot illustrated two
main points: First, it showed how closely related the genes within
the turquoise module were to each other, referred to as their
module membership. Second, it highlighted the association between
the importance of each gene to the immune response (gene
significance) and their affiliation with the turquoise module
(Fig. 4E-G).
The immune-related module gene set from WGCNA
analysis was entered into the STRING database for PPI network
analysis. This confirmed the relevance of these genes and their key
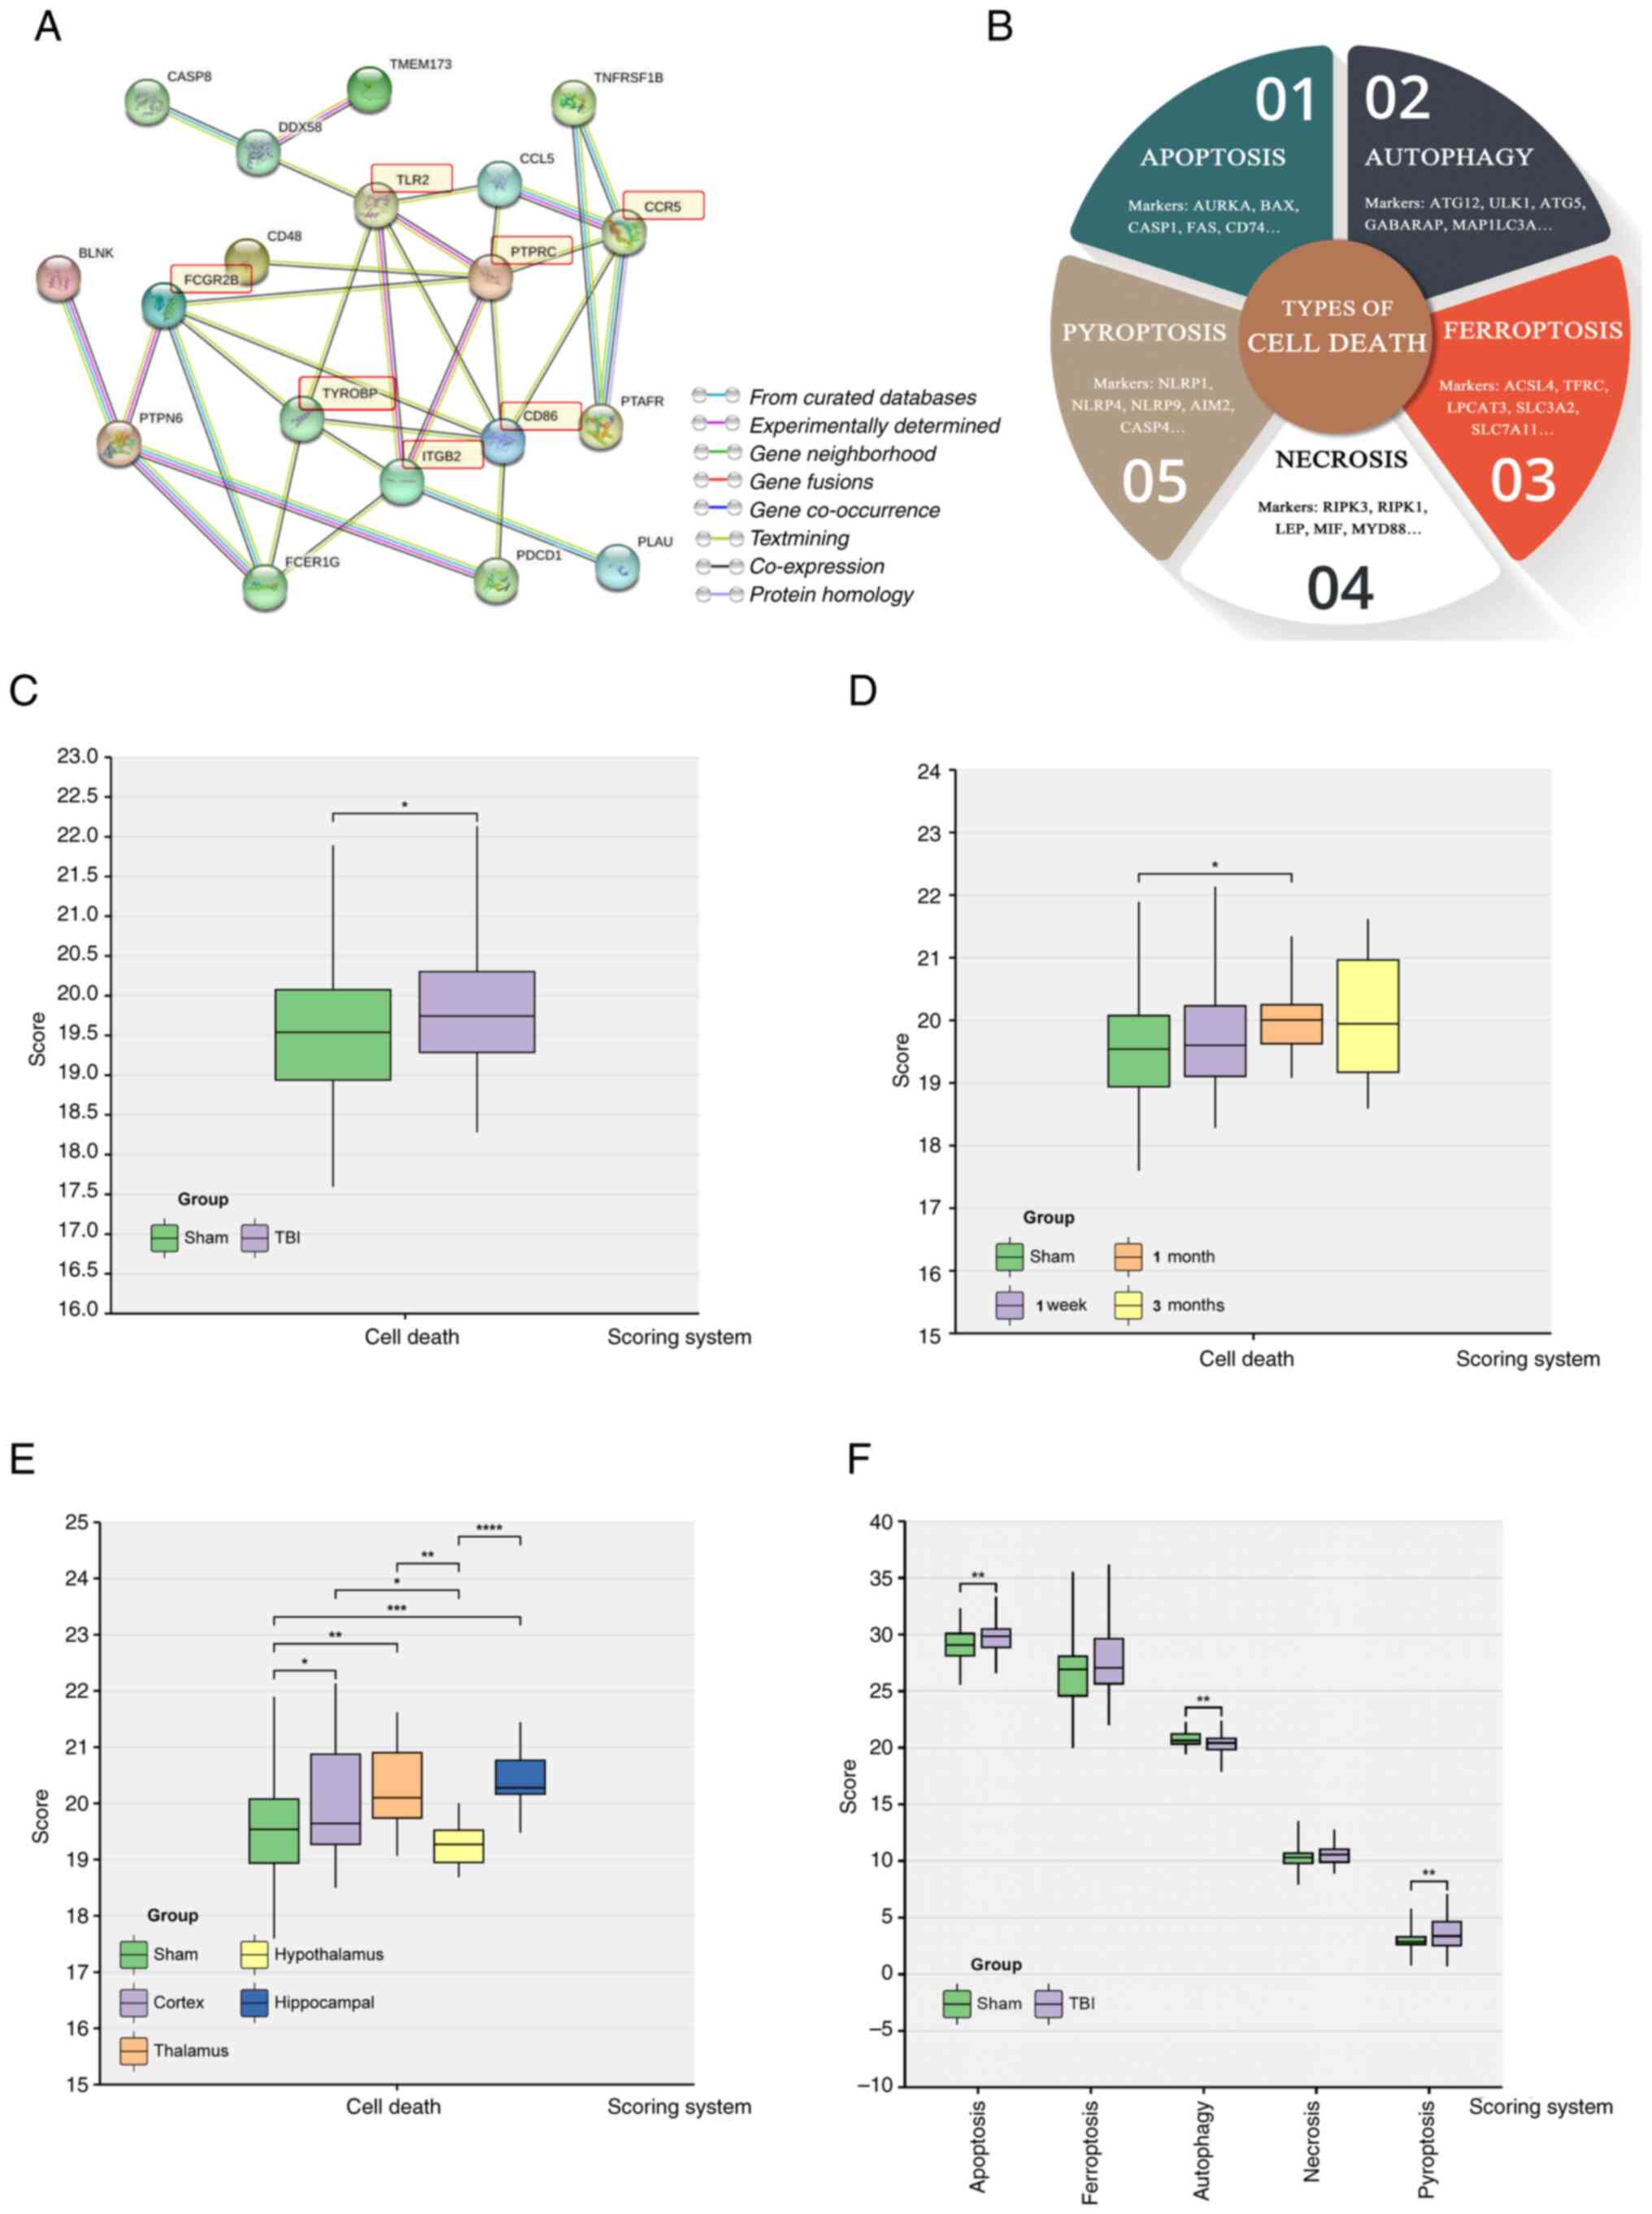
roles in the immune response. Screening for key node genes with
>4 connections identified seven critical nodes: TYROBP, CCR5,
PTPRC, ITGB2, FCGR2B, TLR2 and CD86 (Fig. 5A).
Cell death
Current scientific understanding indicates that
brain injury leads to neuronal death through numerous pathways. The
present study assessed the five most prominent cell death
modalities; apoptosis, necrosis, autophagy, ferroptosis and
pyroptosis (Fig. 5B).
Results showed that the overall cell death index in
the TBI group was significantly higher compared with that in the
Sham group (Fig. 5C). In TBI,
brain cell mortality in mice was significantly increased at one
month compared with the Sham group (Fig. 5D). The cerebral cortex,
hippocampus, and thalamus exhibited significantly higher cell death
indices compared with the Sham group. In contrast the hypothalamus
had a markedly lower cell death index compared with the Sham group
(Fig. 5E). Furthermore, there were
higher levels of apoptosis and pyroptosis than other forms of brain
cell death after trauma. The autophagy score was significantly
lower in the TBI group compared with the Sham group (Fig. 5F).
These results indicated that most cell death
occurred within one month after trauma, highlighting a crucial
period for therapeutic intervention. Apoptosis and pyroptosis were
demonstrated as the predominant cell death mechanisms after brain
trauma and present potential targets for treatment. Likewise,
increasing the levels of autophagy may increase neuronal resilience
against injury, starvation and oxidative stress, making it a
potential intervention strategy.
Cluster analysis
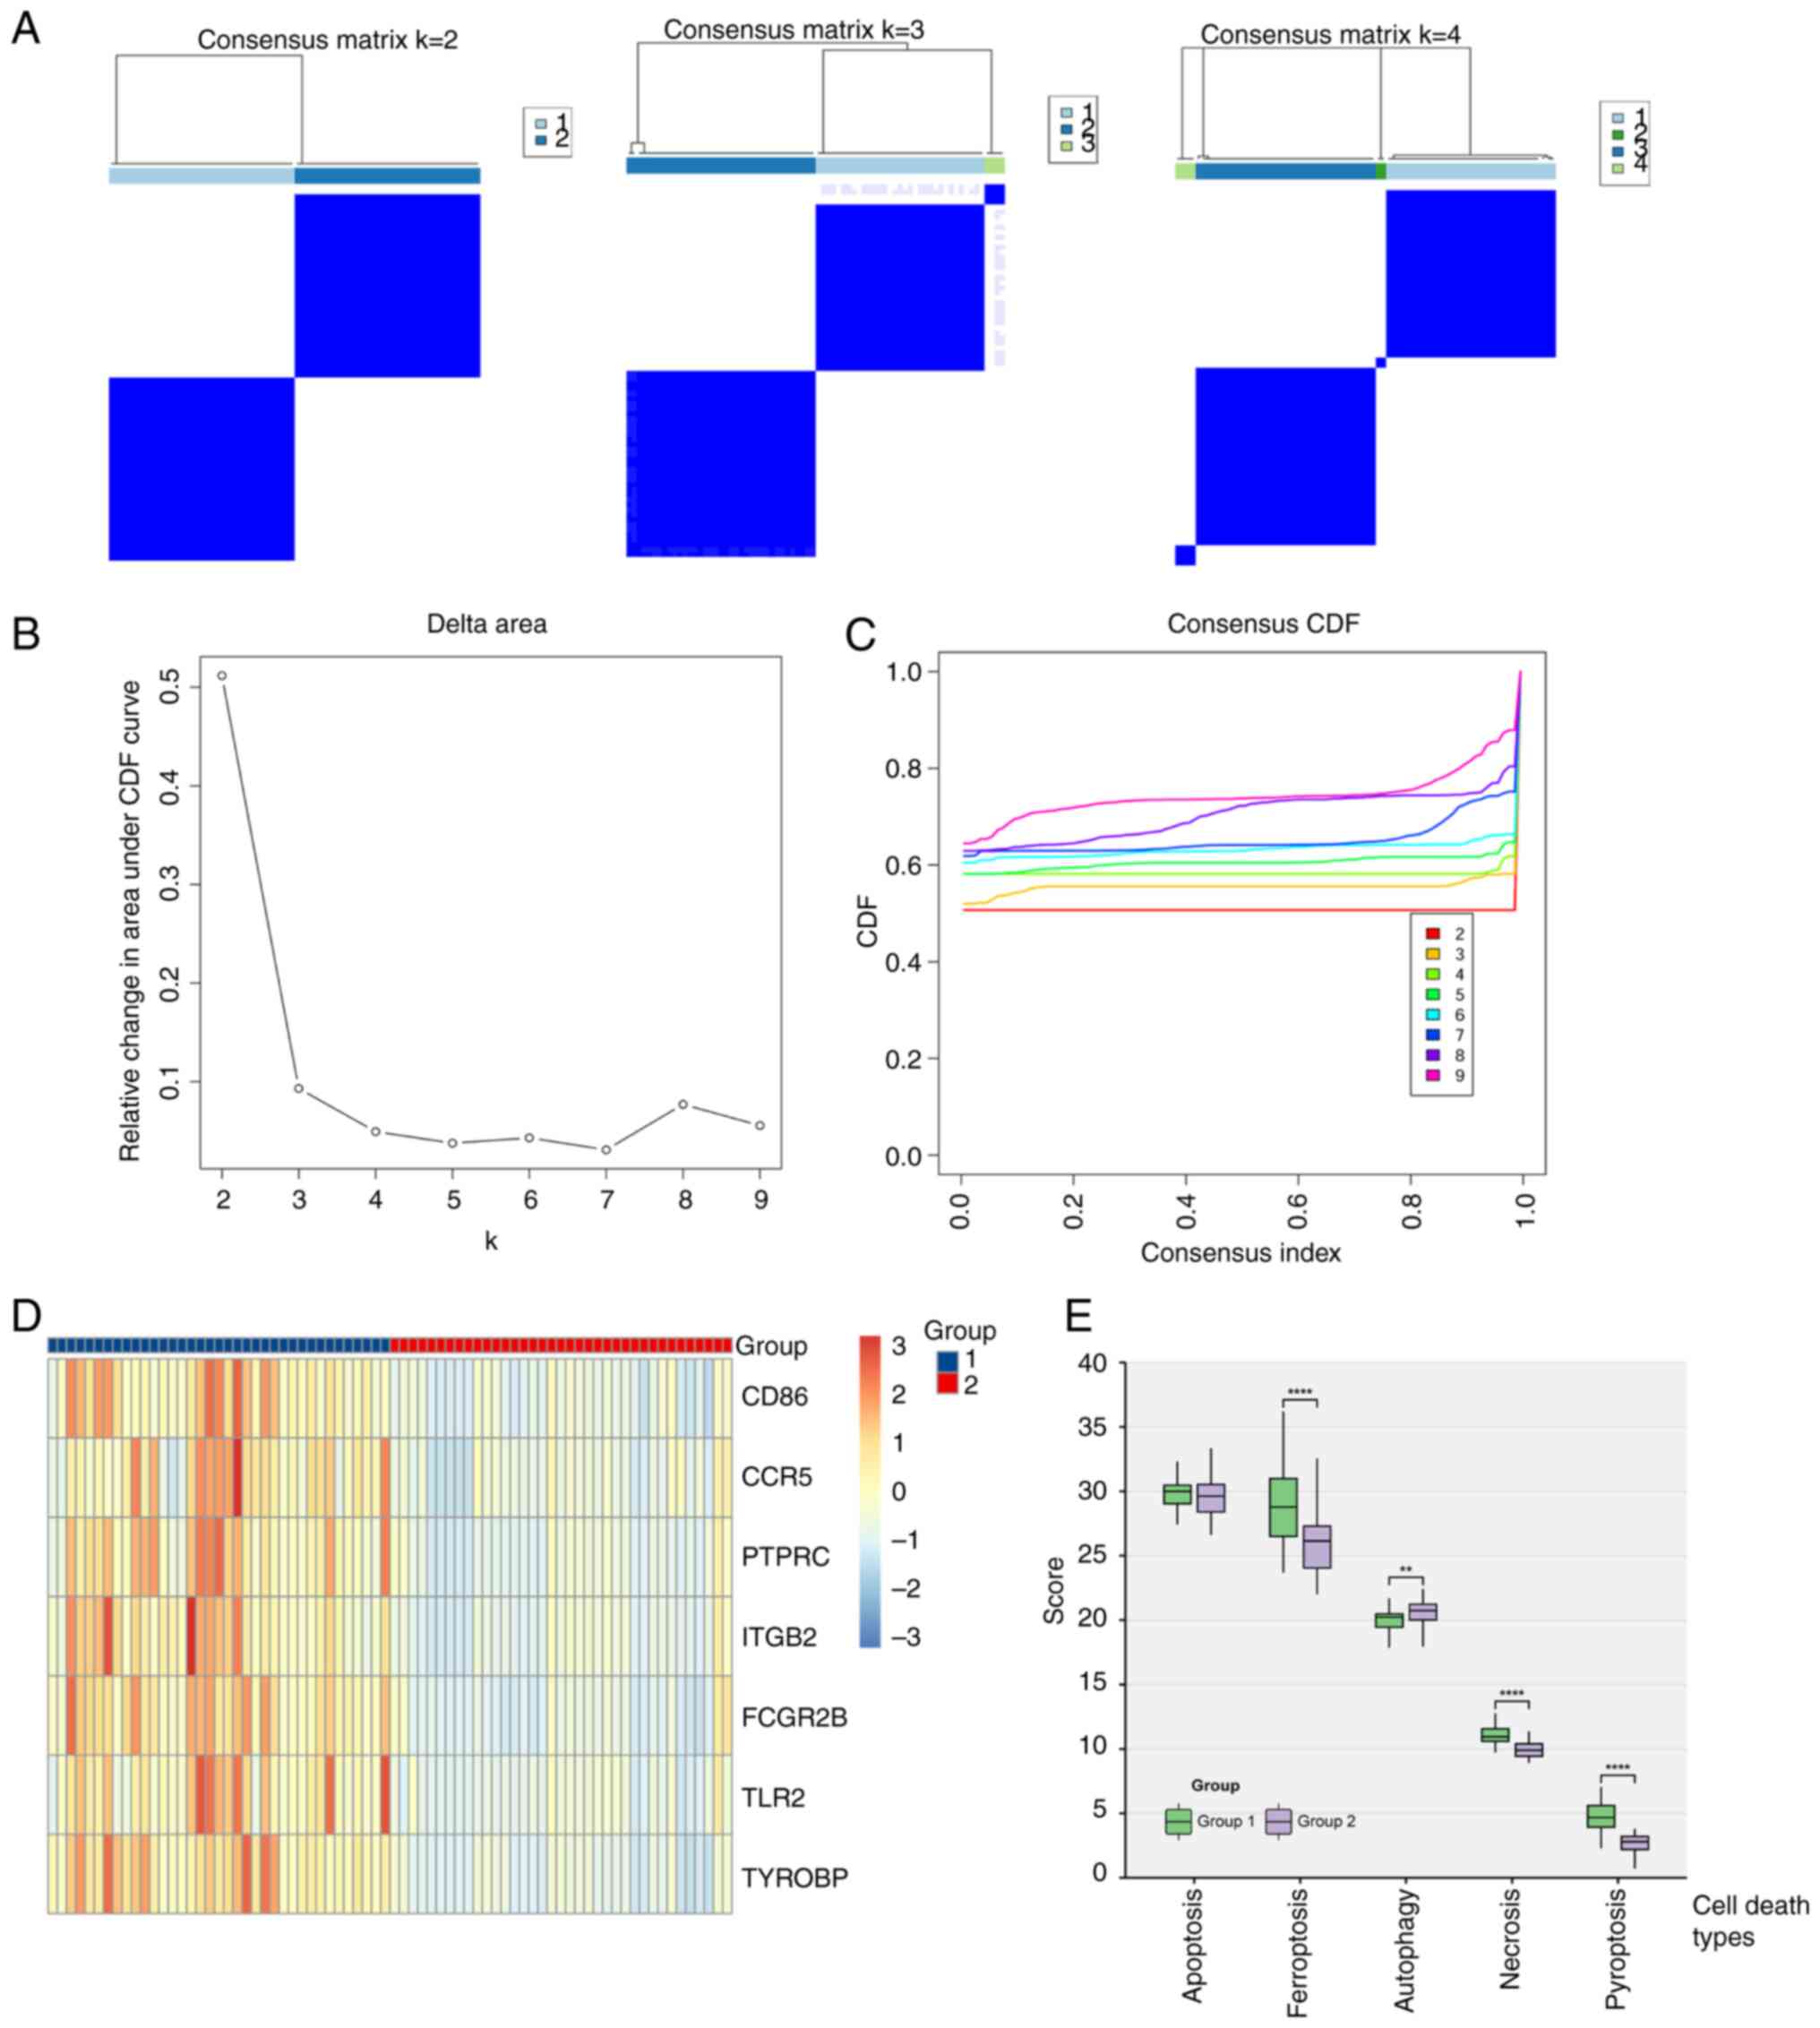
Using the ‘ConsensusClusterPlus’ method, a
consistency matrix for different grouping numbers (K) was
constructed. The analysis showed stable cluster assignments at K=2,
with new clusters becoming small and less reliable at K>2
(Fig. 6A). Empirical cumulative
distribution plots indicated stable data results for K between 2
and 4 (Fig. 6B and C).
After grouping, gene expression was depicted in a
heatmap, which indicated significantly higher expression of immune
key node genes in group 1 compared with group 2 (Fig. 6D).
When comparing cell death scores, group 1 exhibited
significantly higher ferroptosis, necrosis and pyroptosis scores,
and a significantly lower autophagy score compared with group 2
(Fig. 6E). This suggested that
immune-related node genes in TBI were linked to ferroptosis,
necrosis and pyroptosis in the nervous system after brain trauma
and were inversely associated with autophagy.
These insights reveal unique pathological
characteristics of TBI, emphasizing the role of various cell death
pathways in exacerbating neuronal damage and impairing neural
functions. Targeted approaches, such as regulating iron metabolism,
using antioxidant treatments or inhibiting inflammatory death
pathways, combined with enhancing autophagy, could be effective
strategies for reducing neuronal injury and aiding nervous system
recovery.
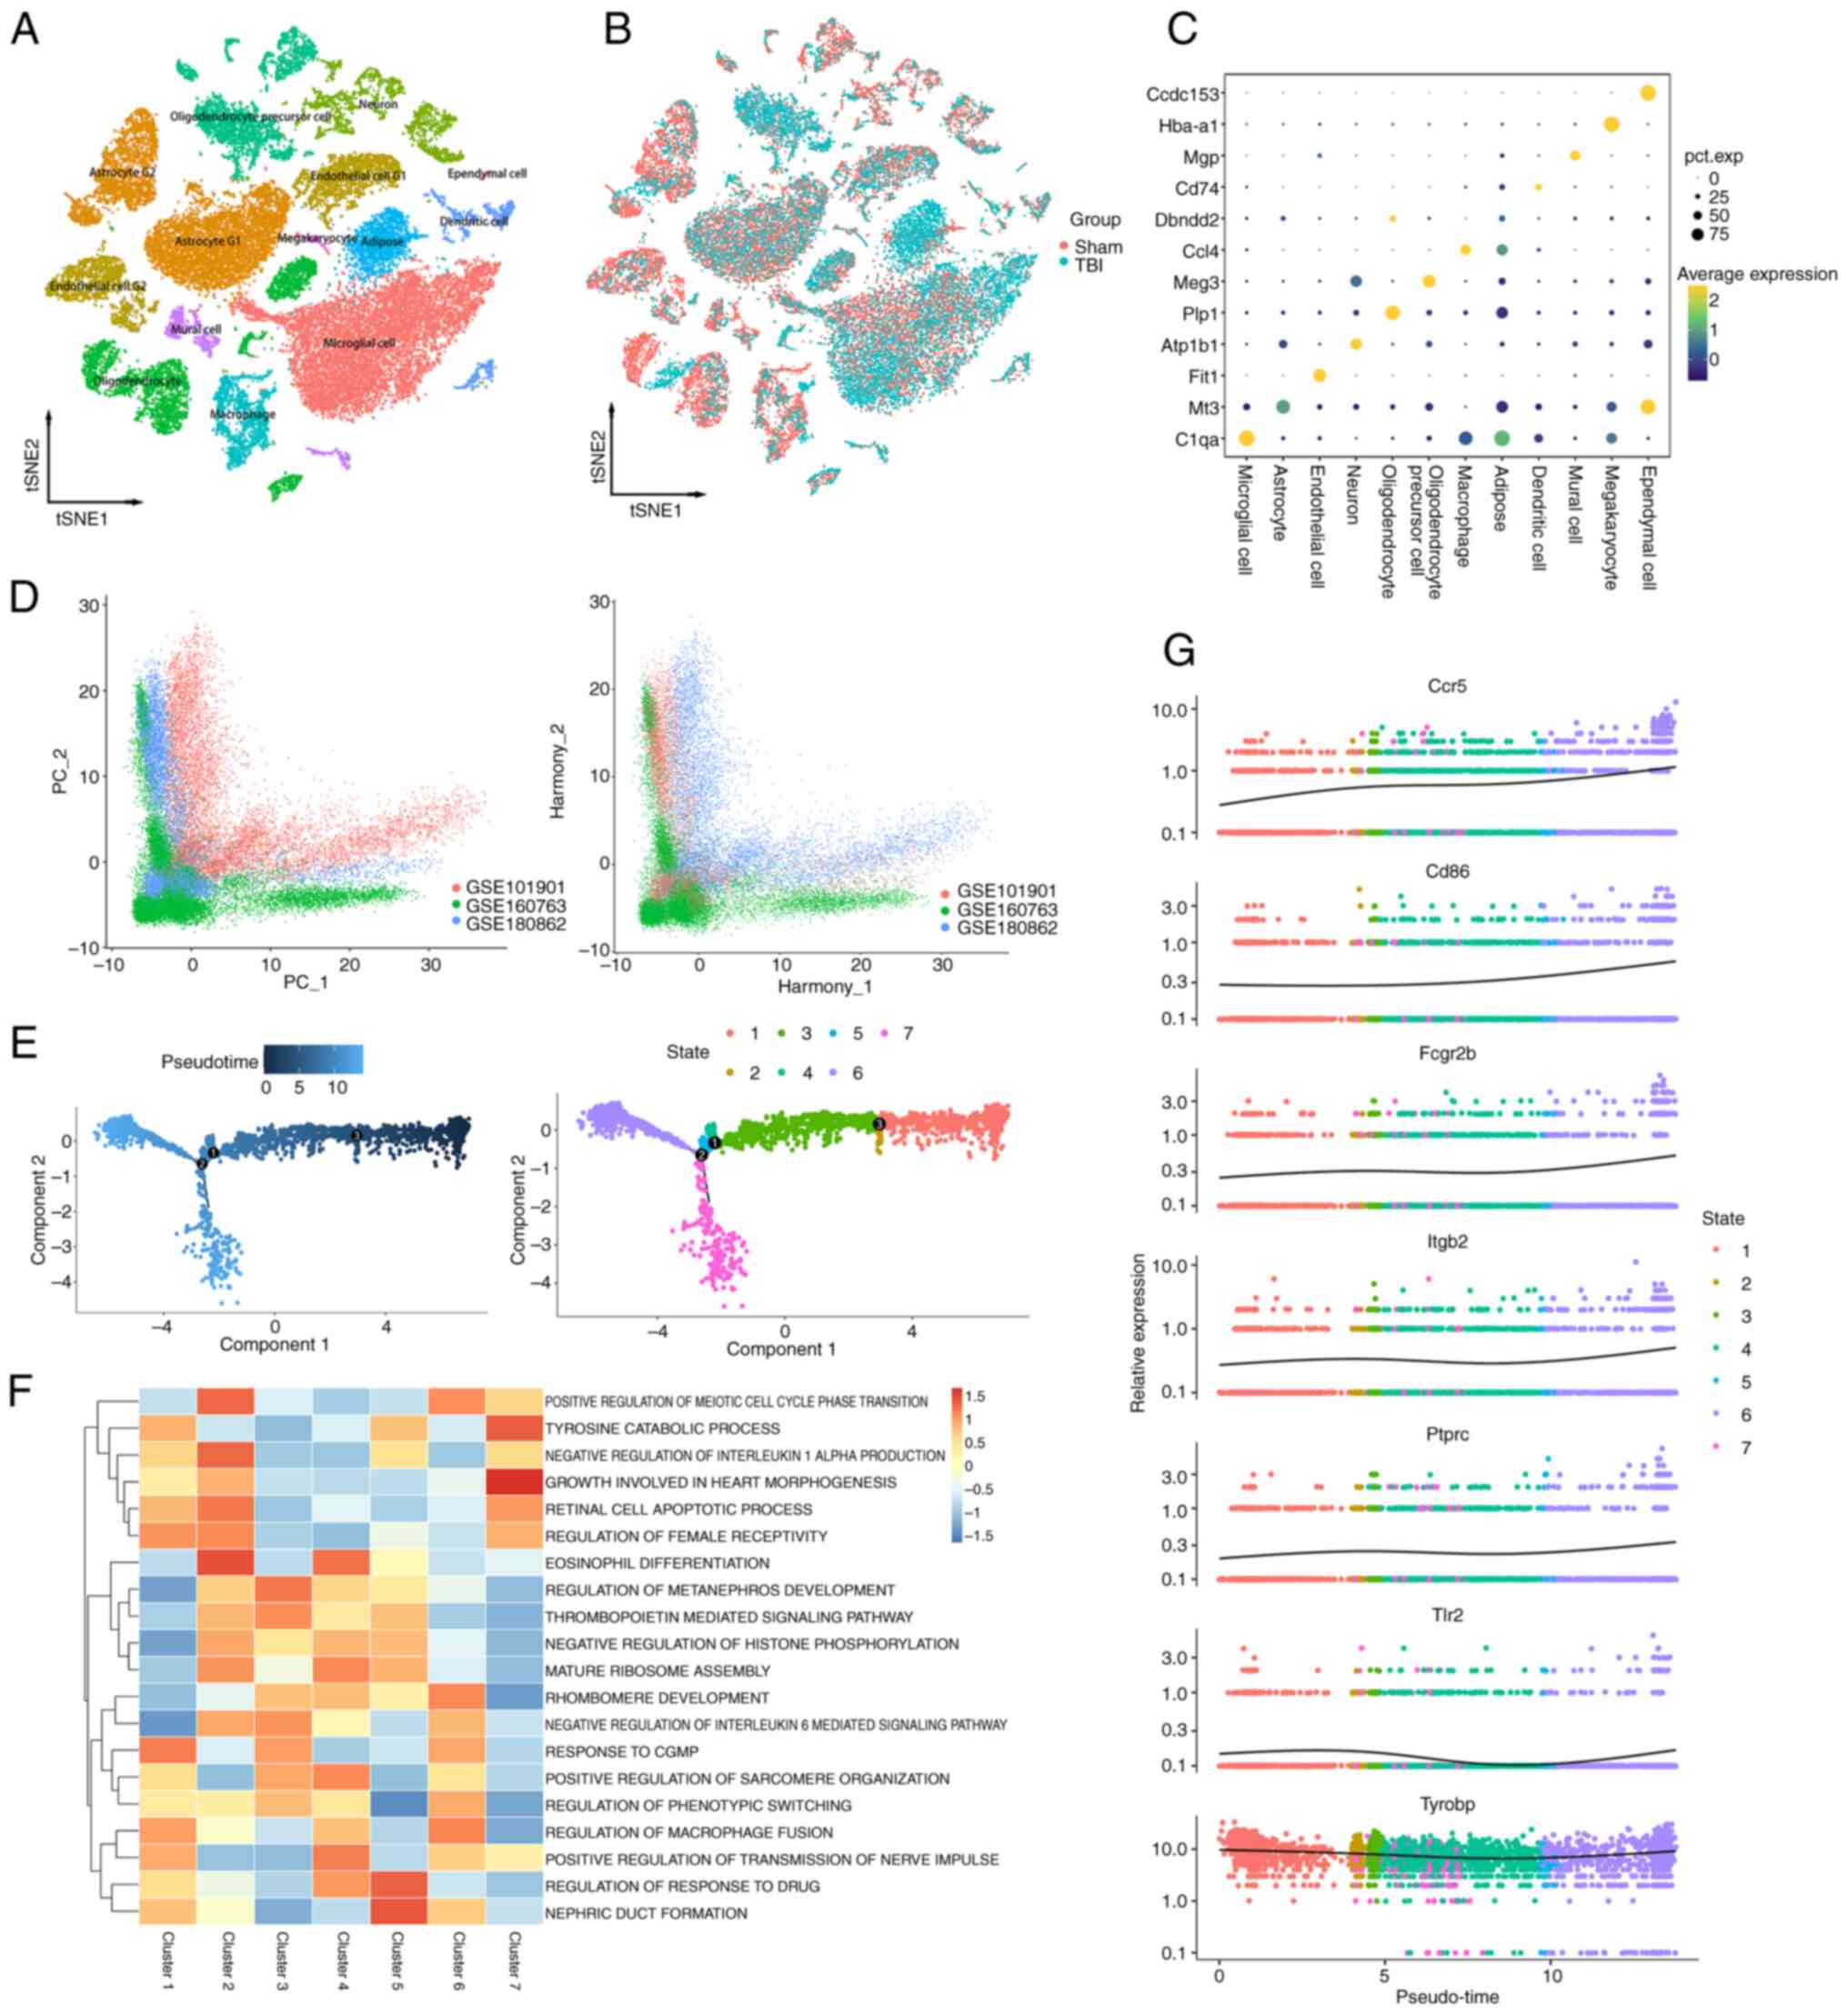
Single-cell sequencing analysis
Three single-cell sequencing datasets were
integrated related to TBI, and quality control was performed to
ensure data accuracy. To mitigate batch effects, the Harmony method
was used (Fig. 7D), yielding
37,621 high-quality cells. Using the tSNE method, the sequencing
samples were classified into 12 cell types based on specific marker
genes (Fig. 7A). Notably, in the
TBI group, there was an increase in the proportion of microglia and
macrophages (Fig. 7B), suggesting
their role in the inflammatory process in TBI. The annotation
method and markers for cell types have been organized (Fig. 7C).
Pseudotime analysis demonstrated that after TBI,
microglia underwent three evolutionary nodes and differentiated
into two distinct paths. This suggests TBI causes microglia to
diverge into two functional states, highlighting their complex
response to injury. Using these nodes, ‘monocle2’ further
categorized the microglia into 7 clusters (Fig. 7E). These findings indicated that,
after TBI, microglia diverge into two paths: Cluster 6, which
promoted chronic inflammation and cell death via cell fusion, and
Cluster 7 which reduced inflammation by downregulating interleukin
6 (Fig. 7F). The former may lead
to sustained neuronal tissue damage, whereas the latter could help
attenuate inflammation and preserve neural cells, providing crucial
treatment insights. TYROBP is key in controlling microglia
differentiation and activity, essential for improving TBI prognosis
and neural recovery. The present analysis analysis showed TYROBP
consistently highly expressed over time, emphasizing its crucial
role in cell differentiation and microglial modulation. This
suggested that s targeting TYROBP could significantly aid TBI
recovery. (Fig. 7G). Hence,
targeting the TYROBP pathway to regulate these mechanisms offers a
potential target for TBI therapeutic strategies.
The distribution of previously identified
immune-related key node genes including CD86, CCR5, PTPRC, TLR2,
FCGR2B, ITGB2, TCGR2B and TYROBP in TBI was also analyzed. The
results showed that these genes were mainly found in microglia,
macrophage and monocyte nuclear dendritic cells (Fig. S1A and B). This suggested the
activation of various immune cells after brain trauma, with innate
immune cells serving a role in nervous system inflammation after
injury.
Using the ‘SCENIC’ package in the R, transcription
factor activity across different cell types in TBI single-cell
sequencing data was analyzed. It is suggested that RUNX1 might act
as an upstream transcription factor for genes like TYROBP,
influencing microglial cell activation and response, potentially
linking to neurodegenerative diseases and neuroinflammation
following brain injury (Fig. S2
and 3).
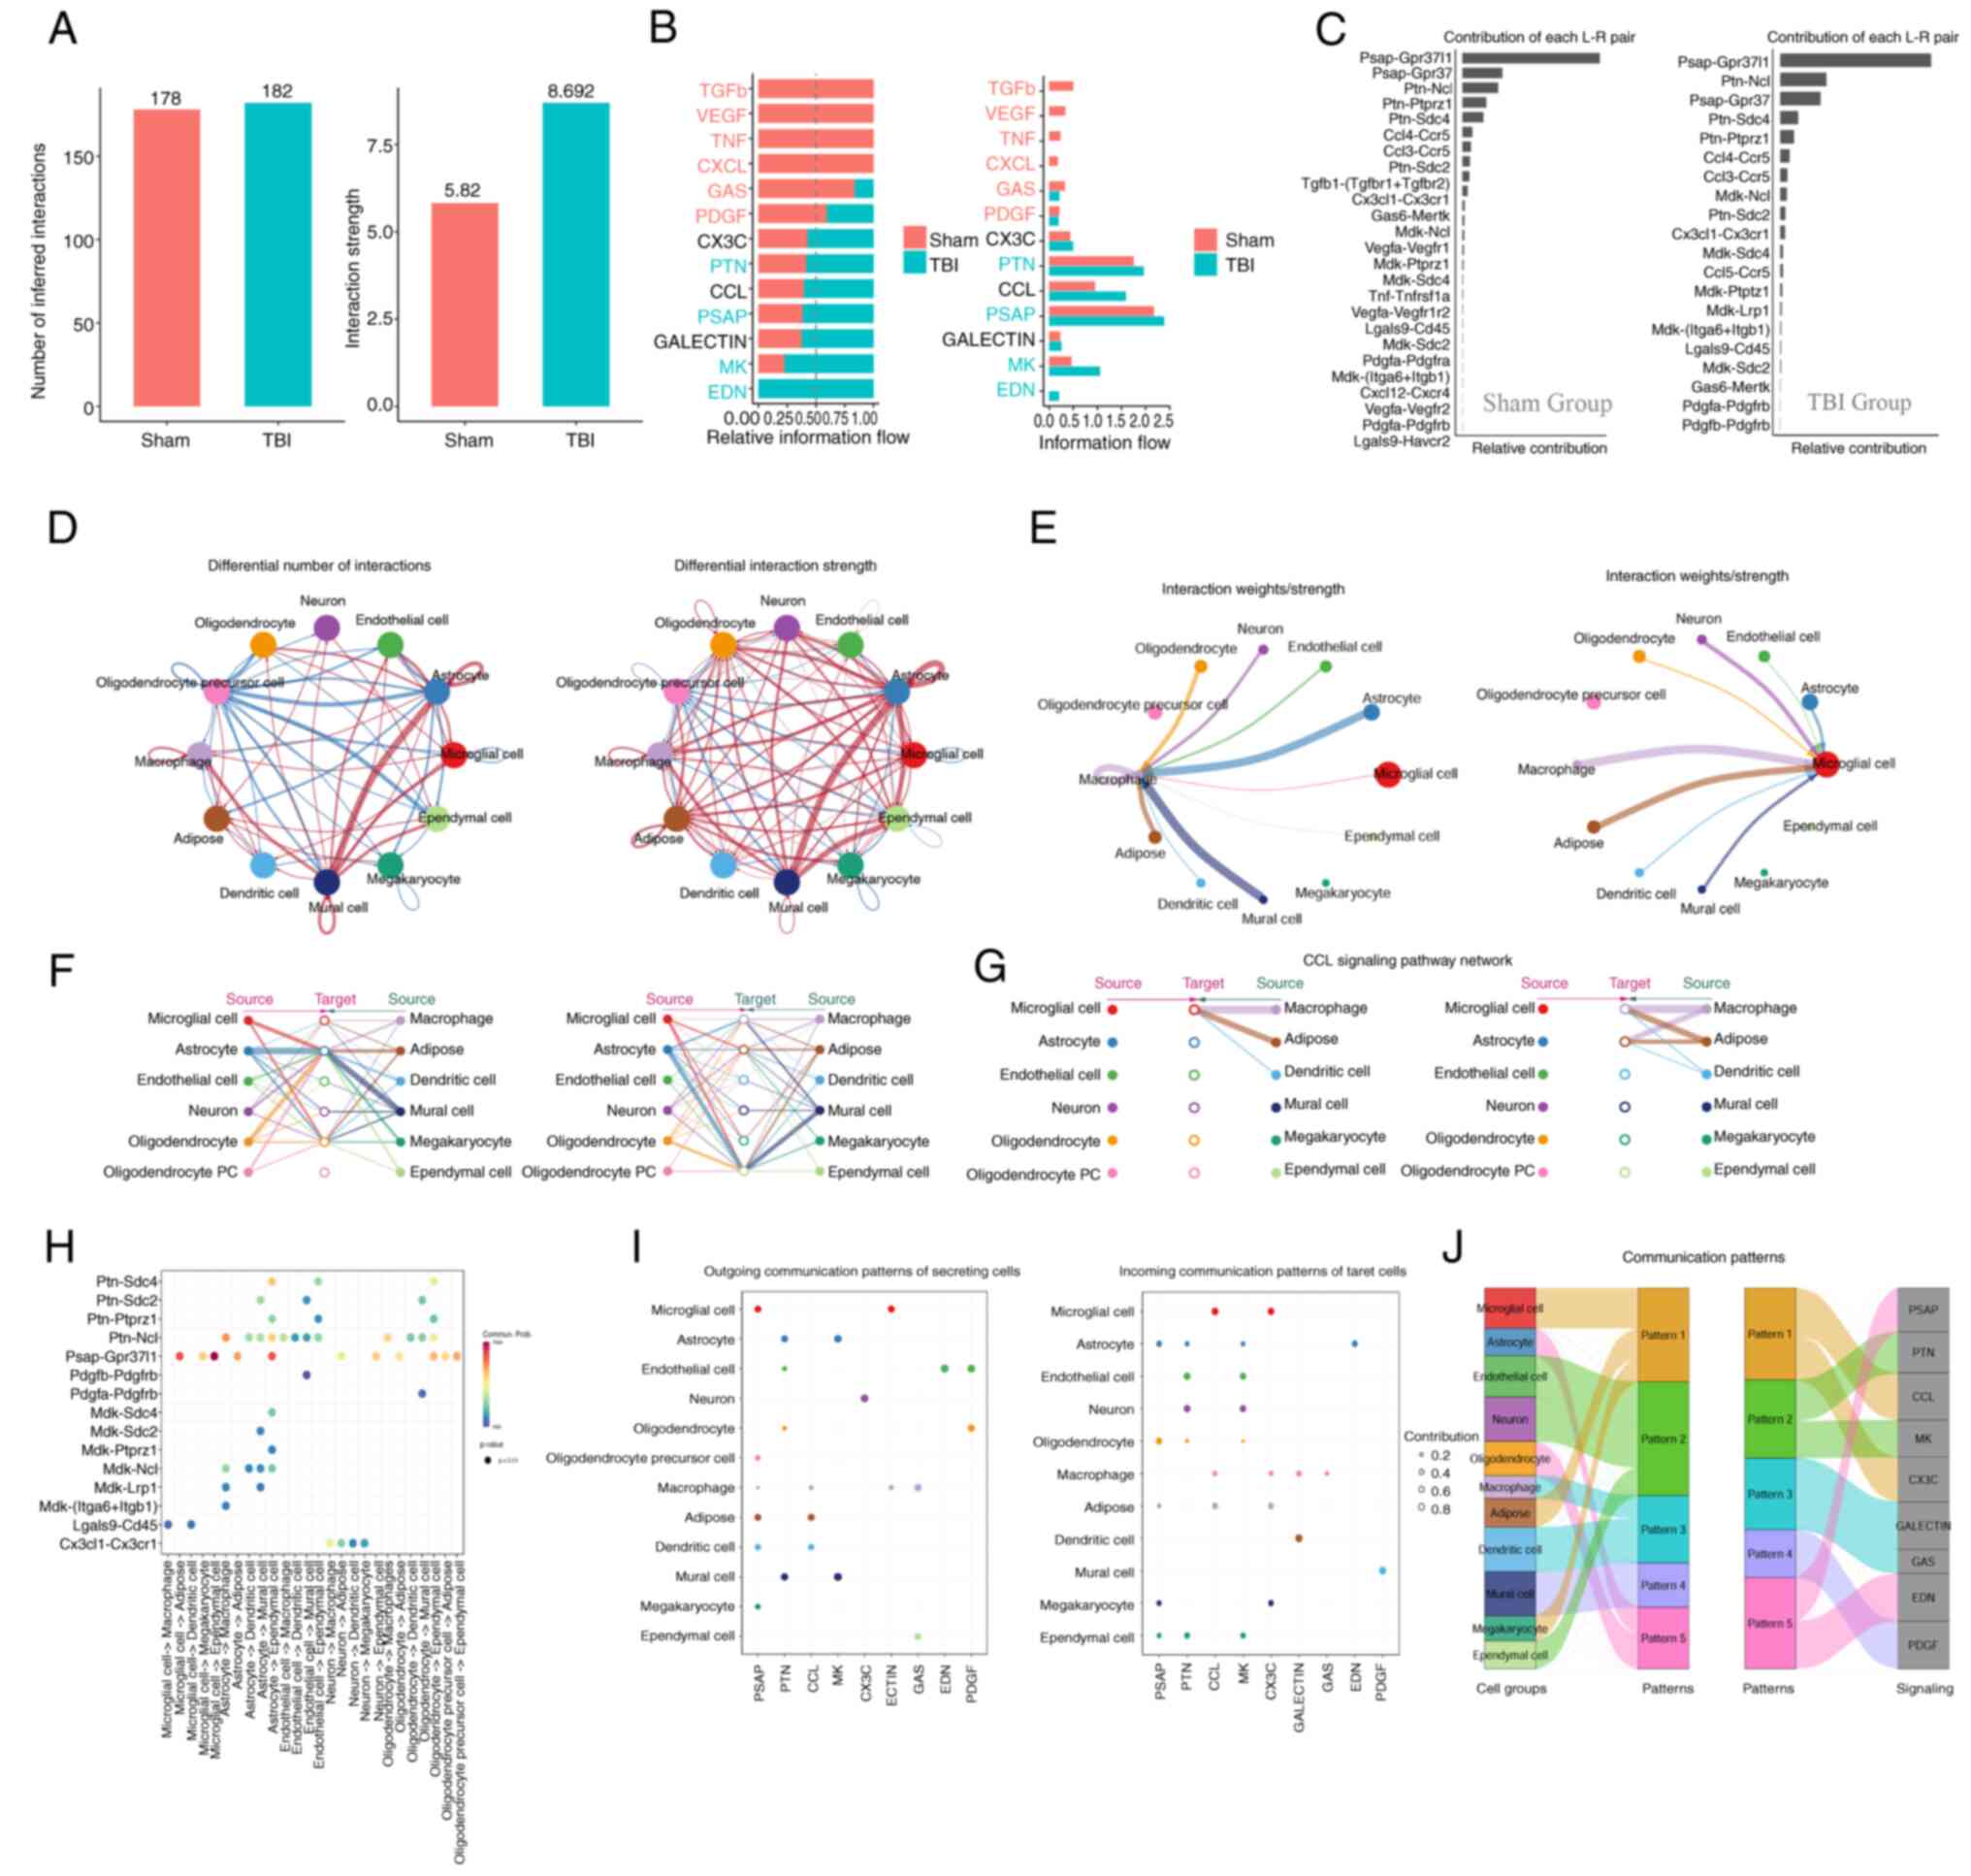
Cell-cell communication analysis
Cell-cell communication analysis is used to assess
paracrine and autocrine signaling, particularly under pathological
conditions that alter the tissue micro-environment. The present
study demonstrated enhanced signaling pathways of CCL, CX3C, PTN,
PSAP, GALECTIN, MK and EDN in the TBI group compared with the Sham
group. Conversely, the intercellular communication pathways TGF-β,
VEGF, CXCL, GAS, PDGF and TNF were decreased (Fig. 8A and B). These dynamics, detailed
in Fig. 8A and B, suggested a
balance between recovery promotion and excessive inflammation
prevention, crucial for TBI treatment strategies.
Notably, the interaction between CCL5 and CCR5
intensified after brain injury (Fig.
8C), potentially influencing the accumulation of microglia and
macrophages in the affected area. Overall, there was increased
communication among neurons, astrocytes, microglia and neighboring
cells following injury (Fig. 8D).
Furthermore, microglia and macrophages, the primary innate immune
cells in the central nervous system, were further assessed. It was
demonstrated that after injury, microglia receive paracrine signals
from various cell types, including neurons, astrocytes, endothelial
cells and other immune cells (Fig.
8E). These signals potentially prompt migration to the damaged
sites for cell repair and regeneration.
Hierarchical analysis indicated a reduction in
intercellular communication signals received by oligodendrocyte
precursor cells after injury, including factors for cell growth and
differentiation including TGF-β, VEGF and PDGF (Fig. 8F). This could hinder
oligodendrocyte maturation, leading to neural repair disorders and
demyelinating diseases. Moreover, the role of the CCL pathway in
recruiting and phagocytosis of innate immune cells was also
demonstrated. The evidence leading to this conclusion was derived
from a series of analyses focused on the TBI group, specifically
looking at the interactions mediated by the CCL pathway (Fig. 8G and H), which suggested that a
balance between microglia and oligodendrocytes is important for
immune system homeostasis during inflammation caused by TBI.
The clustering analysis of cell communication
identified a specific signal pattern (Pattern 1) associated with
microglia, involving the release of the chemokines CCL and CX3C at
the injury site and immune cell activation via the TNF or TGF-β
pathways (Fig. 8I). The TNF
pathway, induces programmed cell death in inflammatory states, and
TGF-β regulates cell growth, differentiation and apoptosis. These
results indicate the dual role of microglia in immune regulation,
mediating both cell repair and death. Additionally, the present
analysis of macrophage-related cell communication patterns
demonstrated their associated pathways including CCL, TNF, GSA and
GALECTIN (Fig. 8J). These patterns
illustrated how different cell types respond to specific signaling
cues within their microenvironment. The GSA pathway, involving
NF-κB, TNF and MAPK, serves a role in reducing inflammation and
apoptosis. Likewise, GALECTIN is an important part of innate
immunity and is recognized by danger-associated molecular patterns.
It controls the activity of macrophages and microglia and could be
used as a treatment target for neurodegenerative diseases.
Neuron-microglia interaction
experiment
To model TBI in vitro, we employed two
distinct co-culture systems were employed: A non-contact co-culture
system, designed to evaluate the impact of brain injury on
microglial cell activation; and a contact co-culture system, aimed
at assessing neuronal cell survival following brain injury
(Fig. 9A). Using RT-qPCR, the mRNA
expression levels of seven receptor types in RAW264.7 cells, which
act as microglia-like models were measured. Statistically
significant differences in three receptors were found between the
NC and TBI model groups (Fig. 9B).
Notably, the levels of TYROBP in the TBI model were significantly
increased 1.8-fold compared with the control (Fig. 9B). Consequently, the role of TYROBP
in TBI was further assessed.
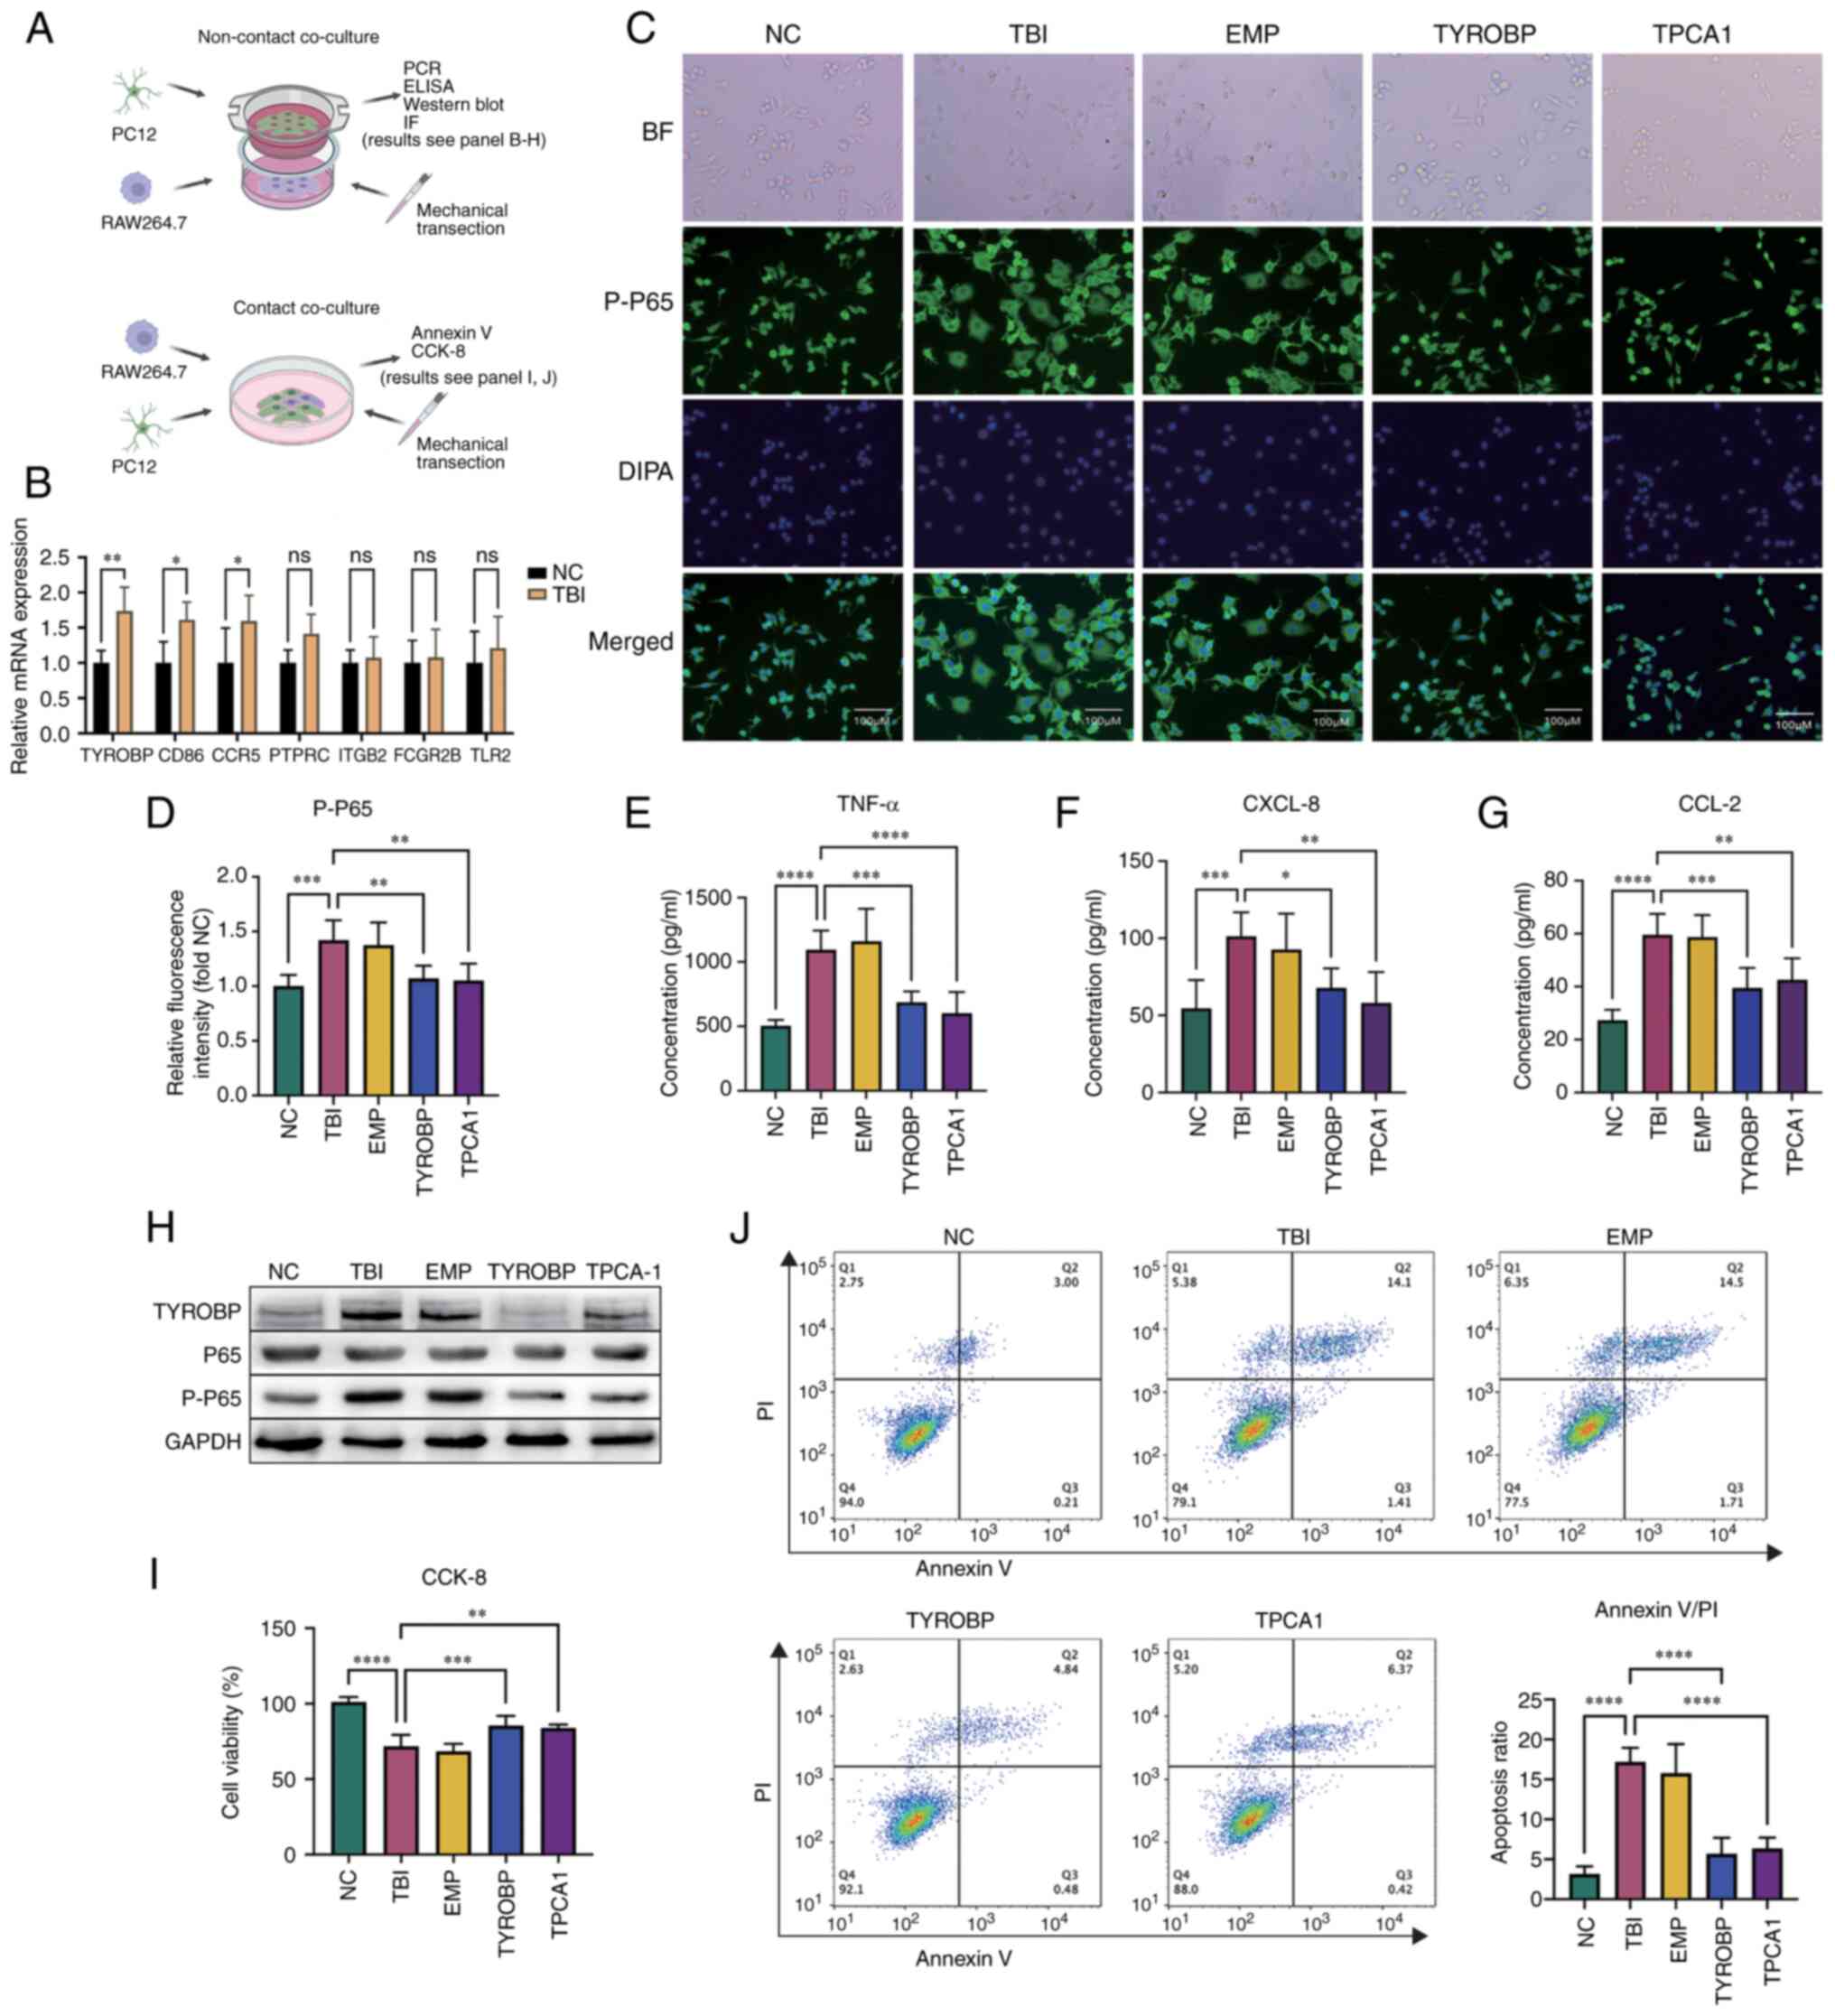 | Figure 9.Impact of TYROBP on microglial
activation. (A) Schematic of the experimental procedure showing the
non-contact co-culture model of RAW264.7 and PC12 cells to study
microglial activation after TBI (above) and a contact co-culture
model to investigate neuronal apoptosis (below). (B) Reverse
transcription quantitative polymerase chain reaction assessing the
relative mRNA expression levels of surface antibodies in RAW264.7
cells in the TBI and Sham groups. (C) Immunofluorescence
experiments depicting the levels and distribution of P-P65 in
RAW264.7 cells. (D) Comparison of the average fluorescence
intensity of P-P65 in immunofluorescence experiments. Enzyme-linked
immunosorbent assay (ELISA) measuring cytokine expression levels of
(E) TNF-α, (F) CXCL-8 and (G) CCL2 in the PC12 and RAW264.7 cell
co-culture systems, with paired comparisons to the TBI group. (H)
Western blotting detected TYROBP expression and NF-κB pathway
activation status via P65 phosphorylation under varying conditions.
(I) CCK-8 assays comparing cell viability in each group, with the
average OD of the NC group as 100% survival for reference
calculated as, cell
viability=(ODsample-ODblank)/(ODcontrol-ODblank).
(J) Annexin V-PI assay determining cell apoptosis proportions, with
the bar chart in the lower right corner summarizing the proportions
of early-stage (annexin V positive, PI negative) and late-stage
apoptotic cells (both annexin V and PI positive). *P<0.05,
**P<0.01, ***P<0.001, ****P<0.0001. TBI, traumatic brain
injury; P-P65, phosphorylated P65; PI, Propidium iodide. |
In the immunofluorescence experiment, RAW264.7 cells
co-cultured with injured PC12 cells demonstrated marked
morphological changes, including a larger cell volume and increased
pseudopodia formation, indicative of an inflammatory response.
However, RAW264.7 cells with TYROBP gene knockouts did not exhibit
these changes, which suggested the involvement of TYROBP in this
response. Cells in the TPCA1 treatment group also lacked these
morphological changes observed in the TBI group, while the empty
plasmid group showed no inhibition of these changes, confirming
that the plasmid itself did not affect cell morphology (Fig. 9C).
The relative intensity of fluorescence signal of
phosphorylated P65 were significantly increased in the TBI group
compared with the NC group, which indicated NF-κB pathway
activation in the inflammatory response. However, in TYROBP
knockout RAW264.7 cells, the phosphorylated P65 signal was
significantly decreased compared with the TBI group, which
suggested a regulatory effect of TYROBP in P65 phosphorylation.
Likewise, the TPCA1 treatment group had a significantly decreased
signal compared with the TBI group, whereas the empty plasmid group
did not, further confirming the non-inhibitory effect of the empty
plasmid on P65 phosphorylation (Fig.
9D). These results reinforce the potential role of TYROBP in
the inflammatory response.
In ELISA experiments, cytokine levels were measured
in the co-culture medium. TNF-α (Fig.
9E), CXCL4 (Fig. 9F) and CCL2
(Fig. 9G) cytokine levels were low
in the NC group. However, their levels significantly increased in
the TBI group compared with the control, which suggested the
successful induction of the inflammatory TBI model. In the empty
plasmid group, TNF-α, CXCL4 and CCL2 levels remained high, which
demonstrated that the empty plasmid did not significantly affect
cytokine expression. In the TYROBP treatment group, the levels of
TNF-α, CXCL4 and CCL2 were significantly decreased compared with
the TBI group, suggesting a potential anti-inflammatory effect of
TYROBP. Likewise, TPCA1 also significantly reduced the levels of
TNF-α, CXCL4 and CCL2 compared with the TBI group. These results
suggest the potential of TYROBP as an anti-inflammatory target,
acting through TNF-α, CXCL8 and CCL2 signaling pathways.
Western blotting showed that the TBI group had
markedly higher levels of TYROBP protein expression compared with
the NC group and this was decreased in the TYROBP knock out group.
The P65 protein levels remained consistent between the groups, but
the level of phosphorylated P65 was increased in the TBI group
compared with the control and decreased in the TYROBP group
compared with the TBI group, which suggested that TYROBP serves a
role in the phosphorylation of P65. Likewise, TPCA1 also decreased
the levels of P65 phosphorylation compared with the TBI group, and
the empty plasmid levels were consistent with the TBI group,
showing no notable effect on protein expression. GAPDH, the
housekeeping protein, displayed consistent levels across all
groups, which confirmed the western blotting reliability (Fig. 9H).
To further assess the impact of activated microglia
on neuronal apoptosis following TBI, a CCK-8 assay was performed to
count surviving PC12 cells 24 h after brain injury. The results
demonstrated a significant decrease in cell viability in the TBI
group compared with the control, thereby validating the TBI model.
In the TYROBP group, there was a significant increase in cell
viability in the TBI group compared with the TBI group, which
indicated the possible role of TYROBP in neuronal survival.
Furthermore, treatment with the IKK-2 inhibitor, TPCA1, also
significantly increased PC12 cell viability compared with the TBI
group, suggesting the cytotoxic effect of microglia was mediated by
the NF-κB signaling pathway. Furthermore, the cell viability in the
EMP group mirrored that of the TBI group, demonstrating that the
empty plasmid did not affect the cell viability (Fig. 9I).
Annexin V/PI double staining, a common flow
cytometry method was used to evaluate cell apoptosis and death.
This technique distinguishes early apoptotic, late apoptotic,
necrotic and viable cells by using annexin V and PI concurrently.
These findings showed that cells in the NC group exhibited a small
fraction of apoptotic cells (annexin V positive) and a very low
proportion of necrotic cells (PI positive, annexin V negative),
likely due to manipulation during cell culture. In the TBI group
the number of necrotic cells increased significantly compared with
the control, which confirmed the successful establishment of the
TBI model. Likewise, the proportion of apoptotic cells in the TBI
group significantly increased compared with the control. In the
TYROBP group, the proportion of apoptotic cells significantly
decreased compared with the TBI group, supporting the earlier
observation that TYROBP gene knockout in Raw264.7 (microglia-like
cells) had a neuroprotective effect. Cells in the TYROBP knockout
group exhibited a lower proportion of necrotic cells. This
reflected the protective role of TYROBP knockout in cellular damage
responses by promoting neuronal survival, reducing apoptosis,
enhancing repair and ultimately mitigating necrosis caused by
scratch injuries. After PCA1 treatment, the proportion of apoptotic
cells also significantly decreased compared with the TBI group,
suggesting a detrimental impact of NF-κB pathway activation on
neurons. The empty plasmid group showed no significant change
compared with the TBI group, allowing the exclusion of confounding
factors in the experiment (Fig.
9J). It should be noted that when selectively separating PC12
cells in a co-culture medium, a small amount of RAW264.7 cells may
still be present. However, since the proportion of RAW264.7 cells
is inherently low, this does not affect the experimental
results.
Discussion
Neuroinflammation is a pathological feature of acute
neurological dysfunction and chronic traumatic encephalopathy
following TBI (28). Microglia, as
the primary cells of the innate immune system in the central
nervous system (CNS), serve a crucial role in neuroinflammation
after TBI (29). During brain
injury, microglia can produce neurotrophic factors, clear cellular
debris and orchestrate neural recovery processes, which are
beneficial for recovery after TBI. However, microglia may also
become dysregulated, potentially producing high levels of
pro-inflammatory cytokines and cytotoxic mediators, thereby
hindering CNS repair and leading to neuronal dysfunction and cell
death. Their activation state and functional responses following
TBI have been suggested to determine whether microglial activation
is advantageous or detrimental to neurons (30).
In the present study, the mechanisms of microglial
activation following TBI were assessed using microarray, mRNA
sequencing and single-cell analysis. The activation state of
microglia was assessed by observing changes in the morphology of
microglia-like cells, activation of inflammation-related signaling
pathways and cytokine expression. These results indicate that after
TBI, there are alterations in the interaction networks among
various cells in the nervous system. Particularly, interactions
with neurons seem to be crucial in triggering microglial
activation. Suggesting that modulation of these interactions could
enhance neuronal vitality and reduce cell death rates.
Furthermore, seven key molecules that regulate the
inflammatory process after TBI were identified. These include CD86,
a member of the immunoglobulin super-family that stimulates T-cell
activation and cytokine secretion (31); CCR5, a G protein-coupled receptor
super-family member that regulates immune cell migration and
proliferation (32); PTPRC, a
transmembrane glycoprotein crucial for innate immunity, whose
imbalance leads to immune disorders (33); ITGB2, an intercellular adhesion
molecule receptor influencing natural killer (NK) cell cytotoxicity
and supporting T-cell and neutrophil functions (34); FcγRIIB, a protein that modulates
the innate immune system, inhibits Toll-like receptors, and impacts
B cell and dendritic cell migration (35); and TLR2, a protein involved in
innate immunity and associated with adaptive immunity, which
recognizes pathogen structural molecules and triggers an immune
response. Notably, TYROBP, a transmembrane adaptor protein and
signaling partner for multiple immune-related receptors, is
essential for maintaining the stability of the immune
micro-environment of the brain (36).
TYROBP is predominantly expressed in certain myeloid
cells and NK cells, and research indicates its primary expression
in microglia within the CNS and peripheral macrophages (37). TYROBP has an immune receptor
tyrosine activation motif (ITAM) in its cytoplasmic domain. TYROBP
forms complexes with companion membrane receptors, though its
extracellular domain is short and it cannot bind to ligands. Ligand
binding to a TYROBP-associated receptor activates TYROBP through
the ITAM in its cytoplasmic domain, triggering cellular activation
responses such as cytokine production, cell proliferation and
macrophage survival (38,39). Moreover, TYROBP serves a crucial
role in osteoclast differentiation, antigen presentation and the
maturation and survival of dendritic cells, underscoring its
regulatory role in immune and cell activation processes (40).
The effect of TYROBP on the NF-κB signaling pathway
remains a topic of debate. It has been proposed that TYROBP serves
a role in immune responses by associating with certain immune
receptors, such as KIR receptors on NK cells and TREM2 on myeloid
cells (41). This association
facilitates signal transduction within the cell, leading to TYROBP
phosphorylation upon ligand recognition, activating downstream
signaling pathways including PI3K/AKT and Syk, which are crucial
for NF-κB activation, thereby triggering various immune responses
(42). Another study has suggested
that TYROBP activates Syk kinases, directly or indirectly
triggering key molecules in the NF-κB pathway, such as the IKK
complex (43). Additionally,
TYROBP activation is considered to affect intracellular calcium ion
flow, further activating NF-κB through calcium-dependent protein
kinases like PKC (44). A theory
also posits that TYROBP influences the expression of
pro-inflammatory or anti-inflammatory cytokines by microglia,
thereby affecting microglial activation through pathways other than
NF-κB (45). Thus, the role of
TYROBP in microglial activation and its interaction with the NF-κB
signaling pathway remain an area of ongoing research.
The present study suggested that the TYROBP gene is
involved in microglial activation after TBI. TYROBP activates the
downstream NF-κB signaling pathway in response to exogenous stimuli
or endogenous inflammatory factors. Once activated, NF-κB
transcribes and regulates various inflammation-related genes, such
as TNF-α, IL-1β and IL-6 cytokines and inflammatory mediators, such
as leukotrienes, prostaglandins and chemokines, leading to an
inflammatory response in neurons and glial cells. NF-κB activation
can result in neuronal apoptosis, potentially leading to cognitive
impairment and neurodegenerative diseases.
Cell-cell communication, including paracrine and
autocrine signal transmission, is fundamental in neuroendocrine and
immune regulation systems. Autocrine signaling contributes to the
growth, differentiation, and maturation of immune cells, while
paracrine communication is vital for immune cell recognition,
aggregation, adhesion and phagocytosis (46).
Aforementioned, cytokine receptors such as CCR5,
PTPRC, ITGB2, and FcRIIB serve roles in the pathological process
after TBI (47,48). Most of these receptors receive
paracrine signals from adjacent cells. The present analysis
demonstrated that microglia and macrophages receive paracrine
signals from neurons, astrocytes, endothelial cells and pericytes.
These signals primarily activate the CCL and CX3C signaling
pathways, directing leukocytes to aggregate at inflammation sites.
Chemokines like CCL, which attract monocytes and macrophages, not
only serve a chemotactic function but also provide signals for
immune cell maturation. CX3C recruits T lymphocytes and
neutrophils, and activates them to initiate immune responses
(49). Furthermore, the TNF-α and
TGF-β signaling pathways synergistically contribute to this
process, impeding cell regeneration and inducing apoptosis. TNF-α,
a key pro-inflammatory cytokine, is involved in vasodilation, edema
formation and leukocyte adhesion to epithelia through the
expression of adhesion molecules (50,51).
It also regulates blood coagulation, induces oxidative stress at
inflammation sites and indirectly causes cell death (52). TGF-β, a multifunctional cytokine
prevalent in the nervous system, serves a vital role in repairing
damaged neural tissues. It promotes growth, proliferation,
migration and differentiation of neurons and glial cells and
activates microglia, contributing to inflammation in the neural
system.
While the present study has yielded valuable
insights, it also faced certain limitations. Firstly, animal and
clinical trials were not performed, limiting the depth of
understanding of the role of TYROBP in living organisms. Although
the present study predicted the upstream and downstream signaling
pathways of TYROBP, it only assessed the role of the downstream
NF-κB signaling pathway. Consequently, the assessment of the
regulatory network mechanisms of TYROBP remains incomplete.
Additionally, there is limited research on the development of drugs
or interventions targeting TYROBP. Future studies should aim to
address these limitations to more comprehensively and accurately
understand the role of TYROBP in TBI and neuroinflammation and to
support the development of potential treatments.
In conclusion, microglia serve a critical role in
CNS damage and recovery after TBI. TYROBP is essential in
microglial activation and is directly linked to neuronal cell
death. These findings enhance understanding of the mechanisms of
neuroinflammation caused by TBI and provide crucial references for
further exploration of related treatments and interventions.
Supplementary Material
Supporting Data
Supporting Data
Acknowledgements
Not applicable.
Funding
This work was funded by the National Natural Science Foundation
of China (grant nos. 82071465 and 81571283), the Sanming Project of
Medicine in Shenzhen (grant no. SZSM201911007), the Natural Science
Foundation of Shandong (grant no. ZR2020MH154), and the Key Project
of Research and Development of Shandong Province (grant no.
2018GSF118215).
Availability of data and materials
The datasets used and/or analyzed during the current
study are available from the corresponding author on reasonable
request. Additionally, the high-throughput sequencing data was
downloaded from the Gene Expression Omnibus (https://www.ncbi.nlm.nih.gov/geo/) with accession
numbers; GSE71846, GSE180811, GSE192979, GSE173975, GSE173431,
GSE167459, GSE163415, GSE144193, GSE129927, GSE79441, GSE180862,
GSE160763 and GSE101901 (Table
SII).
Authors' contributions
XZ was responsible for writing the article and,
analyzing and interpreting the data. HS performed the single-cell
data analysis. JH managed data collection, analysis and
interpretation. WH is responsible for executing algorithms and
statistics. QL conceived and designed the study. All authors have
read and approved the final manuscript. ZX and QL confirm the
authenticity of all the raw data.
Ethics approval and consent to
participate
Not applicable.
Patient consent for publication
Not applicable.
Competing interests
The authors declare that they have no competing
interests.
References
|
1
|
GBD 2016 Traumatic Brain Injury and Spinal
Cord Injury Collaborators, . Global, regional, and national burden
of traumatic brain injury and spinal cord injury, 1990–2016: A
systematic analysis for the Global Burden of Disease Study 2016.
Lancet Neurol. 18:56–87. 2019. View Article : Google Scholar : PubMed/NCBI
|
|
2
|
Howlett JR, Nelson LD and Stein MB: Mental
health consequences of traumatic brain injury. Biol Psychiatry.
91:413–420. 2022. View Article : Google Scholar : PubMed/NCBI
|
|
3
|
Sharp DJ, Scott G and Leech R: Network
dysfunction after traumatic brain injury. Nat Rev Neurol.
10:156–166. 2014. View Article : Google Scholar : PubMed/NCBI
|
|
4
|
Kenney K, Amyot F, Haber M, Pronger A,
Bogoslovsky T, Moore C and Diaz-Arrastia R: Cerebral vascular
injury in traumatic brain injury. Exp Neurol. 275:353–366. 2016.
View Article : Google Scholar : PubMed/NCBI
|
|
5
|
Corps KN, Roth TL and McGavern DB:
Inflammation and neuroprotection in traumatic brain injury. JAMA
Neurol. 72:355–362. 2015. View Article : Google Scholar : PubMed/NCBI
|
|
6
|
Maas AIR, Menon DK, Manley GT, Abrams M,
Åkerlund C, Andelic N, Aries M, Bashford T, Bell MJ, Bodien YG, et
al: Traumatic brain injury: Integrated approaches to improve
prevention, clinical care, and research. Lancet Neurol.
16:987–1048. 2017. View Article : Google Scholar : PubMed/NCBI
|
|
7
|
Devanney NA, Stewart AN and Gensel JC:
Microglia and macrophage metabolism in CNS injury and disease: The
role of immunometabolism in neurodegeneration and neurotrauma. Exp
Neurol. 329:1133102020. View Article : Google Scholar : PubMed/NCBI
|
|
8
|
Zhang ZW, Liang J, Yan JX, Ye YC, Wang JJ,
Chen C, Sun HT, Chen F, Tu Y and Li XH: TBHQ improved neurological
recovery after traumatic brain injury by inhibiting the
overactivation of astrocytes. Brain Res. 1739:1468182020.
View Article : Google Scholar : PubMed/NCBI
|
|
9
|
Tang B, Song M, Xie X, Le D, Tu Q, Wu X
and Chen M: Tumor necrosis factor-stimulated gene-6 (TSG-6)
Secreted by BMSCs regulates activated astrocytes by inhibiting
NF-κB signaling pathway to ameliorate blood brain barrier damage
after intracerebral hemorrhage. Neurochem Res. 46:2387–2402. 2021.
View Article : Google Scholar : PubMed/NCBI
|
|
10
|
Dinet V, Petry KG and Badaut J:
Brain-Immune Interactions and Neuroinflammation After Traumatic
Brain Injury. Front Neurosci. 13:11782019. View Article : Google Scholar : PubMed/NCBI
|
|
11
|
Takahashi H, Klein ZA, Bhagat SM, Kaufman
AC, Kostylev MA, Ikezu T and Strittmatter SM: Alzheimer's Disease
Neuroimaging Initiative: Opposing effects of progranulin deficiency
on amyloid and tau pathologies via microglial TYROBP network. Acta
Neuropathol. 133:785–807. 2017. View Article : Google Scholar : PubMed/NCBI
|
|
12
|
Castranio EL, Mounier A, Wolfe CM, Nam KN,
Fitz NF, Letronne F, Schug J, Koldamova R and Lefterov I: Gene
co-expression networks identify Trem2 and TYROBP as major hubs in
human APOE expressing mice following traumatic brain injury.
Neurobiol Dis. 105:1–14. 2017. View Article : Google Scholar : PubMed/NCBI
|
|
13
|
Haure-Mirande JV, Audrain M, Ehrlich ME
and Gandy S: Microglial TYROBP/DAP12 in Alzheimer's disease:
Transduction of physiological and pathological signals across
TREM2. Mol Neurodegener. 17:552022. View Article : Google Scholar : PubMed/NCBI
|
|
14
|
Haure-Mirande JV, Wang M, Audrain M,
Fanutza T, Kim SH, Heja S, Readhead B, Dudley JT, Blitzer RD,
Schadt EE, et al: Integrative approach to sporadic Alzheimer's
disease: Deficiency of TYROBP in cerebral Aβ amyloidosis mouse
normalizes clinical phenotype and complement subnetwork molecular
pathology without reducing Aβ burden. Mol Psychiatry. 24:431–446.
2019. View Article : Google Scholar : PubMed/NCBI
|
|
15
|
Darwent L, Carmona S, Lohmann E, Guven G,
Kun-Rodrigues C, Bilgic B, Hanagasi H, Gurvit H, Erginel-Unaltuna
N, Pak M, et al: Mutations in TYROBP are not a common cause of
dementia in a Turkish cohort. Neurobiol Aging. 58:240.e1–240.e3.
2017. View Article : Google Scholar : PubMed/NCBI
|
|
16
|
Siebold L, Obenaus A and Goyal R: Criteria
to define mild, moderate, and severe traumatic brain injury in the
mouse controlled cortical impact model. Exp Neurol. 310:48–57.
2018. View Article : Google Scholar : PubMed/NCBI
|
|
17
|
Leek JT, Johnson WE, Parker HS, Jaffe AE
and Storey JD: The sva package for removing batch effects and other
unwanted variation in high-throughput experiments. Bioinformatics.
28:882–883. 2012. View Article : Google Scholar : PubMed/NCBI
|
|
18
|
Ritchie ME, Phipson B, Wu D, Hu Y, Law CW,
Shi W and Smyth GK: Limma powers differential expression analyses
for RNA-sequencing and microarray studies. Nucleic Acids Res.
43:e472015. View Article : Google Scholar : PubMed/NCBI
|
|
19
|
Zhou Y, Zhou B, Pache L, Chang M,
Khodabakhshi AH, Tanaseichuk O, Benner C and Chanda SK: Metascape
provides a biologist-oriented resource for the analysis of
systems-level datasets. Nat Commun. 10:15232019. View Article : Google Scholar : PubMed/NCBI
|
|
20
|
Langfelder P and Horvath S: WGCNA: An R
package for weighted correlation network analysis. BMC
Bioinformatics. 9:5592008. View Article : Google Scholar : PubMed/NCBI
|
|
21
|
Wilkerson MD and Hayes DN:
ConsensusClusterPlus: A class discovery tool with confidence
assessments and item tracking. Bioinformatics. 26:1572–1573. 2010.
View Article : Google Scholar : PubMed/NCBI
|
|
22
|
Qiu X, Mao Q, Tang Y, Wang L, Chawla R,
Pliner HA and Trapnell C: Reversed graph embedding resolves complex
single-cell trajectories. Nat Methods. 14:979–982. 2017. View Article : Google Scholar : PubMed/NCBI
|
|
23
|
Hao Y, Hao S, Andersen-Nissen E, Mauck WM
III, Zheng S, Butler A, Lee MJ, Wilk AJ, Darby C, Zager M, et al:
Integrated analysis of multimodal single-cell data. Cell.
184:3573–3587.e29. 2021. View Article : Google Scholar : PubMed/NCBI
|
|
24
|
Jin S, Guerrero-Juarez CF, Zhang L, Chang
I, Ramos R, Kuan CH, Myung P, Plikus MV and Nie Q: Inference and
analysis of cell-cell communication using CellChat. Nat Commun.
12:10882021. View Article : Google Scholar : PubMed/NCBI
|
|
25
|
Liu N, Li Y, Jiang Y, Shi S, Niamnud A,
Vodovoz SJ, Katakam PVG, Vidoudez C, Dumont AS and Wang X:
Establishment and application of a novel in vitro model of
microglial activation in traumatic brain injury. J Neurosci.
43:319–332. 2023. View Article : Google Scholar : PubMed/NCBI
|
|
26
|
Sachse F, Becker K, Basel TJ, Weiss D and
Rudack C: IKK-2 inhibitor TPCA-1 represses nasal epithelial
inflammation in vitro. Rhinology. 49:168–173. 2011. View Article : Google Scholar : PubMed/NCBI
|
|
27
|
Livak KJ and Schmittgen TD: Analysis of
relative gene expression data using real-time quantitative PCR and
the 2(−Delta Delta C(T)) method. Methods. 25:402–408. 2001.
View Article : Google Scholar : PubMed/NCBI
|
|
28
|
Willis EF, MacDonald KPA, Nguyen QH,
Garrido AL, Gillespie ER, Harley SBR, Bartlett PF, Schroder WA,
Yates AG, Anthony DC, et al: Repopulating microglia promote brain
repair in an IL-6-Dependent manner. Cell. 180:833–846.e16. 2020.
View Article : Google Scholar : PubMed/NCBI
|
|
29
|
Wu H, Zheng J, Xu S, Fang Y, Wu Y, Zeng J,
Shao A, Shi L, Lu J, Mei S, et al: Mer regulates
microglial/macrophage M1/M2 polarization and alleviates
neuroinflammation following traumatic brain injury. J
Neuroinflammation. 18:22021. View Article : Google Scholar : PubMed/NCBI
|
|
30
|
Krukowski K, Nolan A, Becker M, Picard K,
Vernoux N, Frias ES, Feng X, Tremblay ME and Rosi S: Novel
microglia-mediated mechanisms underlying synaptic loss and
cognitive impairment after traumatic brain injury. Brain Behav
Immun. 98:122–135. 2021. View Article : Google Scholar : PubMed/NCBI
|
|
31
|
Kennedy A, Waters E, Rowshanravan B, Hinze
C, Williams C, Janman D, Fox TA, Booth C, Pesenacker AM, Halliday
N, et al: Differences in CD80 and CD86 transendocytosis reveal CD86
as a key target for CTLA-4 immune regulation. Nat Immunol.
23:1365–1378. 2022. View Article : Google Scholar : PubMed/NCBI
|
|
32
|
Necula D, Riviere-Cazaux C, Shen Y and
Zhou M: Insight into the roles of CCR5 in learning and memory in
normal and disordered states. Brain Behav Immun. 92:1–9. 2021.
View Article : Google Scholar : PubMed/NCBI
|
|
33
|
Al Barashdi MA, Ali A, McMullin MF and
Mills K: Protein tyrosine phosphatase receptor type C (PTPRC or
CD45). J Clin Pathol. 74:548–552. 2021. View Article : Google Scholar : PubMed/NCBI
|
|
34
|
Xu H, Zhang A, Han X, Li Y, Zhang Z, Song
L, Wang W and Lou M: ITGB2 as a prognostic indicator and a
predictive marker for immunotherapy in gliomas. Cancer Immunol
Immunother. 71:645–660. 2022. View Article : Google Scholar : PubMed/NCBI
|
|
35
|
Verbeek JS, Hirose S and Nishimura H: The
Complex association of FcγRIIb with autoimmune susceptibility.
Front Immunol. 10:20612019. View Article : Google Scholar : PubMed/NCBI
|
|
36
|
Konishi H and Kiyama H: Microglial
TREM2/DAP12 Signaling: A Double-Edged sword in neural diseases.
Front Cell Neurosci. 12:2062018. View Article : Google Scholar : PubMed/NCBI
|
|
37
|
Audrain M, Haure-Mirande JV, Mleczko J,
Wang M, Griffin JK, St George-Hyslop PH, Fraser P, Zhang B, Gandy S
and Ehrlich ME: Reactive or transgenic increase in microglial
TYROBP reveals a TREM2-independent TYROBP-APOE link in wild-type
and Alzheimer's-related mice. Alzheimers Dement. 17:149–163. 2021.
View Article : Google Scholar : PubMed/NCBI
|
|
38
|
Zhou Y, Tada M, Cai Z, Andhey PS, Swain A,
Miller KR, Gilfillan S, Artyomov MN, Takao M, Kakita A, et al:
Human early-onset dementia caused by DAP12 deficiency reveals a
unique signature of dysregulated microglia. Nat Immunol.
24:545–557. 2023. View Article : Google Scholar : PubMed/NCBI
|
|
39
|
Zhao N, Ren Y, Yamazaki Y, Qiao W, Li F,
Felton LM, Mahmoudiandehkordi S, Kueider-Paisley A, Sonoustoun B,
Arnold M, et al: Alzheimer's risk factors age, APOE genotype, and
sex drive distinct molecular pathways. Neuron. 106:727–742. 2020.
View Article : Google Scholar : PubMed/NCBI
|
|
40
|
Paradowska-Gorycka A and Jurkowska M:
Structure, expression pattern and biological activity of molecular
complex TREM-2/DAP12. Hum Immunol. 74:730–737. 2013. View Article : Google Scholar : PubMed/NCBI
|
|
41
|
Haure-Mirande JV, Audrain M, Ehrlich ME
and Gandy S: Microglial TYROBP/DAP12 in Alzheimer's disease:
Transduction of physiological and pathological signals across
TREM2. Mol Neurodegener. 17:552022. View Article : Google Scholar : PubMed/NCBI
|
|
42
|
Lanier LL and Bakker AB: The ITAM-bearing
transmembrane adaptor DAP12 in lymphoid and myeloid cell function.
Immunol Today. 21:611–614. 2000. View Article : Google Scholar : PubMed/NCBI
|
|
43
|
Peng Q, Malhotra S, Torchia JA, Kerr WG,
Coggeshall KM and Humphrey MB: TREM2- and DAP12-dependent
activation of PI3K requires DAP10 and is inhibited by SHIP1. Sci
Signal. 3:ra382010. View Article : Google Scholar : PubMed/NCBI
|
|
44
|
Zhang L, Wei X, Wang Z, Liu P, Hou Y, Xu
Y, Su H, Koci MD, Yin H and Zhang C: NF-κB activation enhances
STING signaling by altering microtubule-mediated STING trafficking.
Cell Rep. 42:1121852023. View Article : Google Scholar : PubMed/NCBI
|
|
45
|
Mecca C, Giambanco I, Donato R and Arcuri
C: Microglia and aging: The role of the TREM2-DAP12 and
CX3CL1-CX3CR1 Axes. Int J Mol Sci. 19:3182018. View Article : Google Scholar : PubMed/NCBI
|
|
46
|
Gyoneva S and Ransohoff RM: Inflammation
after traumatic brain injury: therapeutic potential of targeting
cell-cell communication by chemokines. Trends Pharmacol Sci.
36:471–480. 2015. View Article : Google Scholar : PubMed/NCBI
|
|
47
|
Joy MT, Ben Assayag E, Shabashov-Stone D,
Liraz-Zaltsman S, Mazzitelli J, Arenas M, Abduljawad N, Kliper E,
Korczyn AD, Thareja NS, et al: CCR5 Is a therapeutic target for
recovery after stroke and traumatic brain injury. Cell.
176:1143–1157.e13. 2019. View Article : Google Scholar : PubMed/NCBI
|
|
48
|
Morris AB, Farley CR, Pinelli DF, Adams
LE, Cragg MS, Boss JM, Scharer CD, Fribourg M, Cravedi P, Heeger PS
and Ford ML: Signaling through the Inhibitory Fc Receptor FcγRIIB
Induces CD8+ T Cell Apoptosis to Limit T Cell Immunity. Immunity.
52:136–150. 2020. View Article : Google Scholar : PubMed/NCBI
|
|
49
|
Pawelec P, Ziemka-Nalecz M, Sypecka J and
Zalewska T: The impact of the CX3CL1/CX3CR1 axis in neurological
disorders. Cells. 9:22772020. View Article : Google Scholar : PubMed/NCBI
|
|
50
|
Younger D, Murugan M, Rama Rao KV, Wu LJ
and Chandra N: Microglia receptors in animal models of traumatic
brain injury. Mol Neurobiol. 56:5202–5228. 2019. View Article : Google Scholar : PubMed/NCBI
|
|
51
|
Blaser H, Dostert C, Mak TW and Brenner D:
TNF and ROS Crosstalk in Inflammation. Trends Cell Biol.
26:249–261. 2016. View Article : Google Scholar : PubMed/NCBI
|
|
52
|
Meyers EA and Kessler JA: TGF-β family
signaling in neural and neuronal differentiation, development, and
function. Cold Spring Harb Perspect Biol. 9:a0222442017. View Article : Google Scholar : PubMed/NCBI
|