Introduction
Craniotomy is a basic surgical procedure for
managing most patients with brain tumors. However, craniotomies for
intracranial tumors are associated with significant and numerous
risks of postoperative complications, including death (1–3).
Postoperative 30-day mortality, which is also known as 30-day
postoperative mortality, is widely used to assess the short-term
outcomes of patients undergoing various surgeries (4,5). It is
also used to evaluate the effectiveness of access to and safety of
anesthesia and surgery (6).
Postoperative 30-day mortality was shown to be 5.03% in an American
study of 16,280 patients who underwent craniotomy (7). Another study of craniotomy patients
treated from 2008–2010 at multiple centers in England reported a
range of mortality rates from 0.95 to 8.62% (8). Therefore, obtaining accurate
individualized preoperative risk predictions of short-term outcomes
is important for clinical decision-making and further
management.
Numerous predictive scoring systems for the severity
of illness or prognosis, such as the Glasgow Coma Scale for
traumatic brain injury (9), the
Hunt and Hess scale for aneurysmal subarachnoid hemorrhage
(10) and the Unified Parkinson's
Disease Rating Scale for Parkinson's disease, have been widely used
in neurology (11). Accordingly,
previous studies have attempted to construct diagnostic or
prognostic prediction models for patients with various intracranial
tumors, including gliomas (12–15),
meningiomas (16,17), brain metastases (18–20),
clival chordomas (21) and
medulloblastomas (22); in
addition, the clinical value of these nomograms has been
emphasized. This research has focused mainly on a single disease,
and a small number of studies have focused on the risk prediction
of prognosis after craniotomy in patients with brain tumors
(12–14,18–20).
Several preoperative risk factors for postoperative pneumonia after
craniotomy have been identified based on an American database
(2005–2017) (23). However, to the
best of our knowledge, neither nomograms nor preoperative scoring
systems have been reported to evaluate and predict 30-day mortality
risk after brain tumor craniotomy. In the present study, a novel
scoring system for predicting postoperative 30-day mortality was
developed in 18,642 craniotomy patients. It is anticipated that the
mortality risk prediction model will help clinicians (particularly
neurosurgeons), patients and their families assess postoperative
30-day mortality and choose related and positive interventions to
prevent or reduce mortality.
Patients and methods
Study design and population
A retrospective analysis of 18,642 participants with
brain tumors who underwent craniotomy between 2012 and 2015 was
performed; the information regarding these patients was retrieved
from the American College of Surgeons National Surgical Quality
Improvement Program (ACS NSQIP) database (https://www.ncbi.nlm.nih.gov/pmc/articles/PMC7498000/,
S1 Data). The ACS NSQIP is a validated, prospectively collected,
publicly available, peer-controlled database of a random sample of
outpatients and inpatients undergoing nontrauma surgery at ~400
community and academic hospitals across the US. The identities of
the patients were encrypted as nontraceable codes to ensure
participant privacy. Variables at baseline were included as
screening variables in the prediction model in the present study.
The dependent variable was postoperative 30-day mortality
(dichotomous variable: 0=nonpostoperative 30-day mortality;
1=postoperative 30-day mortality).
Data source
Zhang et al (24) previously published an article titled
‘Sepsis and septic shock after craniotomy: Predicting a significant
patient safety and quality outcome measure’ and uploaded the
original data to the ACS NSQIP database. The uploaded data are
available for use in secondary analyses without infringement on the
authors' rights and the copyright statement.
Variables
The following variables were extracted for the
present study according to the previous literature and our clinical
experience: i) Continuous variables, including body height, body
weight and indicators of preoperative blood test results
[hematocrit (HCT), blood urea nitrogen (BUN), white blood cell
(WBC) count, creatine (Cr) and platelet (PLT) count], and ii)
categorical variables, including sex, ethnicity, age range,
diabetes status, smoking status, year of operation, dyspnea,
functional health status, ventilator dependence, severe chronic
obstructive pulmonary disease (COPD), congestive heart failure
(CHF), hypertension, renal failure, preoperation transfusions,
dialysis, disseminated cancer, preoperative systemic sepsis, open
wound infection, steroid use for chronic conditions, >10% loss
of body weight in the last 6 months, bleeding disorders, emergency
cases, wound classification and American Society of
Anesthesiologists (ASA) physical status classification. More
elaborate details were presented in the original study (24). The body mass index (BMI) was
calculated as weight in kilograms divided by height in meters
squared (kg/m2).
Handling of missing baseline
variables
The number of participants with missing BMI (weight
and height), functional health status, Na, BUN, Cr, WBC, HCT, PLT
and ASA data was 730 (3.92%), 90 (0.48%), 798 (4.28%), 1,532
(8.22%), 709 (3.8%), 592 (3.18%), 440 (2.36%), 579 (3.11%) and 166
(0.89%), respectively. Multiple imputation techniques are widely
accepted as appropriate methods for handling missing data (25). This method was used to input missing
values for the extracted variables in the present study. The
imputation model included BMI; functional health status; Na, BUN,
and Cr levels; WBC count; HCT level; PLT count; and ASA
classification. Missing data analysis procedures used
missing-at-random assumptions (26).
Outcome measures
The primary outcome variable was postoperative
30-day mortality. The NSQIP was used to track mortality for the
first 30 postoperative days (24).
Statistical analysis
A training dataset (patients who underwent
craniotomy in 2012 and 2013) and an external validation dataset
(those who underwent craniotomy in 2014 and 2015) were generated
from the initial study population. The training dataset was used to
establish the model and the external validation dataset was used
for independent evaluation of the preliminary model's
performance.
Baseline characteristics are expressed as the mean ±
standard deviation (normal distribution) or the median
(interquartile range) (skewed distribution) for continuous
variables and as the frequency and percentage for categorical
variables. Two-samples t-tests were applied to analyze differences
between the training and validation cohorts for normally
distributed continuous variables. Wilcoxon rank-sum tests were used
for nonnormally distributed continuous variables, and chi-square
test or Fisher's exact test was used for categorical variables. The
baseline characteristics of the training and validation cohorts
stratified were also presented with stratification by incident
30-day mortality. Univariate and multivariate analyses were also
performed to identify potential risk factors of 30-day
postoperative mortality after craniotomy for brain tumors.
To construct a reliable and simple risk prediction
model, two rounds of variable screening were conducted. The least
absolute shrinkage and selection operator (LASSO) method is
frequently used for domains with very large datasets and is
suitable for the reduction of high-dimensional data (27). This dataset was used to select the
most useful predictive candidates from the training dataset.
Candidates with nonzero coefficients in the LASSO regression model
were selected (28). A second
screening round was performed based on the LASSO model's identified
variables. First, all of the risk factors were applied to construct
a full logistic regression model. Second, a backward step-down
selection process was conducted according to the Akaike information
criterion to establish a parsimonious model (a stepwise logistic
proportional hazards model) (29).
Third, according to the multivariable fractional polynomial (MFP)
algorithm, an iterative approach was used to determine the
significant variables and functional form via backward elimination
to establish a stable model (MFP model) in the real world (30). Considering that there were fewer
variables in the stepwise model and that the predictive performance
was relatively good, the stepwise model was selected for further
analysis.
To evaluate and compare the discriminatory power of
these prediction models, the receiver operating characteristic
(ROC) curve was plotted and the area under the ROC curve (AUC) with
95% confidence intervals (CIs) was calculated for the training
dataset and validation dataset. The sensitivity, specificity,
positive predictive value (PPV), negative predictive value (NPV),
positive likelihood ratio (PLR), negative likelihood ratio (NLR)
and diagnostic odds ratio (DOR) of the stepwise model, which were
calculated according to standard definitions, were simultaneously
presented. A prediction formula was obtained from the stepwise
logistic proportional hazards model. The nomogram was based on
proportionally converting each regression coefficient in the
multivariate logistic regression to a 0- to 100-point scale
(31). The effect of the variable
with the highest β coefficient (absolute value) was assigned 100
points. The points were added across independent variables to
derive total points, which were converted to predicted
probabilities of postoperative 30-day mortality. The nomogram score
was a numeric value representing the prediction model score of the
individual patient. The sensitivity and specificity for predicting
30-day mortality were different at different cutoff values of the
nomogram scores. In addition, a calibration plot for the
probability of 30-day mortality was generated to assess the
accuracy of the nomogram (32).
The associated risk factors for 30-day mortality in
the stepwise model were also categorized according to clinical
cutoff points to create the score model of 30-day mortality. These
risk factors, which were treated as categorical variables, were
included in the stepwise logistic proportional hazards model and a
new β coefficient was derived. The scoring system was developed
based on regression coefficients multiplied by 2 and rounded to the
nearest integer to derive the weights of the scores (33). This scoring system was subsequently
presented as a questionnaire form that can be easily used by health
personnel in primary care. The total score was divided into four
risk categories: Low, intermediate, high and extremely high risk
categories. The performance of our risk score model for predicting
postoperative 30-day mortality was also tested by analyzing the
performance of each risk factor in the model and its optimal cutoff
for predicting postoperative 30-day mortality based on ROC curves.
All of the results are reported according to the TRIPOD statement
(34).
All of the analyses were performed with the
statistical software packages R (http://www.R-project.org; The R Foundation) and
EmpowerStats (http://www.empowerstats.com; X&Y Solutions, Inc.).
All of the tests were 2-sided, with P<0.05 considered to
indicate statistical significance.
Results
Baseline characteristics of
patients
The current study included 18,642 adult participants
(47.40% of whom were men) (Table
SI). The age distributions were 16.40% (18–40 years), 41.53%
(41–60 years), 38.80% (61–80 years) and 3.27% (>81 years). The
mean BMI was 28.69±6.72 kg/m2, the mean Na concentration
was 138.62±3.22 mmol/l, the mean BUN concentration was 17.39±8.31
mg/dl, the mean Cr concentration was 0.87±0.45 mg/dl, the mean WBC
count was 9.50±4.48×10⁹/l, the mean HCT level was
40.35±4.81%, and the mean PLT count was
243.4±76.90×10⁹/l. The postoperative 30-day mortality of
the included participants was 2.46% (458/18,642).
Characteristics of patients in
different groups
Table I shows the
basic demographic, anthropological and clinical information for the
eligible participants. The participants were assigned to two groups
based on the year of surgery: The training dataset (2012–2013) and
the validation dataset (2014–2015). For numerous baseline
characteristics, although the differences between the training
cohort and the validation cohort were statistically significant due
to the large sample size (P<0.05), they were not clinically
significant.
 | Table I.Characteristics of patients in the
training and validation datasets. |
Table I.
Characteristics of patients in the
training and validation datasets.
| Clinical
parameter | Training dataset
(n=7,800) | Validation dataset
(n=10,842) | P-value |
|---|
| BMI,
kg/m2 | 28.667±6.842 | 28.709±6.639 | 0.678 |
| Na, mmol/l | 138.638±3.241 | 138.599±3.210 | 0.414 |
| BUN, mg/dl | 16.000
(12.000–21.000) | 16.000
(12.000–21.000) | 0.498 |
| Cr, mg/dl | 0.800
(0.690–0.970) | 0.800
(0.700–0.970) | 0.109 |
| WBC,
×109/l | 8.400
(6.400–11.600) | 8.500
(6.400–11.700) | 0.226 |
| HCT, % | 40.184±4.813 | 40.474±4.800 | <0.001 |
| PLT,
×109/l | 240.563±77.187 | 245.432±76.619 | <0.001 |
| Sex |
|
| 0.723 |
|
Male | 3,709 (47.551) | 5,127 (47.288) |
|
|
Female | 4,091 (52.449) | 5,715 (52.712) |
|
| Ethnicity |
|
| <0.001 |
|
White | 5,781 (74.115) | 7,509 (69.258) |
|
|
Asian | 242 (3.103) | 301 (2.776) |
|
| African
American | 481 (6.167) | 764 (7.047) |
|
|
Unknown | 1,296 (16.615) | 2,268 (20.919) |
|
| Age range,
years |
|
| 0.048 |
|
18-40 | 1,251 (16.038) | 1,806 (16.657) |
|
|
41-60 | 3,273 (41.962) | 4,469 (41.219) |
|
|
61-80 | 2,992 (38.359) | 4,241 (39.116) |
|
|
>81 | 284 (3.641) | 326 (3.007) |
|
| Diabetes |
|
| 0.707 |
| No | 6,901 (88.474) | 9,561 (88.185) |
|
| Yes
(noninsulin-dependent) | 575 (7.372) | 804 (7.416) |
|
| Yes
(insulin-dependent) | 324 (4.154) | 477 (4.400) |
|
| Smoking status |
|
| 0.284 |
| No | 6,261 (80.269) | 8,771 (80.898) |
|
|
Yes | 1,539 (19.731) | 2,071 (19.102) |
|
| Dyspnea |
|
| 0.049 |
|
None | 7,460 (95.641) | 10,430
(96.200) |
|
|
Moderate exertion | 314 (4.026) | 367 (3.385) |
|
| At
rest | 26 (0.333) | 45 (0.415) |
|
| Functional health
status |
|
| <0.001 |
|
Independent | 7,422 (95.154) | 10,446
(96.348) |
|
|
Partially dependent | 331 (4.244) | 349 (3.219) |
|
| Totally
dependent | 47 (0.603) | 47 (0.433) |
|
|
Ventilator-dependent |
|
| 0.748 |
| No | 7,709 (98.833) | 10,721
(98.884) |
|
|
Yes | 91 (1.167) | 121 (1.116) |
|
| Severe COPD |
|
| 0.104 |
| No | 7,428 (95.231) | 10,379
(95.730) |
|
|
Yes | 372 (4.769) | 463 (4.270) |
|
| CHF |
|
| 0.330 |
| No | 7,779 (99.731) | 10,804
(99.650) |
|
|
Yes | 21 (0.269) | 38 (0.350) |
|
| Hypertension |
|
| 0.084 |
| No | 4,766 (61.103) | 6,760 (62.350) |
|
|
Yes | 3,034 (38.897) | 4,082 (37.650) |
|
| Renal failure |
|
| 0.246 |
| No | 7,792 (99.897) | 10,836
(99.945) |
|
|
Yes | 8 (0.103) | 6 (0.055) |
|
| Dialysis |
|
| 0.054 |
| No | 7,769 (99.603) | 10,816
(99.760) |
|
|
Yes | 31 (0.397) | 26 (0.240) |
|
| Disseminated
cancer |
|
| 0.023 |
| No | 6,180 (79.231) | 8,440 (77.845) |
|
|
Yes | 1,620 (20.769) | 2,402 (22.155) |
|
| Open wound
infection |
|
| 0.607 |
| No | 7,732 (99.128) | 10,755
(99.198) |
|
|
Yes | 68 (0.872) | 87 (0.802) |
|
| Steroid use for
chronic condition |
|
| <0.001 |
| No | 6,517 (83.551) | 9,326 (86.017) |
|
|
Yes | 1,283 (16.449) | 1,516 (13.983) |
|
| >10% loss body
weight in last 6 months |
|
| 0.875 |
| No | 7,629 (97.808) | 10,608
(97.842) |
|
|
Yes | 171 (2.192) | 234 (2.158) |
|
| Bleeding
disorders |
|
| 0.026 |
| No | 7,623 (97.731) | 10,646
(98.192) |
|
|
Yes | 177 (2.269) | 196 (1.808) |
|
| Pre-operative
transfusions |
|
| 0.870 |
| No | 7,773 (99.654) | 10,806
(99.668) |
|
|
Yes | 27 (0.346) | 36 (0.332) |
|
| Pre-operative
systemic sepsis |
|
| 0.208 |
| No | 7,507 (96.244) | 10,463
(96.504) |
|
|
SIRS | 268 (3.436) | 360 (3.320) |
|
|
Sepsis | 18 (0.231) | 15 (0.138) |
|
| Septic
shock | 7 (0.090) | 4 (0.037) |
|
| Emergency case |
|
| 0.891 |
| No | 7,301 (93.603) | 10,143
(93.553) |
|
|
Yes | 499 (6.397) | 699 (6.447) |
|
| Wound
classification |
|
| 0.035 |
|
Clean | 7,562 (96.949) | 10,565
(97.445) |
|
|
Clean/contaminated | 94 (1.205) | 127 (1.171) |
|
|
Contaminated | 117 (1.500) | 111 (1.024) |
|
|
Dirty/infected | 27 (0.346) | 39 (0.360) |
|
| ASA
classification |
|
| <0.001 |
| No
disturbance | 115 (1.474) | 138 (1.273) |
|
| Mild
disturbance | 2,129 (27.295) | 2,694 (24.848) |
|
| Severe
disturbance | 4,630 (59.359) | 6,406 (59.085) |
|
| Life
threat | 915 (11.731) | 1,577 (14.545) |
|
|
Moribund | 11 (0.141) | 27 (0.249) |
|
Table II shows the
baseline characteristics of patients with nonpostoperative 30-day
mortality and postoperative 30-day mortality in the training and
validation datasets. The participants with postoperative 30-day
mortality had higher BUN levels and WBC counts in the training and
validation cohorts (all P<0.01). By contrast, the participants
who died within 30 days postoperatively had lower Na
concentrations, HCT levels and PLT counts (all P<0.05).
| Table II.Baseline characteristics for the
training and validation cohorts by incident 30-day mortality. |
Table II.
Baseline characteristics for the
training and validation cohorts by incident 30-day mortality.
|
| Training
cohort | Validation
cohort |
|---|
|
|
|
|
|---|
| Clinical
parameter | No 30-day mortality
(n=7,615) | 30-day mortality
(n=185) | P- value | No 30-day mortality
(n=10,569) | 30-day mortality
(n=273) | P-value |
|---|
| BMI,
kg/m2 | 28.699±6.851 | 27.378±6.362 | 0.009 | 28.714±6.634 | 28.525±6.840 | 0.643 |
| Na, mmol/l | 138.663±3.206 | 137.622±4.335 | <0.001 | 138.626±3.179 | 137.551±4.114 | <0.001 |
| BUN, mg/dl | 16.000 | 20.000 | <0.001 | 16.000 | 20.000 | <0.001 |
|
|
(12.000–21.000) |
(15.000–27.000) |
|
(12.000–21.000) |
(15.000–27.000) |
|
| Cr, mg/dl | 0.800 | 0.837 | 0.187 | 0.800 | 0.810 | 0.159 |
|
| (0.690–0.970) | (0.670–1.020) |
| (0.700–0.970) | (0.700–0.980) |
|
| WBC
(×109/l) | 8.400 | 10.100 | <0.001 | 8.500 | 10.800 | <0.001 |
|
| (6.400–11.535) | (7.700–14.300) |
| (6.400–11.600) | (8.000–13.700) |
|
| HCT, % | 40.239±4.751 | 37.896±6.496 | <0.001 | 40.523±4.744 | 38.576±6.335 | <0.001 |
| PLT
(×109/l) | 233.000 | 214.000 | 0.011 | 238.000 | 218.000 | <0.001 |
|
|
(191.000–281.000) |
(174.000–281.000) |
|
(196.000–287.000) |
(168.000–283.282) |
|
| Sex |
|
| 0.002 |
|
| <0.001 |
|
Male | 3,600 (47.275) | 109 (58.919) |
| 4,971 (47.034) | 156 (57.143) |
|
|
Female | 4,015 (52.725) | 76 (41.081) |
| 5,598 (52.966) | 117 (42.857) |
|
| Ethnicity |
|
| 0.627 |
|
| 0.158 |
|
White | 5,637 (74.025) | 144 (77.838) |
| 7,332 (69.373) | 177 (64.835) |
|
|
Asian | 237 (3.112) | 5 (2.703) |
| 296 (2.801) | 5 (1.832) |
|
|
African | 473 (6.211) | 8 (4.324) |
| 744 (7.039) | 20 (7.326) |
|
|
American |
|
|
|
|
|
|
|
Unknown | 1,268 (16.651) | 28 (15.135) |
| 2,197 (20.787) | 71 (26.007) |
|
| Age, years |
|
| <0.001 |
|
| <0.001 |
|
18-40 | 1,243 (16.323) | 8 (4.324) |
| 1,793 (16.965) | 13 (4.762) |
|
|
41-60 | 3,220 (42.285) | 53 (28.649) |
| 4,381 (41.451) | 88 (32.234) |
|
|
61-80 | 2,895 (38.017) | 97 (52.432) |
| 4,099 (38.783) | 142 (52.015) |
|
|
>81 | 257 (3.375) | 27 (14.595) |
| 296 (2.801) | 30 (10.989) |
|
| Diabetes |
|
| 0.006 |
|
| <0.001 |
| No | 6,748 (88.615) | 153 (82.703) |
| 9,348 (88.447) | 213 (78.022) |
|
| Yes
(noninsulin-dependent) | 559 (7.341) | 16 (8.649) |
| 773 (7.314) | 31 (11.355) |
|
| Yes
(insulin-dependent) | 308 (4.045) | 16 (8.649) |
| 448 (4.239) | 29 (10.623) |
|
| Smoking status |
|
| 0.513 |
|
| 0.449 |
| No | 6,116 (80.315) | 145 (78.378) |
| 8,555 (80.944) | 216 (79.121) |
|
|
Yes | 1,499 (19.685) | 40 (21.622) |
| 2,014 (19.056) | 57 (20.879) |
|
| Dyspnea |
|
| <0.001 |
|
| 0.014 |
| No | 7,296 (95.811) | 164 (88.649) |
| 10,176
(96.282) | 254 (93.040) |
|
|
Moderate exertion | 294 (3.861) | 20 (10.811) |
| 351 (3.321) | 16 (5.861) |
|
| At
rest | 25 (0.328) | 1 (0.541) |
| 42 (0.397) | 3 (1.099) |
|
| Functional health
status |
|
| <0.001 |
|
| <0.001 |
|
Independent | 7,271 (95.483) | 151 (81.622) |
| 10,208
(96.584) | 238 (87.179) |
|
|
Partially dependent | 301 (3.953) | 30 (16.216) |
| 323 (3.056) | 26 (9.524) |
|
| Totally
dependent | 43 (0.565) | 4 (2.162) |
| 38 (0.360) | 9 (3.297) |
|
|
Ventilator-dependent |
|
| <0.001 |
|
| <0.001 |
| No | 7,533 (98.923) | 176 (95.135) |
| 10,460
(98.969) | 261 (95.604) |
|
|
Yes | 82 (1.077) | 9 (4.865) |
| 109 (1.031) | 12 (4.396) |
|
| Severe COPD |
|
| <0.001 |
|
| <0.001 |
| No | 7,264 (95.391) | 164 (88.649) |
| 10,132
(95.865) | 247 (90.476) |
|
|
Yes | 351 (4.609) | 21 (11.351) |
| 437 (4.135) | 26 (9.524) |
|
| CHF |
|
| 0.013 |
|
| <0.001 |
| No | 7,597 (99.764) | 182 (98.378) |
| 10,537
(99.697) | 267 (97.802) |
|
|
Yes | 18 (0.236) | 3 (1.622) |
| 32 (0.303) | 6 (2.198) |
|
| Hypertension |
|
| <0.001 |
|
| <0.001 |
| No | 4,688 (61.563) | 78 (42.162) |
| 6,646 (62.882) | 114 (41.758) |
|
|
Yes | 2,927 (38.437) | 107 (57.838) |
| 3,923 (37.118) | 159 (58.242) |
|
| Renal failure |
|
| 0.175 |
|
| 0.009 |
| No | 7,608 (99.908) | 184 (99.459) |
| 10,565
(99.962) | 271 (99.267) |
|
|
Yes | 7 (0.092) | 1 (0.541) |
| 4 (0.038) | 2 (0.733) |
|
| Dialysis |
|
| 0.036 |
|
| <0.001 |
| No | 7,587 (99.632) | 182 (98.378) |
| 10,548
(99.801) | 268 (98.168) |
|
|
Yes | 28 (0.368) | 3 (1.622) |
| 21 (0.199) | 5 (1.832) |
|
| Disseminated
cancer |
|
| <0.001 |
|
| <0.001 |
| No | 6,086 (79.921) | 94 (50.811) |
| 8,276 (78.304) | 164 (60.073) |
|
|
Yes | 1,529 (20.079) | 91 (49.189) |
| 2,293 (21.696) | 109 (39.927) |
|
| Open wound
infection |
|
| <0.001 |
|
| <0.001 |
| No | 7,555 (99.212) | 177 (95.676) |
| 10,491
(99.262) | 264 (96.703) |
|
|
Yes | 60 (0.788) | 8 (4.324) |
| 78 (0.738) | 9 (3.297) |
|
| Steroid use |
|
| <0.001 |
|
| <0.001 |
| No | 6,382 (83.808) | 135 (72.973) |
| 9,134 (86.423) | 192 (70.330) |
|
|
Yes | 1,233 (16.192) | 50 (27.027) |
| 1,435 (13.577) | 81 (29.670) |
|
| >10% loss body
weight in last 6 months |
|
| <0.001 |
|
| <0.001 |
| No | 7,458 (97.938) | 171 (92.432) |
| 10,358
(98.004) | 250 (91.575) |
|
|
Yes | 157 (2.062) | 14 (7.568) |
| 211 (1.996) | 23 (8.425) |
|
| Bleeding
disorders |
|
| 0.038 |
|
| 0.017 |
| No | 7,447 (97.794) | 176 (95.135) |
| 10,384
(98.250) | 262 (95.971) |
|
|
Yes | 168 (2.206) | 9 (4.865) |
| 185 (1.750) | 11 (4.029) |
|
| Preoperative
transfusions |
|
| 0.134 |
|
| <0.001 |
| No | 7,590 (99.672) | 183 (98.919) |
| 10,539
(99.716) | 267 (97.802) |
|
|
Yes | 25 (0.328) | 2 (1.081) |
| 30 (0.284) | 6 (2.198) |
|
| Preoperative
systemic sepsis |
|
| <0.001 |
|
| <0.001 |
| No | 7,339 (96.376) | 168 (90.811) |
| 10,214
(96.641) | 249 (91.209) |
|
|
SIRS | 255 (3.349) | 13 (7.027) |
| 342 (3.236) | 18 (6.593) |
|
|
Sepsis | 14 (0.184) | 4 (2.162) |
| 11 (0.104) | 4 (1.465) |
|
| Septic
shock | 7 (0.092) | 0 (0.000) |
| 2 (0.019) | 2 (0.733) |
|
| Emergency case |
|
| <0.001 |
|
| <0.001 |
| No | 7,143 (93.802) | 158 (85.405) |
| 9,916 (93.822) | 227 (83.150) |
|
|
Yes | 472 (6.198) | 27 (14.595) |
| 653 (6.178) | 46 (16.850) |
|
| Wound
classification |
|
| 0.005 |
|
| 0.041 |
|
Clean | 7,384 (96.967) | 178 (96.216) |
| 10,300
(97.455) | 265 (97.070) |
|
|
Clean/contaminated | 94 (1.234) | 0 (0.000) |
| 124 (1.173) | 3 (1.099) |
|
|
Contaminated | 114 (1.497) | 3 (1.622) |
| 110 (1.041) | 1 (0.366) |
|
|
Dirty/infected | 23 (0.302) | 4 (2.162) |
| 35 (0.331) | 4 (1.465) |
|
| ASA
classification |
|
| <0.001 |
|
| <0.001 |
| No
disturbance | 115 (1.510) | 0 (0.000) |
| 138 (1.306) | 0 (0.000) |
|
| Mild
disturbance | 2,119 (27.827) | 10 (5.405) |
| 2,675 (25.310) | 19 (6.960) |
|
| Severe
disturbance | 4,516 (59.304) | 114 (61.622) |
| 6,264 (59.268) | 142 (52.015) |
|
| Life
threat | 856 (11.241) | 59 (31.892) |
| 1,467 (13.880) | 110 (40.293) |
|
|
Moribund | 9 (0.118) | 2 (1.081) |
| 25 (0.237) | 2 (0.733) |
|
Univariate and multivariate
analyses
The results of the univariate and multivariate
analyses using a binary logistic regression model are presented in
Table SII. The univariate analysis
showed that female sex (OR=0.649), age range (41–60 years)
(OR=2.682), age range (61–80 years) (OR=4.940), age (>81 years)
(OR=14.902), BMI (OR=0.985), diabetes (noninsulin-dependent)
(OR=1.552), diabetes (insulin-dependent) (OR=2.618), dyspnea
(moderate exertion) (OR=2.333), dyspnea (moderate exertion)
(OR=2.333), functional health status (partially dependent)
(OR=4.032), functional health status (totally dependent)
(OR=7.211), ventilator dependence (OR=4.527), severe COPD
(OR=2.525), CHF (OR=7.270), hypertension (OR=2.292), renal failure
(OR=10.893), dialysis (OR=6.580), disseminated cancer (OR=2.913),
open wound infection (OR=5.041), steroid use for chronic conditions
(OR=2.330), >10% body weight loss in last 6 months (OR=4.255),
bleeding disorders (OR=2.307), preoperative transfusions
(OR=5.860), SIRS (OR=2.186), sepsis (OR=13.470), septic shock
(OR=9.354), levels of Na (OR=0.910), BUN (OR=1.043), Cr (OR=1.240),
WBC count (OR=1.074), HCT level (OR=0.923), PLT count (OR=0.998),
emergency cases (OR=2.875) and wound classification
(dirty/infected) (OR=5.506) were associated with postoperative
30-day mortality (all P<0.05).
The multivariate analysis demonstrated that female
sex (OR=0.713), age range (41–60 years) (OR=1.927), age range
(61–80 years) (OR=2.573), age (>81 years) (OR=6.680), functional
health status (partially dependent) (OR=2.152), functional health
status (totally dependent) (OR=2.982), ventilator-dependence
(OR=2.402), hypertension (OR=1.374), disseminated cancer
(OR=1.791), open wound infection (OR=2.297), steroid use for
chronic conditions (OR=1.619), >10% body weight loss in the last
6 months (OR=2.067), sepsis (OR=3.563), Na level (OR=0.971), BUN
level (OR=1.019), WBC count (OR=1.049), HCT level (OR=0.959), PLT
count (OR=0.998), emergency cases (OR=2.267) and wound
classification (dirty/infected) (OR=3.228) were associated with
postoperative 30-day mortality (all P<0.05).
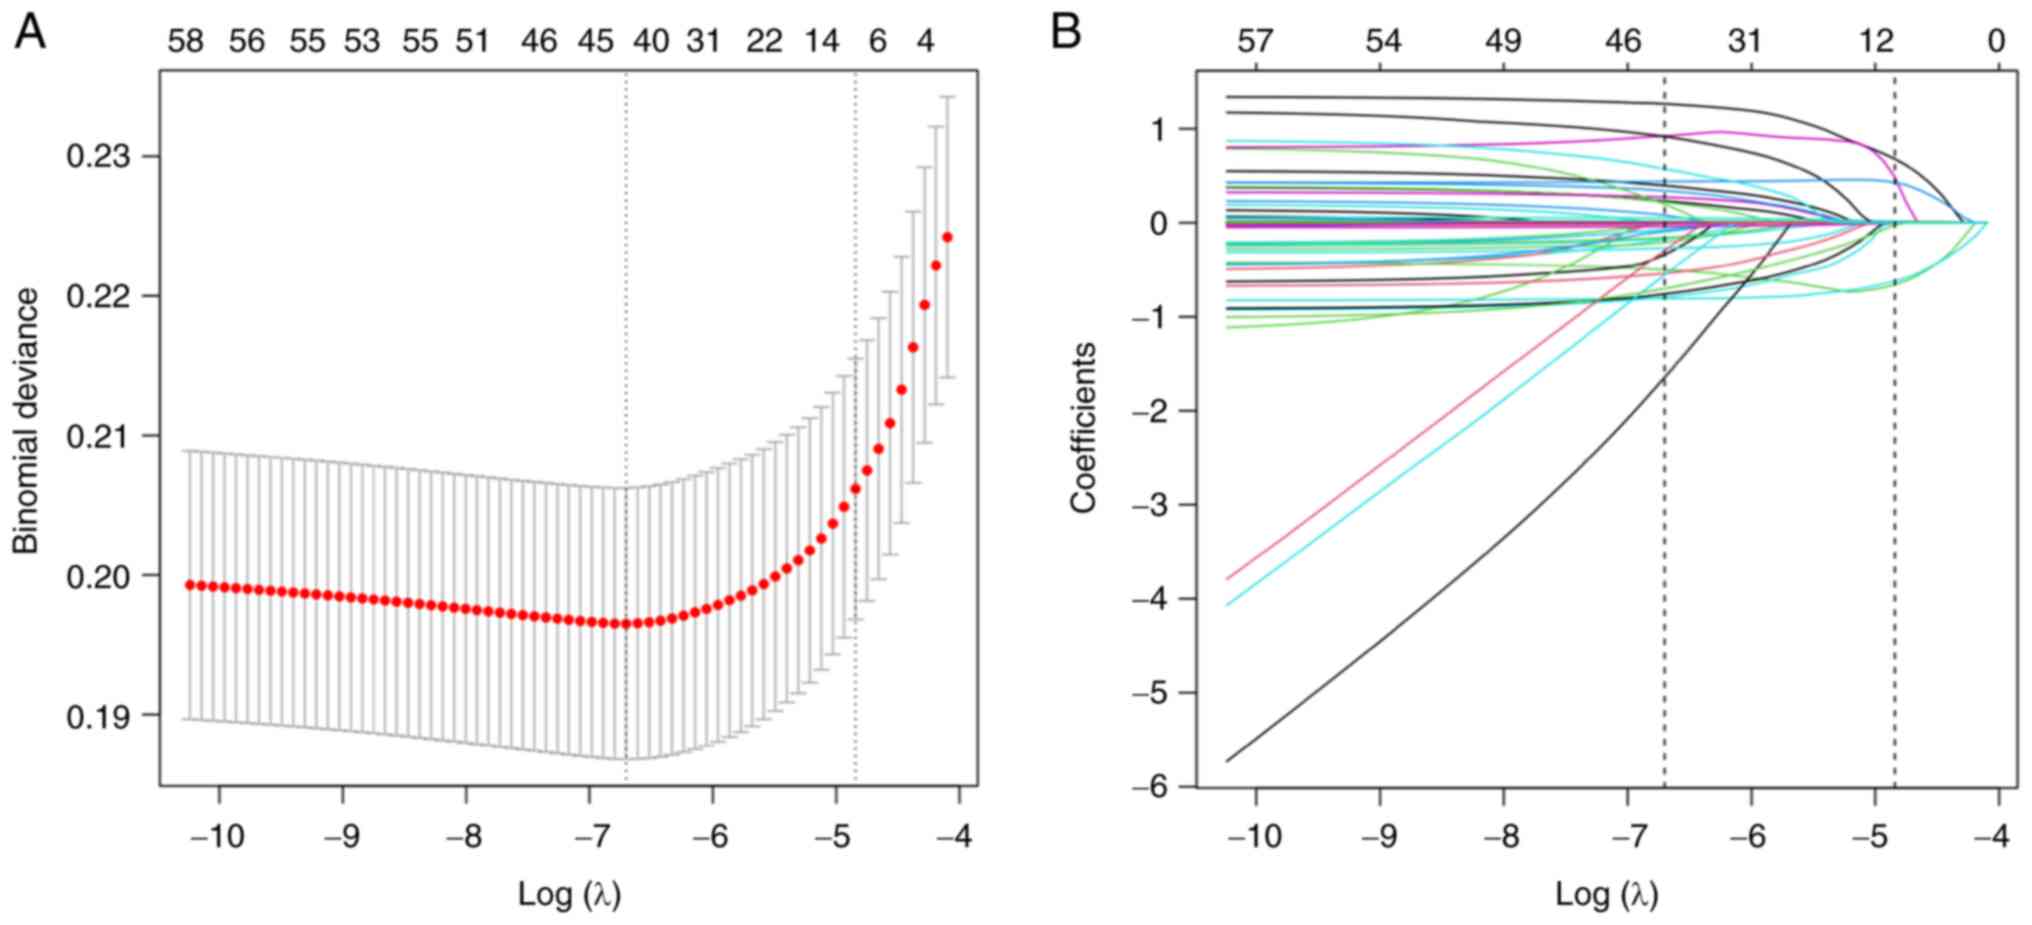
Candidate selection through LASSO
regression
Of the clinical features, 30 indicators [BMI and
preoperative blood test results (HCT, BUN, WBC, Cr, PLT), sex,
ethnicity, age ranges, diabetes status, smoking status, dyspnea,
functional health status, ventilator dependence, severe COPD, CHF,
hypertension, renal failure, dialysis, disseminated cancer, open
wound infections, steroid use for chronic conditions, >10% loss
of body weight in the last 6 months, bleeding disorders,
preoperative transfusions, preoperative systemic sepsis, emergency
cases, wound classification and ASA physical status
classification)] were reduced to 6 potential predictors based on
7,800 participants in the training dataset (Fig. 1A and B) with nonzero coefficients in
the LASSO regression model. These potential predictors included the
preoperative WBC count, BUN level, HCT level, age range, functional
health status and disseminated cancer.
Identification of risk factors
A total of three prediction models were further
established based on the predictors chosen by the LASSO regression
model, namely the MFP model, the full logistic proportional hazards
model and the stepwise logistic regression model. In the training
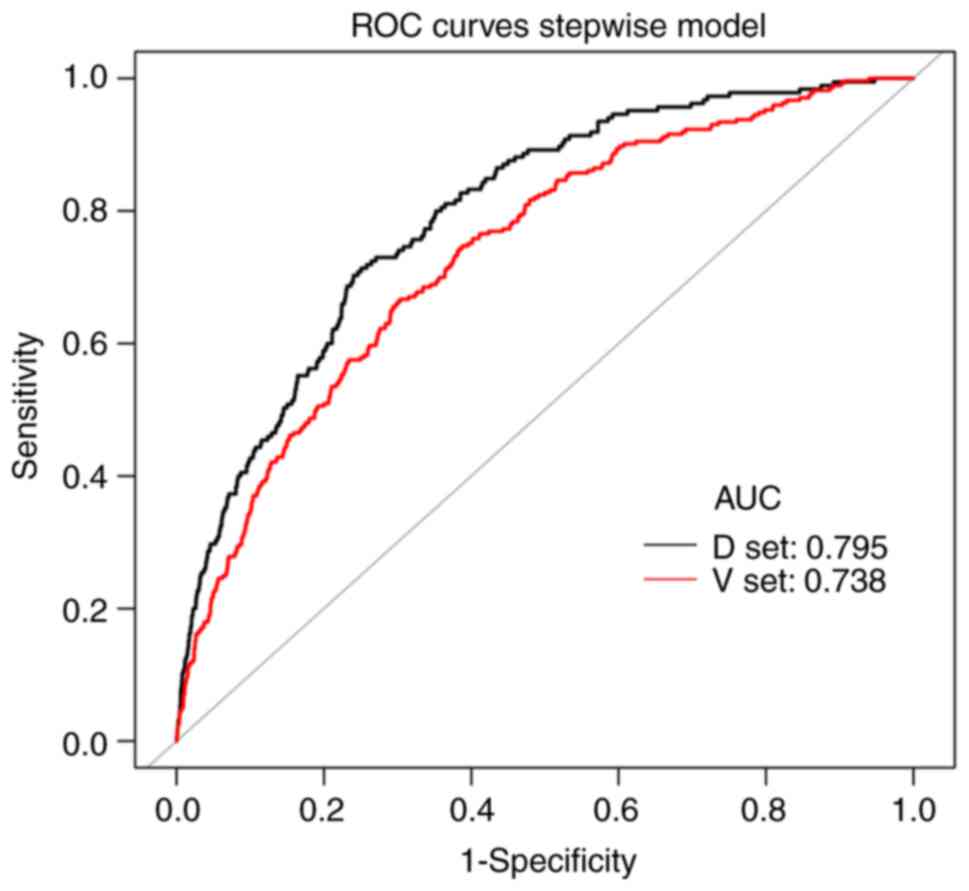
cohort, the AUC values of the MFP model, full model and stepwise
model were 0.7983, 0.7949 and 0.7949, respectively. In the
validation cohort, the corresponding AUC values of these models
were 0.7423, 0.7382 and 0.7382, respectively (Fig. S1A and B). The AUCs of the three
models were relatively close. Given that the stepwise model
incorporated fewer risk factors, it was simpler than the MFP and
full models. In addition, the stepwise model could predict the risk
of postoperative 30-day mortality relatively well. Therefore, the
stepwise model was selected as the optimal risk prediction model
for postoperative 30-day mortality. As indicated in Table III, 6 variables were selected
according to the stepwise model: WBC count (OR=1.0710, 95%
CI=1.0420–1.1009), age range (41–60 years) (OR=1.7108, 95%
CI=0.8032–3.6439), age range (61–80 years) (OR=2.8297, 95%
CI=1.3510–5.9270), age (>81 years) (OR=8.2427, 95%
CI=3.5937–18.9056), BUN (OR=1.020, 95% CI=1.008–1.031), HCT
(OR=0.945, 95% CI=0.919–0.972), functional health status (partially
dependent) (OR=3.0521, 95% CI=1.9820–4.7000), functional health
status (totally dependent) (OR=2.9286, 95% CI=0.9864–8.6944) and
disseminated cancer status (OR=2.8180, 95% CI=2.0631–3.8490). The
results showed that 5 variables (excluding the level of HCT) were
positively associated with postoperative 30-day mortality.
| Table III.Variables selected using the stepwise
logistic proportional hazards model in the training dataset. |
Table III.
Variables selected using the stepwise
logistic proportional hazards model in the training dataset.
| Variable | β | Odds ratio (95%
CI) | P-value |
|---|
| WBC | 0.0686 | 1.0710
(1.0420–1.1009) | <0.0001 |
| Age, years (vs.
18–40) |
|
|
|
|
41-60 | 0.5370 | 1.7108
(0.8032–3.6439) | 0.1639 |
|
61-80 | 1.0402 | 2.8297
(1.3510–5.9270) | 0.0058 |
|
>81 | 2.1093 | 8.2427
(3.5937–18.9056) | <0.0001 |
| Functional health
status (vs. independent) |
|
|
|
|
Partially dependent | 1.1158 | 3.0521
(1.9820–4.7000) | <0.0001 |
| Totally
dependent | 1.0745 | 2.9286
(0.9864–8.6944) | 0.0529 |
| Disseminated
cancer | 1.0360 | 2.8180
(2.0631–3.8490) | <0.0001 |
| BUN | 0.0197 | 1.0199
(1.0084–1.0314) | 0.0006 |
| HCT | −0.0567 | 0.9449
(0.9188–0.9717) | 0.0001 |
The ability of each risk factor to predict
postoperative 30-day mortality was evaluated in the training and
validation cohorts (Tables SIII
and SIV; Fig. S2A and B). Tables SIII and SIV indicate that each risk predictor
showed high accuracy in our nomogram.
Development of the nomogram
A corresponding nomogram was further constructed to
provide a quantitative and simple tool for predicting the risk of
postoperative 30-day mortality by using the preoperative WBC count,
HCT level, BUN level, age ranges, functional health status and
disseminated cancer incidence (Fig.
2). Each variable in the nomogram was assigned a specific point
value and the points for each variable were summed to obtain the
total points, which were used to determine the probability of
postoperative 30-day mortality. The algorithm for determining the
risk of postoperative 30-day mortality in the stepwise model was as
follows: Log (Y)=−3.90696+0.06862 × WBC (×109/l) +
0.53696 × [age range (41–60)] (years) + 1.04019 × [age range
(61–80)] (years) +2.10932 × [age range (>81)] (years) +1.11582 ×
(functional health status, partially dependent) +1.07452 ×
(functional health status, totally dependent) +1.03602 ×
(disseminated cancer) + 0.01967 × BUN (mg/dl)-0.05668 × HCT (%).
Probability of 30-day mortality=1/{1+e[-log(Y)]}.
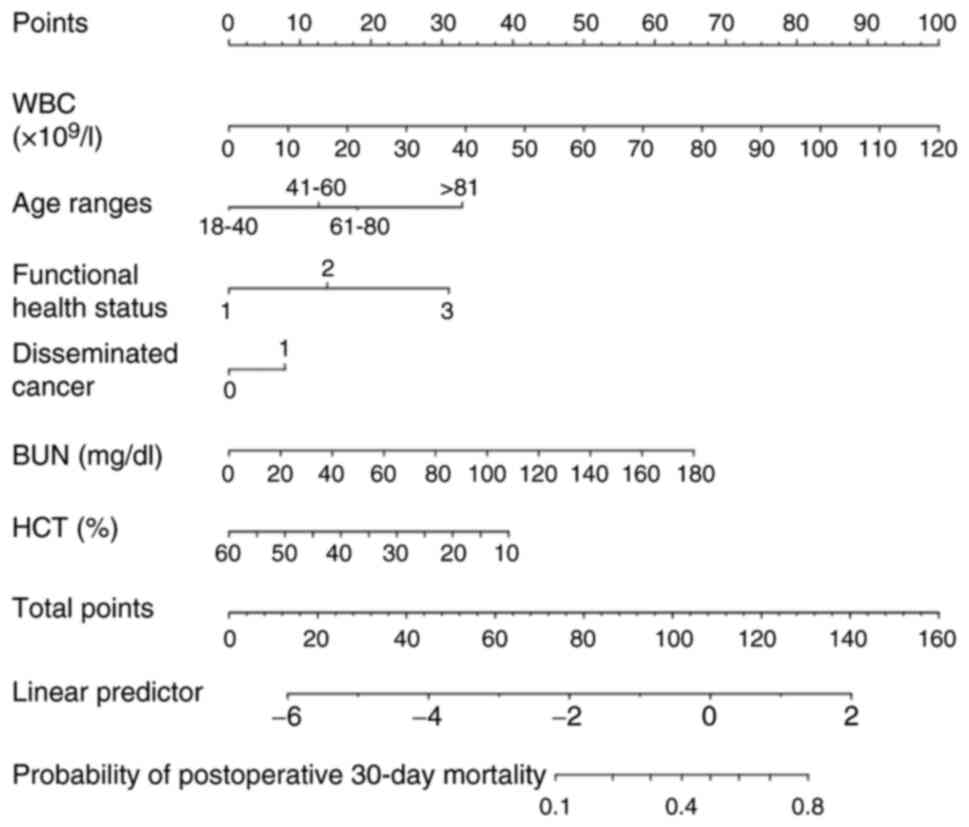 | Figure 2.Nomogram for predicting postoperative
30-day mortality. The nomogram was developed with the training
dataset and included the WBC count, HCT level, BUN level, age
range, functional health status, and disseminated cancer status.
Points for each variable were acquired by drawing a straight line
upward from the corresponding value to the ‘Points’ line. The
points received from each variable were summed and the number of
points was located on the ‘Total Points’ axis. To determine the
probability of postoperative 30-day mortality, a straight line was
drawn down to the corresponding ‘probability of postoperative
30-day mortality’ axis. Units: WBC, ×109/l; BUN, mg/dl;
WBC, %. WBC, white blood cells; BUN, blood urea nitrogen; HCT,
hematocrit. |
Predictive performance of the
nomogram
Discrimination
In the training cohort and the validation cohort,
the AUCs of the nomogram were 0.7949 (95% CI=0.7644–0.8255) and
0.7382 (95% CI=0.7091–0.7674), respectively (Table IV, Fig.
3). At the best threshold, the sensitivity was 71.35 and 66.67%
and the specificity was 74.96 and 69.67% for the training and
validation cohorts, respectively. Of note, both the training and
validation cohorts had relatively high NPVs.
| Table IV.Predictive performance of the
nomogram for the risk of postoperative 30-day mortality. |
Table IV.
Predictive performance of the
nomogram for the risk of postoperative 30-day mortality.
| Cohort | AUC | 95% CI | Best threshold of
predicted probability of 30-day mortality | Specificity, % | Sensitivity, % | PPV, % | NPV, % | PLR | NLR |
|---|
| Training | 0.7949 | 0.7644- | 0.0248 | 74.96 | 71.35 | 6.4 | 99.0 | 2.84 | 0.382 |
| cohort |
| 0.8255 |
|
|
| 7 | 8 | 92 | 2 |
| Validation | 0.7382 | 0.7091- | 0.0200 | 69.67 | 66.67 | 5.3 | 98.7 | 2.19 | 0.478 |
| cohort |
| 0.7674 |
|
|
| 7 | 8 | 78 | 5 |
Model accuracy evaluation
It was also evaluated how close the predicted
postoperative 30-day mortality was to the observed postoperative
30-day mortality risk for the nomogram in the training and
validation cohorts. The calibration for the probability of
postoperative 30-day mortality showed excellent agreement between
the predicted possibility and the actual observation in both the
training and validation sets (Fig.
4). These results demonstrated that the nomogram was able to
accurately predict postoperative 30-day mortality in an American
population.
Risk score model of postoperative
30-day mortality
Selected continuous variables (BUN, WBC and HCT)
were converted into categorical variables according to the best
threshold (Table V). Score points
were assigned to each risk factor by using the model parameter
estimates, after which the values were multiplied by 2 and rounded
to the nearest integer. The logistic estimates for the risk
variables, corresponding score points and the contributed AUC for
each variable are provided in Table
VI.
| Table V.Best threshold analysis for BUN, WBC
and HCT. |
Table V.
Best threshold analysis for BUN, WBC
and HCT.
| Test | Best threshold | Specificity | Sensitivity | Accuracy | PLR | NLR | DOR | PPV | NPV |
|---|
| Preoperative
BUN | 18.9834 | 0.6552 | 0.5946 | 0.6537 | 1.7242 | 0.6188 | 2.7864 | 0.0402 | 0.9852 |
| Preoperative
WBC | 12.2900 | 0.7916 | 0.4054 | 0.7824 | 1.9453 | 0.7511 | 2.5898 | 0.0451 | 0.9821 |
| Preoperative
HCT | 36.9488 | 0.7949 | 0.4054 | 0.7856 | 1.9764 | 0.7480 | 2.6422 | 0.0458 | 0.9822 |
| Table VI.Derived score of the scoring scale
model. |
Table VI.
Derived score of the scoring scale
model.
| Risk variable | β | Standard error | Odds ratio (95%
CI) | P-value | Derived score |
|---|
| Age, years (vs.
18–40) |
|
|
|
|
|
|
41–60 | 0.5863 | 0.3853 | 1.7973
(0.8446–3.8247) | 0.1281 | 1 |
|
61–80 | 1.1066 | 0.3790 | 3.0240
(1.4386–6.3567) | 0.0035 | 2 |
|
>81 | 2.3263 | 0.4229 | 10.2399
(4.4701–23.4572) | <0.0001 | 4.5 |
| Disseminated
cancer | 1.0433 | 0.1583 | 2.8385
(2.0812–3.8715) | <0.0001 | 2 |
| BUN >18.98
mg/dl | 0.4373 | 0.1649 | 1.5485
(1.1208–2.1394) | 0.0080 | 1 |
| WBC >12.29
×109/l | 0.7867 | 0.1608 | 2.1960
(1.6023–3.0097) | <0.0001 | 1.5 |
| HCT >36.95
% | −0.7165 | 0.1593 | 0.4884
(0.3574–0.6674) | <0.0001 | −1.5 |
The resulting 30-day mortality scores ranged between
a minimum of −1.5 and a maximum of 9 points and were divided into
four groups according to the quartile of the total risk score as
follows: Low risk (−1.5 to −1), moderate risk (−0.5 to 0.5), high
risk (1 to 2) and extremely high risk (2.5 to 9) (Table VII). The observed incidence of
mortality among low-risk subjects (−1.5 to −1 point) was 0.28% (2
out of 718 patients), the incidence among moderate-risk subjects
was 0.73% (22 out of 3,003 patients) (−0.5 to 0.5 points), the
incidence among high-risk participants was 1.17% (22 out of 1,879
patients) (1 to 2 points) and the incidence among extremely
high-risk subjects was 6.90% (139 out of 2,015 patients) (Table VII).
| Table VII.Risk status categorization. |
Table VII.
Risk status categorization.
| A, Training
cohort |
|---|
|
|---|
| Score | Risk status | Participants,
n | Death events,
n | Incidence of death,
% | Sensitivity (95%
CI), % | Specificity (95%
CI), % | PPV (95% CI),
% | NPV (95% CI),
% |
|---|
| -(1.5–1) | Low | 718 | 2 | 0.28 |
|
|
|
|
| −0.5–0.5 | Moderate | 3,003 | 22 | 0.73 | 98.92 | 9.43 | 2.58 | 99.72 |
|
|
|
|
|
| (96.15–99.87) | (8.78–10.11) | (2.23–2.98) | (99.00–99.97) |
| 1-2 | High | 1,879 | 22 | 1.17 | 87.03 | 48.86 | 3.97 | 99.36 |
|
|
|
|
|
| (81.31–91.51) | (47.74–49.99) | (3.39–4.62) | (99.05–99.59) |
| 2.5–9 | Extremely | 2,015 | 139 | 6.90 | 75.14 | 73.54 | 6.45 | 99.19 |
|
| high |
|
|
| (68.26–81.18) | (72.53–74.53) | (5.45–7.57) | (98.91–99.40) |
|
| B, Validation
cohort |
|
| Score | Risk
status | Participants,
n | Death events,
n | Incidence of
death, % | Sensitivity (95%
CI), % | Specificity (95%
CI), % | PPV (95% CI),
% | NPV (95% CI),
% |
|
| -(1.5–1) | Low | 1,051 | 3 | 0.29 |
|
|
|
|
| −0.5–0.5 | Moderate | 4,112 | 41 | 1.00 | 98.90 | 9.94 | 2.76 | 99.72 |
|
|
|
|
|
| (96.82–99.77) | (9.38–10.53) | (2.44–3.10) | (99.17–99.94) |
| 1-2 | High | 2,609 | 71 | 2.72 | 83.88 | 48.85 | 4.06 | 99.15 |
|
|
|
|
|
| (78.97–88.04) | (47.89–49.81) | (3.56–4.61) | (98.87–99.39) |
| 2.5–9 | Extremely | 2,797 | 158 | 5.64 | 57.88 | 73.54 | 5.35 | 98.54 |
|
| high |
|
|
| (51.78–63.80) | (72.68–74.37) | (4.56–6.22) | (98.25–98.79) |
Validation stage of the risk
score
External validation of the risk score was conducted
on a cohort of 10,842 participants (those individuals who underwent
craniotomies in 2014–2015). In the validation cohort, the resulting
30-day mortality scores were also divided into four groups
according to the quartile of the total risk score as follows: Low
risk (−1.5 to −1), moderate risk (−0.5–0.5), high risk (1–2) and
extremely high risk (2.5–9). The observed incidence of
postoperative 30-day mortality among low-risk participants (−1.5 to
−1 point) was 0.29% (3 out of 1,051 patients), among moderate-risk
participants it was 1% (41 out of 4,112 patients) (−0.5 to 0.5
points), among high-risk participants it was 2.72% (71 out of 2,609
patients) (1 to 2 points) and among extremely high-risk
participants it was 5.64% (158 out of 2,797 patients) (Table VII). The incidences of death in
the validation group and the modeling group were similar for each
score group (Table VII), thus
indicating that the scoring model had good predictive
performance.
It was also calculated that the AUC values of the
scoring scale model were 0.7844 (95% CI=0.7526–0.8162) and 0.7289
(95% CI=0.7012–0.7566) in the training cohort and the validation
cohort, respectively (Table SV).
At the best thresholds (2.25 and 1.75), the specificities were
73.54 and 65.49%, and the sensitivities were 75.14 and 68.50% for
the training and validation cohorts, respectively (Table SV). The training and validation
cohorts both had relatively high NPVs.
Discussion
In the present retrospective cross-sectional study,
a personalized prediction nomogram and risk score for postoperative
30-day mortality were developed and validated by evaluating
cost-effective and readily available parameters among adult
American patients following tumor craniotomy, thus helping
clinicians identify individuals at high risk of postoperative
30-day mortality. The prediction model included six parameters: The
preoperative WBC count, HCT level, BUN level, age range, functional
health status and presence of disseminated cancer. Model evaluation
and external validation showed that the nomogram and risk scoring
system developed in the present study had excellent predictive
performance.
Although numerous death risk prediction models for
brain tumors based on demographic, anthropological and clinical
information have been established and reported, they have focused
mainly on a certain type of brain tumor. A multigene signature has
been reported for predicting the prognosis of patients with gliomas
(35–39). However, these studies require
surgery to obtain pathological tissues from patients to detect
genetic signatures. The nomogram developed in the present study
differs from those used in these studies in that it is not required
to apply genetic signatures derived from tissue analysis for
prediction. In addition, Missios et al (40) developed predictive models for
postoperative complications (including death) in patients with
gliomas on the basis of logistic regression analysis and validated
them in a bootstrapped sample. Jia et al (41) performed Cox proportional hazards
regression analysis to develop a nomogram to predict the prognosis
of meningiomas (World Health Organization Grade III) based on sex,
ethnicity, age at diagnosis, histology, tumor site, tumor size,
laterality and surgical method. Similarly, previous studies have
suggested that the prognostic nomogram comprises factors (age,
tumor size and surgery) for overall survival in patients with
atypical meningiomas (42). Based
on the abovementioned meningioma studies and the present findings,
advanced age is indeed a significant risk factor for craniotomy. In
terms of brain metastases, prognostic nomograms have been
established for breast cancer (43), lung cancer (44,45),
bladder cancer (46) and colorectal
cancer (47) with brain metastases.
All of the abovementioned studies of prediction models were limited
to a single type of brain tumor. The present study involved 18,642
patients who underwent craniotomy for a variety of brain tumors and
the findings from the training cohort were confirmed in the
validation cohort. The AUC values of the nomogram and the scoring
model were 0.7949 (95% CI=0.764–0.8255) and 0.7844 (95%
CI=0.7526–0.8162), respectively, in the training dataset.
Therefore, the clinical applicability of the nomogram and scoring
model is broader compared with the relevant studies mentioned
above.
A total of 6 risk predictors were identified in the
present study, namely the preoperative age range, WBC count, HCT
level, BUN level, functional health status and presence of
disseminated cancer, for predicting postoperative 30-day mortality
in adults with craniotomy for brain tumor. In general, the risk of
surgical mortality is increased in older patients. Senders et
al (1) suggested that older age
and dependent functional status were predictors of postoperative
30-day mortality after craniotomy for primary malignant brain
tumors, which is similar to the present findings. Numerous studies
have demonstrated that preoperatively lower HCT levels are
associated with an increased risk of death after surgery (48–51).
Multivariate analysis also demonstrated that preoperative HCT
(OR=0.959) was associated with postoperative 30-day mortality
(P<0.05), which suggested that a slightly higher HCT level may
be a protective factor against 30-day mortality after craniotomy
for brain tumor. It was speculated that patients with higher
preoperative HCT levels may tolerate a certain degree of blood loss
during surgery. Furthermore, elevated BUN levels associated with
renal dysfunction are associated with an increased risk of incident
diabetes and mortality in patients with cardiovascular disease. A
BUN concentration >40 mg/dl was associated with increased
mortality in patients who underwent emergency colectomies for
Clostridium difficile colitis (52). In the study by Chung et al
(53), 6 independent risk factors
(including age and preoperative BUN) that are predictive of
postoperative 30-day mortality were identified for coronary artery
bypass grafts based on the ACS NSQIP database (2005–2010). The
present study showed that a BUN level >18.98 (mg/dl) was a risk
predictor for postoperative 30-day mortality among adults who
underwent craniotomy for brain tumors. Brain metastases are an
important cause of mortality and morbidity in patients with cancer
(54). This scenario may explain
the finding in the present study that disseminated cancer is a risk
factor for 30-day mortality after craniotomy. Therefore, the
application of the 6 risk predictors in our prediction models was
well founded. In addition, the first letter was selected for each
risk predictor (excluding HCT; the letter ‘C’ was selected) to name
this system as ‘WBC-FAD’ for clinical use.
The present study has several strengths. i) It had a
large sample size and the participants originated from multiple
centers. ii) A total of 4 prediction models were used, including
the LASSO, full, stepwise and MFP models. A simple stepwise model
based on the LASSO model was employed. iii) A nomogram and a risk
score were simultaneously constructed to ensure model precision and
clinical practicability. iv) A formula to calculate the risk of
postoperative 30-day mortality was developed based on risk
predictors, which can help clinicians quickly and accurately
calculate an individual's risk of postoperative 30-day mortality
and provide external verification information. v) A complete
evaluation of the model was performed for discrimination and
calibration. vi) External validation was performed to ensure the
reliability of the results.
Although the nomogram and risk score performed well,
the present study has several potential limitations. First, it was
a secondary retrospective study. The raw data did not reveal other
risk factors for mortality, such as characteristics of benign or
malignant tumors, lifestyle, pharmacological treatments or
socioeconomic factors. However, the present study had a large
sample size and the participants were from multiple centers. Our
nomogram and risk score had excellent prediction performance in the
external validation, thus suggesting that the nomogram and risk
score based on the existing 6 risk factors have high
generalizability. Second, multiple imputations were used to replace
missing values. However, this scenario may lead to bias. Therefore,
in the future, it may be considered designing our studies or
cooperating with other researchers to collect as many variables as
possible as well as reduce missing values. Third, in the present
study, the ACS NSQIP database was analyzed from 2012 to 2015 and
more valuable models may be obtained by using recent data for data
analysis. Fourth, although the performance of the proposed method
was tested, real clinical or other related studies are needed
before it is widely accepted or applied.
In conclusion, in the present study, a personalized
nomogram and risk scoring system (WBC-FAD score) were developed and
validated, including the preoperative WBC count, BUN level, HCT
level, age range, functional health status and disseminated cancer
status, for predicting postoperative 30-day mortality in adults who
undergo brain tumor craniotomies in the US. The nomogram and risk
score had excellent predictive performance in both the training and
validation cohorts for estimating the risk of postoperative 30-day
mortality, and they had high generalizability. The categorization
of the overall risk relative to the risk status helps to inform the
development of mortality of tumor craniotomy intervention or
prevention programs. Further improvements in the risk prediction
model for tumor craniotomy should consider the nature of the tumor
and pharmacological treatments. In future studies these data
(including detailed tumor type and tumor location) will be
collected to perform stratified analyses and validate our model.
Additional clinical and other related studies are needed before
this risk scoring system and nomogram for tumor craniotomy can be
widely accepted and used.
Supplementary Material
Supporting Data
Supporting Data
Acknowledgements
Not applicable.
Funding
This work was supported by the Shenzhen Second People's Hospital
Clinical Research Fund of the Guangdong Province High-level
Hospital Construction Project (grant no. 20233357023).
Availability of data and materials
The raw data were obtained from Zhang et al
(24) and/or may be downloaded from
https://journals.plos.org/plosone/article?id=10.1371/journal.pone.0235273
or from the ACS NSQIP database (https://www.ncbi.nlm.nih.gov/pmc/articles/PMC7498000/,
S1 Data).
Authors' contributions
YL, HH and GH contributed to the study design and
drafted the manuscript. YL, HH, YH and JY were responsible for the
statistical analysis. XZ, LC, FC, WL and ZL were also responsible
for the statistical analysis, research and interpretation of the
data, and revised the manuscript critically. YL, HH and GH confirm
the authenticity of all the raw data. All authors have read and
approved the final manuscript.
Ethics approval and consent to
participate
Patient data were anonymous and previously collected
data were analyzed; thus, informed consent was not necessary. Our
research was exempted from the Clinical Research Ethics Committee
of Shenzhen Second People's Hospital due to the nature of the
database (Shenzhen, China; no. 20220407005).
Patient consent for publication
Not applicable.
Competing interests
The authors declare that they have no competing
interests.
References
|
1
|
Senders JT, Muskens IS, Cote DJ, Goldhaber
NH, Dawood HY, Gormley WB, Broekman MLD and Smith TR: Thirty-Day
outcomes after craniotomy for primary malignant brain tumors: A
national surgical quality improvement program analysis.
Neurosurgery. 83:1249–1259. 2018. View Article : Google Scholar : PubMed/NCBI
|
|
2
|
De la Garza-Ramos R, Kerezoudis P, Tamargo
RJ, Brem H, Huang J and Bydon M: Surgical complications following
malignant brain tumor surgery: An analysis of 2002–2011 data. Clin
Neurol Neurosurg. 140:6–10. 2016. View Article : Google Scholar : PubMed/NCBI
|
|
3
|
Lonjaret L, Guyonnet M, Berard E,
Vironneau M, Peres F, Sacrista S, Ferrier A, Ramonda V, Vuillaume
C, Roux FE, et al: Postoperative complications after craniotomy for
brain tumor surgery. Anaesth Crit Care Pain Med. 36:213–218. 2017.
View Article : Google Scholar : PubMed/NCBI
|
|
4
|
Writing Committee for the VISION Study
Investigators, . Devereaux PJ, Biccard BM, Sigamani A, Xavier D,
Chan MTV, Srinathan SK, Walsh M, Abraham V, Pearse R, et al:
Association of postoperative High-Sensitivity troponin levels with
myocardial injury and 30-Day mortality among patients undergoing
noncardiac surgery. JAMA. 317:1642–1651. 2017. View Article : Google Scholar : PubMed/NCBI
|
|
5
|
Fritz BA, Cui Z, Zhang M, He Y, Chen Y,
Kronzer A, Ben Abdallah A, King CR and Avidan MS: Deep-learning
model for predicting 30-day postoperative mortality. Br J Anaesth.
123:688–695. 2019. View Article : Google Scholar : PubMed/NCBI
|
|
6
|
Watters DA, Hollands MJ, Gruen RL, Maoate
K, Perndt H, McDougall RJ, Morriss WW, Tangi V, Casey KM and
McQueen KA: Perioperative mortality rate (POMR): A global indicator
of access to safe surgery and anaesthesia. World J Surg.
39:856–864. 2015. View Article : Google Scholar : PubMed/NCBI
|
|
7
|
Lochte BC, Carroll KT, Hirshman B, Lanman
T, Carter B and Chen CC: Smoking as a risk factor for
postcraniotomy 30-Day mortality. World Neurosurg. 127:e400–e406.
2019. View Article : Google Scholar : PubMed/NCBI
|
|
8
|
Williams M, Treasure P, Greenberg D,
Brodbelt A and Collins P: Surgeon volume and 30 day mortality for
brain tumours in England. Br J Cancer. 115:1379–1382. 2016.
View Article : Google Scholar : PubMed/NCBI
|
|
9
|
Dikmen S, Machamer J, Manley GT, Yuh EL,
Nelson LD and Temkin NR; TRACK-TBI Investigators, : Functional
status examination versus glasgow outcome scale extended as outcome
measures in traumatic brain injuries: How do they compare? J
Neurotrauma. 36:2423–2429. 2019. View Article : Google Scholar : PubMed/NCBI
|
|
10
|
Ois A, Vivas E, Figueras-Aguirre G,
Guimaraens L, Cuadrado-Godia E, Avellaneda C, Bertran-Recasens B,
Rodríguez-Campello A, Gracia MP, Villalba G, et al: Misdiagnosis
worsens prognosis in subarachnoid hemorrhage with good hunt and
hess score. Stroke. 50:3072–3076. 2019. View Article : Google Scholar : PubMed/NCBI
|
|
11
|
Khalil H, Aldaajani ZF, Aldughmi M,
Al-Sharman A, Mohammad T, Mehanna R, El-Jaafary SI, Dahshan A, Ben
Djebara M, Kamel WA, et al: Validation of the arabic version of the
movement disorder Society-Unified parkinson's disease rating scale.
Mov Disord. 37:826–841. 2022. View Article : Google Scholar : PubMed/NCBI
|
|
12
|
Gittleman H, Lim D, Kattan MW, Chakravarti
A, Gilbert MR, Lassman AB, Lo SS, Machtay M, Sloan AE, Sulman EP,
et al: An independently validated nomogram for individualized
estimation of survival among patients with newly diagnosed
glioblastoma: NRG Oncology RTOG 0525 and 0825. Neuro Oncol.
19:669–677. 2017.PubMed/NCBI
|
|
13
|
Mijderwijk HJ, Nieboer D, Incekara F,
Berger K, Steyerberg EW, van den Bent MJ, Reifenberger G, Hänggi D,
Smits M, Senft C, et al: Development and external validation of a
clinical prediction model for survival in patients with IDH
wild-type glioblastoma. J Neurosurg. Jan 14–2022.(Epub ahead of
print). View Article : Google Scholar : PubMed/NCBI
|
|
14
|
Wang Z, Gao L, Guo X, Feng C, Lian W, Deng
K and Xing B: Development of a nomogram with alternative splicing
signatures for predicting the prognosis of glioblastoma: A study
based on Large-Scale sequencing data. Front Oncol. 10:12572020.
View Article : Google Scholar : PubMed/NCBI
|
|
15
|
Molinaro AM, Wrensch MR, Jenkins RB and
Eckel-Passow JE: Statistical considerations on prognostic models
for glioma. Neuro Oncol. 18:609–623. 2016. View Article : Google Scholar : PubMed/NCBI
|
|
16
|
Li N, Mo Y, Huang C, Han K, He M, Wang X,
Wen J, Yang S, Wu H, Dong F, et al: A clinical semantic and
radiomics nomogram for predicting brain invasion in WHO grade II
meningioma based on tumor and Tumor-to-Brain interface features.
Front Oncol. 11:7521582021. View Article : Google Scholar : PubMed/NCBI
|
|
17
|
Zhang J, Yao K, Liu P, Liu Z, Han T, Zhao
Z, Cao Y, Zhang G, Zhang J, Tian J and Zhou J: A radiomics model
for preoperative prediction of brain invasion in meningioma
non-invasively based on MRI: A multicentre study. Ebiomedicine.
58:1029332020. View Article : Google Scholar : PubMed/NCBI
|
|
18
|
Pietrantonio F, Aprile G, Rimassa L,
Franco P, Lonardi S, Cremolini C, Biondani P, Sbicego EL,
Pasqualetti F, Tomasello G, et al: A new nomogram for estimating
survival in patients with brain metastases secondary to colorectal
cancer. Radiother Oncol. 117:315–321. 2015. View Article : Google Scholar : PubMed/NCBI
|
|
19
|
Marko NF, Xu Z, Gao T, Kattan MW and Weil
RJ: Predicting survival in women with breast cancer and brain
metastasis: A nomogram outperforms current survival prediction
models. Cancer. 118:3749–3757. 2012. View Article : Google Scholar : PubMed/NCBI
|
|
20
|
Cheng S, Yang L, Dai X, Wang J and Han X:
The risk and prognostic factors for brain metastases in esophageal
cancer patients: An analysis of the SEER database. BMC Cancer.
21:10572021. View Article : Google Scholar : PubMed/NCBI
|
|
21
|
Zhai Y, Bai J, Li M, Wang S, Li C, Wei X
and Zhang Y: A nomogram to predict the progression-free survival of
clival chordoma. J Neurosurg. 134:144–152. 2019. View Article : Google Scholar : PubMed/NCBI
|
|
22
|
Dasgupta A, Gupta T, Pungavkar S, Shirsat
N, Epari S, Chinnaswamy G, Mahajan A, Janu A, Moiyadi A, Kannan S,
et al: Nomograms based on preoperative multiparametric magnetic
resonance imaging for prediction of molecular subgrouping in
medulloblastoma: Results from a radiogenomics study of 111
patients. Neuro Oncol. 21:115–124. 2019. View Article : Google Scholar : PubMed/NCBI
|
|
23
|
Zhang D, Zhuo H, Yang G, Huang H, Li C,
Wang X, Zhao S, Moliterno J and Zhang Y: Postoperative pneumonia
after craniotomy: Incidence, risk factors and prediction with a
nomogram. J Hosp Infect. 105:167–175. 2020. View Article : Google Scholar : PubMed/NCBI
|
|
24
|
Zhang J, Li YI, Pieters TA, Towner J, Li
KZ, Al-Dhahir MA, Childers F and Li YM: Sepsis and septic shock
after craniotomy: Predicting a significant patient safety and
quality outcome measure. PLoS One. 15:e2352732020.
|
|
25
|
Groenwold RH, White IR, Donders AR,
Carpenter JR, Altman DG and Moons KG: Missing covariate data in
clinical research: When and when not to use the missing-indicator
method for analysis. CMAJ. 184:1265–1269. 2012. View Article : Google Scholar : PubMed/NCBI
|
|
26
|
White IR, Royston P and Wood AM: Multiple
imputation using chained equations: Issues and guidance for
practice. Stat Med. 30:377–399. 2011. View Article : Google Scholar : PubMed/NCBI
|
|
27
|
Friedman J, Hastie T and Tibshirani R:
Regularization paths for generalized linear models via coordinate
descent. J Stat Softw. 33:1–22. 2010. View Article : Google Scholar : PubMed/NCBI
|
|
28
|
Kidd AC, McGettrick M, Tsim S, Halligan
DL, Bylesjo M and Blyth KG: Survival prediction in mesothelioma
using a scalable Lasso regression model: Instructions for use and
initial performance using clinical predictors. BMJ Open Respir Res.
5:e0002402018. View Article : Google Scholar : PubMed/NCBI
|
|
29
|
Della Rosa PA, Miglioli C, Caglioni M,
Tiberio F, Mosser KHH, Vignotto E, Canini M, Baldoli C, Falini A,
Candiani M and Cavoretto P: A hierarchical procedure to select
intrauterine and extrauterine factors for methodological validation
of preterm birth risk estimation. BMC Pregnancy Childbirth.
21:3062021. View Article : Google Scholar : PubMed/NCBI
|
|
30
|
Roh J, Jung J, Lee Y, Kim SW, Pak HK, Lee
AN, Lee J, Cho J, Cho H, Yoon DH, et al: Risk stratification using
multivariable fractional polynomials in diffuse large B-Cell
lymphoma. Front Oncol. 10:3292020. View Article : Google Scholar : PubMed/NCBI
|
|
31
|
Weng ZA, Huang XX, Deng D, Yang ZG, Li SY,
Zang JK, Li YF, Liu YF, Wu YS, Zhang TY, et al: A new nomogram for
predicting the risk of intracranial hemorrhage in acute ischemic
stroke patients after intravenous thrombolysis. Front Neurol.
13:7746542022. View Article : Google Scholar : PubMed/NCBI
|
|
32
|
Alba AC, Agoritsas T, Walsh M, Hanna S,
Iorio A, Devereaux PJ, McGinn T and Guyatt G: Discrimination and
calibration of clinical prediction models: Users' guides to the
medical literature. JAMA. 318:1377–1384. 2017. View Article : Google Scholar : PubMed/NCBI
|
|
33
|
Mehta HB, Mehta V, Girman CJ, Adhikari D
and Johnson ML: Regression coefficient-based scoring system should
be used to assign weights to the risk index. J Clin Epidemiol.
79:22–28. 2016. View Article : Google Scholar : PubMed/NCBI
|
|
34
|
Collins GS, Reitsma JB, Altman DG and
Moons KG: Transparent reporting of a multivariable prediction model
for individual prognosis or diagnosis (TRIPOD): The TRIPOD
statement. BMJ. 350:g75942015. View Article : Google Scholar : PubMed/NCBI
|
|
35
|
Hu X, Martinez-Ledesma E, Zheng S, Kim H,
Barthel F, Jiang T, Hess KR and Verhaak RGW: Multigene signature
for predicting prognosis of patients with 1p19q co-deletion diffuse
glioma. Neuro Oncol. 19:786–795. 2017. View Article : Google Scholar : PubMed/NCBI
|
|
36
|
Zhang Y, Ma W, Fan W, Ren C, Xu J, Zeng F,
Bao Z, Jiang T and Zhao Z: Comprehensive transcriptomic
characterization reveals core genes and module associated with
immunological changes via 1619 samples of brain glioma. Cell Death
Dis. 12:11402021. View Article : Google Scholar : PubMed/NCBI
|
|
37
|
Zheng Y, Ji Q, Xie L, Wang C, Yu CN, Wang
YL, Jiang J, Chen F and Li WB: Ferroptosis-related gene signature
as a prognostic marker for lower-grade gliomas. J Cell Mol Med.
25:3080–3090. 2021. View Article : Google Scholar : PubMed/NCBI
|
|
38
|
Wang X, Gao M, Ye J, Jiang Q, Yang Q,
Zhang C, Wang S, Zhang J, Wang L, Wu J, et al: An immune
Gene-Related Five-lncRNA signature for to predict glioma prognosis.
Front Genet. 11:6120372020. View Article : Google Scholar : PubMed/NCBI
|
|
39
|
Yun D, Wang X, Wang W, Ren X, Li J, Wang
X, Liang J, Liu J, Fan J, Ren X, et al: A novel prognostic
signature based on glioma essential Ferroptosis-Related genes
predicts clinical outcomes and indicates treatment in glioma. Front
Oncol. 12:8977022022. View Article : Google Scholar : PubMed/NCBI
|
|
40
|
Missios S, Kalakoti P, Nanda A and Bekelis
K: Craniotomy for glioma resection: A predictive model. World
Neurosurg. 83:957–964. 2015. View Article : Google Scholar : PubMed/NCBI
|
|
41
|
Jia Z, Yan Y, Wang J, Yang H, Zhan H, Chen
Q, He Y and Hu Y: Development and validation of prognostic nomogram
in patients with WHO grade III meningioma: A retrospective cohort
study based on SEER database. Front Oncol. 11:7199742021.
View Article : Google Scholar : PubMed/NCBI
|
|
42
|
Zhang GJ, Liu XY and You C: Clinical
factors and outcomes of atypical meningioma: A Population-Based
study. Front Oncol. 11:6766832021. View Article : Google Scholar : PubMed/NCBI
|
|
43
|
Xiong Y, Cao H, Zhang Y, Pan Z, Dong S,
Wang G, Wang F and Li X: Nomogram-Predicted survival of breast
cancer brain metastasis: A SEER-Based population study. World
Neurosurg. 128:e823–e834. 2019. View Article : Google Scholar : PubMed/NCBI
|
|
44
|
Zindler JD, Jochems A, Lagerwaard FJ,
Beumer R, Troost EGC, Eekers DBP, Compter I, van der Toorn PP,
Essers M, Oei B, et al: Individualized early death and long-term
survival prediction after stereotactic radiosurgery for brain
metastases of non-small cell lung cancer: Two externally validated
nomograms. Radiother Oncol. 123:189–194. 2017. View Article : Google Scholar : PubMed/NCBI
|
|
45
|
Shen H, Deng G, Chen Q and Qian J: The
incidence, risk factors and predictive nomograms for early death of
lung cancer with synchronous brain metastasis: A retrospective
study in the SEER database. BMC Cancer. 21:8252021. View Article : Google Scholar : PubMed/NCBI
|
|
46
|
Yao Z, Zheng Z, Ke W, Wang R, Mu X, Sun F,
Wang X, Garg S, Shi W, He Y and Liu Z: Prognostic nomogram for
bladder cancer with brain metastases: A National Cancer Database
analysis. J Transl Med. 17:4112019. View Article : Google Scholar : PubMed/NCBI
|
|
47
|
Nieder C, Hintz M and Grosu AL: Predicted
survival in patients with brain metastases from colorectal cancer:
Is a current nomogram helpful? Clin Neurol Neurosurg. 143:107–110.
2016. View Article : Google Scholar : PubMed/NCBI
|
|
48
|
Bodewes T, Pothof AB, Darling JD, Deery
SE, Jones DW, Soden PA, Moll FL and Schermerhorn ML: Preoperative
anemia associated with adverse outcomes after infrainguinal bypass
surgery in patients with chronic limb-threatening ischemia. J Vasc
Surg. 66:1775–1785.e2. 2017. View Article : Google Scholar : PubMed/NCBI
|
|
49
|
Kouyoumdjian A, Trepanier M, Al Shehhi R,
Cools-Lartigue J, Ferri LE, Lee L and Mueller CL: The effect of
preoperative anemia and perioperative transfusion on surgical
outcomes after gastrectomy for gastric cancer. J Surg Res.
259:523–531. 2021. View Article : Google Scholar : PubMed/NCBI
|
|
50
|
Faraoni D, DiNardo JA and Goobie SM:
Relationship between preoperative anemia and In-Hospital mortality
in children undergoing noncardiac surgery. Anesth Analg.
123:1582–1587. 2016. View Article : Google Scholar : PubMed/NCBI
|
|
51
|
Zhang X, Zhang F, Qiao W, Zhang X, Zhao Z
and Li M: Low hematocrit is a strong predictor of poor prognosis in
lung cancer patients. Biomed Res Int. 2018:68049382018.PubMed/NCBI
|
|
52
|
Lee DY, Chung EL, Guend H, Whelan RL,
Wedderburn RV and Rose KM: Predictors of mortality after emergency
colectomy for Clostridium difficile colitis: An analysis of
ACS-NSQIP. Ann Surg. 259:148–156. 2014. View Article : Google Scholar : PubMed/NCBI
|
|
53
|
Chung PJ, Carter TI, Burack JH, Tam S,
Alfonso A and Sugiyama G: Predicting the risk of death following
coronary artery bypass graft made simple: A retrospective study
using the American College of Surgeons National Surgical quality
improvement program database. J Cardiothorac Surg. 10:622015.
View Article : Google Scholar : PubMed/NCBI
|
|
54
|
Cagney DN, Martin AM, Catalano PJ, Redig
AJ, Lin NU, Lee EQ, Wen PY, Dunn IF, Bi WL, Weiss SE, et al:
Incidence and prognosis of patients with brain metastases at
diagnosis of systemic malignancy: A population-based study. Neuro
Oncol. 19:1511–1521. 2017. View Article : Google Scholar : PubMed/NCBI
|