Introduction
Breast cancer (BC) is a class of highly
heterogeneous tumors that can jeopardize the health. BC is not only
the most common malignancy in female patients but also the leading
cause of cancer-associated mortality in the female population
worldwide. In 2020, ~2.3 million female patients were newly
diagnosed with BC worldwide and it was the cause of ~685,000
deaths. The incidence of BC varies by region, but appears to be
increasing (1). In China, BC now
has the highest rate among female malignant tumors and the age at
which it first appears is decreasing (2). The occurrence and development of BC is
affected by numerous factors (3).
Although there have been numerous relevant studies, the
pathogenesis of BC has not yet been elucidated (4,5). In
the late 1920s, Warburg et al (6) reported alterations in aerobic
glycolysis in cancer cells. Since then, metabolic changes have been
reported in patients with cancer, including the metabolism of amino
acids and nucleic acids (7,8). Several experts think that cancer is a
series of metabolic diseases (9,10).
Thus, understanding metabolic changes in the serum of patients with
cancer may provide insight into the biology of cancer. This is
beneficial for cancer intervention, and the prevention of
metastasis and development of malignant tumors (11).
Metabolomics is a technology that measures the
qualitative and quantitative changes of metabolites after a
biological system has been subjected to exogenous stimuli (12,13).
The occurrence and progression of BC are associated with alteration
of metabolites, and metabolomics can analyze these changes that
occur during the development and progression of BC, identifying
valuable potential markers (14,15).
The metabolomics results are affected by the environment,
physiology, drugs and other confounding factors. Metabolic
biomarkers have been able to discriminate between BC and normal
tissue with high sensitivity and specificity, which has led to
development of novel methods for screening and diagnosing BC
(16). For example, previous
metabolomics methods, such as nuclear magnetic resonance, isotope
ratio mass spectrometry (MS) and gas and liquid chromatography
(LC)-MS, have been applied to find characteristic markers of the
pathogenesis and progression of BC, and each method has its own
advantages and disadvantages (17,18).
In the present study, non-targeted metabolomics with
chemometrics based on ultra-high performance
(UHP)LC-high-resolution (HR)MS was performed to analyze serum
samples of patients with BC and healthy individuals to assess
metabolite patterns and elucidate potential biomarkers of BC.
Materials and methods
Participants and ethics
A total of 27 female patients with BC and 30 healthy
female control subjects were recruited between May 2020 and
September 2021 from the Department of Thyroid and Breast Surgery at
Nanxishan Hospital of Guangxi Zhuang Autonomous Region (Guilin,
China) before surgery and/or chemotherapy. Patients with BC were
between the ages of 36 and 66 years, and the control subjects were
between the ages of 22 and 63 years. There was no significant
difference in age between the two groups. The study protocol was
approved by the Institutional Review Board of the Clinical Research
Ethics Committee of Nanxishan Hospital of Guangxi Zhuang Autonomous
Region and written informed consent was obtained from each subject.
The inclusion criteria for patient recruitment were as follows: i)
Age, >18 years; ii) histologically confirmed BC; iii) no
metabolic disease and iv) no previous anticancer treatment. For
healthy individuals, the inclusion criteria were no abnormalities
in their blood test, physical examination or in any imaging
results. Clinical parameters and demographic characteristics of
subjects are summarized in Table I.
Blood samples were collected in the morning before breakfast. The
collected blood was immediately centrifuged at 5,000 × g for 10 min
at 4°C and the serum was transferred to a clean tube and stored at
−80°C until biochemical testing.
 | Table I.Demographic and clinical pathological
characteristics of the study population. |
Table I.
Demographic and clinical pathological
characteristics of the study population.
| Characteristic | Patients with BC
(n=27) | Healthy control
subjects (n=30) |
|---|
| Median age (range),
years | 52 (36–66) | 46 (22–63) |
| TNM stage, n
(%) |
|
|
| I | 8 (29.6) | n.a. |
|
IIa | 11 (40.7) | n.a. |
|
IIb | 4 (14.8) | n.a. |
|
IIIa | 4 (14.8) | n.a. |
|
IIIb | 0 (0.0) | n.a. |
| IV | 0 (0.0) | n.a. |
Metabolite extraction
The serum was diluted using extraction solution
(acetonitrile and methanol at 1:1, an internal standard mixture
containing isotopic labeling) and mixed for 30 sec in a low-speed
vortex machine. The samples were sonicated for 10 min in an ice
water bath and incubated for 1 h at −40°C to precipitate proteins.
The sample was then centrifuged at 13,800 × g at 4°C for 15 min and
the resulting supernatant was transferred to a clean test tube for
analysis. Quality control samples were prepared by mixing equal
parts of the supernatant of each sample.
UHPLC-HRMS analysis
UHPLC-HRMS analysis was performed using an UHPLC
system (Vanquish; Thermo Fisher Scientific, Inc.) with an Acquity
UPLC BEH Amide Column (2.1×100.0 mm; 1.7 µm; Waters Corp.) coupled
to an Orbitrap Exploris™ 120 MS machine (Thermo Fisher Scientific,
Inc.). The mobile phase comprised 25 mol/l ammonium acetate and 25
ammonium hydroxide in water (pH 9.75; phase A) and acetonitrile
(phase B). The auto-sampler temperature was at 4°C and the
injection volume was 2 µl. The MS machine used was able to acquire
MS/MS data in an information-dependent acquisition mode using
acquisition software (Xcalibur version 4.0.27; Thermo Fisher
Scientific, Inc.), which allowed continuous evaluation of the
full-scan MS spectrum obtained. The electrospray ionization (ESI)
source conditions were as follows: Sheath gas flow rate, 50 Arb;
Aux gas flow rate, 15 Arb; nebulizer pressure, 6 bar; flow rate,
0.3 l/min; capillary temperature, 320°C; full MS resolution,
60,000; MS/MS resolution, 115,000; collision energy, 10/30/60,
normalized collisional energy mode; and spray voltage, either 3.8
kV (positive) or −3.4 kV (negative).
Data preprocessing and annotation
The raw data were converted to mzXML format using
ProteoWizard (version 3.0; http://proteowizard.sourceforge.io/). Peak detection,
extraction, alignment and integration of data were performed based
on the XCMS method (19).
Metabolites were annotated using the MS2 database (version 2.1;
BiotreeDB). The cutoff for annotation was set at 0.3. To decrease
the impact of detection system errors on the results, a series of
preparations and a collation of the original data were performed,
included filtering of the outlying and missing values, imputation
of the missing values and data normalization.
Statistical analysis
SIMCA software (v15.0.2; Sartorius Stedim Data
Analytics AB; Sartorius AG) was used for analysis. This included
univariate statistical analysis (unpaired t-test), principal
component analysis (PCA) and orthogonal projections to latent
structures-discriminant analysis (OPLS-DA), and the circular line
indicates the 95% confidence interval (Hotelling's T-squared
ellipse). PCA demonstrated the distribution of the raw data and the
OPLS-DA revealed the contribution of the variables to the
differences between the two groups. To refine the analysis, the
first PC of the variable importance in projection (VIP) was
obtained. VIP >1 were selected to represent the metabolite
changes. To compare the impact of tumor staging on the
aforementioned metabolites, patients with BC were divided into two
groups (stage I/IIA, n=19 vs. stage IIB/IIIA, n=8) due to the small
number of patients with tumor-node-metastasis stages IIb and IIIa.
Comparison of two independent samples were assessed using Student's
t-tests. P<0.05 was considered to indicate a statistically
significant difference. The relative average normalized number of
identified differential metabolites was visualized using heat maps
generated using the MeV package. The corresponding metabolic
pathways and metabolite set enrichment analysis were analyzed using
Kyoto Encyclopedia of Genes and Genomes (KEGG; genome.jp/kegg/) and
MetaboAnalyst 2.0 (metaboanalyst.ca) software packages.
Results
Data management
The ionization source of the HRMS platform used in
the present study was ESI, which has two modes of ionization, a
positive ion mode (POS) and a negative ion mode (NEG); their
combination in detecting the metabolome can produce higher and more
precise detection of metabolite coverage (20). POS and NEG datasets were analyzed
separately. The raw data contained seven quality control and 57
experimental samples, with 9,404 and 8,401 peaks extracted from POS
and NEG, respectively. After data preprocessing, 7,287 and 6,169
peaks were retained from POS and NEG, respectively.
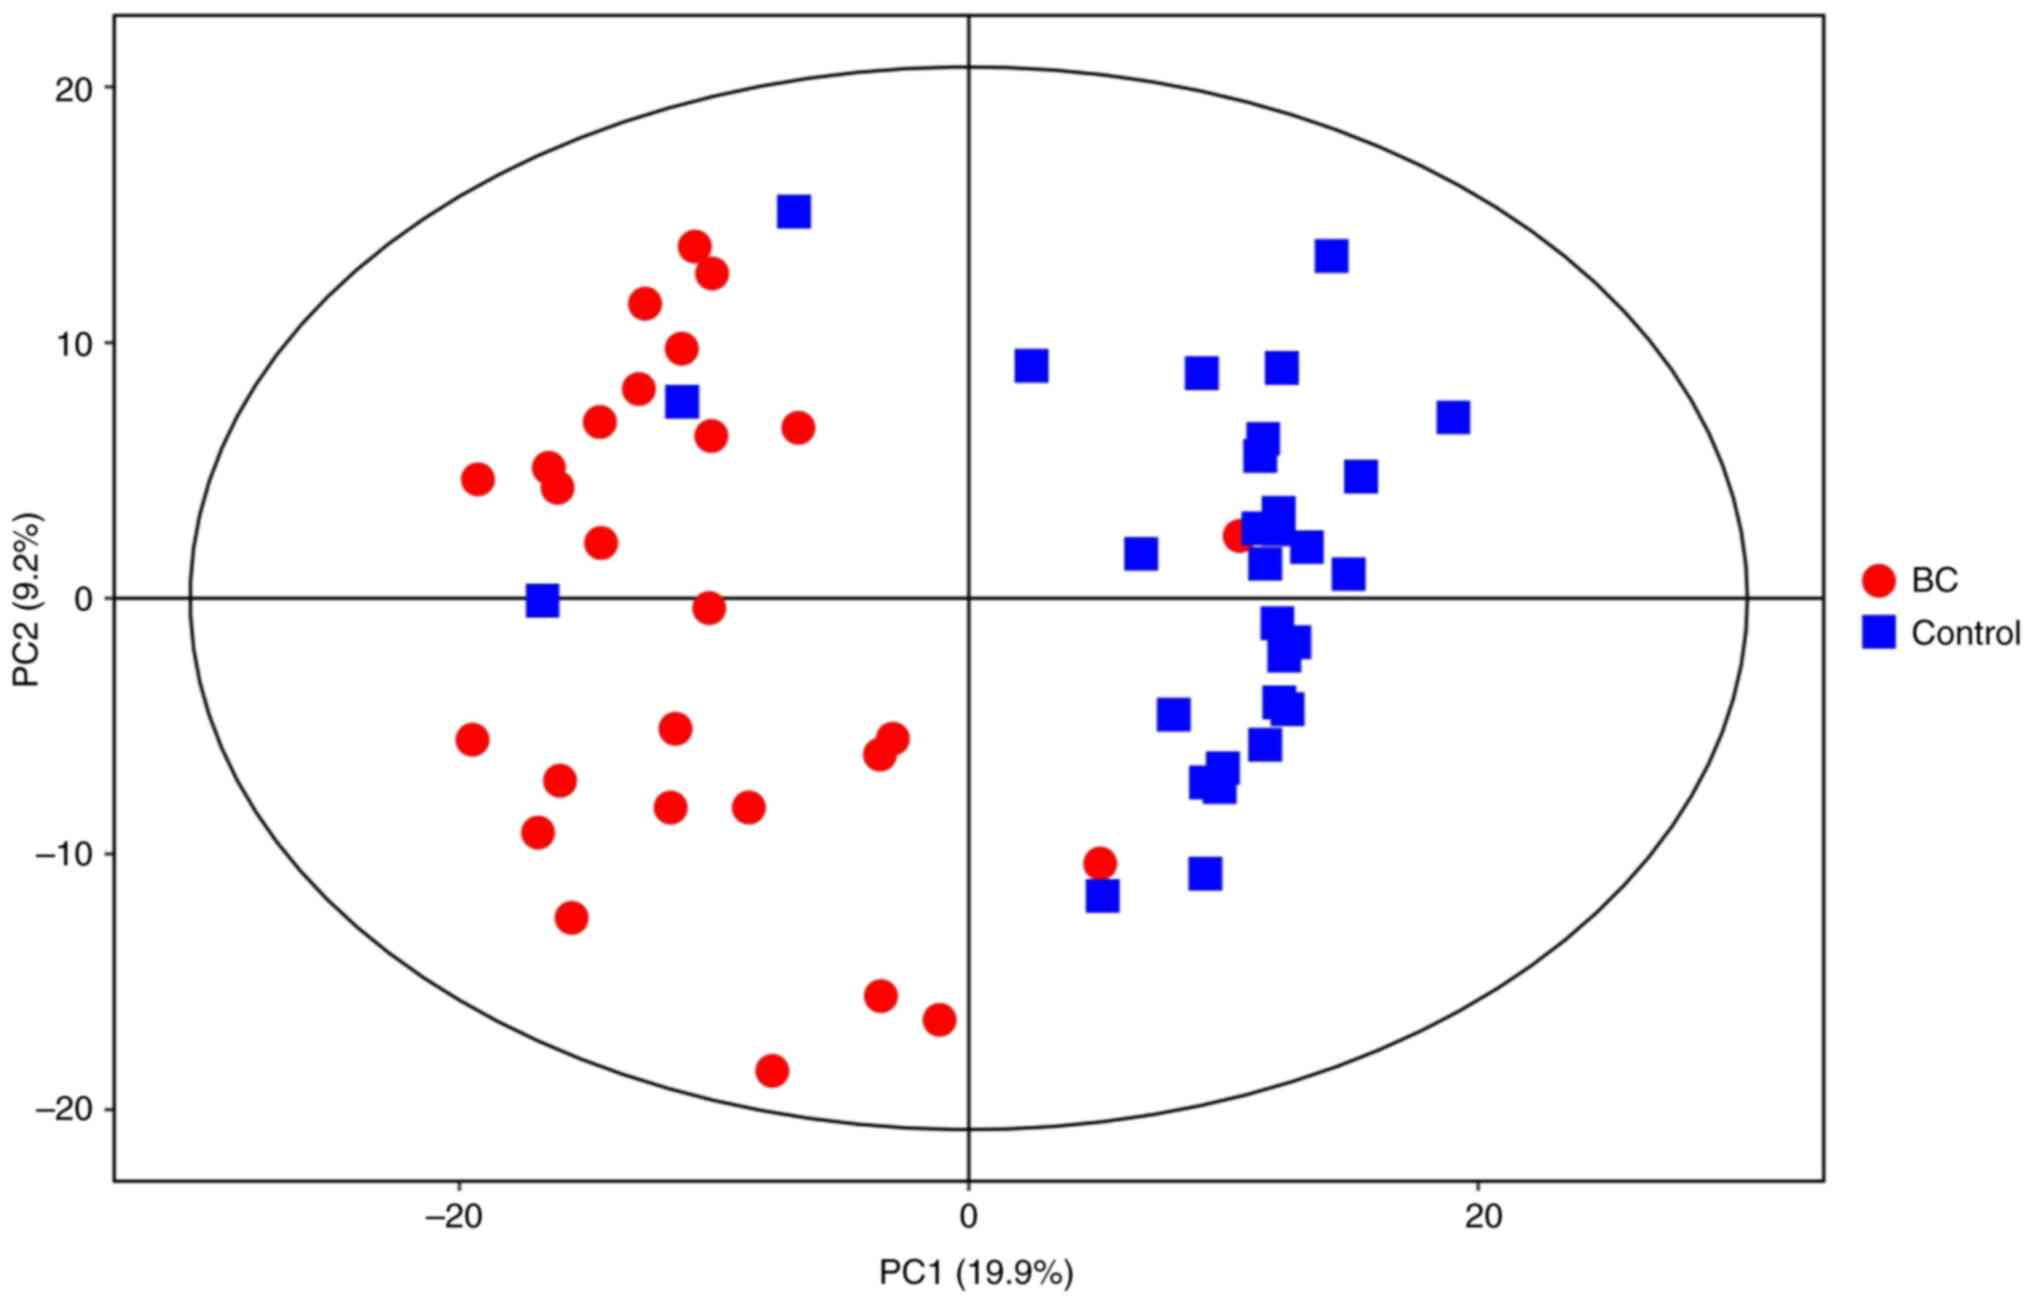
PCA
PCA was performed to generate an overview of the
variations between the BC and healthy control groups (Fig. 1). Each scatter point represents a
sample, and the color and shape of the scatter points represent
different groups. A narrower sample point distribution indicates a
more similar type and content of metabolites in the sample, while
wider sample point distributions indicate larger differences in the
overall metabolic level. All samples were within the 95% confidence
interval.
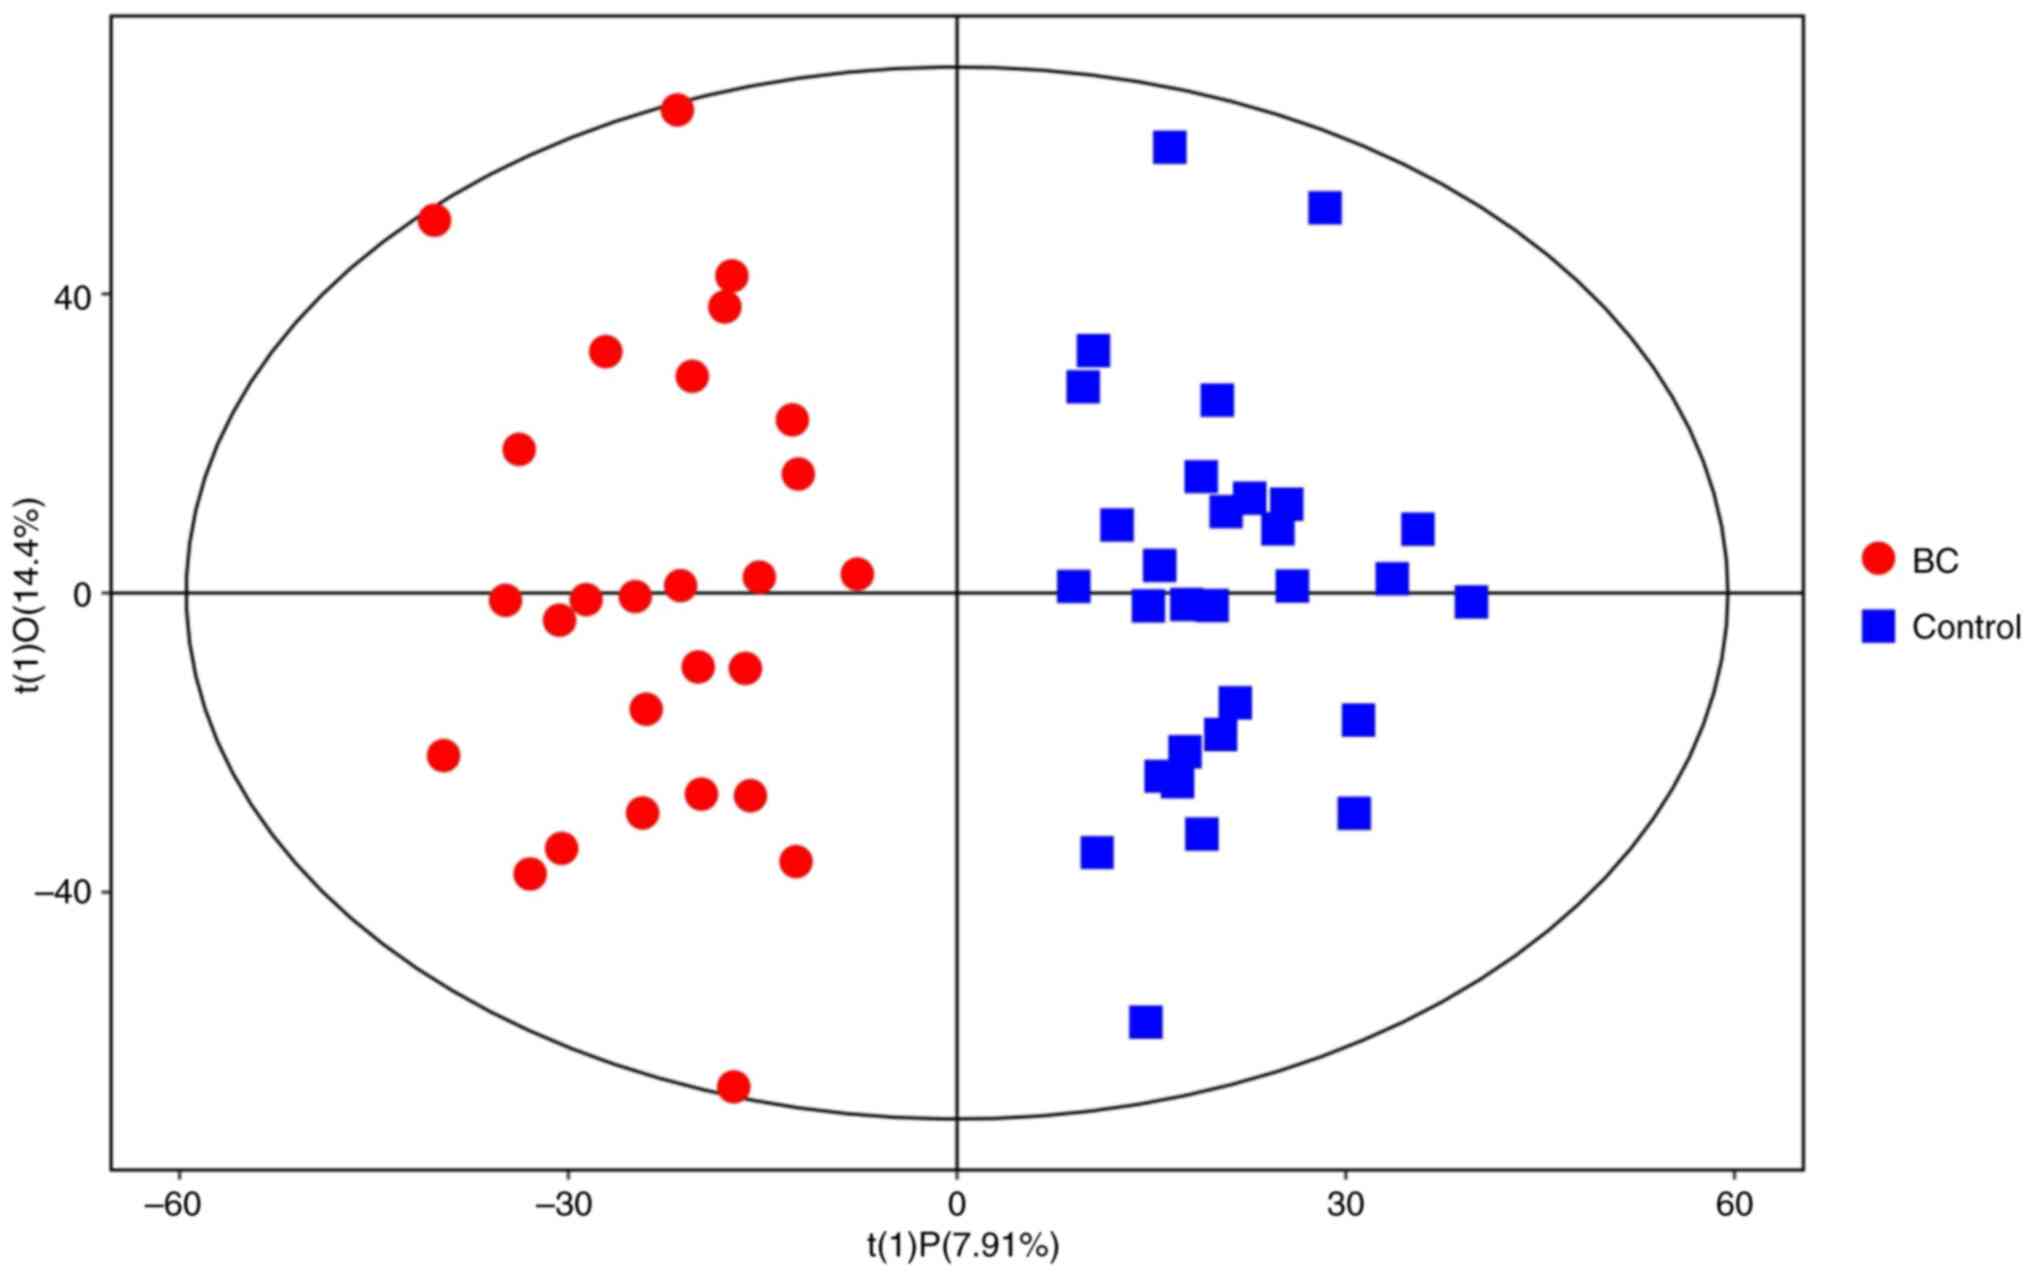
Orthogonal projection to latent
structures discriminant analysis
As an unmonitored PCA model was unable to identify
differential metabolites in the serum samples, further discriminant
analysis was necessary. To optimize separation between the two
groups, OPLS-DA was used to distinguish the metabolic differences.
Good discrimination between the two groups was achieved using an
OPLS-DA scores plot (Fig. 2), R2X,
R2Y and Q2Y were calculated, which varied from 0 to 1. R2X and R2Y
represent the fraction of the variance of the × and y variable
explained by the model, while Q2Y indicates the predictive
performance of the model. The predictive ability of the model was
measured by internal validation (POS-models: R2X=0.224, R2Y=0.878
and Q2=0.685; NEG-models: R2X=0.178, R2Y=0.907 and Q2=0.662),
suggesting that the model possessed a satisfactory fit with good
predictive power. The results of the OPLS-DA score plot (Fig. 2) indicate that the two groups of
samples are significantly distinguishable, with all samples falling
within the 95% confidence interval.
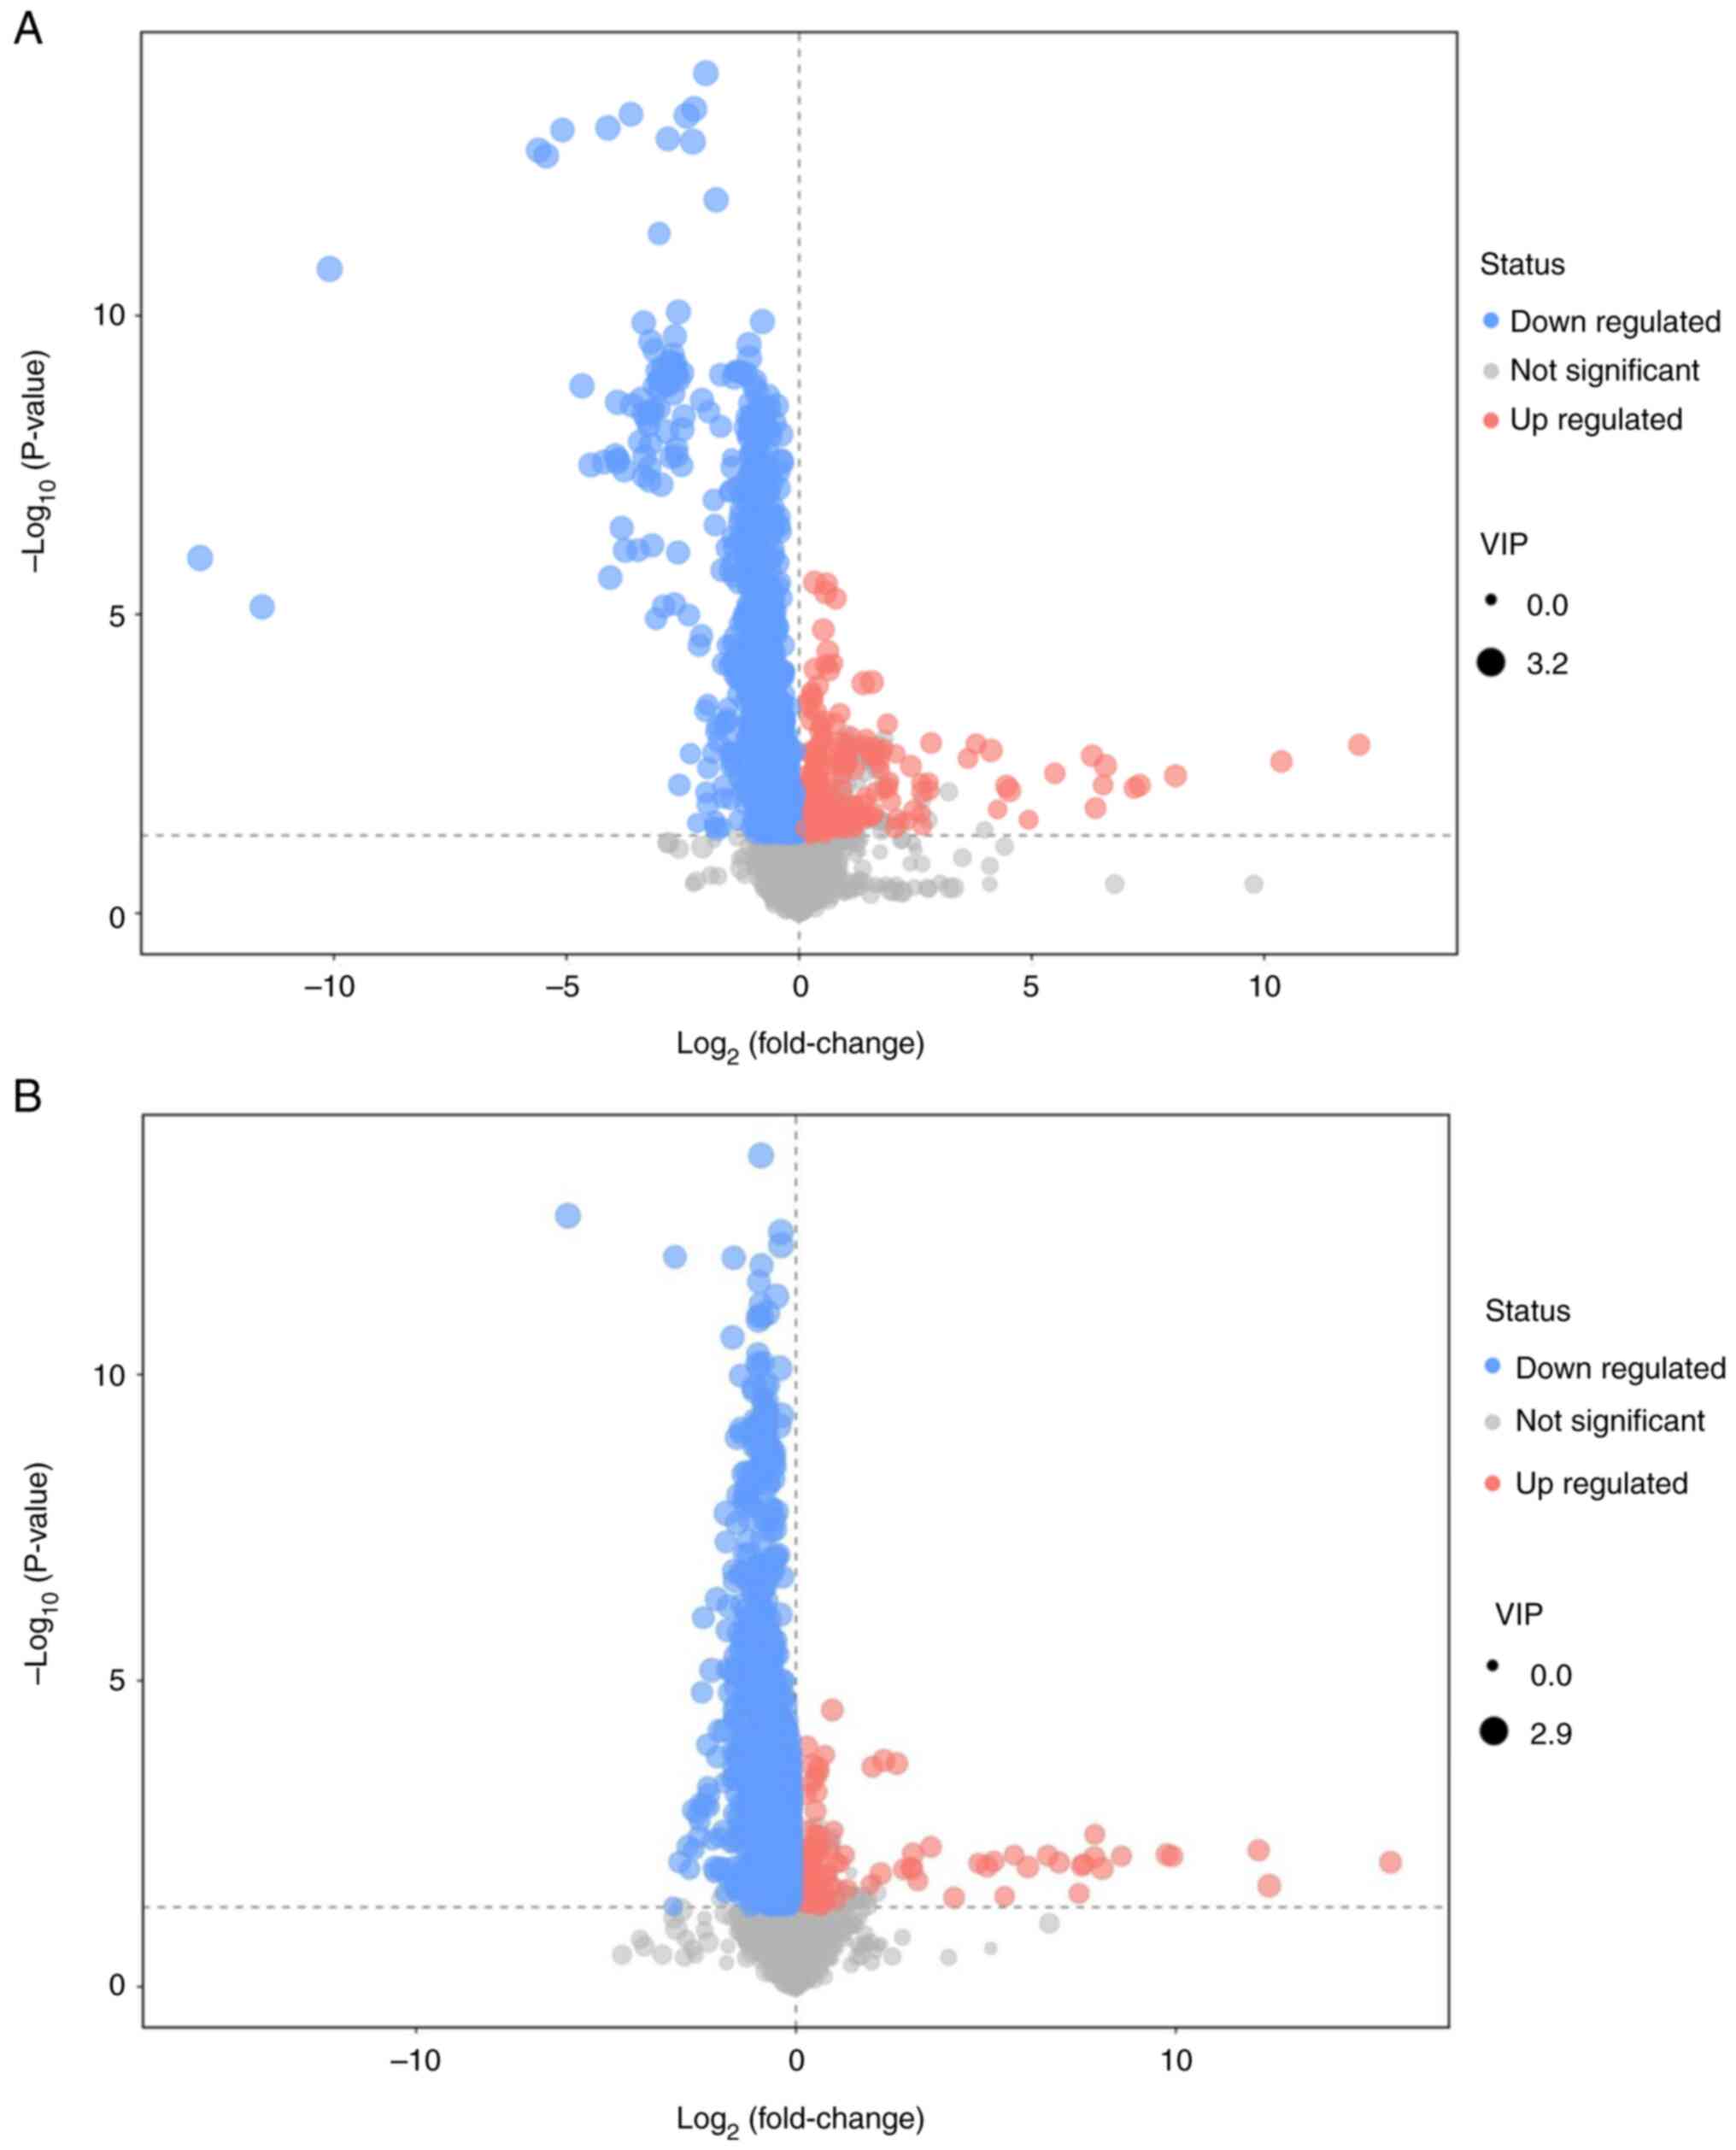
Differential metabolite screening and
volcano plot for BC vs. healthy control group
POS qualitatively assigned a total of 1,680
differential metabolites, 120 of which were known. The NEG models
collectively identified 1,566 differential metabolites, 52 of which
were known. There were 2,938 down- and 308 upregulated metabolites
in the BC compared with the healthy control group. The results
comparing the BC group with the Control group are depicted in the
volcano plot (Fig. 3). The findings
are presented in two modes: The positive ion mode (Fig. 3A) and the negative ion mode
(Fig. 3B). Each point in the
volcano plot represents one metabolite and each plot consisted of
all the substances measured in the present experiment. The abscissa
represents the fold change of the group against each substance, the
ordinate represents the P-value of the Student's t-test and the
scatter size represents the VIP value of the OPLS-DA model. A
larger scatter indicates a greater VIP value obtained. An example
of differential metabolite screening results is shown in Table II; the top 10 results are shown for
POS and NEG.
| Table II.Top 10 differential metabolites
screened for the positive and negative ion modes. |
Table II.
Top 10 differential metabolites
screened for the positive and negative ion modes.
| A, Positive ion
mode |
|---|
|
|---|
| Differential
metabolite | VIP | P-value | Fold change | Trend (BC vs.
CON) |
|---|
| Myo-inositol
hexakisphosphate | 1.514 | <0.001 | 0.471 | ↓ |
| 1-pyrroline | 1.391 | 0.023 | 0.771 | ↓ |
| Trigonelline | 1.143 | 0.037 | 0.599 | ↓ |
| Niacinamide | 1.208 | 0.027 | 0.717 | ↓ |
|
6,7-dihydro-5-methyl-5H-cyclopenta[b]pyrazine | 1.836 | 0.003 | 1,320.776 | ↑ |
| Butyramide | 2.473 | <0.001 | 0.564 | ↓ |
|
N-methyl-a-aminoisobutyric acid | 1.133 | 0.007 | 0.854 | ↓ |
| 5-aminopentanoic
acid | 1.293 | 0.004 | 0.844 | ↓ |
|
1-Methylhypoxanthine | 1.348 | 0.006 | 1.341 | ↑ |
| Ustiloxin D | 1.321 | 0.018 | 0.847 | ↓ |
|
| B, Negative ion
mode |
|
| Differential
metabolite | VIP | P-value | Fold
change | Trend (BC vs.
CON) |
|
| 5Z-dodecenoic
acid | 1.996 | <0.001 | 0.531 | ↓ |
| Undecylenic
acid | 1.971 | 0.007 | 0.583 | ↓ |
|
3-methyl-2-oxovaleric acid | 1.395 | 0.006 | 0.817 | ↓ |
| 9-decenoic
acid | 2.041 | <0.001 | 0.516 | ↓ |
| Capric acid | 1.501 | 0.008 | 0.646 | ↓ |
| Pyrocatechol | 2.305 | 0.000 | 0.309 | ↓ |
| Dodecanoic
acid | 1.99 | 0.000 | 0.555 | ↓ |
| Myristic acid | 1.161 | 0.032 | 0.797 | ↓ |
| α-ketoisovaleric
acid | 1.161 | 0.024 | 0.877 | ↓ |
| Indoxyl
sulfate | 1.923 | <0.001 | 0.442 | ↓ |
The short- and medium-chain fatty acids, including
5Z-dodecenoic acid, 9-decenoic acid, capric acid and myristic acid
were significantly decreased in patients with BC compared to normal
individuals (fold change, 0.531, 0.516, 0.562 and 0.797,
respectively; all P<0.05).
Volcano plots were generated to provide a visual
representation of overall distribution of metabolite differences
between the groups (Fig. 3). Each
point in the volcano plot represents one metabolite and each plot
consisted of all the substances measured in the present experiment.
The abscissa represents the fold change of the group against each
substance, the ordinate represents the P-value of the Student's
t-test and the scatter size represents the VIP value of the OPLS-DA
model. The larger the scatter, the greater the VIP value
obtained.
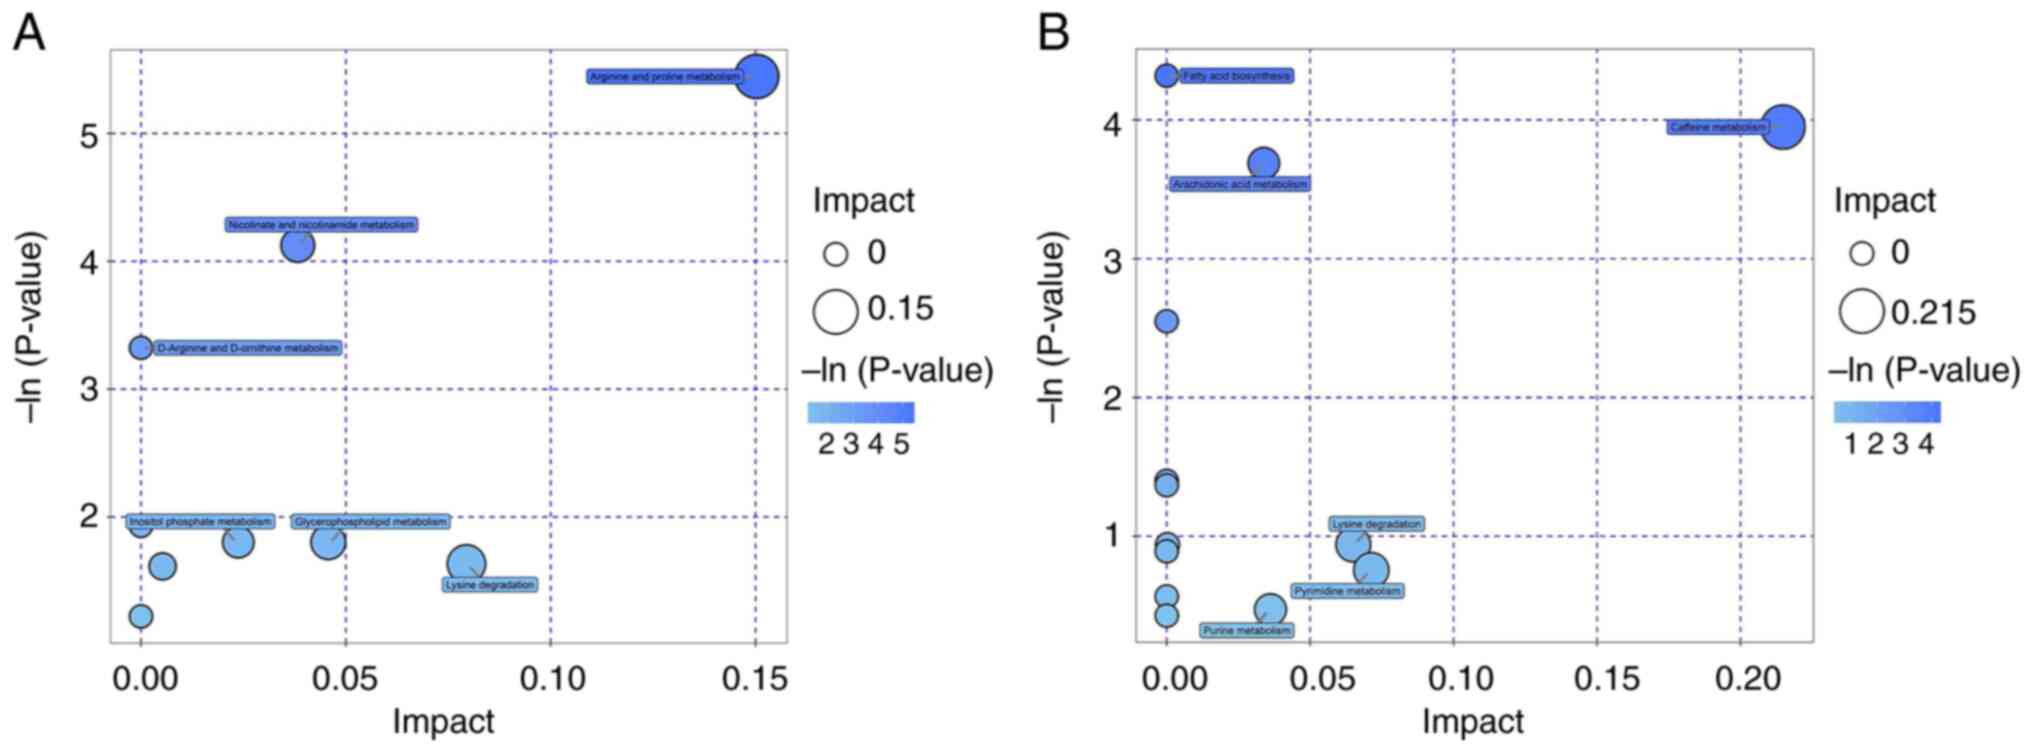
KEGG analysis of differential
metabolites
KEGG and MetaboAnalyst were used for pathway
enrichment analysis. The metabolic pathways involving the
identified metabolites were analyzed and only those with raw
P<0.05 were considered to be differential metabolic pathways.
The primary metabolic pathways that differed between the control
and BC groups were involved in amino acid metabolism, including
those associated with arginine and proline (Table III). The other pathways were
involved in nicotinate, nicotinamide, caffeine and arachidonic acid
(AA) metabolism, as well as fatty acid biosynthesis. The results of
the metabolic pathway analysis are presented as bubble plots in
Fig. 4. Each bubble in the plot
represents a metabolic pathway, and the abscissa and the bubble
size represent the effect factor size of that pathway in the
topology analysis. The larger the effect factor, the larger the
bubble size.
| Table III.Metabolic pathways associated with
metabolites. |
Table III.
Metabolic pathways associated with
metabolites.
| A, Positive ion
mode |
|---|
|
|---|
| Pathway | Hits compound | Cpd |
|---|
| Arginine and
proline metabolism | L-arginine | C00062 |
|
| Guanidoacetic
acid | C00581 |
|
| 5-aminopentanoic
acid | C00431 |
| Nicotinate and
nicotinamide metabolism | Niacinamide | C00153 |
|
| Trigonelline | C01004 |
| D-Arginine and
D-ornithine metabolism | L-arginine | C00062 |
| Methane
metabolism | Trimethylamine
N-oxide | C01104 |
| Inositol phosphate
metabolism | Myo-inositol
hexakisphosphate | C01204 |
| Glycerophospholipid
metabolism |
Phosphorylcholine | C00588 |
| Lysine
degradation | 5-aminopentanoic
acid | C00431 |
| Glycine, serine and
threonine metabolism | Guanidoacetic
acid | C00581 |
| Aminoacyl-tRNA
biosynthesis | L-Arginine | C00062 |
|
| B, Negative ion
mode |
|
| Pathway | Hits
compound | Cpd |
|
| Fatty acid
biosynthesis | Myristic acid | C06424 |
|
| Dodecanoic
acid | C02679 |
|
| Capric acid | C01571 |
| Caffeine
metabolism | Caffeine | C07481 |
|
| Xanthine | C00385 |
| Arachidonic acid
metabolism | Prostaglandin
D2 | C00696 |
|
| 5,6-DHET | C14772 |
|
| 8,9-DiHETrE | C14773 |
| Phenylalanine
metabolism |
Phenylacetylglycine | C05598 |
|
|
N-acetyl-L-phenylalanine | C03519 |
| Phenylalanine,
tyrosine and tryptophan biosynthesis | Protocatechuic
acid | C00230 |
| Pantothenate and
CoA biosynthesis | Uracil | C00106 |
| β-alanine
metabolism | Uracil | C00106 |
| Primary bile acid
biosynthesis | Chenodeoxycholic
acid | C02528 |
| Lysine
degradation | Glutaric acid | C00489 |
| Fatty acid
metabolism | Glutaric acid | C00489 |
| Pyrimidine
metabolism | Uracil | C00106 |
| Tryptophan
metabolism |
Acetyl-N-formyl-5-methoxykynurenamine | C05642 |
| Purine
metabolism | Xanthine | C00385 |
| Steroid hormone
biosynthesis | Cholesterol
sulfate | C18043 |
Discussion
Cancer is a metabolic disease and carcinogenic cells
consume more nutrients and energy than normal cells to support the
rapid growth of tumors. This leads to alterations in metabolite
levels in the body (21–23). In past decades, there has been a
great deal of research into the relationship between tumors and
metabolism and these studies may provide a potential approach to
identifying novel biomarkers for BC (24,25).
An advantage of metabolomic analysis is the ability
to use blood samples. This provides a simple method to obtain
metabolic information regarding tumors without need for invasive
and potentially dangerous biopsies. All factors that affect health
of the organism can be reflected in the metabolome. For example,
genes, environmental factors, nutrition, drugs, xenobiotics and age
lead to changes in the metabolome (26). Hence, metabolomics is expected to
serve an important role in elucidating characteristic BC
markers.
Rapid proliferation of tumor cells requires large
amounts of nutrients, including glucose, lipids and amino acids, to
sustain protein synthesis and energy supply. In the present study,
blood samples were analyzed by UHPLC-HRMS and metabolites were
quantified. A total of 3,246 metabolites were detected in the sera
of healthy control individuals and patients with cancer. Among
them, 172 could be identified and were classified in different
metabolic pathways. Sera from patients with BC demonstrated
significant alterations in arginine and proline metabolism pathways
compared with the healthy controls. There were also significant
decreases in L-arginine, guanidoacetic acid and 5-aminopentanoic
acid levels.
Arginine is obtained via two key pathways,
intracellular endogenous synthesis of arginine primarily from
enterocytes and kidneys and extracellular arginine primarily
derived from daily food intake (27). However, the endogenous production of
intracellular arginine is mainly maintained by de novo
synthesis from citrulline, using argininosuccinate synthetase 1
(ASS1), which is a rate limiting enzyme. ASS1 gene deletion in
tumors results in arginine deficiency, as tumor cells lose the
ability to synthesize arginine and as such rely on external sources
to support rapid growth with minimal energy expenditure (28). Arginine-deficient tumors include
hepatocellular carcinoma, melanoma, malignant pleural mesothelioma
and prostate and kidney cancer (29). A previous study also reported that
ASS1 deficiency or low expression is common in tumor cells
(30). Notably, higher levels of
arginine have been reported in breast tissue from patients with BC
compared with benign tissue but lower levels of arginine are
observed in the blood (31–33). The present study demonstrated
similar results, with significantly lower serum arginine
concentrations in patients with BC. Considering the changes in
arginine and downstream molecules, the results indicate that the
arginine and proline metabolic pathways are altered in patients
with BC, potentially due to low expression of ASS1 in tumor cells,
in addition to tumor cell depletion. However the mechanisms leading
to these changes require confirmation.
In the present study, pathway enrichment analysis
revealed that the BC metabolic signaling pathways were also
involved in nicotinic acid, nicotinamide, caffeine and purine
metabolic pathways. Nicotinic acid and nicotinamide metabolism are
associated with high turnover rates of nicotinamide adenine
dinucleotide (NAD+) in cancer cells, reflecting their
high proliferation rates and DNA synthesis (34). Altered purine and uric acid
metabolism may be due to increased tumor demand for substrates for
nucleic acid biosynthesis (35).
In the present study, inflammation-related AA
metabolic pathway was also significantly altered in patients with
BC. AA is an important fatty acid in the n-6 series of
polyunsaturated fatty acids and is necessary for the human body. AA
is primarily found in cell membranes as phospholipids and is
released as a free acid by phospholipases A2 and C, following which
it is transformed into bioactive metabolites. It is associated with
the development of tumors (36). AA
stimulates transformation of sphingomyelin to ceramide and induces
apoptosis, thus inhibiting tumor growth (37). A recent study demonstrated that high
rate of AA metabolism may be a biomarker for a good prognosis in
patients with BC, providing a potential explanation for the poor
effect of cyclooxygenase inhibitors in cancer therapy (38).
Although significant differences in metabolic groups
were observed between patients with BC and the healthy control
individuals, there were certain limitations to the present study.
First, the present study involved retrospective data collection and
the sample size for each subgroup was small. Second, all
histopathology results were diagnosed by one pathologist, which may
have led to bias in the data analysis. Third, metabolism is complex
and can vary in response to internal and external factors such as
dietary intake, medications and health status. However, fasting
blood samples were taken in the morning for all subjects prior to
any treatment to decrease bias in the present study.
In conclusion, the present study demonstrated
significant differences in the metabolites in blood samples
obtained from patients with BC and healthy controls. The changes in
metabolomic profiles of patients with BC may affect disease
biology. However, to the best of our knowledge, the mechanisms
leading to these changes are currently unknown. The present study
highlighted the usefulness of metabolomics performed on human serum
samples obtained from patients with BC. In addition, the present
study may provide novel diagnostic and/or prognostic biomarkers to
monitor disease progression and treatment.
Acknowledgements
Not applicable.
Funding
The present study was supported by Guangxi Natural Science
Foundation (grant no. 2020GXNSFBA238001), Guangxi Natural Science
Foundation (grant no. 2020GXNSFAA159051) and The Scientific
Research Project of Guangxi Health and Family Planning Commission
(grant no. S2020068).
Availability of data and materials
The data generated in the present study may be found
in the Chinese National GeneBank under accession no. CNP0005298 or
at the following URL: https://db.cngb.org/search/project/CNP0005298/, DOI:
10.26036/CNP0005298.
Authors' contributions
CW, RL and YW designed and performed experiments and
collected the serum samples from the patients. YW and YH analyzed
and curated data, processed images and checked the reliability of
the data. QZ analysed and interpreted the data. QZ and NW wrote the
original draft, and reviewed and edited the manuscript. NW and CW
gave final approval of the version to be published. NW contributed
to experimental design and data acquisition. QZ and YH confirm the
authenticity of all the raw data. All authors have read and
approved the final manuscript.
Ethics approval and consent to
participate
The present study was approved by the Institutional
Review Board of the Clinical Research Ethics Committee of Nanxishan
Hospital of Guangxi Zhuang Autonomous Region (Guilin, China;
approval no. 2019NXSYYEC-003) and each patient provided written
informed consent for participation.
Patient consent for publication
Not applicable.
Competing interests
The authors declare that they have no competing
interests.
References
|
1
|
Arnold M, Morgan E, Rumgay H, Mafra A,
Singh D, Laversanne M, Vignat J, Gralow JR, Cardoso F, Siesling S
and Soerjomataram I: Current and future burden of breast cancer:
Global statistics for 2020 and 2040. Breast. 66:15–23. 2022.
View Article : Google Scholar : PubMed/NCBI
|
|
2
|
Sung H, Ferlay J, Siegel RL, Laversanne M,
Soerjomataram I, Jemal A and Bray F: Global cancer statistics 2020:
GLOBOCAN estimates of incidence and mortality worldwide for 36
cancers in 185 countries. CA Cancer J Clin. 71:209–249. 2021.
View Article : Google Scholar : PubMed/NCBI
|
|
3
|
Fakhri N, Chad MA, Lahkim M, Houari A,
Dehbi H, Belmouden A and El Kadmiri N: Risk factors for breast
cancer in women: An update review. Med Oncol. 39:1972022.
View Article : Google Scholar : PubMed/NCBI
|
|
4
|
Derakhshan F and Reis-Filho JS:
Pathogenesis of triple-negative breast cancer. Annu Rev Pathol.
17:181–204. 2022. View Article : Google Scholar : PubMed/NCBI
|
|
5
|
Wong GL, Manore SG, Doheny DL and Lo HW:
STAT family of transcription factors in breast cancer: Pathogenesis
and therapeutic opportunities and challenges. Semin Cancer Biol.
86:84–106. 2022. View Article : Google Scholar : PubMed/NCBI
|
|
6
|
Warburg O, Wind F and Negelein E: The
metabolism of tumors in the body. J Gen Physiol. 8:519–530. 1927.
View Article : Google Scholar : PubMed/NCBI
|
|
7
|
Li S, Zeng H, Fan J, Wang F, Xu C, Li Y,
Tu J, Nephew KP and Long X: Glutamine metabolism in breast cancer
and possible therapeutic targets. Biochem Pharmacol.
210:1154642023. View Article : Google Scholar : PubMed/NCBI
|
|
8
|
Hamam R, Hamam D, Alsaleh KA, Kassem M,
Zaher W, Alfayez M, Aldahmash A and Alajez NM: Circulating
microRNAs in breast cancer: Novel diagnostic and prognostic
biomarkers. Cell Death Dis. 8:e30452017. View Article : Google Scholar : PubMed/NCBI
|
|
9
|
Gyamfi J, Kim J and Choi J: Cancer as a
metabolic disorder. Int J Mol Sci. 23:11552022. View Article : Google Scholar : PubMed/NCBI
|
|
10
|
Ling ZN, Jiang YF, Ru JN, Lu JH, Ding B
and Wu J: Amino acid metabolism in health and disease. Signal
Transduct Target Ther. 8:3452023. View Article : Google Scholar : PubMed/NCBI
|
|
11
|
Hanahan D and Weinberg RA: Hallmarks of
cancer: The next generation. Cell. 144:646–674. 2011. View Article : Google Scholar : PubMed/NCBI
|
|
12
|
Guan Q, Liang S, Wang Z, Yang Y and Wang
S: ¹H NMR-based metabonomic analysis of the effect of optimized
rhubarb aglycone on the plasma and urine metabolic fingerprints of
focal cerebral ischemia-reperfusion rats. J Ethnopharmacol.
154:65–75. 2014. View Article : Google Scholar : PubMed/NCBI
|
|
13
|
Dudzik D, Barbas-Bernardos C, García A and
Barbas C: Quality assurance procedures for mass spectrometry
untargeted metabolomics. a review. J Pharm Biomed Anal.
147:149–173. 2018. View Article : Google Scholar : PubMed/NCBI
|
|
14
|
Huang S, Chong N, Lewis NE, Jia W, Xie G
and Garmire LX: Novel personalized pathway-based metabolomics
models reveal key metabolic pathways for breast cancer diagnosis.
Genome Med. 8:342016. View Article : Google Scholar : PubMed/NCBI
|
|
15
|
Ogrodzinski MP, Teoh ST and Lunt SY:
Metabolomic profiling of mouse mammary tumor-derived cell lines
reveals targeted therapy options for cancer subtypes. Cell Oncol
(Dordr). 43:1117–1127. 2020. View Article : Google Scholar : PubMed/NCBI
|
|
16
|
Araújo R, Bispo D, Helguero LA and Gil AM:
Metabolomic studies of breast cancer in murine models: A review.
Biochim Biophys Acta Mol Basis Dis. 1866:1657132020. View Article : Google Scholar : PubMed/NCBI
|
|
17
|
Sharma U and Jagannathan NR: Magnetic
resonance imaging (MRI) and MR spectroscopic methods in
understanding breast cancer biology and metabolism. Metabolites.
12:2952022. View Article : Google Scholar : PubMed/NCBI
|
|
18
|
Choi MH: Mass spectrometry-based metabolic
signatures of sex steroids in breast cancer. Mol Cell Endocrinol.
466:81–85. 2018. View Article : Google Scholar : PubMed/NCBI
|
|
19
|
Huan T, Forsberg EM, Rinehart D, Johnson
CH, Ivanisevic J, Benton HP, Fang M, Aisporna A, Hilmers B, Poole
FL, et al: Systems biology guided by XCMS Online metabolomics. Nat
Methods. 14:461–462. 2017. View Article : Google Scholar : PubMed/NCBI
|
|
20
|
Yuan M, Breitkopf SB, Yang X and Asara JM:
A positive/negative ion-switching, targeted mass spectrometry-based
metabolomics platform for bodily fluids, cells, and fresh and fixed
tissue. Nat Protoc. 7:872–881. 2012. View Article : Google Scholar : PubMed/NCBI
|
|
21
|
Griffin JL and Shockcor JP: Metabolic
profiles of cancer cells. Nat Rev Cancer. 4:551–561. 2004.
View Article : Google Scholar : PubMed/NCBI
|
|
22
|
Kim YS, Maruvada P and Milner JA:
Metabolomics in biomarker discovery: Future uses for cancer
prevention. Future Oncol. 4:93–102. 2008. View Article : Google Scholar : PubMed/NCBI
|
|
23
|
Spratlin JL, Serkova NJ and Eckhardt SG:
Clinical applications of metabolomics in oncology: A review. Clin
Cancer Res. 15:431–440. 2009. View Article : Google Scholar : PubMed/NCBI
|
|
24
|
Mishra P and Ambs S: Metabolic signatures
of human breast cancer. Mol Cell Oncol. 3:e9922172015. View Article : Google Scholar : PubMed/NCBI
|
|
25
|
Johnson CH, Manna SK, Krausz KW, Bonzo JA,
Divelbiss RD, Hollingshead MG and Gonzalez FJ: Global metabolomics
reveals urinary biomarkers of breast cancer in a mcf-7 ×enograft
mouse model. Metabolites. 3:658–672. 2013. View Article : Google Scholar : PubMed/NCBI
|
|
26
|
Johnson CH, Patterson AD, Idle JR and
Gonzalez FJ: Xenobiotic metabolomics: Major impact on the
metabolome. Annu Rev Pharmacol Toxicol. 52:37–56. 2012. View Article : Google Scholar : PubMed/NCBI
|
|
27
|
Szefel J, Danielak A and Kruszewski WJ:
Metabolic pathways of L-arginine and therapeutic consequences in
tumors. Adv Med Sci. 64:104–110. 2019. View Article : Google Scholar : PubMed/NCBI
|
|
28
|
Hu L, Gao Y, Cao Y, Zhang Y, Xu M, Wang Y,
Jing Y, Guo S, Jing F, Hu X and Zhu Z: Identification of arginine
and its ‘Downstream’ molecules as potential markers of breast
cancer. IUBMB Life. 68:817–822. 2016. View
Article : Google Scholar : PubMed/NCBI
|
|
29
|
Kim S, Lee M, Song Y, Lee SY, Choi I, Park
IS, Kim J, Kim JS, Kim KM and Seo HR: Argininosuccinate synthase 1
suppresses tumor progression through activation of
PERK/eIF2α/ATF4/CHOP axis in hepatocellular carcinoma. J Exp Clin
Cancer Res. 40:1272021. View Article : Google Scholar : PubMed/NCBI
|
|
30
|
Qiu F, Chen YR, Liu X, Chu CY, Shen LJ, Xu
J, Gaur S, Forman HJ, Zhang H, Zheng S, et al: Arginine starvation
impairs mitochondrial respiratory function in ASS1-deficient breast
cancer cells. Sci Signal. 7:ra312014. View Article : Google Scholar : PubMed/NCBI
|
|
31
|
Park KG, Heys SD, Harris CI, Steele RJ,
McNurlan MA, Eremin O and Garlick PJ: Arginine metabolism in benign
and malignant disease of breast and colon: Evidence for possible
inhibition of tumor-infiltrating macrophages. Nutrition. 7:185–188.
1991.PubMed/NCBI
|
|
32
|
Vissers YL, Dejong CH, Luiking YC, Fearon
KC, von Meyenfeldt MF and Deutz NE: Plasma arginine concentrations
are reduced in cancer patients: Evidence for arginine deficiency?
Am J Clin Nutr. 81:1142–1146. 2005. View Article : Google Scholar : PubMed/NCBI
|
|
33
|
Geng D, Sun D, Zhang L and Zhang W: The
therapy of gefitinib towards breast cancer partially through
reversing breast cancer biomarker arginine. Afr Health Sci.
15:594–597. 2015. View Article : Google Scholar : PubMed/NCBI
|
|
34
|
Navas LE and Carnero A: Nicotinamide
adenine dinucleotide (NAD) metabolism as a relevant target in
cancer. Cells. 11:26272022. View Article : Google Scholar : PubMed/NCBI
|
|
35
|
Yin J, Ren W, Huang X, Deng J, Li T and
Yin Y: Potential mechanisms connecting purine metabolism and cancer
therapy. Front Immunol. 9:16972018. View Article : Google Scholar : PubMed/NCBI
|
|
36
|
Ortea I, González-Fernández MJ,
Ramos-Bueno RP and Guil-Guerrero JL: Proteomics study reveals that
docosahexaenoic and arachidonic acids exert different in vitro
anticancer activities in colorectal cancer cells. J Agric Food
Chem. 66:6003–6012. 2018. View Article : Google Scholar : PubMed/NCBI
|
|
37
|
Chan TA, Morin PJ, Vogelstein B and
Kinzler KW: Mechanisms underlying nonsteroidal antiinflammatory
drug-mediatedapoptosis. Proc Natl Acad Sci USA. 95:681–686. 1998.
View Article : Google Scholar : PubMed/NCBI
|
|
38
|
Li W, Guo X, Chen C and Li J: The
prognostic value of arachidonic acid metabolism in breast cancer by
integrated bioinformatics. Lipids Health Dis. 21:1032022.
View Article : Google Scholar : PubMed/NCBI
|