Introduction
Immunoglobulin (Ig) A nephropathy (IgAN), also known
as Berger disease (1), is the most
common form of glomerulonephritis globally and is characterized by
the deposition of polymeric IgA (predominantly of the IgA1
subclass) (2). The typical symptom
of IgAN is macroscopic hematuria associated with proteinuria
(3). The clinical course of the
disease has been established (4)
and 20–40% of patients with IgAN are likely to develop an end-stage
renal disease within 25 years of diagnosis. Thus far, glomerular
diseases are diagnosed by clinical manifestations, urinalysis,
clinical chemistry tests and renal histopathology. The diagnosis
mainly depends on a kidney biopsy, which is an invasive technique
that has a low risk of bleeding and complications that are not
often repeated in the same patient. Therefore, the development of
non-invasive diagnostic tools would be a significant progression
for patients with IgAN and other glomerular diseases (5,6).
Isobaric tags for relative and absolute
quantification (iTRAQ) reagents, including a peptide reactive
group, and are used for reporting group analysis and a molecular
mass balance (7). The technology is
usually applied to the identification of protein biomarkers in
glomerular diseases, including two-dimensional gel electrophoresis,
two-dimensional difference gel electrophoresis, surface-enhanced
laser desorption/ionization time-of-flight (TOF) mass spectrometry
(MS) and capillary electrophoresis-MS. Quantitative proteomics is
an important branch of proteomics research as it is used to
quantify and identify all the protein expressed in a whole genome
or in a complex mixture. iTRAQ was originally developed by Applied
Biosystems, Inc., (Foster City, CA, USA) in 2004. The iTRAQ reagent
consists of a peptide reactive group and the reporter group is used
to analyze the molecular mass balance. This unique approach labels
samples with eight independent isobaric tags, and the eight unique
reporter ions (m/z from 113–121) provide quantitative information
following integration of the peak areas, which quantifies the eight
different samples (8,9).
iTRAQ quantification has been previously applied in
biomarker studies of various disease states, including prostate
(10), ovarian (11) and gastric cancers (12). Currently, there are limited studies
on the adoption of IgAN by iTRAQ technology. In the present study,
iTRAQ technology was used to analyze the total proteins of the
renal tissue from patients with IgAN, which may help to improve the
understanding of the pathogenesis, diagnosis and treatment for
IgAN.
Materials and methods
IgAN and control groups
Between March and August 2012, renal tissue was
collected from eight IgAN patients from the 181st Hospital (Guilin,
China), subsequent to obtaining consent from all patients. The IgAN
patients were biopsy-diagnosed and the control group consisted of
four patients with no clinical evidence of IgAN. The study was
performed according to the guidelines established by the 181st
Hospital, which abides by the Helsinki Declaration on ethical
principles for medical research involving human subjects. Written
informed consent was obtained from all subjects or their
guardians.
Sample preparation
Nine biopsies were collected from the IgAN patients
and control group, which were immediately washed with 0.9%
RNase-free NaCl and dipped briefly in RNase inhibitor (Epicentre
Biotechnologies, Madison, WI, USA) according to the manufacturer’s
instructions. The samples were subsequently stored at −80°C for
further analysis.
Protein extraction and
quantification
Following the collection of the renal tissue (250
mg) from the IgAN patients and control group, the tissue was ground
into a fine powder in liquid nitrogen and supplemented with acetone
followed by 10% trichloroacetic acid in acetone for 2 h at −20°C.
Total protein was extracted with extraction buffer [8 M urea, 4%
3-[(3-cholamidopropyl)dimethylammonio]-1-propanesulfonate, 40
mmol/l Tris-HCl, 1 mmol/l phenylmethanesulfonyl fluoride, 2 mmol/l
EDTA, 10 mmol/l dithiothreitol and 0.5–2% isotonic glucose
phosphate buffer (pH 8.5)] and subjected to centrifugation at
40,000 × g for 1 h at 10°C. The protein concentration of the
supernatant was determined using the bicinchoninic acid protein
assay kit (Pierce Biotechnology, Inc., Rockford, IL, USA) according
to the manufacturer’s instructions.
iTRAQ reagent labeling, strong cation
exchange (SCX) fractionation and tandem MS (MS/MS)
The protein was pooled for each group and
subsequently blocked, digested and labeled according to the iTRAQ
protocol (Applied Biosystems, Inc.). The iTRAQ tags were healthy
control-iTRAQ 113 and IgAN-iTRAQ 119. The labeled digests were
subsequently combined into one sample mixture.
Multidimensional liquid chromatography was performed
to separate the tryptic peptides prior to MS. The combined samples
were separated into 10 SCX fractions using a 3.5 μm particle size
coluIgAN (35×0.3 mm, 300 Å, Zorbax Bio-SCX, Santa Clara, CA, USA),
with a potassium formate gradient in 25% acetonitrile. The peptides
in these fractions were then separated on a Tempo™LC Nanoflow and
matrix-assisted laser desorption/ionization (MALDI) spotting system
equipped with a reversed-phase Magic C18AQ coluIgAN. Each
chromatography run yielded ~380 MALDI spots on a stainless steel
MALDI target plate Agilent 1290 Infinity (2D-LC) (Santa Clara, CA,
USA) (13).
MS data were obtained using an Applied Biosystems
4800 Plus MALDI TOF/TOF. Signal-to-noise ratios of ≥40 were
required for the MS/MS spectra. The mass spectra from 500 laser
shots were obtained for each spot. The MS/MS data from all 10
fractions were combined and subsequently analyzed using the Paragon
Algorithm search engine and Human v3.62 downloaded from the EBI
website (http://www.ebi.ac) (13).
Statistical analysis and gene ontology
(GO) analysis
The threshold used for protein identification was a
ProtScore >1.3 (95%) with at least more than one peptide above
the 95% confidence level. Proteins yielding tryptic peptides with
average reporter ion ratios between ≥1.5 and ≤0.67 were classified
as up- and downregulated, respectively. The GO database annotates
selected proteins according to molecular function (MF), cellular
component (CC) and biological process (BP). To investigate the
functions of the identified proteins, the online GO tool WEGO (Web
Gene Ontology Annotation Plot; http://wego.genomics.org.cn/) was used. P<0.05 was
considered to indicate a statistically significant difference.
Results
Protein identification
Using a confidence interval of >95% (P<0.05)
with peptides >1 as the cutoff, a total of 1,860 proteins were
identified and quantified from renal tissues. There were 24
proteins that had a fold change difference of >1.5, with 12
upregulated and 12 downregulated (Tables I and II, respectively). The MF, CC and BP of
the proteins are shown in Tables I
and II.
 | Table IUpregulated proteins in renal tissue
of immunoglobulin A (IgA) nephropathy patients. |
Table I
Upregulated proteins in renal tissue
of immunoglobulin A (IgA) nephropathy patients.
| No. | Accession no. | Protein name | Molecular
function | Cellular
component | Biological
process | Peptides | Ratio |
|---|
| 1 | sp|P09493 | Isoform TPM1κ of
tropomyosin α-1 chain | Structural
constituent of cytoskeleton | Intracellular
organelle | Establishment of
localization, transport | 31 | 3.35 |
| 2 | sp|P61769 |
β-2-microglobulin | Protein binding | Organelle | Immune response | 4 | 2.99 |
| 3 | sp|P68133 | Actin, α skeletal
muscle | Nucleoside
binding | Intracellular
organelle | Regulation of
biological quality | 122 | 2.76 |
| 4 | sp|Q9NZP8 | Complement C1r
subcomponent-like protein | Hydrolase
activity | Extracellular
region | Immune response | 1 | 2.58 |
| 5 | sp|P04083 | Annexin A1 | Lipid binding | Intracellular | Transport | 14 | 2.56 |
| 6 | sp|P04075 | Fructose-
bisphosphate aldolase A | Lyase activity | Non-membrane- bound
organelle | Regulation of
biological quality | 36 | 2.38 |
| 7 | sp|P62328 | Thymosin β-4 | Protein binding | Intracellular
organelle | Regulation of
cellular component organization | 7 | 1.91 |
| 8 | sp|P09493 | Isoform TPM1κ of
tropomyosin α-1 chain | Structural
constituent of muscle | Organelle | Establishment of
localization | 31 | 3.35 |
| 9 | sp|P01011 |
α-1-antichymotrypsin | Protein binding | Intracellular | Regulation of
biological quality | 12 | 1.58 |
| 10 | sp|P05156 | Complement factor
I | Hydrolase
activity | Extracellular
region | Response to external
stimulus | 3 | 1.56 |
| 11 | sp|P98160 | Basement membrane-
specific heparan sulfate proteoglycan core protein | Protein binding | Extracellular
region | Extracellular
structure organization | 48 | 1.56 |
| 12 | sp|P08238 | HSP 90-β | Nucleotide
binding | Vesicle | Response to chemical
stimulus | 30 | 1.53 |
| Table IIDownregulated proteins in renal tissue
of immunoglobulin A (IgA) nephropathy patients. |
Table II
Downregulated proteins in renal tissue
of immunoglobulin A (IgA) nephropathy patients.
| No. | Accession no. | Protein name | Molecular
function | Cellular
component | Biological
process | Peptides | Ratio |
|---|
| 1 | sp|P09669 | Cytochrome c
oxidase subunit 6C | Oxidoreductase
activity | Membrane- bound
organelle | Cellular metabolic
process | 3 | 0.62 |
| 2 | sp|P00403 | Cytochrome c
oxidase subunit 2 | Oxidoreductase
activity | Organelle
membrane | Oxidation
reduction | 6 | 0.56 |
| 3 | sp|P51649 | Succinate-
semialdehyde dehydrogenase, mitochondrial | Oxidoreductase
activity | Cell fraction | Oxidation
reduction | 4 | 0.55 |
| 4 | sp|P10809 | 60 kDa heat shock
protein, mitochondrial | Nucleotide
binding | Organelle
lumen | Positive regulation
of immune system process | 47 | 0.53 |
| 5 | sp|P62195 | 26S protease
regulatory subunit 8 | Nucleoside
binding | Protein
complex | Catabolic
process | 1 | 0.50 |
| 6 | sp|P05091 | Aldehyde
dehydrogenase, mitochondrial | Oxidoreductase
activity | Organelle
lumen | Oxidation
reduction | 28 | 0.47 |
| 7 | sp|P01031 | Complement C5 | Protein
binding | Protein
complex | Cellular metabolic
process | 4 | 0.45 |
| 8 | sp|P30837 | Aldehyde
dehydrogenase X, mitochondrial | Oxidoreductase
activity | Intracellular | Oxidation
reduction | 7 | 0.44 |
| 9 | sp|P61604 | 10 kDa heat shock
protein, mitochondrial | Nucleotide
binding | Intracellular
organelle | Response to
chemical stimulus | 11 | 0.36 |
| 10 | sp|P02753 | Retinol-binding
protein 4 | Lipid binding | Extracellular
region | Response to
external stimulus | 11 | 0.36 |
| 11 | sp|P00966 | Argininosuccinate
synthase | Nucleoside
binding | Intracellular | Cellular metabolic
process | 21 | 0.36 |
| 12 | sp|P05062 | Fructose-
bisphosphate aldolase B | Lyase activity | Non-membrane- bound
organelle | Catabolic
process | 53 | 0.25 |
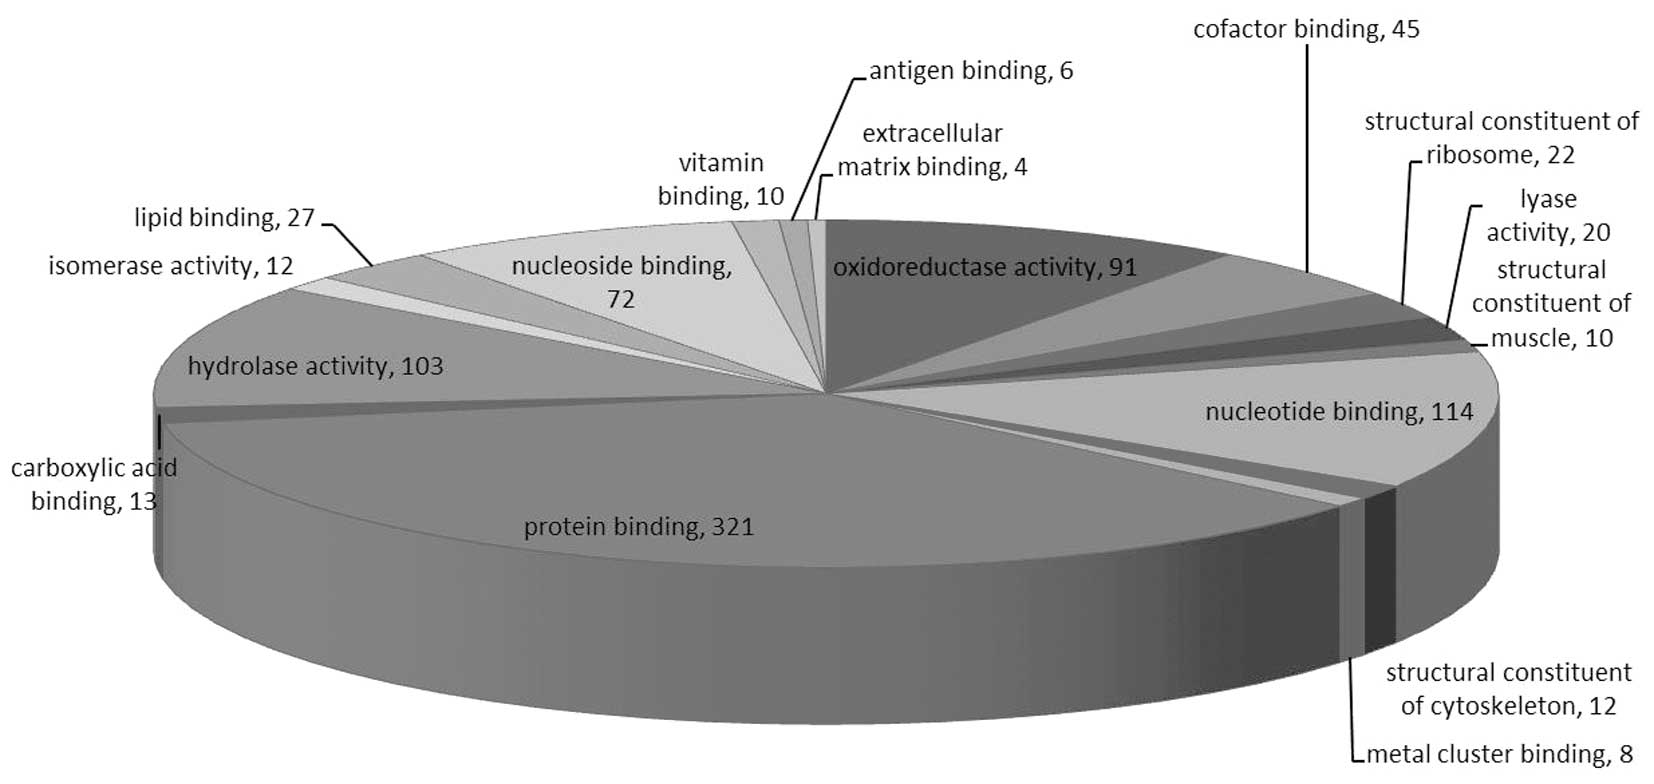
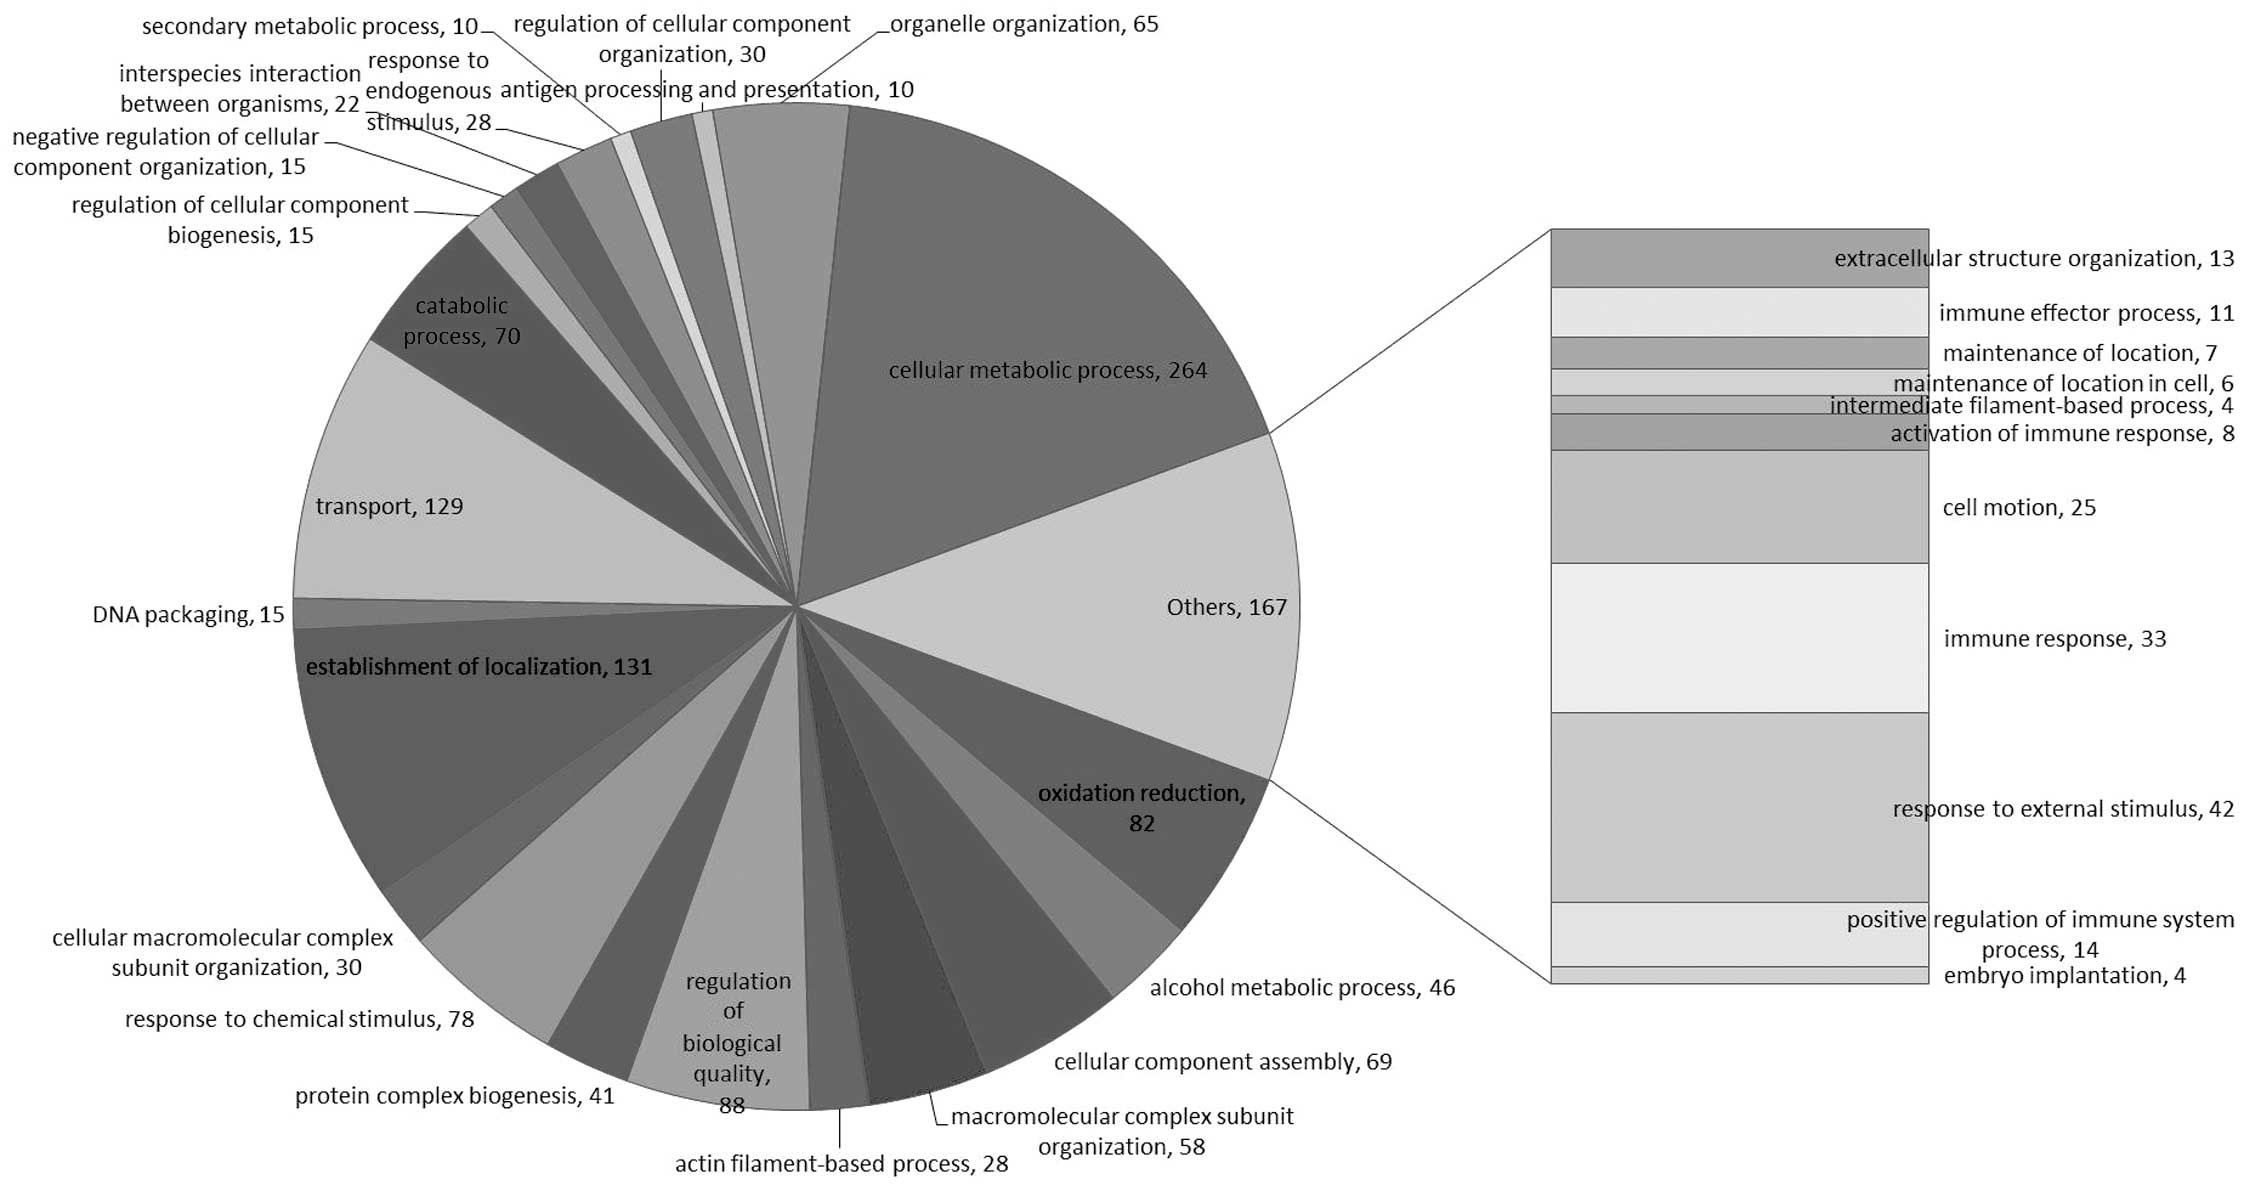
These proteins were linked to the GO MF, CC and BP
categories (Figs. 1–3). According to the GO database, the
differentially-expressed proteins were divided into MF, CC and BP.
The top five components for MF, CC and BP of these proteins are
shown in Table III. The top five
components for MF were protein binding, nucleotide binding,
hydrolase activity, oxidoreductase activity and nucleoside binding.
For the upregulated proteins, protein binding exhibited a
significant change (Table I) and in
the downregulated proteins oxidoreductase activity changed
significantly (Table III).
Notably, oxidoreductase activity was reported for numerous
proteins.
| Table IIITop five components for molecular
function, cellular component and biological process. |
Table III
Top five components for molecular
function, cellular component and biological process.
| Molecular
function | Count, n | % | Cellular
component | Count, n | % | Biological
process | Count, n | % |
|---|
| Protein
binding | 321 | 57.12 | Intracellular | 464 | 82.56 | Cellular metabolic
process | 264 | 46.98 |
| Nucleotide
binding | 114 | 20.28 | Intracellular | 462 | 82.21 | Establishment of
localization | 131 | 23.31 |
| Hydrolase
activity | 103 | 18.33 | Intracellular
organelle | 374 | 66.55 | Transport | 129 | 22.95 |
| Oxidoreductase
activity | 91 | 16.19 | Membrane- bound
organelle | 310 | 55.16 | Regulation of
biological quality | 88 | 15.66 |
| Nucleoside
binding | 72 | 12.81 | Organelle | 230 | 40.93 | Oxidation
reduction | 82 | 14.59 |
Discussion
The development of quantitative proteomics has
significantly improved the capacity of proteomic methods for
assessing the expression, modification and function of protein
markers. The iTRAQ has been indicated to be appropriate for the
detection of biomarkers and it also allows the simultaneous
comparison of protein abundance by measuring the peak intensities
of the reporter ions that are released from the iTRAQ-tagged
peptides. Therefore, it may be a potential tool for identifying
biomarkers (14). Thus, iTRAQ
technology was applied in the present study, as well as GO
analysis, to quantitatively analyze the renal tissue proteome of
IgAN patients and healthy controls. In total, 1,860 proteins were
identified via GO analysis, involving MF, CC and BP (Table III). A general proteome database
was constructed for the renal tissues proteome, and to the best of
our knownledge, this database has not been previously reported.
The up- and downregulated proteins in the renal
tissue of IgAN patients are shown in Tables I and II. Among them, there was significant
deviation of five proteins [β-2-microglobulin, annexin A1,
complement C5, retinol-binding protein 4 (RBP4) and
argininosuccinate synthase], which are known to potentially
participate in IgAN and certain glomerular diseases (15–18).
The present study provides additional evidence that iTRAQ
technology accurately quantifies the relative changes in the
protein abundance of renal tissue. The renal tissue proteome
pathology diagnosis or utility are at the initial stages of
assessment and require further study.
Certain differentially expressed proteins have
previously been shown to play important roles in the pathogenesis
of IgAN. For example, β-2-microglobulin is a component of the class
I major histocompatibility complex and it is involved in the
presentation of peptide antigens to the immune system. This protein
has numerous functions, including response to chemical stimulus,
antigen processing and presentation, and immune response. The
binding of β-2-microglobulin to the low molecular weight protein
antigens on the human leukocyte antigen heavy chain has a structure
that is similar to immunoglobulin. In particular, the immune
reactions stimulate β-2-microglobulin release and studies have
shown that the β-2-microglobulin concentration is associated with
the severity of IgAN (19,20). Notably, in the present study,
β-2-microglobulin was found to be highly expressed in IgAN compared
to healthy controls.
RBP4 from the liver is stored in the peripheral
tissues. Loss of the RBP-retinol complex by filtration through the
kidney glomeruli can be inhibited by its interaction with
transthyretin (21). A previous
study has reported that the presence of RBP4 in the early diagnosis
of injury in glomerular disease is more sensitive than
β-2-microglobulin and microalbumin (22). RBP4, as a rather sensitive
indicator, also exists in the urine of patients and predates the
emergence of microalbumin (23). In
the present study, significant differentially expressed RBP4 is
expected to be a potential marker of IgAN.
Certain novel candidates, including annexin A1,
aldehyde dehydrogenase and complement C5, have been confirmed.
These candidates are relevant to other associated diseases, the
apoptotic pathway and synthetic substances in tissues (24–26).
However, the development of these in the process of IgAN are
completely undetermined, and therefore, these novel candidates
require further investigation.
In conclusion, iTRAQ is a novel strategy for
proteomic analysis. The aim of this initial study focuses on the
comparison of the protein of IgAN patients and healthy controls
using iTRAQ technology. A total of 1,860 proteins were
differentially expressed in the kidney tissue of IgAN patients
compared to the control group. However, the study did not discuss
each of the candidate proteins in detail and only assessed certain
IgAN-biomarker candidates that were notable. Two proteins
(β-2-microglobulin and RBP4) were identified as potential
biomarkers, but they require verification in future studies, which
may develop a novel technique for the diagnosis of IgAN.
Acknowledgements
The authors would like to thank the patients and
healthy volunteers who participated in the present study. The study
was supported by the Guangxi Key Laboratory of Construction Project
Plan (grant no. 13-051-31), the Guangxi Science and Technology Plan
(Department of Guangxi; grant no. 10124001B-27) and the Guilin City
Science and Technology Plan of Science and Technology Innovation
Ability and Condition Construction (grant no. 20130121-6).
References
|
1
|
Matousovic K, Konecný K, Mĕstecký J, et
al: IgA nephropathy. Significance of immunoglobulin A glycosylation
in pathogenesis and clinical presentation. Cas Lek Cesk.
141:729–734. 2002.(In Czech).
|
|
2
|
Barratt J, Smith AC, Molyneux K and
Feehally J: Immunopathogenesis of IgAN. Semin Immunopathol.
29:427–443. 2007. View Article : Google Scholar
|
|
3
|
Coppo R and Amore A: Aberrant
glycosylation in IgA nephropathy (IgAN). Kidney Int. 65:1544–1547.
2004. View Article : Google Scholar : PubMed/NCBI
|
|
4
|
Galla JH: IgA nephropathy. Kidney Int.
47:377–387. 1995. View Article : Google Scholar
|
|
5
|
Yu HH and Chiang BL: Diagnosis and
classification of IgA nephropathy. Autoimmun Rev. 13:556–559. 2014.
View Article : Google Scholar : PubMed/NCBI
|
|
6
|
He L, Liu H and Peng Y: Immune
pathogenesis of IgA nephropathy and its drugable targets. Zhong Nan
Da Xue Xue Bao Yi Xue Ban. 39:96–101. 2014.(In Chinese).
|
|
7
|
Jones AM and Nühse TS: Phosphoproteomics
using iTRAQ. Methods Mol Biol. 779:287–302. 2011. View Article : Google Scholar
|
|
8
|
Desouza LV, Voisin SN and Siu KW:
iTRAQ-labeling for biomarker discovery. Methods Mol Biol.
1002:105–114. 2013. View Article : Google Scholar : PubMed/NCBI
|
|
9
|
Unwin RD: Quantification of proteins by
iTRAQ. Methods Mol Biol. 658:205–215. 2010. View Article : Google Scholar : PubMed/NCBI
|
|
10
|
Glen A, Gan CS, Hamdy FC, et al:
iTRAQ-facilitated proteomic analysis of human prostate cancer cells
identifies proteins associated with progression. J Proteome Res.
7:897–907. 2008. View Article : Google Scholar : PubMed/NCBI
|
|
11
|
Wang LN, Tong SW, Hu HD, et al:
Quantitative proteome analysis of ovarian cancer tissues using a
iTRAQ approach. J Cell Biochem. 113:3762–3772. 2012. View Article : Google Scholar : PubMed/NCBI
|
|
12
|
Loei H, Tan HT, Lim TK, et al: Mining the
gastric cancer secretome: identification of GRN as a potential
diagnostic marker for early gastric cancer. J Proteome Res.
11:1759–1772. 2012. View Article : Google Scholar : PubMed/NCBI
|
|
13
|
Wang L, Dai Y, Qi S, Sun B, Wen J, Zhang L
and Tu Z: Comparative proteome analysis of peripheral blood
mononuclear cells in systemic lupus erythematosus with iTRAQ
quantitative proteomics. Rheumatol Int. 32:585–593. 2012.
View Article : Google Scholar : PubMed/NCBI
|
|
14
|
Chong PK, Lee H, Zhou J, et al: ITIH3 is a
potential biomarker for early detection of gastric cancer. J
Proteome Res. 9:3671–3679. 2010. View Article : Google Scholar : PubMed/NCBI
|
|
15
|
Wiela-Hojeńska A and Hurkacz M: The
significance of beta 2-microglobulin in diagnosis and therapy.
Postepy Hig Med Dosw. 52:507–514. 1998.(In Polish).
|
|
16
|
Sui W, Tang D, Zou T, et al: Differential
proteomic analysis of renal tissue in mesangial proliferative
glomerulonephritis using iTRAQ technology. J Nephrol. 26:191–198.
2013. View Article : Google Scholar
|
|
17
|
Puri TS and Quigg RJ: The many effects of
complement C3- and C5-binding proteins in renal injury. Semin
Nephrol. 27:321–337. 2007. View Article : Google Scholar : PubMed/NCBI
|
|
18
|
Cabré A, Lázaro I, Girona J, et al:
Retinol-binding protein 4 as a plasma biomarker of renal
dysfunction and cardiovascular disease in type 2 diabetes. J Intern
Med. 262:496–503. 2007.PubMed/NCBI
|
|
19
|
Peters HP, van den Brand JA and Wetzels
JF: Urinary excretion of low-molecular-weight proteins as
prognostic markers in IgA nephropathy. Neth J Med. 67:54–61.
2009.PubMed/NCBI
|
|
20
|
Nitta K, Tsutsui T, Ozu H, et al: Beta
2-microglobulin as an indicator of interstitial cell infiltration
in IgA nephropathy. Nephron. 74:219–220. 1996. View Article : Google Scholar : PubMed/NCBI
|
|
21
|
Sun L, Qi Q, Zong G, et al: Elevated
plasma retinol-binding protein 4 is associated with increased risk
of type 2 diabetes in middle-aged and elderly Chinese adults. J
Nutr. 144:722–728. 2014. View Article : Google Scholar : PubMed/NCBI
|
|
22
|
Baboolal K and Meyer TW: The effect of
acute angiotensin II blockade on renal function in rats with
reduced renal mass. Kidney Int. 46:980–985. 1994. View Article : Google Scholar : PubMed/NCBI
|
|
23
|
Koch A, Weiskirchen R, Sanson E, et al:
Circulating retinol binding protein 4 in critically ill patients
before specific treatment: prognostic impact and correlation with
organ function, metabolism and inflammation. Crit Care.
14:R1792010. View
Article : Google Scholar
|
|
24
|
Bizzarro V, Fontanella B, Franceschelli S,
et al: Role of Annexin A1 in mouse myoblast cell differentiation. J
Cell Physiol. 224:757–765. 2010. View Article : Google Scholar : PubMed/NCBI
|
|
25
|
Feng T, Cong Y, Qin H, et al: Generation
of mucosal dendritic cells from bone marrow reveals a critical role
of retinoic acid. J Immunol. 185:5915–5925. 2010. View Article : Google Scholar : PubMed/NCBI
|
|
26
|
Onda K, Ohi H, Tamano M, et al:
Hypercomplementemia in adult patients with IgA nephropathy. J Clin
Lab Anal. 21:77–84. 2007. View Article : Google Scholar : PubMed/NCBI
|