Introduction
In 2016, 227,000 fatalities and 330,000 new cases of
central nervous system cancers were reported worldwide (1). Gliomas, which have a high level of
heterogeneity and diverse origins, are the most frequently
diagnosed primary brain tumors, accounting for 80% of malignant
primary tumors in the central nervous system (2). Current standard treatment includes
surgical resection, followed by radiotherapy and chemotherapy
(3). In the USA, the adjuvant
carmustine, a nitrosourea drug, is commonly prescribed (4–6);
however, patients with malignant glioma continue to have a poor
overall prognosis owing to the high mortality rates (7) and debilitating symptoms. Glioma has
been histologically classified from low to high grades by the World
Health Organization (WHO) (8–10).
Despite substantial research and the use of a combination of
standard therapies, the median survival for patients is still only
14–24 months, with ~10% chance of surviving for 5 years (4,11).
Therefore, novel therapeutic strategies are urgently needed.
Studies on therapeutic approaches targeting the tumor
microenvironment have created new treatment strategies (12). Low-grade gliomas, anaplastic gliomas
and glioblastomas have median overall survival (OS) durations of
78.1, 37.6 and 14.4 months, respectively (13). Consequently, prognostic indicators
have been investigated to predict patient survival and
responsiveness to personalized treatment (14).
Hypoxia-inducible factors (HIFs) belong to a family
of DNA-binding transcription factors called basic
helix-loop-helix/Per-ARNT-Sim (15). HIF1 is a heterodimeric transcription
factor comprising two subunits, HIF1α and HIF1β, each with unique
functions (16). HIF1α is an
important regulator of gene expression associated with the cellular
response to hypoxia (17,18). However, HIF1α promotes
carcinogenesis and is a common cancer treatment target (19,20).
Notably, HIF1α upregulation enhances the development of certain
tumors, including gliomas, breast cancer and prostate cancer,
whereas its downregulation inhibits tumor growth (21). The tumor microenvironment, which is
crucial for the development, angiogenesis and migration of tumors,
has immunosuppressive properties (22). Gliomas actively recruit immune cells
by releasing chemokines (23,24)
and after entering the tumor environment, immune cells are
regulated by immunomodulatory cytokines and molecules, such as
TGF-β1 (25). Therefore,
tumor-specific immunity is suppressed, while tumor development is
promoted by the recruitment of peripheral immune cells into tumors.
HIF1α signaling in cancer cells recruits immunosuppressive cells by
secreting modulators, thus promoting tumor progression (26). Considering the close association
between HIF1α and immune cells, alterations in HIF1α may influence
the progression and prognosis of glioma by regulating the level of
infiltrating immune cells. However, the relationship between HIF1α
and new immune-infiltrating cells needs to be further explored.
Therefore, the present study aimed to investigate
the potential role of HIF1α and explore the association between
HIF1α and new infiltrating immune cells in gliomas.
Materials and methods
Data extraction and preprocessing
RNA sequencing data were collected from The Cancer
Genome Atlas (TCGA)-glioblastoma multiforme (GBM) and
TCGA-low-grade glioma (LGG) projects using the Genomic Data Commons
Data Portal (https://portal.gdc.cancer.gov) and the Genotype-Tissue
Expression (GTEx) databases (http://www.Gtexportal.org/home/) in the transcripts
per million format for pan-cancer research. From the TCGA database,
data levels 3 HTSeq-FPKM and HTSeq-Count data for GMB/LGG were
extracted. The publication requirements of TCGA and GTEx were
rigorously adhered to.
Differential expression gene
analysis
In the GBM/LGG data, the median HIF1α expression was
used as the cutoff value (HTSeq-Count) to distinguish
differentially expressed genes (DEGs) between groups with low and
high HIF1α expression. An unpaired student's t-test was conducted
using the DESeq2 package in R (version 4.3.0) (27).
Pathological specimen selection
A total of 20 paired paraffin-embedded normal tissue
samples and glioma specimens were obtained from the Pathology
Department of the First Affiliated Hospital of Nanchang University
(Nanchang, China). Informed consent was obtained from all patients
and ethical approval was obtained from The Medical Ethics Committee
of the First Affiliated Hospital of Nanchang University [approval
no. (2023)CDYFYYLK(01–018)].
Immunohistochemistry
Immunohistochemical (IHC) staining was used to
assess the expression levels of HIF1α in paraffin-embedded tissues
obtained from patients with glioma. The tissue samples were
subjected to fixation using 4% paraformaldehyde for 24 h at room
temperature. Following fixation, the samples were dehydrated
through a graded series of alcohol, were subsequently embedded in
paraffin, and finally sectioned into 4-µm serial sections. Tissue
slides were deparaffinized at 60°C, and then treated with 100%
xylene for 20 min before being rehydrated in a graded series of
ethanol at room temperature. Antigen retrieval was conducted in a
water bath with 100 ml ethylenediaminetetraacetic acid retrieval
buffer (OriGene Technologies, Inc.), at 95°C, and the sections were
then treated with 3% hydrogen peroxide to eliminate endogenous
peroxidase for 10 min. Subsequently, the sections were blocked with
5% normal goat serum (cat. no. SL038; Beijing Solarbio Science
& Technology Co., Ltd.) at 37°C for 30 min. The sections were
incubated with anti-HIF1α primary antibodies (1:500; cat. no.
20960-1-AP; Proteintech) overnight at 4°C, followed by incubation
with enzyme-labeled Goat Anti-Mouse/Rabbit secondary antibodies
(1:100; cat. no. PV-6000D; Beijing Zhongshan Jinqiao Biotechnology
Co., Ltd.) at 37°C for 30 min. Staining was performed using
diamino-benzidine (cat. no. PV-6000D; Beijing Zhongshan Jinqiao
Biotechnology Co., Ltd.) for 3–5 min at room temperature [both the
secondary antibody and DAB were obtained from a kit (cat. no.
PV-6000D; Beijing Zhongshan Jinqiao Biotechnology Co., Ltd.)] and a
hematoxylin counterstain at room temperature for 20 sec. Brain
tissue sections that previously demonstrated positive
immunostaining were used as positive controls, whereas samples
without the primary antibody staining served as negative controls.
A light microscope (ZEISS Axio Lab. A1; CarlZeiss AG) was used to
acquire images at ×200 and ×400 magnifications. Three
representative fields of view were examined for each sample. ImageJ
Software (version 1.53; National Institutes of Health) was used to
determine the average optical density associated with positive
expression. The level of expression was evaluated on a scale
ranging from 0–7, where 0–2 indicated negative expression and 3–7
indicated positive expression. A score of 3–4 represented weak
positive expression and a score of 5–7 denoted strong positive
expression. Staining intensity was classified as follows: A score
of 0 for no staining, 1 for mild staining, 2 for moderate staining
and 3 for intense staining. The scoring for staining area was as
follows: A score of 0 for no staining, 1 for staining over 1–25% of
the area, 2 for staining over 26–50% of the area, 3 for staining
over 51–75% of the area and 4 for staining over 76–100% of the
area.
Functional enrichment analysis of
HIF1α-related DEGs
The functional enrichment analysis threshold for
DEGs was set at |log fold change (FC)|>2 with an adjusted
P-value (P adj) <0.05. The clusterProfiler package in R was used
to conduct Gene Ontology (GO) analysis, including molecular
functions (MFs), cellular components (CCs) and biological processes
(BPs) and Kyoto Encyclopedia of Genes and Genomes (KEGG) pathway
enrichment analysis (28,29).
Gene set enrichment analysis
The clusterProfiler R package was used to explore
functional and pathway differences between high- and
low-HIF1α expression groups (30). Statistical significance for
enrichment findings was set at a false discovery rate <0.25 and
a P adj <0.05.
Assessment of immune infiltration and
immune checkpoints
The single-sample gene set enrichment analysis
function in the GSVA R package (31) was used to evaluate HIF1α
immunological infiltrates reported in the literature and explore
the relationships between HIF1α expression and 24 distinct immune
cell subsets (32). The
relationships between HIF1α and immunological checkpoints, such as
programed cell death protein 1 (PDCD1), CD274, hepatitis A virus
cellular receptor 2 (HAVCR2), cytotoxic T-lymphocyte protein 4
(CTLA4), T-cell immunoreceptor with Ig and ITIM domains (TIGIT),
lymphocyte activation gene 3 protein (LAG-3) and CD48, were further
examined.
Prognostic analysis
Age, sex, WHO grade, isocitrate dehydrogenase 1
(IDH1) mutation status and 1p19q co-deletion status were applied as
clinicopathological characteristics in the Cox regression analysis
to evaluate the influence of physiological parameters on clinical
outcomes. Furthermore, the RMS and survival R packages were used to
produce calibration and nomogram plots to estimate the 1-, 3- and
5-year OS rates (33,34). The ability of the nomogram to
discriminate between groups was assessed using calibration,
receiver operating characteristic (ROC) curves and concordance
index methods (35).
Cell culture and cell
transfection
The human normal brain glial cell line HEB (cat. no.
C449) was acquired from mlbio (Shanghai Enzyme-linked Biotechnology
Co., Ltd.), and glioma cell lines U251 (cat. no. AW-CELLS-H0379)
and T98G (cat. no. AW-CELLS-H0365) were acquired from AnWei-sci.
The U-87 MG cell line is a glioblastoma of unknown origin (cat. no.
AW-CELLS-H0381) and was acquired from AnWei-sci. All cells were
cultured in high-glucose Dulbecco's modified Eagle's medium
(Beijing Solarbio Science & Technology Co., Ltd.) supplemented
with 10% fetal bovine serum (FBS; Gibco; Thermo Fisher Scientific,
Inc.) and 1% penicillin-streptomycin (Beijing Solarbio Science
& Technology Co., Ltd.) at 37°C and 5% CO2. All
small interfering RNAs (siRNAs), including a negative control
(si-NC) and those targeting HIF1α (si-HIF1α), were obtained from
HanBio Biotechnology Co., Ltd. The si-HIF1α (5 nM) and si-NC (5 nM)
were initially combined with Opti-MEM (Invitrogen; Thermo Fisher
Scientific, Inc.), and incubated for 5 min. Subsequently, this
mixture was co-incubated with Lipofectamine® 2000
(Invitrogen; Thermo Fisher Scientific, Inc.) for 20 min. The
resulting complex was then transfected into the T98G and U87 glioma
cell lines and maintained for 6 h at 37°C and the culture medium
was substituted with high-glucose DMEM containing 10% FBS. The
following functional experiments were carried out 24 h after
transfection. The siRNA sequences were as follows: si-NC sense,
5′-UUCUCCGAACGUGUCACGUTT-3′ and antisense,
5′-ACGUGACACGUUCGGAGAATT-3′; and si-HIF1α sense,
5′-GCCGAGGAAGAACUAUGAATT-3′ and antisense,
5′-UUCAUAGUUCUUCCUCGGCTT-3′.
Reverse transcription-quantitative PCR
(RT-qPCR)
The Total RNA Small Amount Extraction kit (Axygen;
Corning, Inc.) was used to lyse T98G or U87 cells and extract their
total RNA. Prime script RT Master mix (Takara Biotechnology Co.,
Ltd.) used to reverse transcribe the extracted RNA into cDNA
according to the manufacturer's protocol. HIF1α and GAPDH were
amplified using primers purchased from Sangon Biotech Co., Ltd.
SYBR Green Master Mix (Tiangen Biotech Co., Ltd.) was used for
RT-qPCR following the manufacturer's instructions. The
thermocycling conditions used for PCR were: Initial denaturation at
95°C for 10 min, followed by 40 cycles at 95°C for 15 sec and 60°C
for 60 sec. The 2−ΔΔCq method (36) was used to calculate the relative
mRNA expression levels. GAPDH was used as the endogenous control.
The primer sequences were as follows: HIF1α forward (F)
5′-GTGGTGGTTACTCAGCACTTT-3′ and reverse (R), 5′-
ATCTCCGTCCCTCAACCTCT-3′; and GAPDH F, 5′-AGGTCGGTGTGAACGGATTTG-3′
and R, 5′-GGGGTCGTTGATGGCAACA-3′.
Protein extraction and western
blotting
U87 cells (2×10⁵ cells/cm2)
and T98G cells (2×10⁵ cells/cm2) were lysed
using RIPA buffer (cat. no. P0013B; Beyotime Institute of
Biotechnology) and PMSF (Beyotime Institute of Biotechnology) with
phosphatase inhibitor (Beijing Solarbio Science & Technology
Co., Ltd.). The cell lysates were subsequently centrifuged at
15,000 × g for 15 min at 4°C to isolate the soluble proteins.
Proteins were extracted from both cell lysates and supernatants.
The BCA Protein Assay Kit (cat. no. P0012; Beyotime Institute of
Biotechnology) was used to evaluate the protein concentration of
cells. Proteins (20 µg/lane) were separated using 7.5% SDS-PAGE and
transferred to polyvinylidene fluoride membranes (Millipore Sigma).
The membranes were then blocked using 5% non-fat milk at room
temperature for 2 h, and washed with Trisbuffered saline with 0.1%
Tween 20 (TBST) and incubated with primary antibodies against HIF1α
(1:5,000; cat. no. 20960-1-AP; Wuhan Sanying Biotechnology) and
GAPDH (1:20,000; cat. no. 10494-1-AP; Wuhan Sanying Biotechnology)
at 4°C overnight. After the wash with TBST and incubation with goat
anti-rabbit IgG (1:10,000; cat. no. BS13278; BioWorld Technology,
Inc.) and goat anti-mouse IgG (1:10,000; cat. no. BS12478; BioWorld
Technology, Inc.) for 1 h at 25°C, ECL western blotting substrate
(Beijing Solarbio Science & Technology Co., Ltd.) was added to
visualize the protein bands using the ChemiDoc XRS molecular imager
system (Bio-Rad Laboratories, Inc.). Densitometry was analyzed
using ImageJ Software (version 1.53; National Institutes of
Health).
Cell Counting Kit-8 (CCK-8) assay
Cell proliferation was investigated using the CCK-8
assay (BIOSS). T98G and U87 cells were transfected with either
si-HIF1α or si-NC at 37°C and 5% CO2 for 2 days.
Subsequently, cells were transferred to 96-well plates
(~2×10³ cells/well) and cultured for 1, 2, 3 or 4 days
under standard conditions. Cells were incubated with CCK-8 for 2 h
and the optical density (450 nm) of each sample was measured using
a microplate reader (SpectraMax i3X; Molecular Devices, LLC).
Transwell assay
The upper chamber in the Transwell plate (pore size,
8 µm; Corning Inc.) was filled with 200 µl of serum-free medium and
3×10⁴ transfected T98G or U87 cells. Thereafter, 600 µl
of complete medium with 5% FBS was added to the lower chamber.
After the cells were incubated at 37°C in 5% CO2 for 48
h, the Transwell insert was removed and the cells on the upper
surface of the membrane were cleared. Cells on the lower surface of
the membrane were fixed with 4% paraformaldehyde at room
temperature for 30 min, stained with 0.1% crystal violet (Beijing
Solarbio Science & Technology Co., Ltd.) at room temperature
for 20 min and Images were captured using a light microscope (ZEISS
Axio Lab. A1; Carl Zeiss AG) and counted with ImageJ Software
(version 1.53; National Institutes of Health).
Statistical analysis
The present study used GraphPad Prism (version
9.3.0; Dotmatics) and R software (version 4.2.1; http://cran.r-project.org/) for conducting all
statistical analyses. The Wilcoxon rank-sum test was used for cases
where normality tests were not met, while an unpaired Student's
t-test was used to assess differences between the two groups when
normality tests were satisfied. The Kruskal-Wallis test, a
non-parametric test, and one-way ANOVA, a parametric test, were
used to compare data across various groups. For ANOVA, a post hoc
test (Dunnett's test) was performed if the findings were considered
significant, and for the Kruskal-Wallis test, a Dunn's test was
utilized. The association between HIF1α expression levels and
glioma clinicopathological characteristics was examined using the
chi-square test. Kaplan-Meier survival analysis and log-rank tests
were used to determine survival distributions. The IHC score was
analyzed by a Wilcoxon signed-rank test. The 95% confidence
intervals (CIs) and hazard ratios (HRs) for various clinical
characteristics were assessed using Cox regression analysis, which
identified independent prognostic factors. P<0.05 was considered
to indicate a statistically significant difference.
Results
Increased HIF1α expression levels were
observed in GBM/LGG
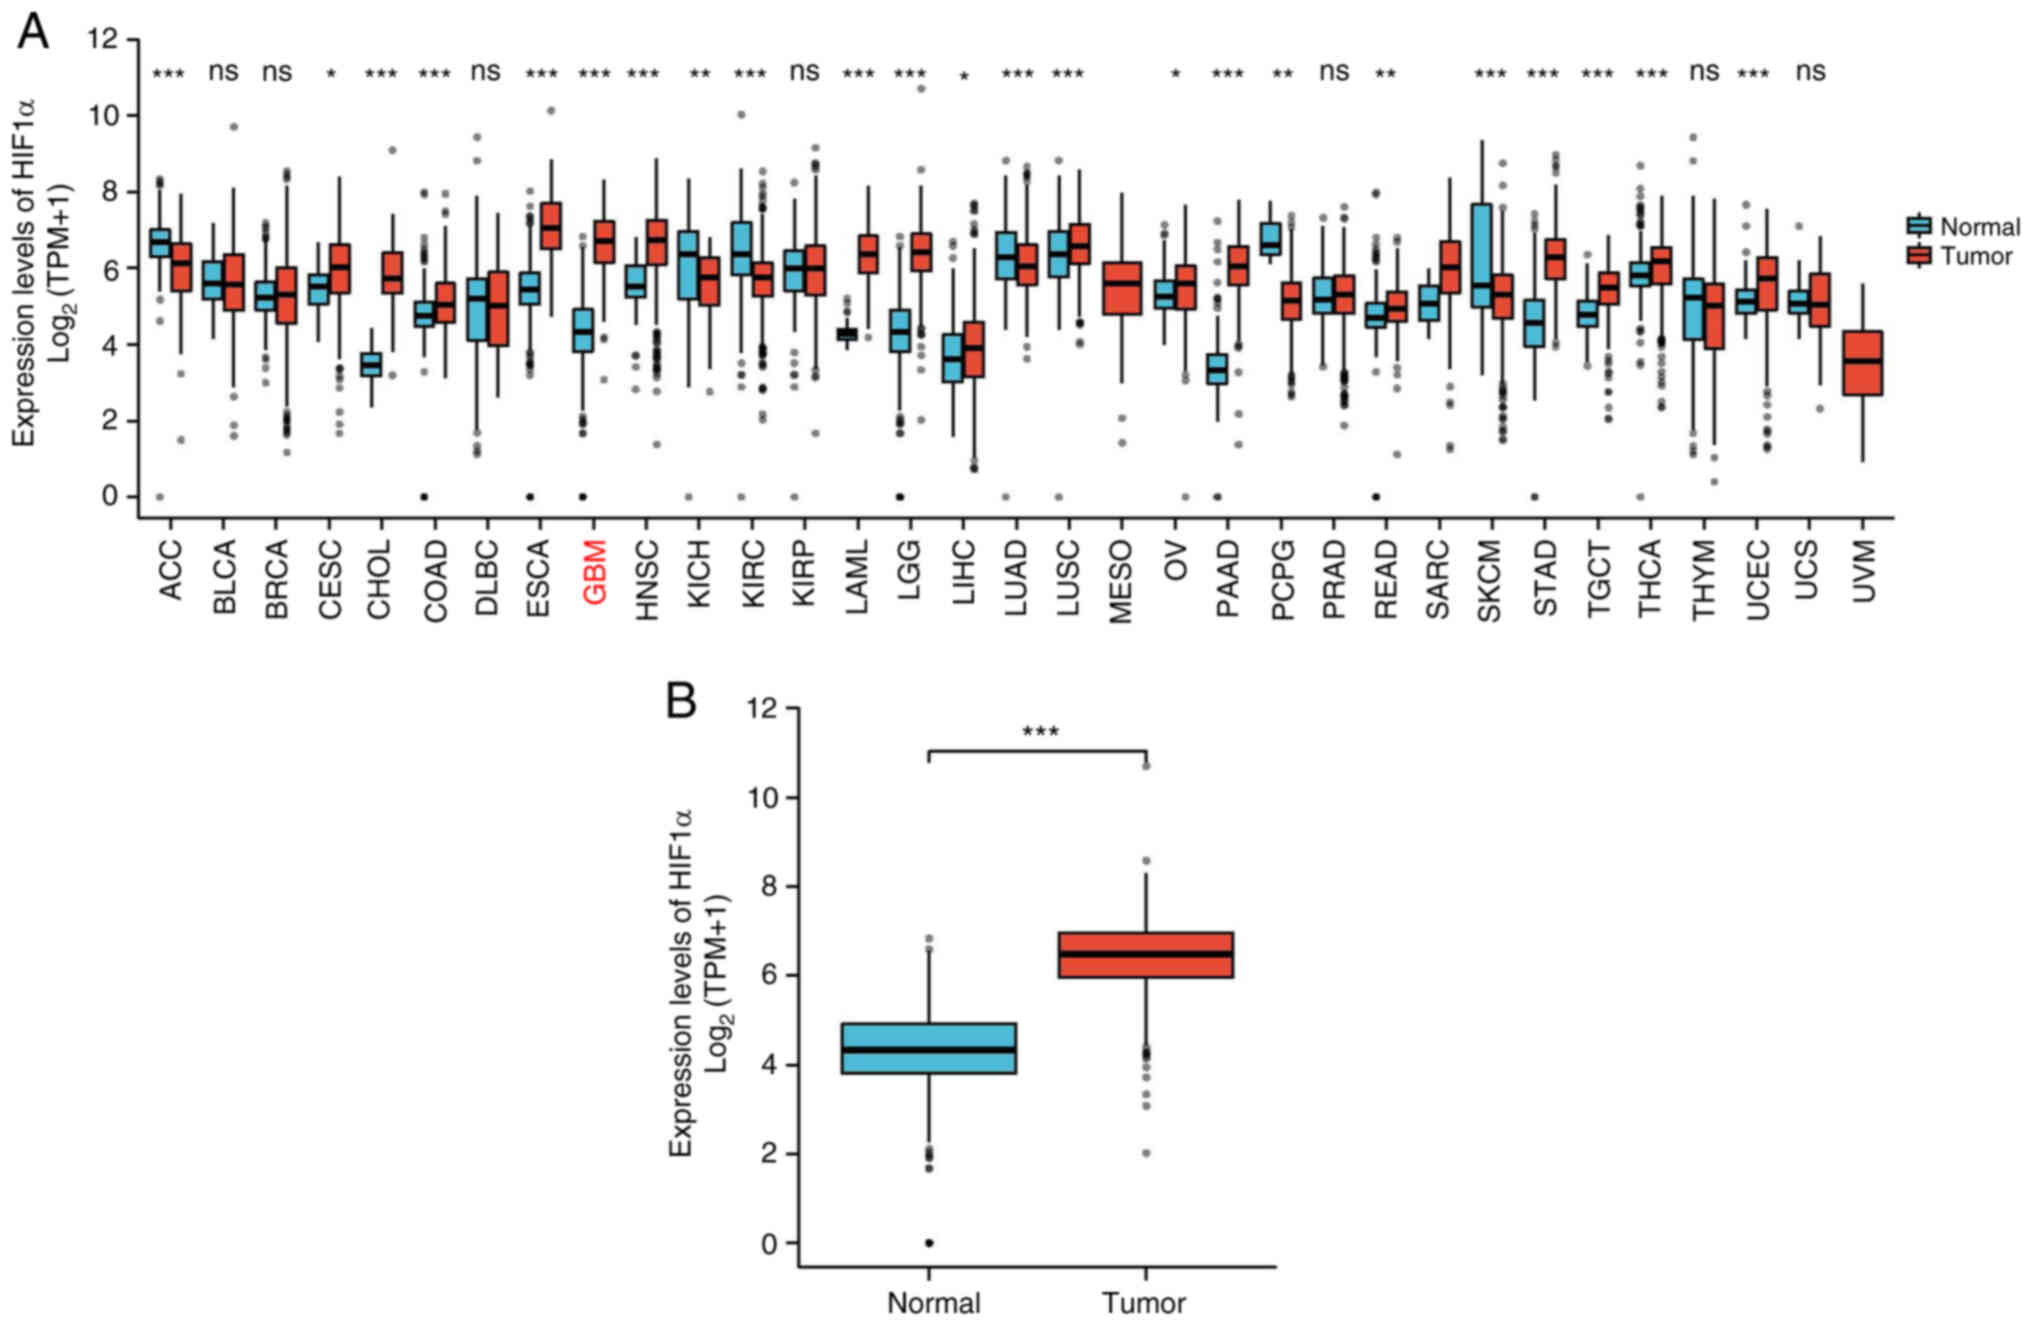
Comparisons of HIF1α expression in tumor samples and
healthy tissues from TCGA and GTEx datasets showed that most tumor
types exhibited significant upregulation of HIF1α expression
(Fig. 1A), including GBM and LGG
(P<0.001; Fig. 1B).
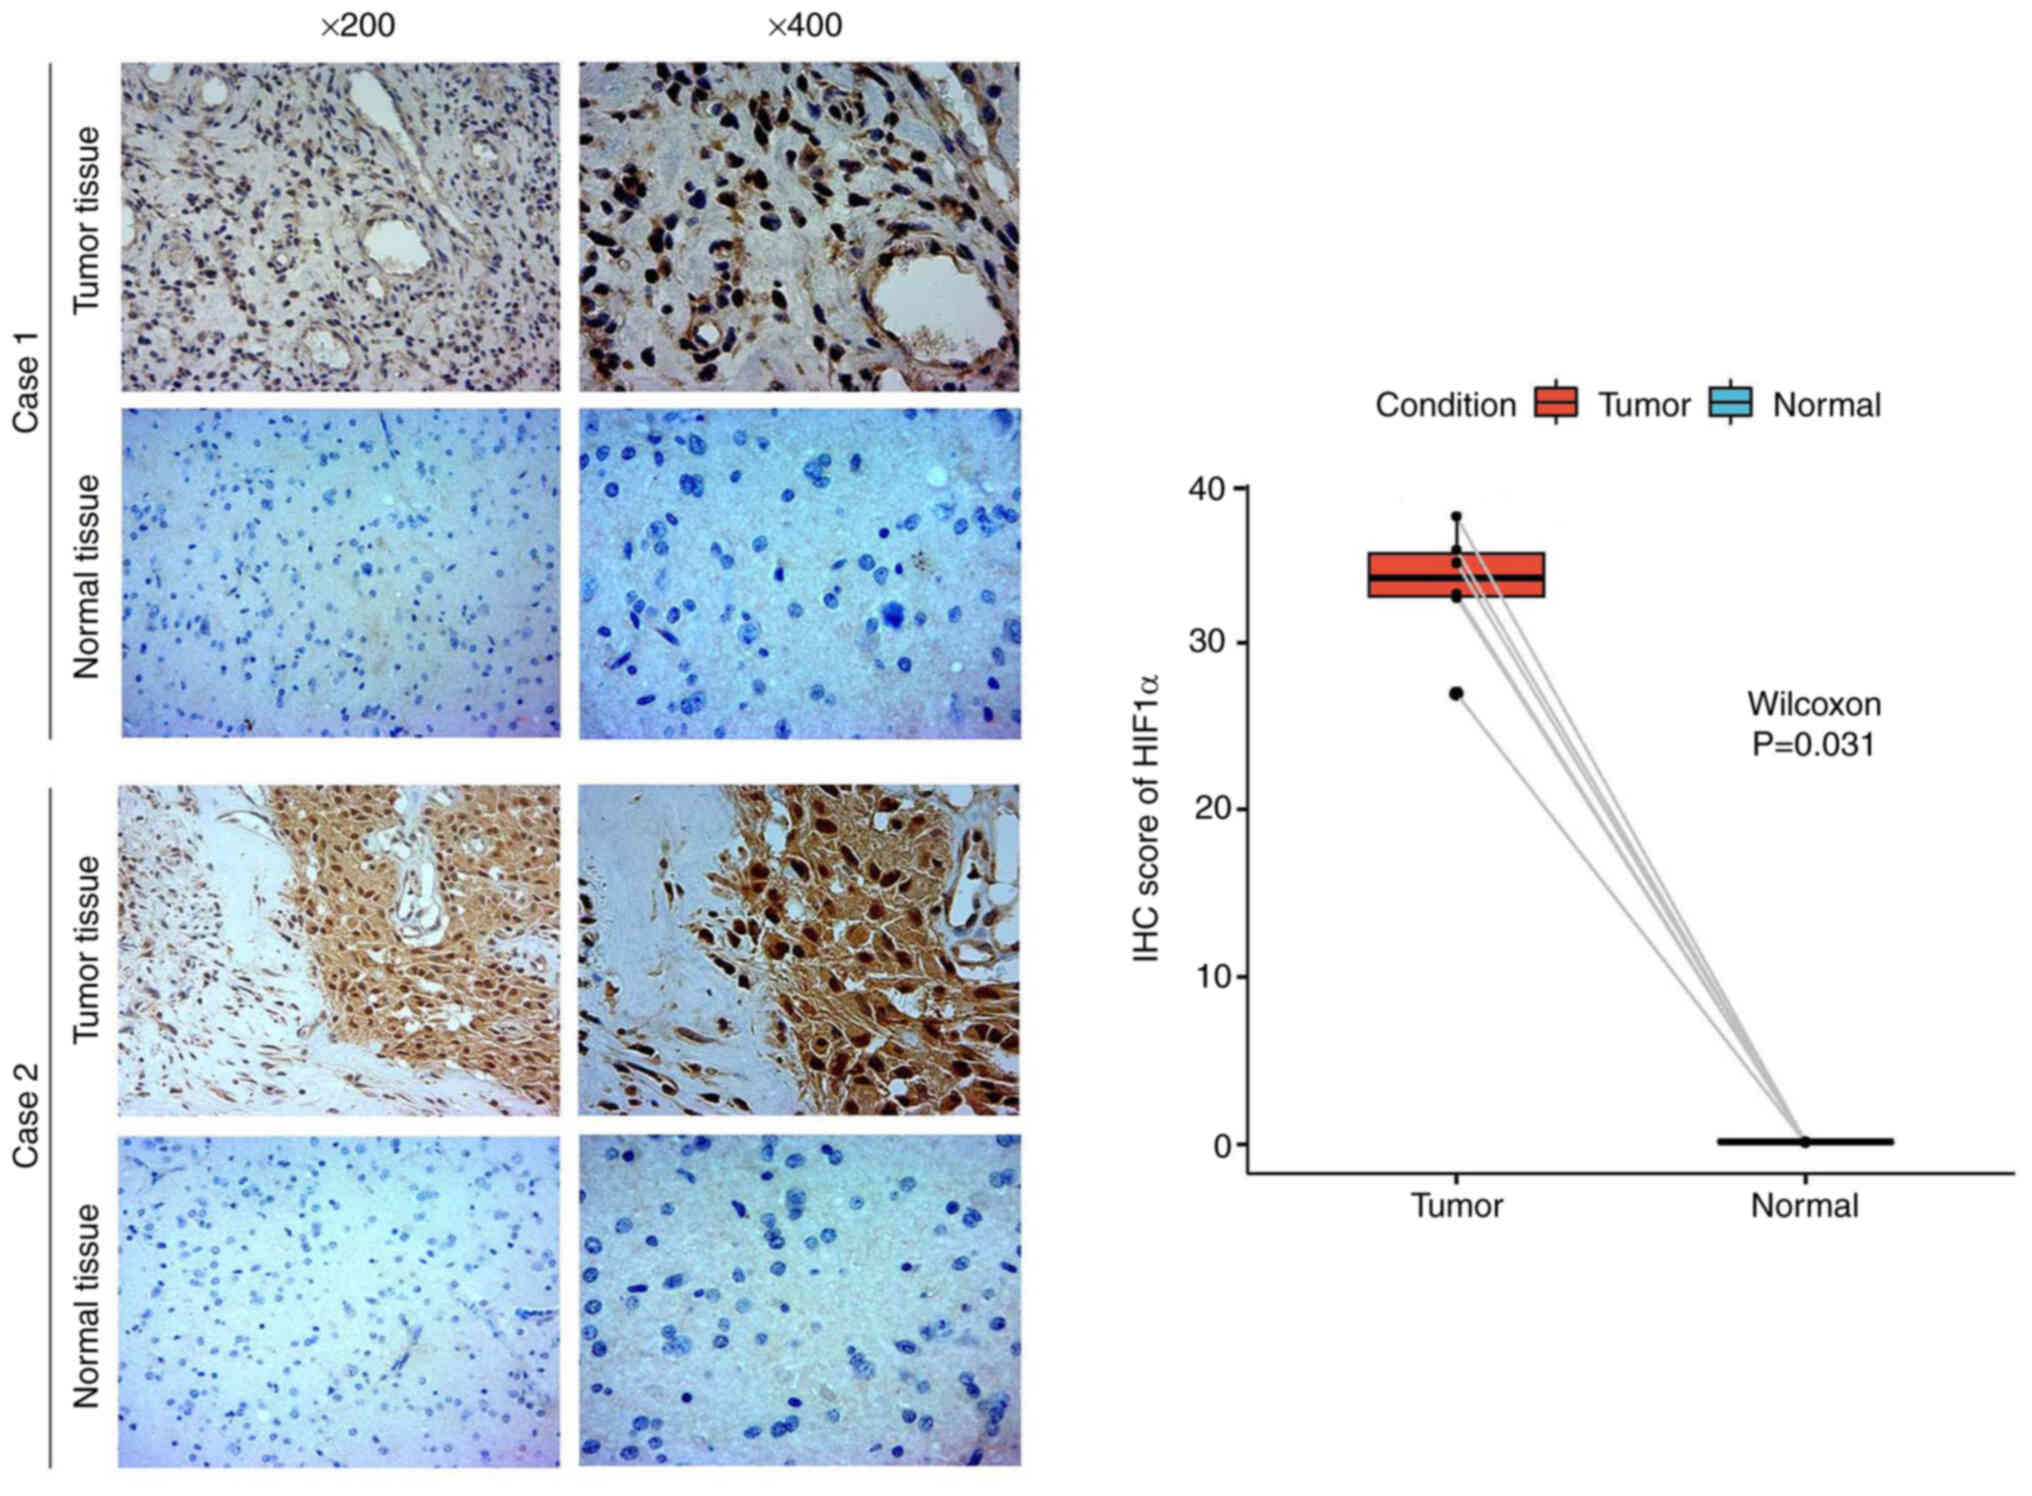
To confirm the increased abundance of the HIF1α
protein in GBM/LGG tissues compared with that in the corresponding
healthy tissues, IHC staining was conducted. Positive staining was
primarily observed in the cytoplasm and markedly higher HIF1α
expression was observed in glioma tissues compared with matched
normal tissues (Fig. 2). Hence,
HIF1α was overexpressed in gliomas at the protein level.
HIF1α and functional enrichment
analysis for DEG identification
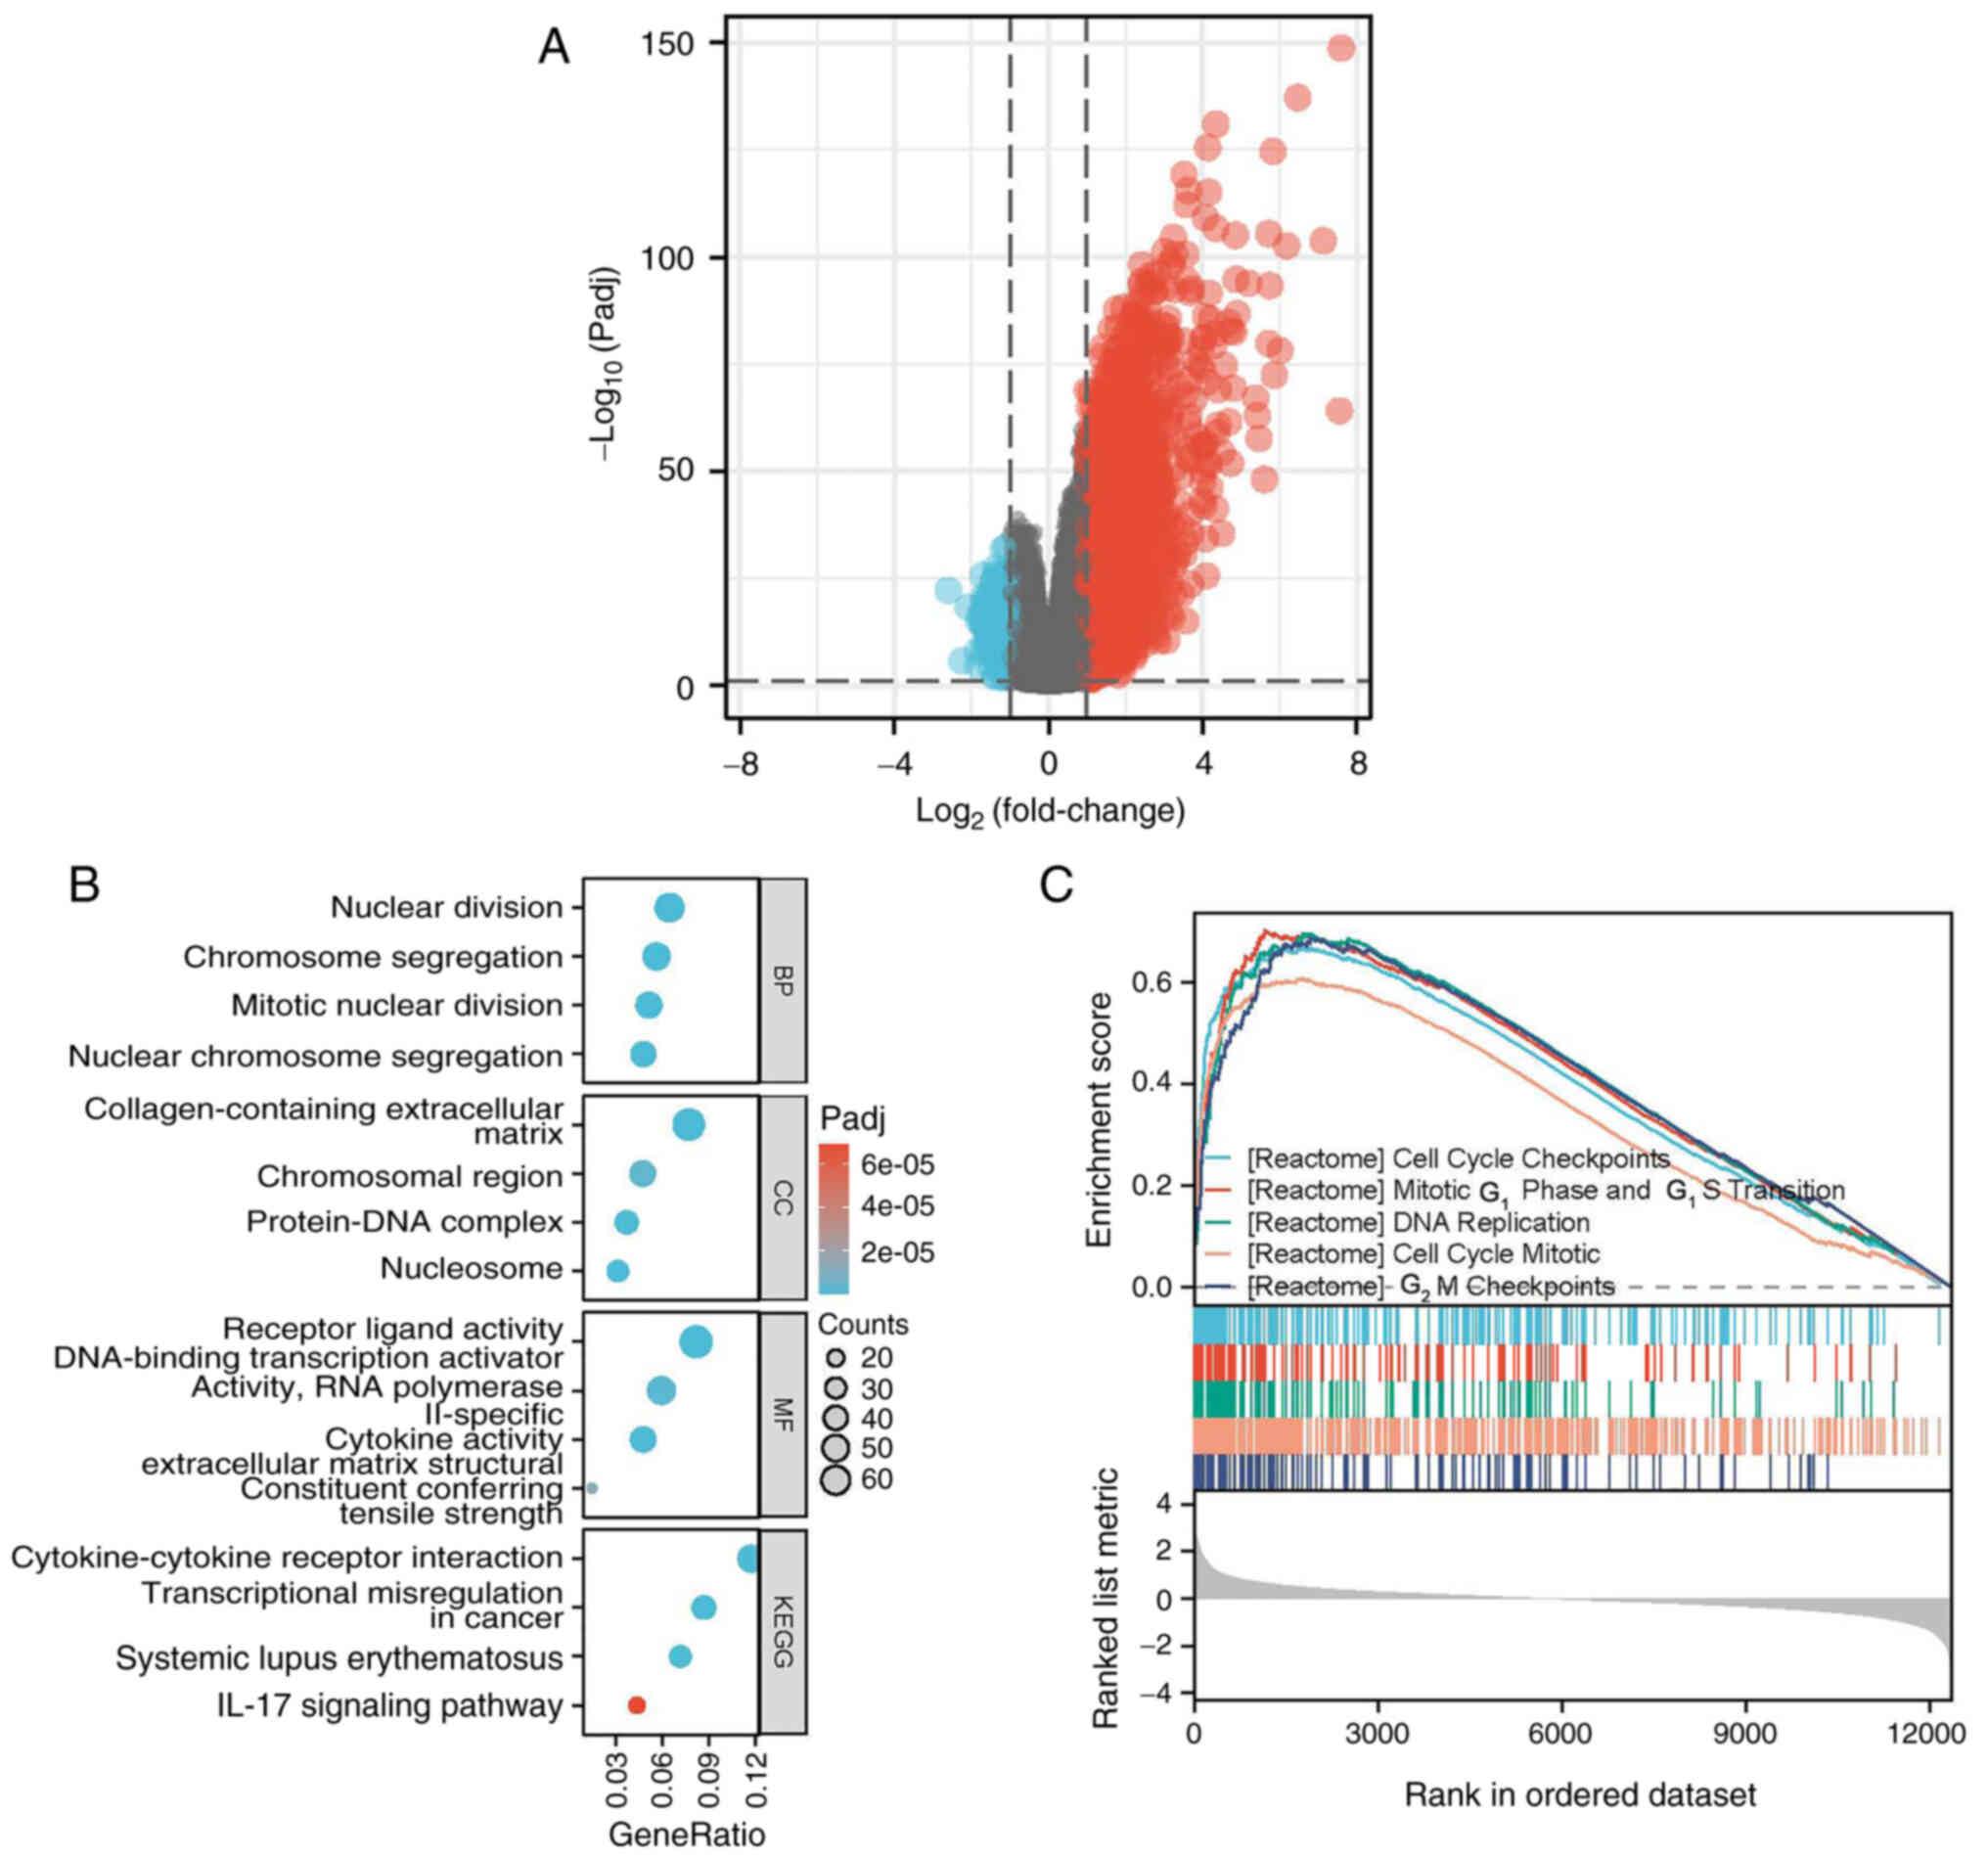
The |logFC|>1.5 and P adj <0.05 criteria were
applied to identify 918 DEGs between two sets of HIF1α samples
(low- and high-expression), which comprised 883 upregulated and 35
downregulated genes (Fig. 3A).
GO enrichment analyses demonstrated that the DEGs
were enriched in various BPs, including ‘nuclear division’,
‘chromosome segregation’, ‘mitotic nuclear division’ and ‘nuclear
chromosome segregation’. The enriched CCs included the
‘collagen-containing extracellular matrix’, ‘chromosomal region’,
‘protein-DNA complex’ and ‘nucleosome’. The MFs included ‘receptor
ligand activity’, ‘DNA-binding transcription activator activity,
RNA polymerase’, ‘cytokine activity’ and ‘extracellular matrix
structural constituents’. KEGG pathway enrichment analysis further
demonstrated that the DEGs were associated with ‘cytokine-cytokine
receptor interaction’, ‘transcriptional misregulation in cancer’,
‘systemic lupus erythematosus’ and the ‘IL-17 signaling pathway’
(Fig. 3B).
Gene set enrichment analysis was performed to verify
the pathway analyses (Fig. 3C).
Clusters associated with cell proliferation exhibited a
statistically significant enrichment in HIF1α-related DEGs
involving genes related to cell cycle checkpoints, mitotic G1 phase
and G1/S transition, DNA replication, cell cycle mitotic and G2/M
checkpoints.
Tumor-immune infiltrates and
immunological checkpoints in GBM/LGG
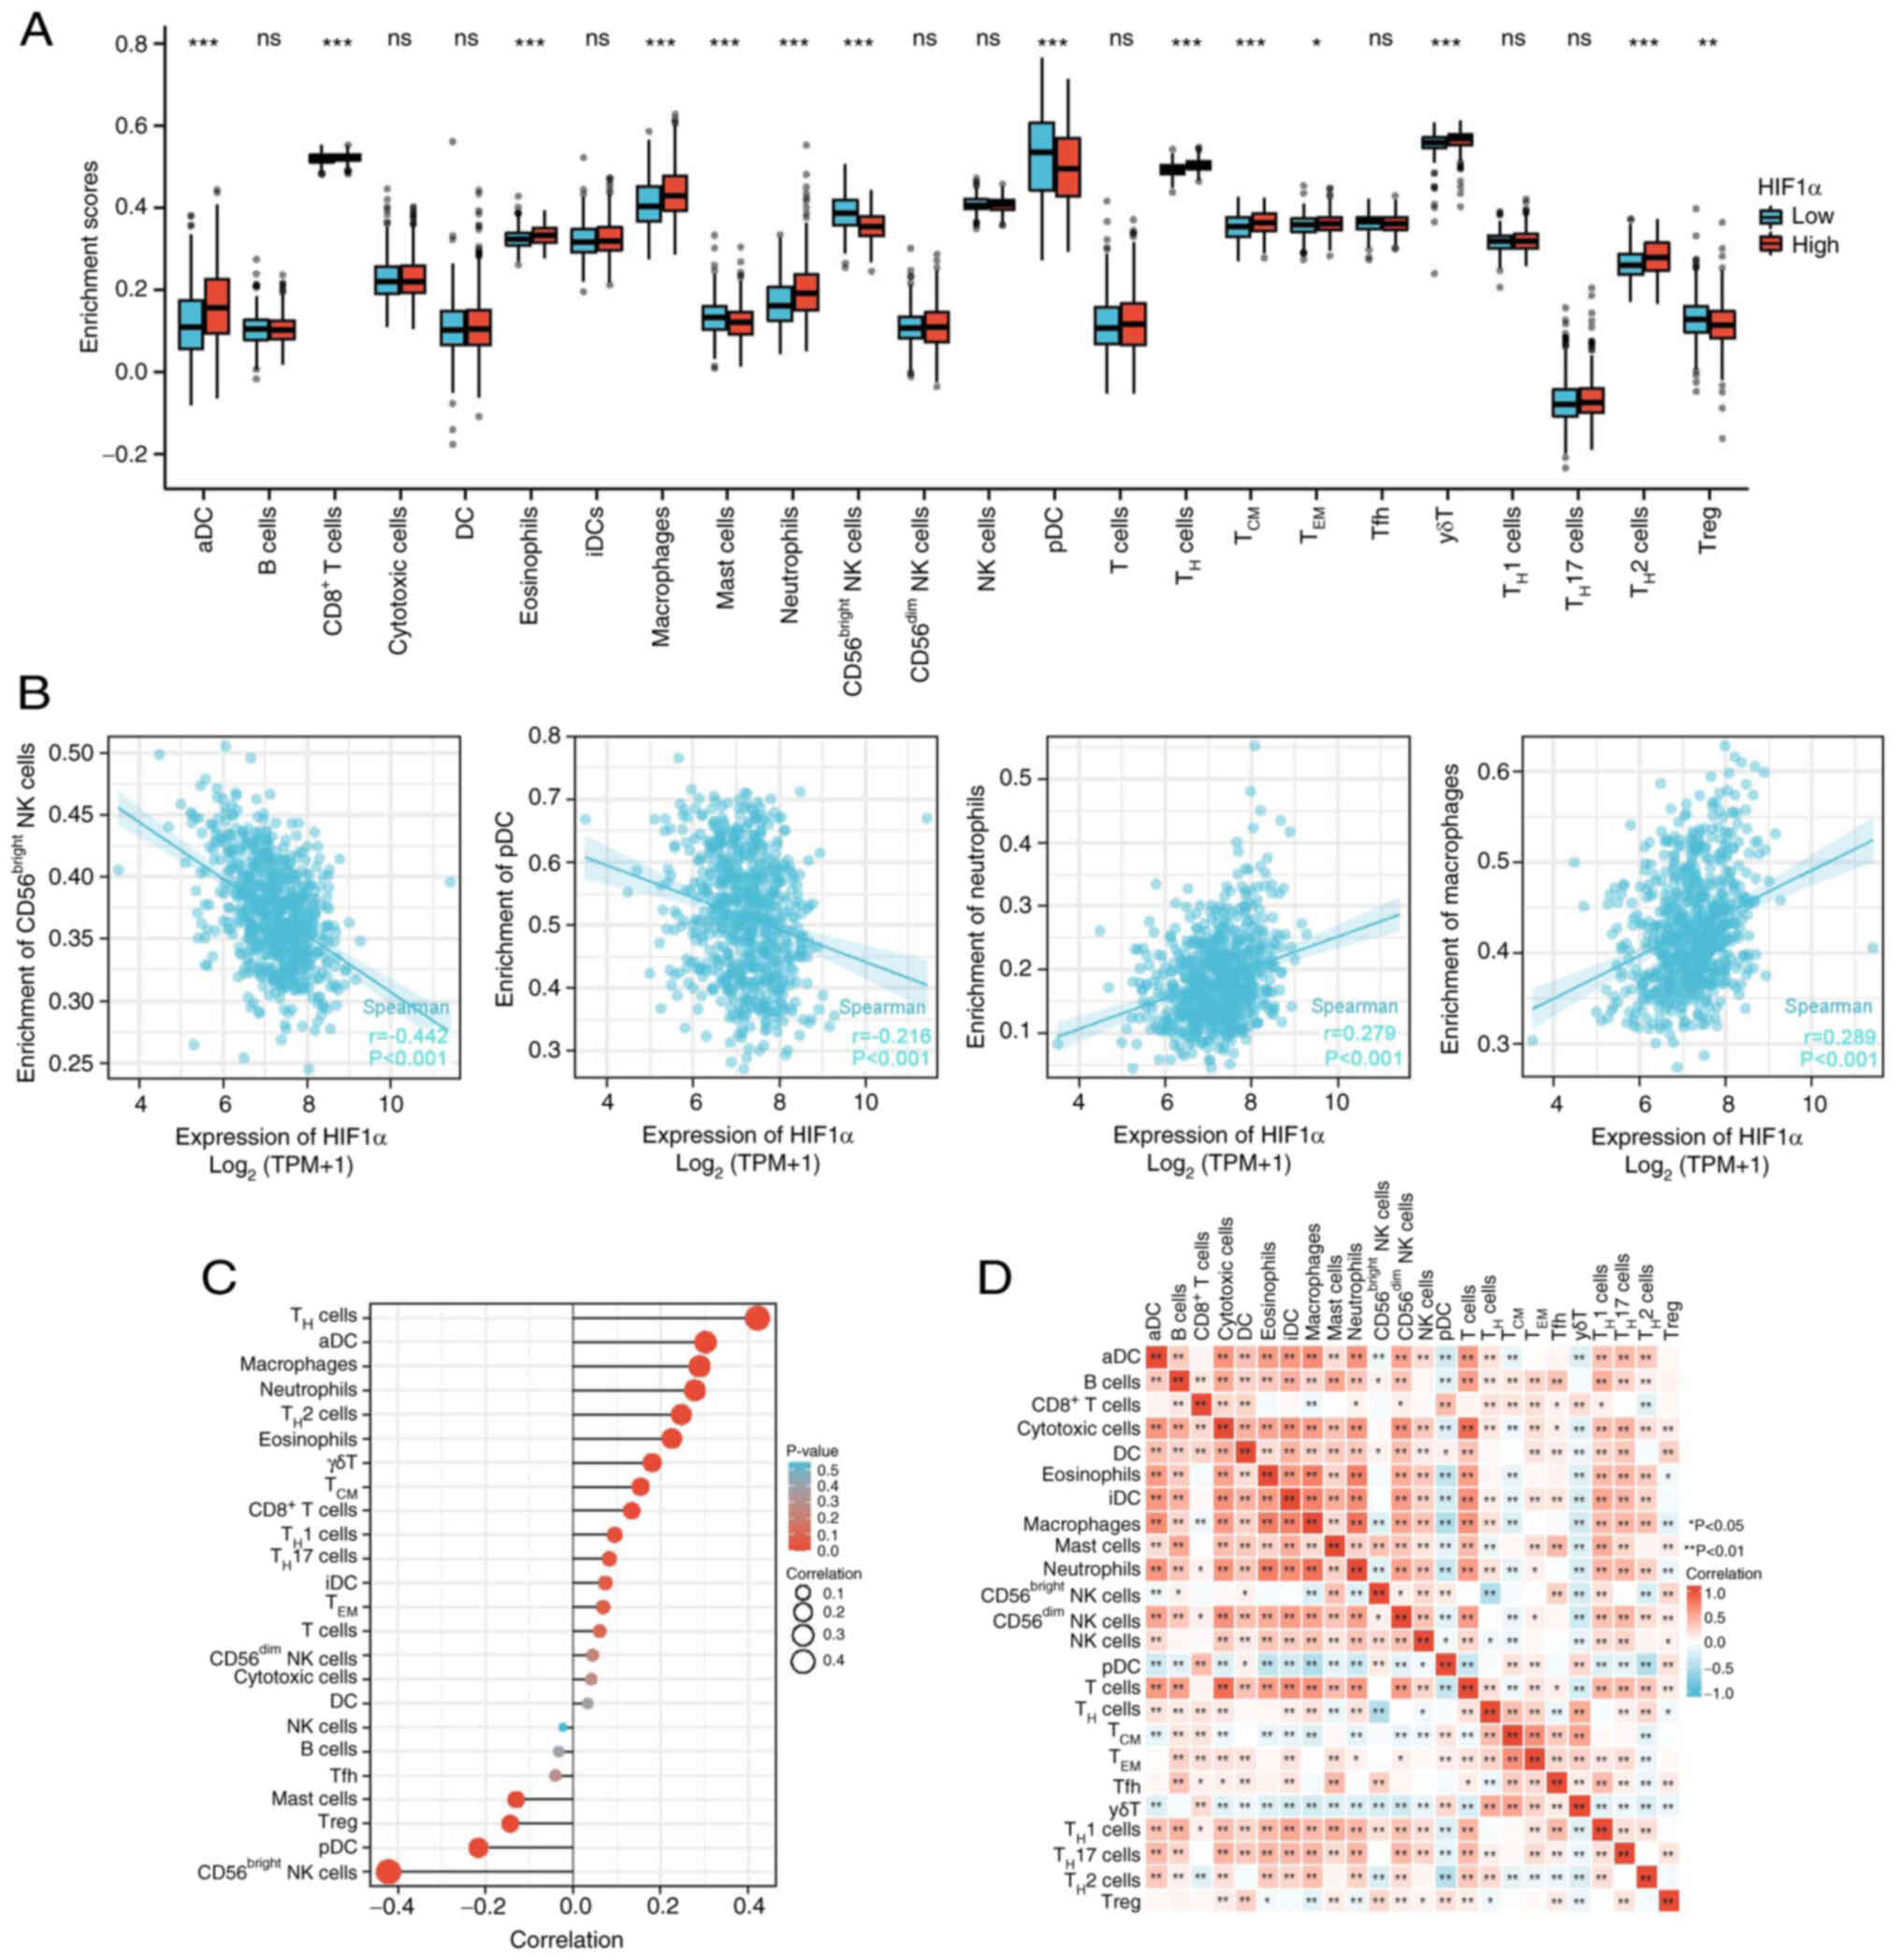
Immune cell infiltration is essential for the
development of myriad solid tumor types. Analysis of 24 immune cell
subtypes in the high- and low-HIF1α expression groups demonstrated
that the proportions of T-helper 2 (TH2), γδT, effector
memory T cells (TEM), central memory T cells
(TCM), TH and CD8+ T cells, as
well as neutrophils, macrophages, eosinophils and activated
dendritic cells (aDCs) were markedly increased in the high-HIF1α
group compared with those in the low-HIF1α group (Fig. 4A). By contrast, plasmacytoid
dendritic cells (pDCs) and Treg, CD56bright natural
killer (NK) and mast cells were significantly downregulated in the
high-HIF1α group compared with those in the low-HIF1α group. No
significant differences in were observed in B, cytotoxic,
CD56dim NK, NK, T, T follicular helper cells (Tfh), THi,
TH17, DCs and interdigitating DCs (iDCs) in the low- and
high-expression groups.
Moreover, infiltration of TH17,
TH2, TH1, γδT, TCM, TH,
CD8+ T cells, neutrophils, macrophages, eosinophils and
aDCs was associated with HIF1α expression. By contrast, the
infiltration of Treg, CD56bright NK and mast cells and
pDCs was inversely associated with HIF1α expression (Figs. 4B and C, S1 and S2). A heat map was used to visualize the
association between the ratios of the 24 distinct immune cell
subpopulations that permeated the tumors (Fig. 4D).
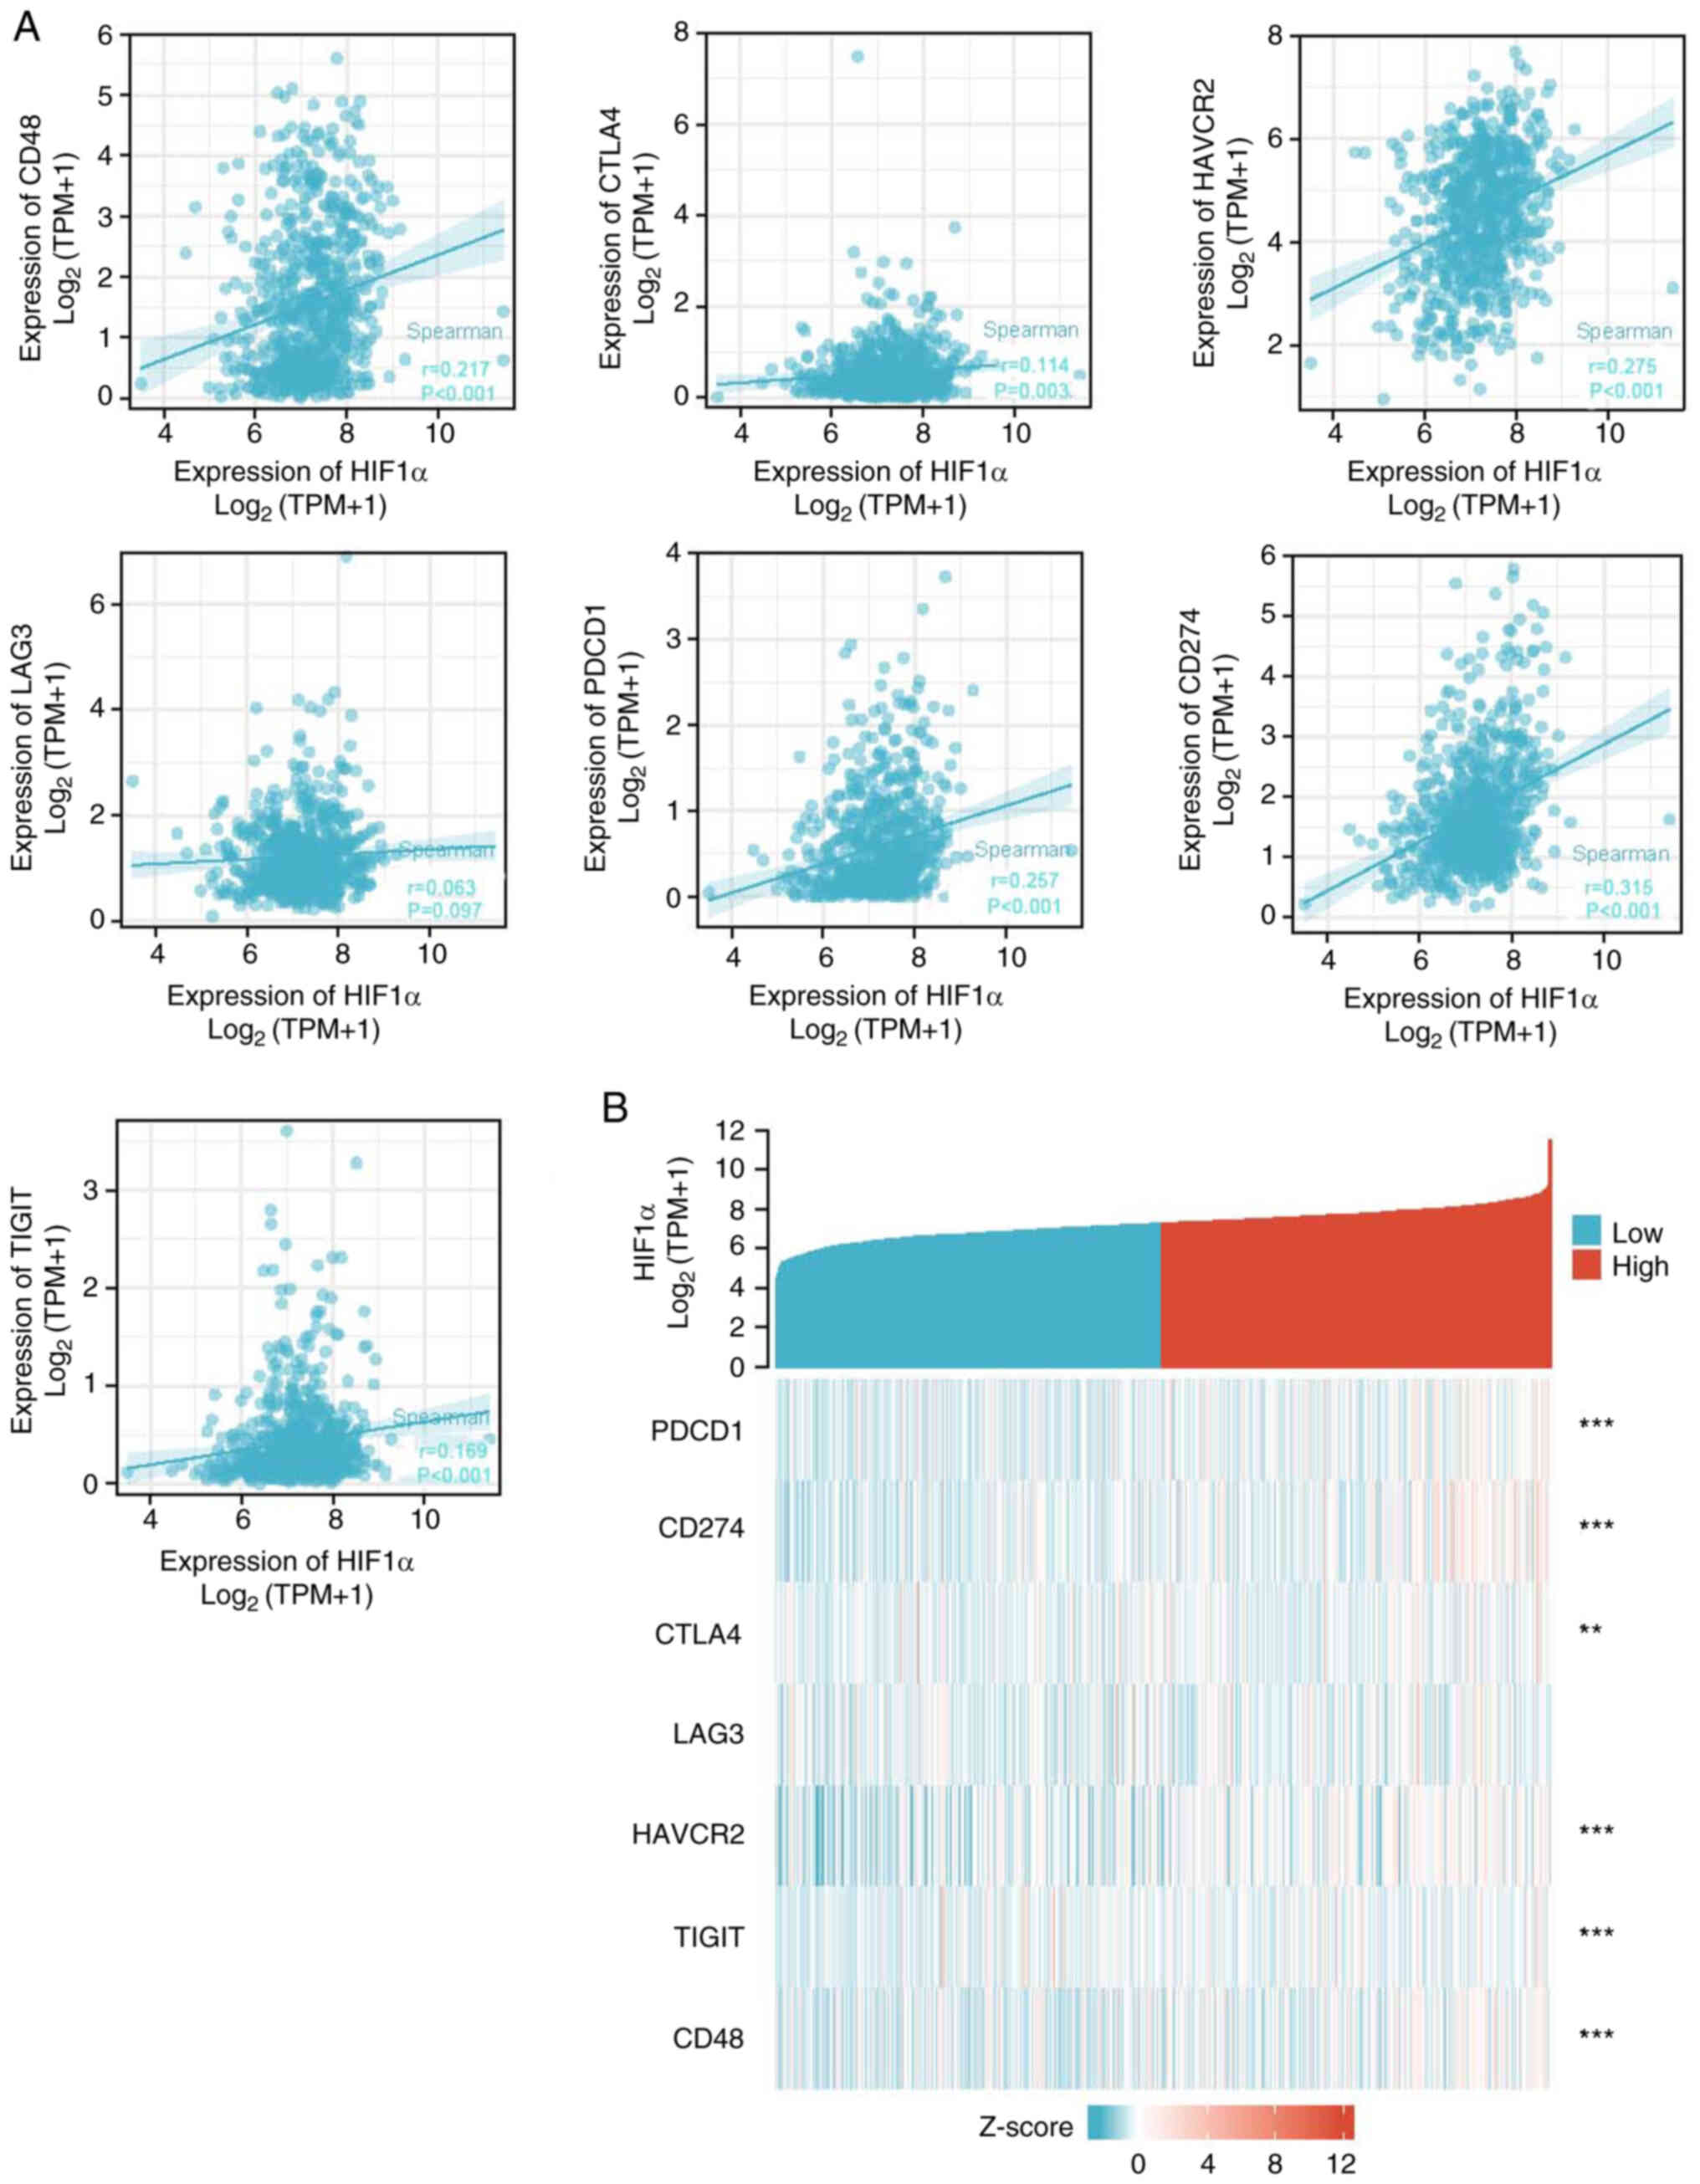
The relationship between HIF1α expression and
immunological checkpoints, including PDCD1, CD274, HAVCR2, CTLA4,
TIGIT, LAG-3 and CD48, was also assessed (Fig. 5A). The expression levels of PDCD1,
CD274, HAVCR2, LAG-3, TIGIT, CTLA4 and CD48 were positively
associated with HIF1α expression levels (P<0.005). The
expression levels of these checkpoints were higher in the
high-HIF1α group compared with the low-HIF1α group (Fig. 5B). These results suggested that
HIF1α serves a crucial role in immune infiltration of gliomas.
Correlation between HIF1α expression
and clinical features
The key clinical characteristics between the GBM/LGG
low- and high-HIF1α expression groups were compared (Table I). The number of patients with
glioblastoma in the IDH1 wild type, 1p/19q non-co-deletion
(co-del), WHO G4 and histological type categories were
significantly greater in the high-HIF1α expression group compared
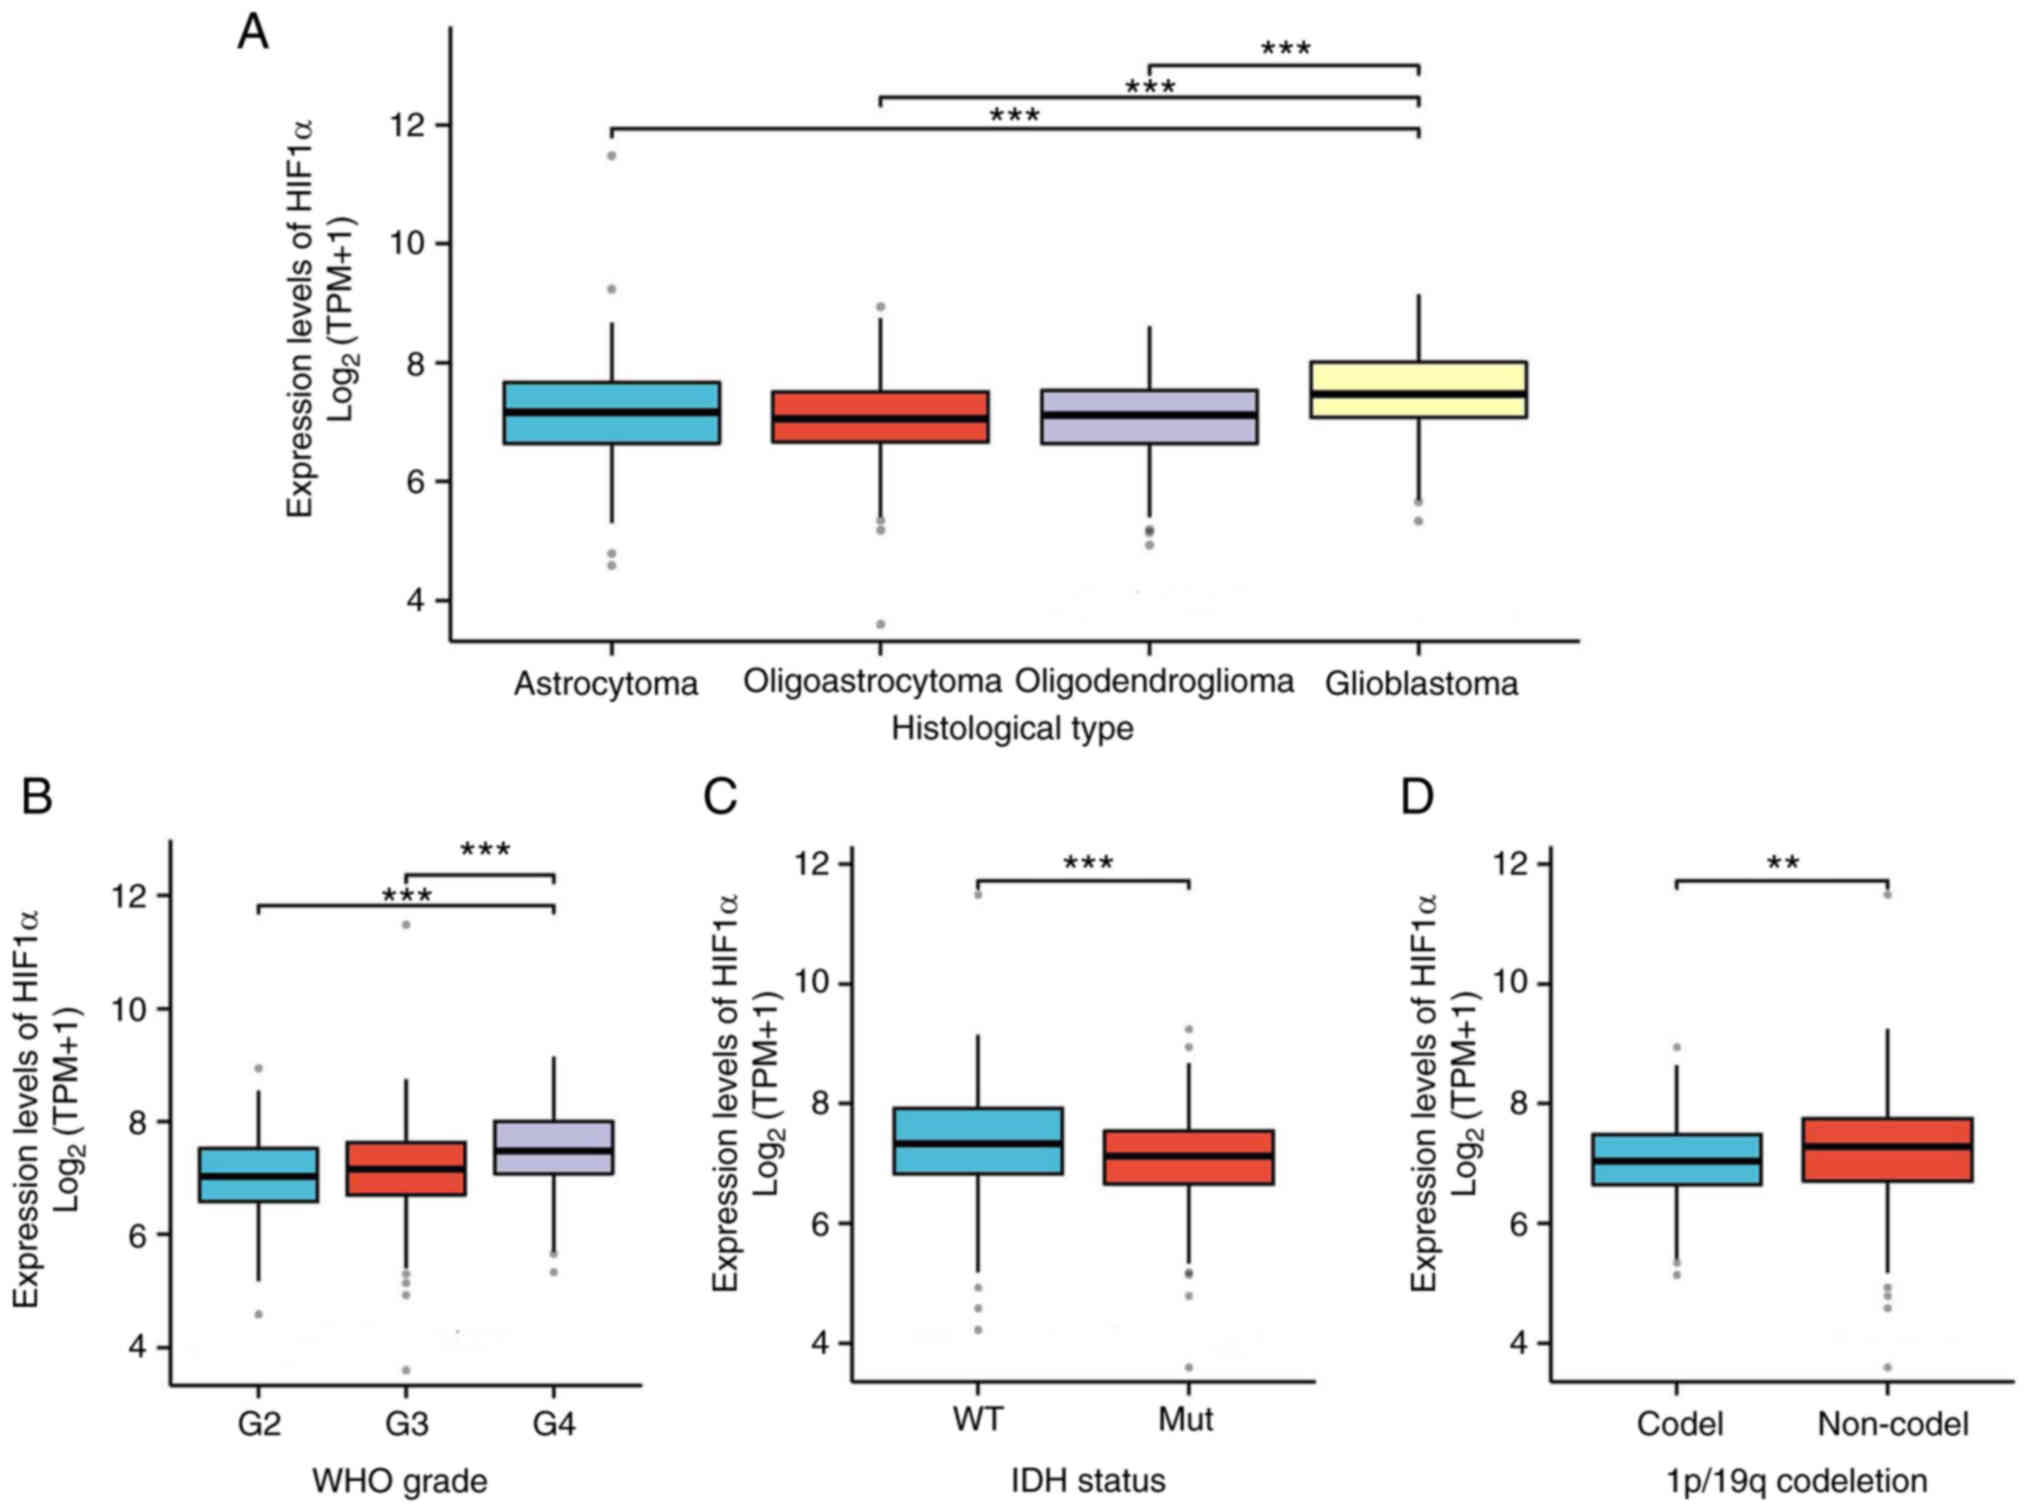
with the low-HIF1α expression group. Additionally, the expression
of HIF1α in relation to other clinical parameters was assessed
(Fig. 6). Compared with normal
expression levels, HIF1α expression was significantly upregulated
in cases of glioblastoma histological type, IDH1 wild type, 1p/19q
non-co-deletion and WHO G4.
 | Table I.Association between HIF1α expression
levels and clinicopathologic features in glioblastoma
multiforme/low-grade glioma. |
Table I.
Association between HIF1α expression
levels and clinicopathologic features in glioblastoma
multiforme/low-grade glioma.
| Characteristic | Low expression
level of HIF1α | High expression
level of HIF1α | P-value |
|---|
| Total number of
patients, n | 348 | 348 |
|
| Sex, n (%) |
|
| 0.193 |
|
Female | 158 (22.7%) | 140 (20.1%) |
|
|
Male | 190 (27.3%) | 208 (29.9%) |
|
| Histological type,
n (%) |
|
| <0.001 |
|
Astrocytoma | 101 (14.5%) | 94 (13.5%) |
|
|
Glioblastoma | 61 (8.8%) | 107 (15.4%) |
|
|
Oligoastrocytoma | 77 (11.1%) | 57 (8.2%) |
|
|
Oligodendroglioma | 109 (15.7%) | 90 (12.9%) |
|
| World Health
Organization grade, n (%) |
|
| <0.001 |
| G2 | 131 (20.6%) | 93 (14.6%) |
|
| G3 | 123 (19.4%) | 120 (18.9%) |
|
| G4 | 61 (9.6%) | 107 (16.9%) |
|
| Isocitrate
dehydrogenase status, n (%) |
|
| 0.010 |
| Wild
type | 106 (15.5%) | 140 (20.4%) |
|
|
Mutated | 236 (34.4%) | 204 (29.7%) |
|
| 1p/19q co-deletion,
n (%) |
|
| 0.007 |
|
Co-deletion | 102 (14.8%) | 69 (10%) |
|
|
Non-co-deletion | 245 (35.6%) | 273 (39.6%) |
|
| Age, median
(interquartile range) | 44.5 (35, 58) | 46.5 (34, 59) | 0.809a |
Relationship between prognostic
performance and HIF1α expression levels
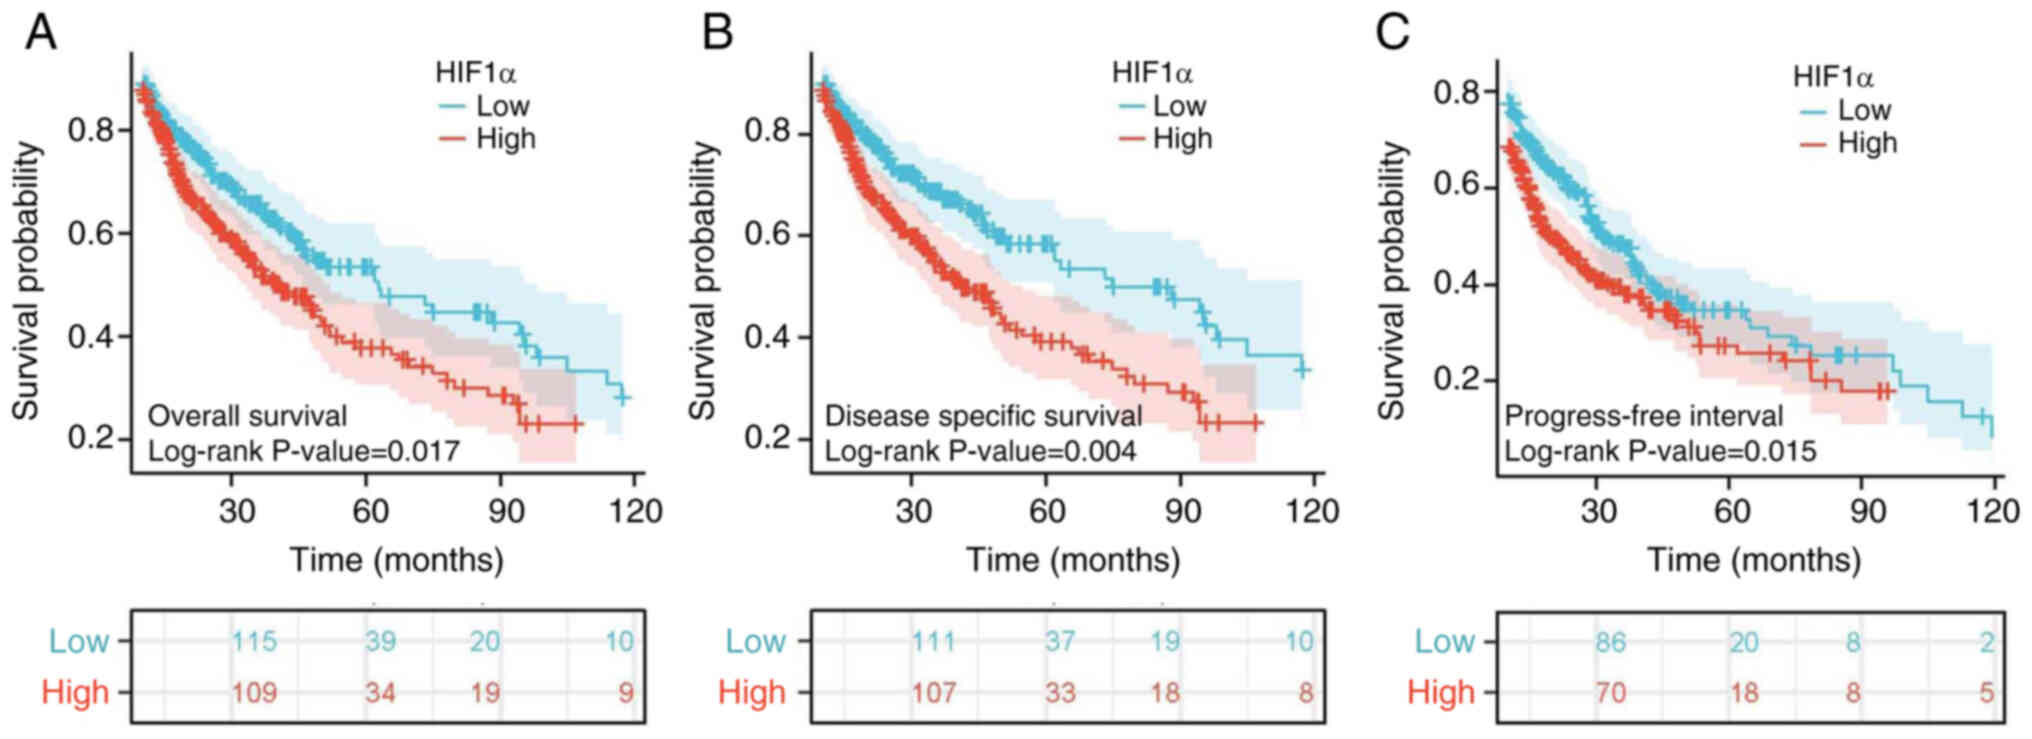
The association between HIF1α expression levels and
disease-specific survival (DSS), progression-free interval (PFI)
and OS in patients with GBM/LGG was evaluated using Kaplan-Meier
analysis (Fig. 7). High HIF1α
expression levels were associated with a significantly worse
prognosis compared with low HIF1α expression (P<0.001). Notably,
the PFI (HR=1.30; 95% CI=1.05–1.60; P=0.015; Fig. 7C), DSS (HR=1.45; 95% CI=1.13–1.86;
P=0.004; Fig. 7B) and OS (HR=1.34;
95% CI=1.05–1.69; P=0.017; Fig. 7A)
were significantly lower in the high-HIF1α expression group
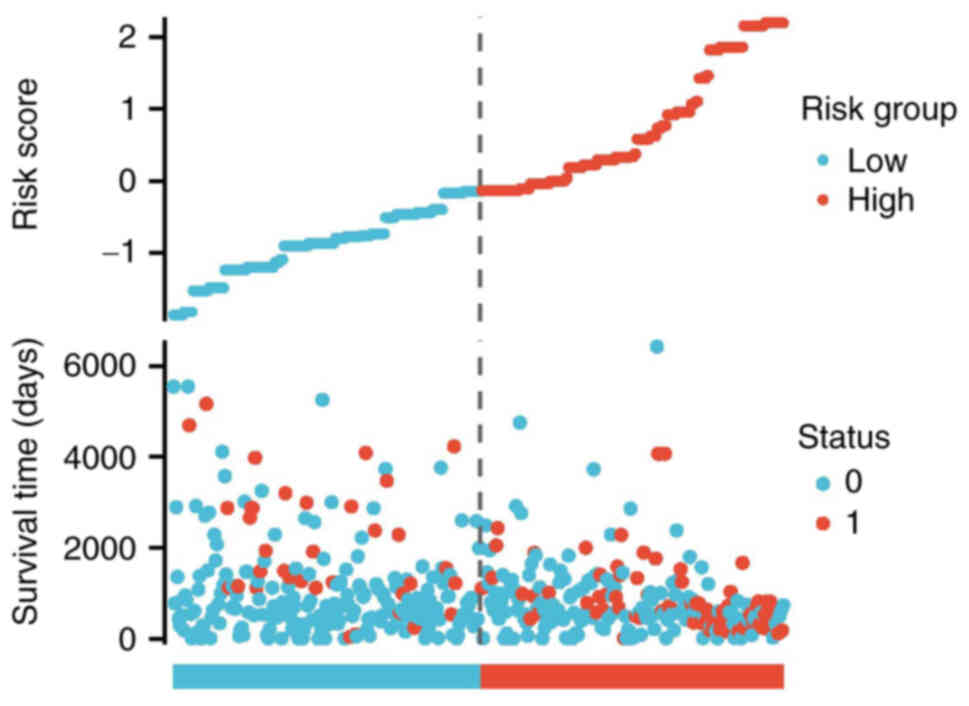
compared with the low expression group. The relationships between
the risk score, survival time and HIF1α expression patterns were
also examined. Utilizing the risk score, patients with glioma were
categorized into two distinct groups. As the risk score increased,
there was a concurrent rise in the risk of mortality and a decrease
in favorable clinical outcomes for the patients, respectively
(Fig. 8).
Age, 1p/19q co-del, WHO grade, IDH1 status, sex and
HIF1α expression levels were among the clinical characteristics
incorporated in the nomogram model (Fig. 9A). The nomogram demonstrated high
therapeutic efficacy for estimating the 1-, 3- and 5-year OS rates
of patients with glioma.
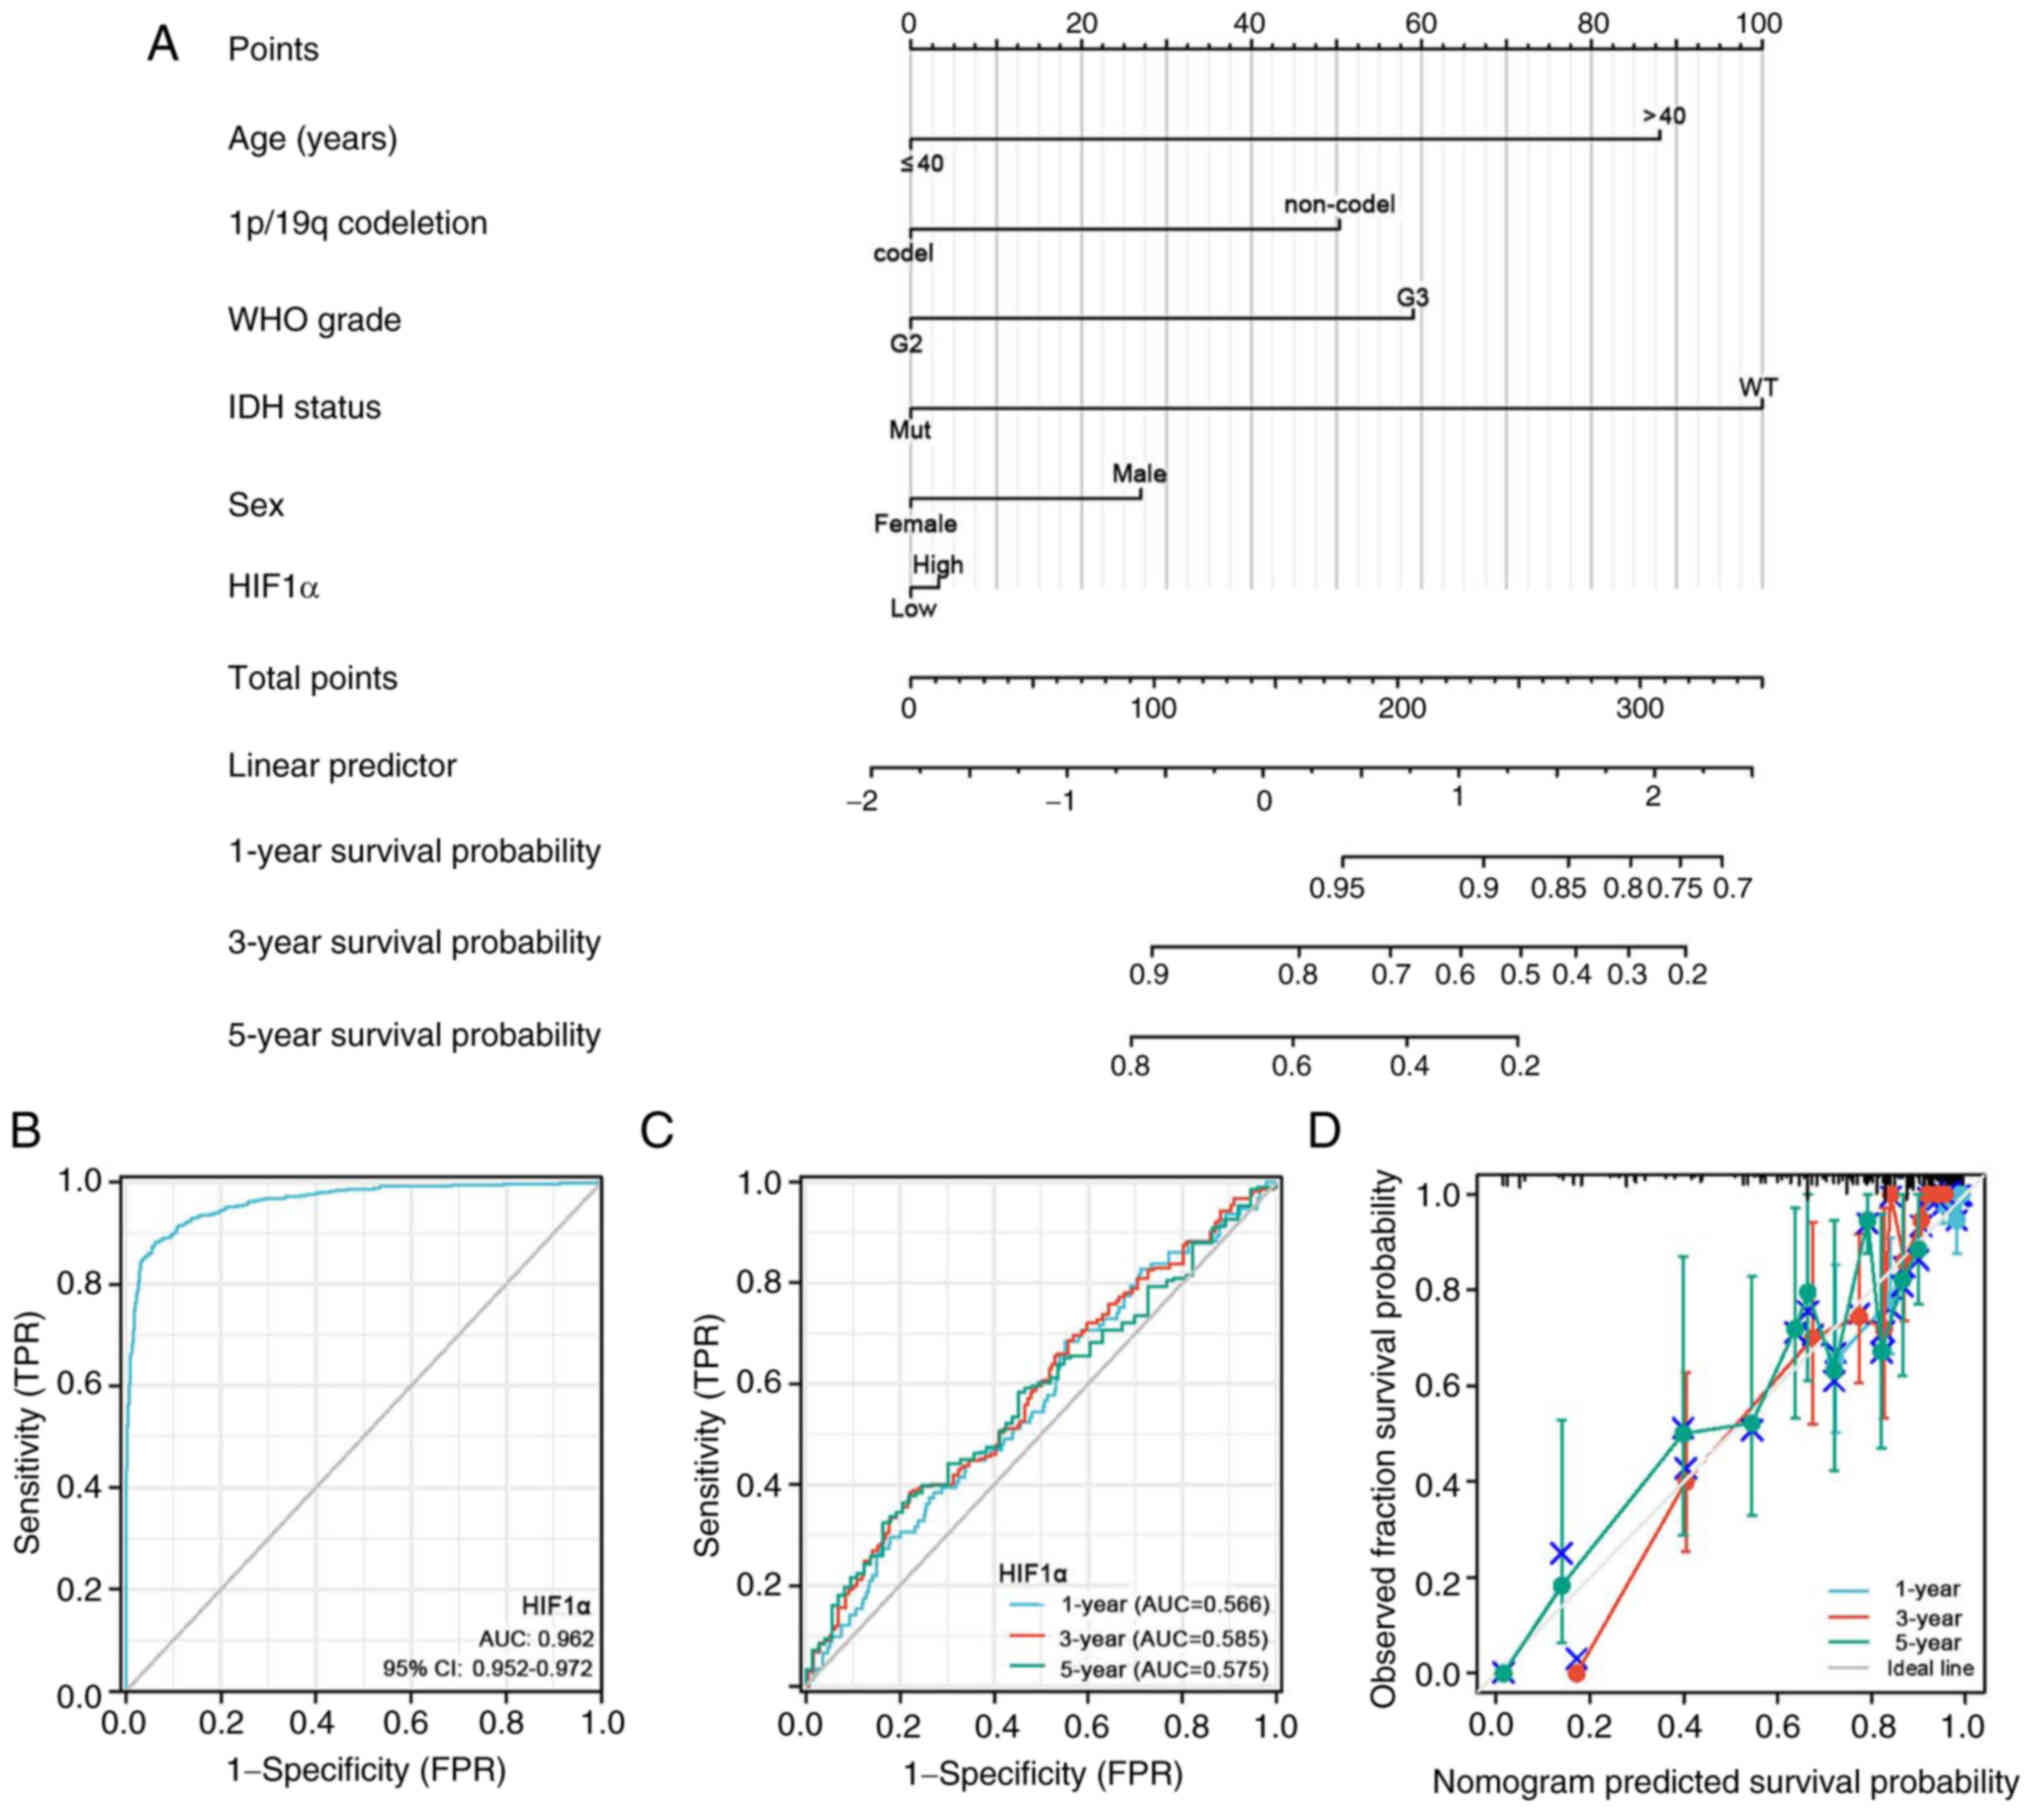 | Figure 9.Prognostic prediction model of HIF1α
expression in patients with glioblastoma multiforme/low-grade
glioma. (A) Nomogram of the 1-, 3- and 5-year overall survival
rates. (B) Diagnostic ROC curve of HIF1α. (C) Time-dependent ROC
curves and AUC values and (D) calibration plots for 1-, 3- and
5-year OS prediction. ROC, receiver operating characteristic; WHO,
World Health Organization; IDH, isocitrate dehydrogenase; HIF1α,
hypoxia-inducible factor 1 subunit alpha; AUC, area under the
curve; mut, mutated; WT, wild type; FPR, false positive rate; TPR,
true positive rate. |
The diagnostic utility of HIF1α expression was
evaluated using ROC curve analysis. Based on an area under the
curve (AUC) of 0.962 (95% CI=0.952–0.972), HIF1α expression
demonstrated a statistically significant predictive capacity to
differentiate glioma tissues from normal tissues (Fig. 9B). Using calibration plots and
time-dependent ROC curves, the likelihood of the 1-, 3- and 5-year
OS rates was predicted with AUC values of 0.566, 0.585 and 0.575,
respectively. The calibration plots supported the findings of the
time-dependent ROC curve analysis. (Fig. 9C and D).
Prognostic value of HIF1α within the
specific clinical parameters of gliomas
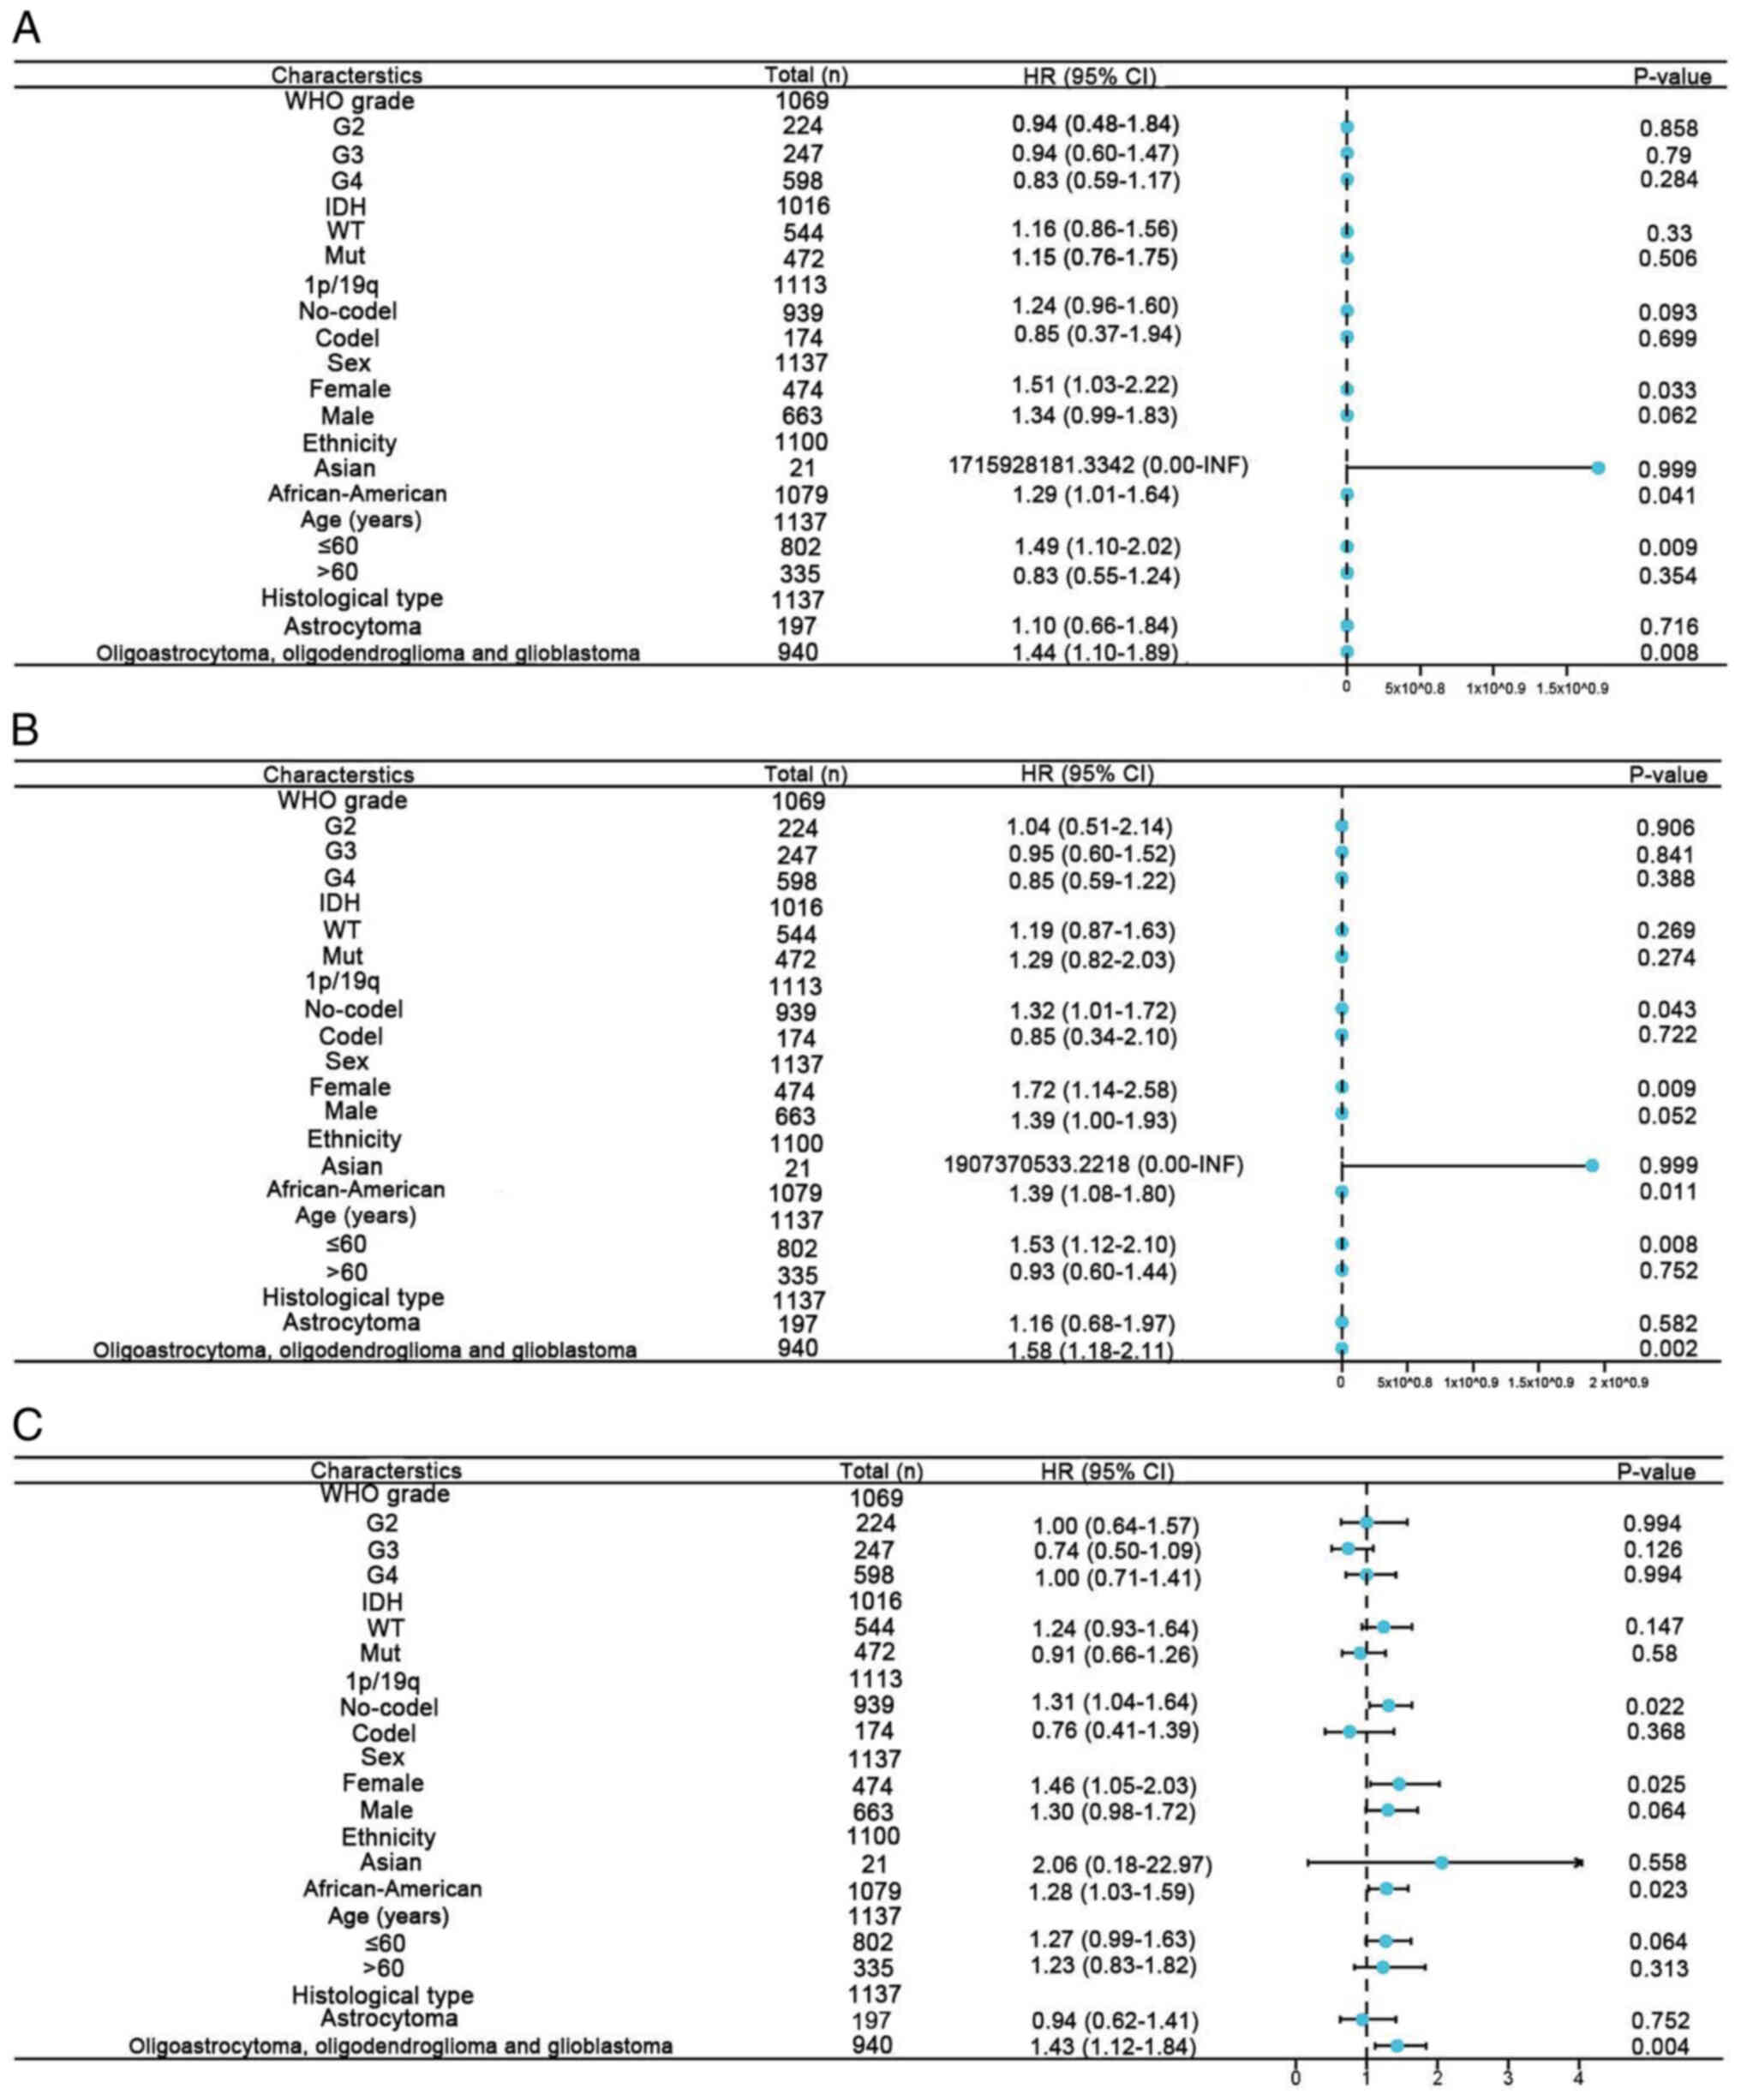
The predictive value of HIF1α was determined by
analyzing specific clinical parameters, including WHO grade, IDH1
status, 1p/19q, sex, ethnicity and histological type (Fig. 10). Elevated HIF1α expression levels
correlated with adverse OS in patients with glioma for four
clinical parameters: Ethnicity, white and African-American (hazard
ratio [HR]=1.29; P=0.041); sex, female (HR=1.51; P<0.05); age,
≤60 years (HR=1.49; P<0.005); and clinical histologic types,
oligoastrocytoma, oligodendroglioma and glioblastoma (HR=1.44;
P=0.008; Fig. 10A). Unfavorable
DSS correlated with high HIF1α expression levels for five clinical
parameters: 1p/19q, no-co-del (HR=1.32; P=0.043); ethnicity, white
and African-American (HR=1.39; P=0.011); sex, female (HR=1.72;
P<0.005); age, ≤60 years (HR=1.53; P<0.005); and clinical
histologic types, oligoastrocytoma, oligodendroglioma and
glioblastoma (HR=1.58; P=0.002; Fig.
10B). In addition, high HIF1α expression was associated with
poor PFI for four clinical parameters: 1p/19q, no-co-del (HR=1.31;
P=0.022); sex, female (HR=1.46; P=0.025); ethnicity, white and
African-American (HR=1.28; P=0.023); and clinical histologic types,
oligoastrocytoma, oligodendroglioma and glioblastoma (HR=1.43;
P=0.004; Fig. 10C). Therefore,
patients with gliomas expressing high HIF1α levels demonstrated a
significantly lower survival rate compared with patients with low
HIF1α expression levels.
Knockdown of HIF1α expression by siRNA
transfection inhibits glioma cell growth and migration
To investigate the functional role of HIF1α in
glioma cells, the expression levels of HIF1α were detected in both
glioma cell lines (T98G, U87 and U251) and normal brain tissue
cells (HEB). HIF1α mRNA (Fig. 11A)
and protein (Fig. 11B) expression
levels were significantly higher in GBM cells compared with normal
brain tissue cells. si-HIF1α significantly suppressed endogenous
HIF1α expression in two glioma cell lines (T98G and U87), whereas
HIF1α expression remained unaffected in si-NC-transfected cells
(Fig. 11C and D). The CCK-8 assay
was used to assess cell proliferation (Fig. 11E). The proliferative capacities of
HIF1α-knockdown T98G and U87 cells were significantly inhibited
compared with those of si-NC-transfected cells on days 3 and 4
following transfection. Additionally, HIF1α knockdown significantly
decreased the migration of T98G and U87 GBM cells (Fig. 11F).
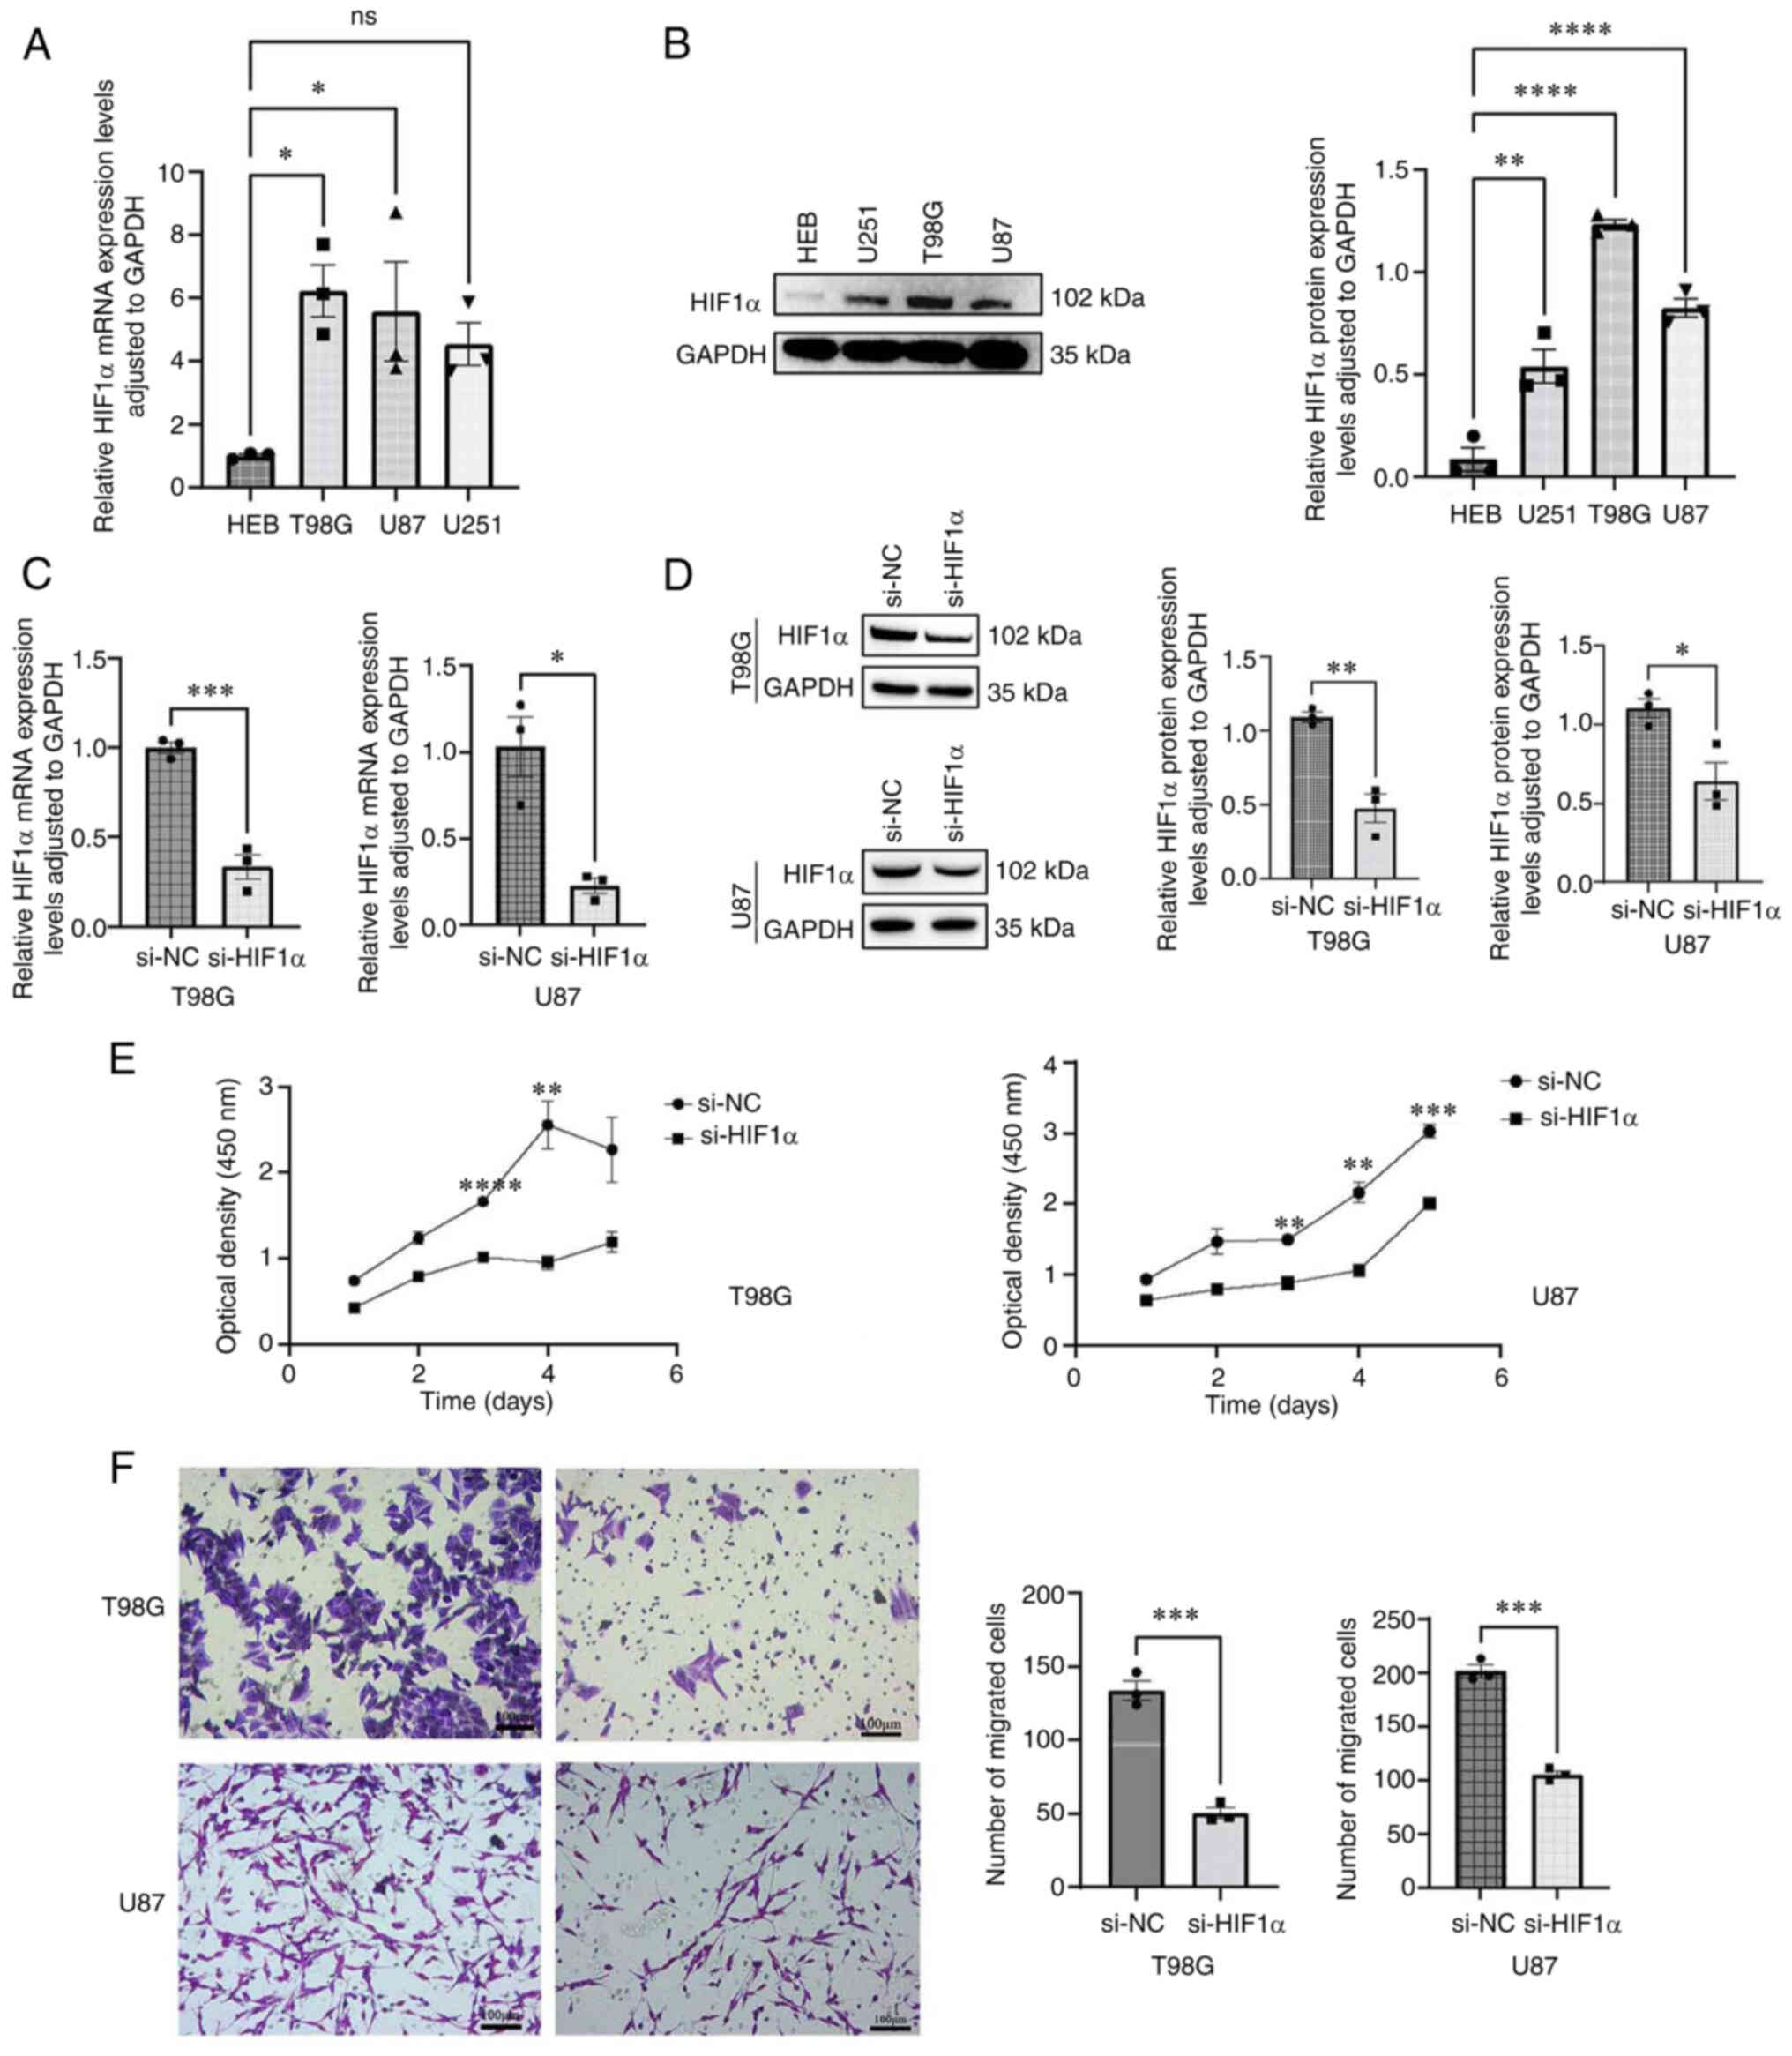 | Figure 11.Upregulation of HIF1α in GBM cells
and the migratory capacity of cells in vitro. (A) RT-qPCR
analysis of HIF1α expression in GBM cells. (B) Western blotting
analysis of HIF1α abundance in GBM cells. (C) RT-qPCR verification
of siRNA efficiency. (D) Western blotting verification of siRNA
efficiency. (E) Cell Counting Kit-8 assay of GBM proliferation
following HIF1α knockdown. (F) Transwell assay of GBM migration
following HIF1α knockdown. Scale bar, 100 µm. Data are presented as
mean ± standard error of the mean (n=3). *P<0.05, **P<0.01,
***P<0.001, ****P<0.0001. Data were analyzed using one-way
ANOVA followed by a post hoc test (Dunnett's test) for (A and B) or
a two-tailed unpaired Student's t-test for (C-F). GBM, glioblastoma
multiforme; HIF1α, hypoxia-inducible factor 1 subunit alpha;
RT-qPCR, reverse transcription-quantitative PCR; si, small
interfering RNA; ns, no significance; NC, negative control. |
These results indicated that siHIF1α effectively
reduced HIF1α expression and inhibited glioma cell growth and
migration. Mechanistically, this may potentially be caused by the
reduction of microvascular mimicry by silencing HIF1α expression,
thus inhibiting glioma growth.
Discussion
HIF1α is abundantly expressed in several types of
malignancies and has been linked to various cancer features,
including metastasis, stimulation of tumor formation, invasion via
angiogenesis and modulation of cellular metabolism in hypoxic tumor
microenvironments (26,37). PRMT3 has previously been reported to
accelerate the development of gliomas by promoting HIF1α-mediated
glycolysis and metabolic rewiring (38). Moreover, HIF1α and programmed
death-ligand 1 (PD-L1) are positively associated with gliomas.
Therefore, targeting HIF1α can improve the effectiveness of
anti-PD-1/PD-L1 therapies for gliomas (39). Mechanistically, HIF1α promotes
chemoresistance by enabling the dedifferentiation of normal glioma
cells and preserving glioma stem cell stemness (40). Additionally, HIF1α is expressed by
various immune cells, including macrophages, neutrophils, dendritic
cells, and lymphocytes, and modulates innate and adaptive immunity
within the tumor microenvironment (26,41,42).
To assess the predictive significance of HIF1α, data were collected
from the TCGA database and the expression patterns of HIF1α in
gliomas were evaluated. The results of the present study provided a
potential theoretical basis for the development of personalized
treatment strategies for patients with glioma. Therefore,
characterizing the clinical and molecular relationships between
HIF1α expression and glioma malignancy may potentially identify
viable therapeutic targets and provide insights into glioblastoma
treatment. According to the findings of the present study, immune
infiltration and OS were significantly associated with HIF1α
expression in patients with GBM/LGG.
In the present study, HIF1α expression levels were
compared across several types of cancers. In most cancer types
analyzed, including GBM/LGG, HIF1α expression was significantly
upregulated compared with that in normal tissues. Moreover, glioma
tissues exhibited upregulation of HIF1α-associated DEGs involved in
DNA replication, DNA damage repair and the cell cycle. DNA is a
fundamental feature of tumor cell proliferation and is closely
related to the cell cycle process (43). The proliferation of cells in gliomas
may thus be influenced by upregulated HIF1α expression.
Additionally, DNA repair promotes chemotherapeutic resistance in
tumor cells while ensuring cell survival (44). Therefore, downregulating HIF1α
expression may cause cells to enter a state of defective DNA
repair, which may prove advantageous for patients with
chemotherapy-resistant gliomas. Tumor-specific immunotherapy
modifies the immune system to treat a range of cancers (45–47).
The gene function enrichment findings in the present study
suggested that HIF1α alterations may impact the glioma immune
microenvironment.
Furthermore, the expression of HIF1α mRNA was
positively associated with the proportion of certain immune cells,
such as TH17, TH2, TH1 and
CD8+ T cells. Tumors with high HIF1α expression were
heavily infiltrated by immune cells. Previous studies have reported
that the stabilization of expression of HIF1α in macrophages
(48), TH17 cells
(49), CD8+ T cells
(50) and TH1 cells
(51) influences glioma
progression, which was corroborated by the results of the present
study. The present study also demonstrated that HIF1α expression
was positively associated with the presence of neutrophils.
Tumor-associated neutrophils may facilitate invasion and migration
of tumor cells (52–54), while increased neutrophil
recruitment during antiangiogenic therapy accelerates the
development of gliomas and may contribute to treatment resistance
(55). In glioblastoma, the present
study demonstrated an association between HIF1α expression and
CD56bright NK cells and pDCs. Innate immunological
defense against cancer relies on NK cells (56). Meanwhile, IFN-I generated by pDCs
exhibits anticancer properties (57). Owing to the inverse relationship
between CD56bright NK cells and HIF1α expression
observed in the present study, the infiltration of
CD56bright NK cells into solid tumors was relatively
minimal compared with other types of immune cells. The primary
function of CD56bright NK cells is immunomodulation via
the generation of a myriad of cytokines (58,59).
This may result in an antitumor effect and deregulation of tumor
immunosurveillance. HIF1α expression may be modified in these cells
and thus influence glioma progression. Additionally, the present
study demonstrated a positive relationship between HIF1α expression
and immunological checkpoints, namely PDCD1, CTLA4, CD274, HAVCR2,
TIGIT, LAG-3 and CD48. CTLA-4 and PDCD-1 are critical proteins
associated with tumor immune escape (60,61).
Ipilimumab, a CTLA-4 inhibitor, and nivolumab, a PDCD-1 inhibitor,
are immune checkpoint inhibitors (ICIs) that increase the OS rates
of patients with melanoma (62,63).
Hence, HIF1α may impact tumor immunology, making it an
immunological target rather than merely a prognostic indicator.
In the future, a treatment combination of HIF1α
inhibitors with ICIs utilizing the features of HIF1α that enhance
the proportions of macrophages and neutrophils while decreasing the
proportions of CD56bright NK cells and pDCs could be
leveraged, thus improving the therapeutic effects of immunotherapy
in patients with gliomas. The results of the present study
indicated that HIF1α alteration may affect the progression and
prognosis of glioma by regulating the levels of infiltrating immune
cells. Wild type IDH1, 1p/19q non-deletion and WHO G4 ratios were
significantly increased in patients with elevated HIF1α expression,
which suggested a potential role for HIF1α as a positive prognostic
predictor. Hence, the predictive potential of HIF1α in patients
with GBM/LGG was further investigated.
Using Kaplan-Meier survival analysis, it was
demonstrated that HIF1α expression was related to PFI, DSS and OS,
which suggested that high HIF1α expression may be associated with
adverse results in patients with GBM/LGGs, with specific
associations detected with clinical features including IDH1 status,
1p/19q, sex, ethnicity and histological type. These results
demonstrated the possible potential of HIF1α as a diagnostic and
predictive indicator of gliomas. To further evaluate the 1-, 3- and
5-year OS rates of GBM/LGG, a nomogram prognostic model based on
HIF1α expression levels was developed. HIF1α expression greatly
enhanced the prognostic evaluation of patients with gliomas.
Calibration plots, ROC curves and time-dependent ROC curves
confirmed the accurate predictive ability of the nomogram. The
methodology presented in the present study offers a novel
perspective on the evaluation and prediction of outcomes in
patients with GBM/LGG, while providing insights into the
progression of gliomas, new therapeutic targets and prognostic
indicators.
Furthermore, the present study confirmed that HIF1α
was highly expressed in GBM cells and contributed to their
migratory abilities. El-Naggar et al (64) reported that the ability of sarcoma
cells to metastasize may be increased by overexpressing HIF1α.
Similarly, HIF1α can regulate breast cancer metastasis, promoting
its development (65). The present
study demonstrated that HIF1α promoted the migration and, thus, the
malignancy of GBM cells. Vasculogenic mimicry (VM) reportedly
contributes to the growth of many tumor types, including breast
cancer (66), liver cancer
(67) and glioma (68). Under hypoxic conditions, the
mammalian target of rapamycin participates in VM development in
gliomas via HIF1α (69). By
contrast, B cell lymphoma 2 inhibits the formation of VM in gliomas
by suppressing HIF1α-matrix metalloprotease (MMP)-2-MMP-14
signaling pathway activation (70).
Therefore, mechanistically, HIF1α silencing may reduce cell
proliferation and migration by inhibiting microvascular mimicry,
thereby inhibiting glioma progression. This further demonstrates
the potential of HIF1α as a target for the future diagnosis and
treatment of malignancies.
The present study has several limitations. The
molecular mechanisms underlying the effects of HIF1α silencing on
cell migration and proliferation in glioma cells were not
experimentally validated. In vivo experiments are warranted
to verify the correlation between HIF1α expression and glioma
development and elucidate the underlying molecular mechanisms. In
addition, temporary transfection was performed. Hence, future
studies should use stable transfection trials to evaluate the
associated impact of HIF1α knockdown. Moreover, clinical studies
are required to evaluate the relationship between HIF1α expression,
clinical characteristics and patient prognosis, which may aid in
the potential identification of novel markers for monitoring tumor
growth, accelerate the development of new drugs and enhance future
treatment approaches.
The findings of the present study suggested that
poor prognosis in GBM/LGGs was associated with HIF1α
overexpression. HIF1α may affect the proliferation and metastasis
of gliomas by regulating infiltrating immune cells, including
neutrophils, pDCs and CD56bright cells. Hence, HIF1α may
be a potentially promising independent predictive factor and
potential candidate for the treatment of GBM/LGGs.
Supplementary Material
Supporting Data
Acknowledgements
Not applicable.
Funding
This work was funded by The National Natural Science Foundation
of China (grant no. 82260525), The Key Program of the National
Natural Science Foundation of Jiangxi Province (grant no.
20212ACB206015) and The Science and Technology Project of the
Jiangxi Provincial Health Commission (grant no. 202130174).
Availability of data and materials
The datasets used and/or analyzed during the current
study are available from the corresponding author on reasonable
request.
Authors' contributions
JM and CW designed the study and confirm the
authenticity of all the raw data. ZD, JZ and LL gathered and
evaluated the data and prepared the manuscript. ZD and JZ edited
the manuscript. ZD performed the experiments. All authors read and
approved the final version of the manuscript.
Ethics approval and consent to
participate
This study was approved by the medical ethics
committees of the First Affiliated Hospital of Nanchang University
[approval no. (2023)CDYFYYLK(01–018)].
Patient consent for publication
Not applicable.
Competing interests
The authors declare that they have no competing
interests.
Glossary
Abbreviations
Abbreviations:
|
AUC
|
area under the curve
|
|
BP
|
biological process
|
|
CC
|
cellular component
|
|
CCK-8
|
cell counting kit-8
|
|
DEG
|
differentially expressed gene
|
|
DSS
|
disease-specific survival
|
|
GO
|
Gene Ontology
|
|
GBM
|
glioblastoma multiforme
|
|
GTEx
|
Genotype-Tissue Expression
|
|
HIF1α
|
hypoxia-inducible factor 1 subunit
alpha
|
|
HR
|
hazard ratio
|
|
IDH1
|
isocitrate dehydrogenase 1
|
|
IHC
|
immunohistochemistry
|
|
KEGG
|
Kyoto Encyclopedia of Genes and
Genomes
|
|
LGG
|
low-grade glioma
|
|
MF
|
molecular function
|
|
NK
|
natural killer
|
|
OS
|
overall survival
|
|
PFI
|
progression-free interval
|
|
RT-qPCR
|
reverse transcription-quantitative
PCR
|
|
ROC
|
receiver operating characteristic
|
|
TCGA
|
The Cancer Genome Atlas
|
|
VM
|
vasculogenic mimicry
|
|
WHO
|
World Health Organization
|
References
|
1
|
GBD 2016 Brain and Other CNS Cancer
Collaborators: Global, regional, and national burden of brain and
other CNS cancer, 1990–2016: A systematic analysis for the global
burden of disease study 2016. Lancet Neurol. 18:376–393. 2019.
View Article : Google Scholar : PubMed/NCBI
|
|
2
|
Weller M, Wick W, Aldape K, Brada M,
Berger M, Pfister SM, Nishikawa R, Rosenthal M, Wen PY, Stupp R and
Reifenberger G: Glioma. Nat Rev Dis Primers. 1:150172015.
View Article : Google Scholar : PubMed/NCBI
|
|
3
|
Ma R, Taphoorn MJB and Plaha P: Advances
in the management of glioblastoma. J Neurol Neurosurg Psychiatry.
92:1103–1111. 2021. View Article : Google Scholar : PubMed/NCBI
|
|
4
|
Stupp R, Mason WP, van den Bent MJ, Weller
M, Fisher B, Taphoorn MJ, Belanger K, Brandes AA, Marosi C, Bogdahn
U, et al: Radiotherapy plus concomitant and adjuvant temozolomide
for glioblastoma. N Engl J Med. 352:987–996. 2005. View Article : Google Scholar : PubMed/NCBI
|
|
5
|
Jiang T, Nam DH, Ram Z, Poon WS, Wang J,
Boldbaatar D, Mao Y, Ma W, Mao Q, You Y, et al: Clinical practice
guidelines for the management of adult diffuse gliomas. Cancer
Lett. 499:60–72. 2021. View Article : Google Scholar : PubMed/NCBI
|
|
6
|
Stupp R, Brada M, van den Bent MJ, Tonn JC
and Pentheroudakis G; ESMO Guidelines Working Group. High-grade
glioma, : ESMO clinical practice guidelines for diagnosis,
treatment and follow-up. Ann Oncol. 25 (Suppl 3):iii93–iii101.
2014. View Article : Google Scholar : PubMed/NCBI
|
|
7
|
Ferlay J, Colombet M, Soerjomataram I,
Mathers C, Parkin DM, Pineros M, Znaor A and Bray F: Estimating the
global cancer incidence and mortality in 2018: GLOBOCAN sources and
methods. Int J Cancer. 144:1941–1953. 2019. View Article : Google Scholar : PubMed/NCBI
|
|
8
|
Daumas-Duport C, Scheithauer B, O'Fallon J
and Kelly P: Grading of astrocytomas. A simple and reproducible
method. Cancer. 62:2152–2165. 1988. View Article : Google Scholar : PubMed/NCBI
|
|
9
|
Louis DN, Perry A, Reifenberger G, von
Deimling A, Figarella-Branger D, Cavenee WK, Ohgaki H, Wiestler OD,
Kleihues P and Ellison DW: The 2016 world health organization
classification of tumors of the central nervous system: A summary.
Acta Neuropathol. 131:803–820. 2016. View Article : Google Scholar : PubMed/NCBI
|
|
10
|
Cancer Genome Atlas Research Network, .
Brat DJ, Verhaak RG, Aldape KD, Yung WK, Salama SR, Cooper LAD,
Rheinbay E, Miller CR, Vitucci M, et al: Comprehensive, integrative
genomic analysis of diffuse lower-grade gliomas. N Engl J Med.
372:2481–2498. 2015. View Article : Google Scholar : PubMed/NCBI
|
|
11
|
Stummer W, Meinel T, Ewelt C, Martus P,
Jakobs O, Felsberg J and Reifenberger G: Prospective cohort study
of radiotherapy with concomitant and adjuvant temozolomide
chemotherapy for glioblastoma patients with no or minimal residual
enhancing tumor load after surgery. J Neurooncol. 108:89–97. 2012.
View Article : Google Scholar : PubMed/NCBI
|
|
12
|
Jain RK, Martin JD and Stylianopoulos T:
The role of mechanical forces in tumor growth and therapy. Annu Rev
Biomed Eng. 16:321–346. 2014. View Article : Google Scholar : PubMed/NCBI
|
|
13
|
Yang P, Wang Y, Peng X, You G, Zhang W,
Yan W, Bao Z, Wang Y, Qiu X and Jiang T: Management and survival
rates in patients with glioma in China (2004–2010): A retrospective
study from a single-institution. J Neurooncol. 113:259–266. 2013.
View Article : Google Scholar : PubMed/NCBI
|
|
14
|
Wang S, Wu W, Lin X, Zhang KM, Wu Q, Luo M
and Zhou J: Predictive and prognostic biomarkers of bone metastasis
in breast cancer: Current status and future directions. Cell
Biosci. 13:2242023. View Article : Google Scholar : PubMed/NCBI
|
|
15
|
Greer SN, Metcalf JL, Wang Y and Ohh M:
The updated biology of hypoxia-inducible factor. EMBO J.
31:2448–2460. 2012. View Article : Google Scholar : PubMed/NCBI
|
|
16
|
Kenneth NS and Rocha S: Regulation of gene
expression by hypoxia. Biochem J. 414:19–29. 2008. View Article : Google Scholar : PubMed/NCBI
|
|
17
|
Wang GL, Jiang BH, Rue EA and Semenza GL:
Hypoxia-inducible factor 1 is a basic-helix-loop-helix-PAS
heterodimer regulated by cellular O2 tension. Proc Natl Acad Sci
USA. 92:5510–5514. 1995. View Article : Google Scholar : PubMed/NCBI
|
|
18
|
Iyer NV, Kotch LE, Agani F, Leung SW,
Laughner E, Wenger RH, Gassmann M, Gearhart JD, Lawler AM, Yu AY
and Semenza GL: Cellular and developmental control of O2
homeostasis by hypoxia-inducible factor 1 alpha. Genes Dev.
12:149–162. 1998. View Article : Google Scholar : PubMed/NCBI
|
|
19
|
Keith B, Johnson RS and Simon MC: HIF1α
and HIF2α: Sibling rivalry in hypoxic tumour growth and
progression. Nat Rev Cancer. 12:9–22. 2011. View Article : Google Scholar : PubMed/NCBI
|
|
20
|
Semenza GL: Hypoxia-inducible factors in
physiology and medicine. Cell. 148:399–408. 2012. View Article : Google Scholar : PubMed/NCBI
|
|
21
|
Semenza GL: Defining the role of
hypoxia-inducible factor 1 in cancer biology and therapeutics.
Oncogene. 29:625–634. 2010. View Article : Google Scholar : PubMed/NCBI
|
|
22
|
Polyak K, Haviv I and Campbell IG:
Co-evolution of tumor cells and their microenvironment. Trends
Genet. 25:30–38. 2009. View Article : Google Scholar : PubMed/NCBI
|
|
23
|
Okada M, Saio M, Kito Y, Ohe N, Yano H,
Yoshimura S, Iwama T and Takami T: Tumor-associated
macrophage/microglia infiltration in human gliomas is correlated
with MCP-3, but not MCP-1. Int J Oncol. 34:1621–1627.
2009.PubMed/NCBI
|
|
24
|
Platten M, Kretz A, Naumann U, Aulwurm S,
Egashira K, Isenmann S and Weller M: Monocyte chemoattractant
protein-1 increases microglial infiltration and aggressiveness of
gliomas. Ann Neurol. 54:388–392. 2003. View Article : Google Scholar : PubMed/NCBI
|
|
25
|
Reuss AM, Groos D, Buchfelder M and
Savaskan N: The acidic brain-glycolytic switch in the
microenvironment of malignant glioma. Int J Mol Sci. 22:55182021.
View Article : Google Scholar : PubMed/NCBI
|
|
26
|
Palazon A, Goldrath AW, Nizet V and
Johnson RS: HIF transcription factors, inflammation, and immunity.
Immunity. 41:518–528. 2014. View Article : Google Scholar : PubMed/NCBI
|
|
27
|
Love MI, Huber W and Anders S: Moderated
estimation of fold change and dispersion for RNA-seq data with
DESeq2. Genome Biol. 15:5502014. View Article : Google Scholar : PubMed/NCBI
|
|
28
|
Kanehisa M and Goto S: KEGG: kyoto
encyclopedia of genes and genomes. Nucleic Acids Res. 28:27–30.
2000. View Article : Google Scholar : PubMed/NCBI
|
|
29
|
Yu G, Wang LG, Han Y and He QY:
clusterProfiler: An R package for comparing biological themes among
gene clusters. OMICS. 16:284–287. 2012. View Article : Google Scholar : PubMed/NCBI
|
|
30
|
Subramanian A, Tamayo P, Mootha VK,
Mukherjee S, Ebert BL, Gillette MA, Paulovich A, Pomeroy SL, Golub
TR, Lander ES and Mesirov JP: Gene set enrichment analysis: A
knowledge-based approach for interpreting genome-wide expression
profiles. Proc Natl Acad Sci USA. 102:15545–15550. 2005. View Article : Google Scholar : PubMed/NCBI
|
|
31
|
Hanzelmann S, Castelo R and Guinney J:
GSVA: Gene set variation analysis for microarray and RNA-seq data.
BMC Bioinformatics. 14:72013. View Article : Google Scholar : PubMed/NCBI
|
|
32
|
Bindea G, Mlecnik B, Tosolini M,
Kirilovsky A, Waldner M, Obenauf AC, Angell H, Fredriksen T,
Lafontaine L, Berger A, et al: Spatiotemporal dynamics of
intratumoral immune cells reveal the immune landscape in human
cancer. Immunity. 39:782–795. 2013. View Article : Google Scholar : PubMed/NCBI
|
|
33
|
Ceccarelli M, Barthel FP, Malta TM,
Sabedot TS, Salama SR, Murray BA, Morozova O, Newton Y, Radenbaugh
A, Pagnotta SM, et al: Molecular profiling reveals biologically
discrete subsets and pathways of progression in diffuse glioma.
Cell. 164:550–563. 2016. View Article : Google Scholar : PubMed/NCBI
|
|
34
|
Liu J, Lichtenberg T, Hoadley KA, Poisson
LM, Lazar AJ, Cherniack AD, Kovatich AJ, Benz CC, Levine DA, Lee
AV, et al: An integrated TCGA pan-cancer clinical data resource to
drive high-quality survival outcome analytics. Cell.
173:400–416.e11. 2018. View Article : Google Scholar : PubMed/NCBI
|
|
35
|
Alba AC, Agoritsas T, Walsh M, Hanna S,
Iorio A, Devereaux PJ, McGinn T and Guyatt G: Discrimination and
calibration of clinical prediction models: Users' guides to the
medical literature. JAMA. 318:1377–1384. 2017. View Article : Google Scholar : PubMed/NCBI
|
|
36
|
Livak KJ and Schmittgen TD: Analysis of
relative gene expression data using real-time quantitative PCR and
the 2(−Delta Delta C(T)) method. Methods. 25:402–408. 2001.
View Article : Google Scholar : PubMed/NCBI
|
|
37
|
Deng B, Zhu JM, Wang Y, Liu TT, Ding YB,
Xiao WM, Lu GT, Bo P and Shen XZ: Intratumor hypoxia promotes
immune tolerance by inducing regulatory T cells via TGF-β1 in
gastric cancer. PLoS One. 8:e637772013. View Article : Google Scholar : PubMed/NCBI
|
|
38
|
Liao Y, Luo Z, Lin Y, Chen H, Chen T, Xu
L, Orgurek S, Berry K, Dzieciatkowska M, Reisz JA, et al: PRMT3
drives glioblastoma progression by enhancing HIF1A and glycolytic
metabolism. Cell Death Dis. 13:9432022. View Article : Google Scholar : PubMed/NCBI
|
|
39
|
Ding XC, Wang LL, Zhang XD, Xu JL, Li PF,
Liang H, Zhang XB, Xie L, Zhou ZH, Yang J, et al: The relationship
between expression of PD-L1 and HIF-1α in glioma cells under
hypoxia. J Hematol Oncol. 14:922021. View Article : Google Scholar : PubMed/NCBI
|
|
40
|
Wang P, Wan W, Xiong S, Wang J, Zou D, Lan
C, Yu S, Liao B, Feng H and Wu N: HIF1α regulates glioma
chemosensitivity through the transformation between differentiation
and dedifferentiation in various oxygen levels. Sci Rep.
7:79652017. View Article : Google Scholar : PubMed/NCBI
|
|
41
|
Semenza GL: Targeting HIF-1 for cancer
therapy. Nat Rev Cancer. 3:721–732. 2003. View Article : Google Scholar : PubMed/NCBI
|
|
42
|
Vaupel P and Mayer A: Hypoxia in cancer:
Significance and impact on clinical outcome. Cancer Metastasis Rev.
26:225–239. 2007. View Article : Google Scholar : PubMed/NCBI
|
|
43
|
Tachibana KE, Gonzalez MA and Coleman N:
Cell-cycle-dependent regulation of DNA replication and its
relevance to cancer pathology. J Pathol. 205:123–129. 2005.
View Article : Google Scholar : PubMed/NCBI
|
|
44
|
Chen J, Xia Y, Peng Y, Wu S, Liu W, Zhang
H, Wang T, Yang Z, Zhao S and Zhao L: Analysis of the association
between KIN17 expression and the clinical features/prognosis of
epithelial ovarian cancer, and the effects of KIN17 in SKOV3 cells.
Oncol Lett. 21:4752021. View Article : Google Scholar : PubMed/NCBI
|
|
45
|
Forde PM, Chaft JE, Smith KN, Anagnostou
V, Cottrell TR, Hellmann MD, Zahurak M, Yang SC, Jones DR,
Broderick S, et al: Neoadjuvant PD-1 blockade in resectable lung
cancer. N Engl J Med. 378:1976–1986. 2018. View Article : Google Scholar : PubMed/NCBI
|
|
46
|
Leighl NB, Hellmann MD, Hui R, Carcereny
E, Felip E, Ahn MJ, Eder JP, Balmanoukian AS, Aggarwal C, Horn L,
et al: Pembrolizumab in patients with advanced non-small-cell lung
cancer (KEYNOTE-001): 3-year results from an open-label, phase 1
study. Lancet Respir Med. 7:347–357. 2019. View Article : Google Scholar : PubMed/NCBI
|
|
47
|
Rini BI, Powles T, Atkins MB, Escudier B,
McDermott DF, Suarez C, Bracarda S, Stadler WM, Donskov F, Lee JL,
et al: Atezolizumab plus bevacizumab versus sunitinib in patients
with previously untreated metastatic renal cell carcinoma
(IMmotion151): A multicentre, open-label, phase 3, randomised
controlled trial. Lancet. 393:2404–2415. 2019. View Article : Google Scholar : PubMed/NCBI
|
|
48
|
Colegio OR, Chu NQ, Szabo AL, Chu T,
Rhebergen AM, Jairam V, Cyrus N, Brokowski CE, Eisenbarth SC,
Phillips GM, et al: Functional polarization of tumour-associated
macrophages by tumour-derived lactic acid. Nature. 513:559–563.
2014. View Article : Google Scholar : PubMed/NCBI
|
|
49
|
Dang EV, Barbi J, Yang HY, Jinasena D, Yu
H, Zheng Y, Bordman Z, Fu J, Kim Y, Yen HR, et al: Control of
T(H)17/T(reg) balance by hypoxia-inducible factor 1. Cell.
146:772–784. 2011. View Article : Google Scholar : PubMed/NCBI
|
|
50
|
Doedens AL, Phan AT, Stradner MH, Fujimoto
JK, Nguyen JV, Yang E, Johnson RS and Goldrath AW:
Hypoxia-inducible factors enhance the effector responses of CD8(+)
T cells to persistent antigen. Nat Immunol. 14:1173–1182. 2013.
View Article : Google Scholar : PubMed/NCBI
|
|
51
|
Mascanfroni ID, Takenaka MC, Yeste A,
Patel B, Wu Y, Kenison JE, Siddiqui S, Basso AS, Otterbein LE,
Pardoll DM, et al: Metabolic control of type 1 regulatory T cell
differentiation by AHR and HIF1-alpha. Nat Med. 21:638–646. 2015.
View Article : Google Scholar : PubMed/NCBI
|
|
52
|
Li MO, Wolf N, Raulet DH, Akkari L, Pittet
MJ, Rodriguez PC, Kaplan RN, Munitz A, Zhang Z, Cheng S and
Bhardwaj N: Innate immune cells in the tumor microenvironment.
Cancer Cell. 39:725–729. 2021. View Article : Google Scholar : PubMed/NCBI
|
|
53
|
Shaul ME and Fridlender ZG:
Tumour-associated neutrophils in patients with cancer. Nat Rev Clin
Oncol. 16:601–620. 2019. View Article : Google Scholar : PubMed/NCBI
|
|
54
|
Tian S, Chu Y, Hu J, Ding X, Liu Z, Fu D,
Yuan Y, Deng Y, Wang G, Wang L and Wang Z: Tumour-associated
neutrophils secrete AGR2 to promote colorectal cancer metastasis
via its receptor CD98hc-xCT. Gut. 71:2489–2501. 2022. View Article : Google Scholar : PubMed/NCBI
|
|
55
|
Liang J, Piao Y, Holmes L, Fuller GN,
Henry V, Tiao N and de Groot JF: Neutrophils promote the malignant
glioma phenotype through S100A4. Clin Cancer Res. 20:187–198. 2014.
View Article : Google Scholar : PubMed/NCBI
|
|
56
|
Lanier LL: NK cell recognition. Annu Rev
Immunol. 23:225–274. 2005. View Article : Google Scholar : PubMed/NCBI
|
|
57
|
Saulep-Easton D, Vincent FB, Le Page M,
Wei A, Ting SB, Croce CM, Tam C and Mackay F: Cytokine-driven loss
of plasmacytoid dendritic cell function in chronic lymphocytic
leukemia. Leukemia. 28:2005–2015. 2014. View Article : Google Scholar : PubMed/NCBI
|
|
58
|
Michel T, Poli A, Cuapio A, Briquemont B,
Iserentant G, Ollert M and Zimmer J: Human CD56bright NK cells: An
update. J Immunol. 196:2923–2931. 2016. View Article : Google Scholar : PubMed/NCBI
|
|
59
|
Montaldo E, Vacca P, Moretta L and Mingari
MC: Development of human natural killer cells and other innate
lymphoid cells. Semin Immunol. 26:107–113. 2014. View Article : Google Scholar : PubMed/NCBI
|
|
60
|
Goodman A, Patel SP and Kurzrock R:
PD-1-PD-L1 immune-checkpoint blockade in B-cell lymphomas. Nat Rev
Clin Oncol. 14:203–220. 2017. View Article : Google Scholar : PubMed/NCBI
|
|
61
|
Krummel MF and Allison JP: CTLA-4
engagement inhibits IL-2 accumulation and cell cycle progression
upon activation of resting T cells. J Exp Med. 183:2533–2540. 1996.
View Article : Google Scholar : PubMed/NCBI
|
|
62
|
Hodi FS, O'Day SJ, McDermott DF, Weber RW,
Sosman JA, Haanen JB, Gonzalez R, Robert C, Schadendorf D, Hassel
JC, et al: Improved survival with ipilimumab in patients with
metastatic melanoma. N Engl J Med. 363:711–723. 2010. View Article : Google Scholar : PubMed/NCBI
|
|
63
|
Long GV, Weber JS, Larkin J, Atkinson V,
Grob JJ, Schadendorf D, Dummer R, Robert C, Márquez-Rodas I, McNeil
C, et al: Nivolumab for patients with advanced melanoma treated
beyond progression: Analysis of 2 phase 3 clinical trials. JAMA
Oncol. 3:1511–1519. 2017. View Article : Google Scholar : PubMed/NCBI
|
|
64
|
El-Naggar AM, Veinotte CJ, Cheng H,
Grunewald TG, Negri GL, Somasekharan SP, Corkery DP, Tirode F,
Mathers J, Khan D, et al: Translational activation of HIF1α by YB-1
promotes sarcoma metastasis. Cancer Cell. 27:682–697. 2015.
View Article : Google Scholar : PubMed/NCBI
|
|
65
|
Liu ZJ, Semenza GL and Zhang HF:
Hypoxia-inducible factor 1 and breast cancer metastasis. J Zhejiang
Univ Sci B. 16:32–43. 2015. View Article : Google Scholar : PubMed/NCBI
|
|
66
|
Xu J, Yang X, Deng Q, Yang C, Wang D,
Jiang G, Yao X, He X, Ding J, Qiang J, et al: TEM8 marks
neovasculogenic tumor-initiating cells in triple-negative breast
cancer. Nat Commun. 12:44132021. View Article : Google Scholar : PubMed/NCBI
|
|
67
|
Qiao K, Liu Y, Xu Z, Zhang H, Zhang H,
Zhang C, Chang Z, Lu X, Li Z, Luo C, et al: RNA m6A methylation
promotes the formation of vasculogenic mimicry in hepatocellular
carcinoma via Hippo pathway. Angiogenesis. 24:83–96. 2021.
View Article : Google Scholar : PubMed/NCBI
|
|
68
|
Yue WY and Chen ZP: Does vasculogenic
mimicry exist in astrocytoma? J Histochem Cytochem. 53:997–1002.
2005. View Article : Google Scholar : PubMed/NCBI
|
|
69
|
Huang M, Ke Y, Sun X, Yu L, Yang Z, Zhang
Y, Du M, Wang J, Liu X and Huang S: Mammalian target of rapamycin
signaling is involved in the vasculogenic mimicry of glioma via
hypoxia-inducible factor-1alpha. Oncol Rep. 32:1973–1980. 2014.
View Article : Google Scholar : PubMed/NCBI
|
|
70
|
Li J, Ke Y, Huang M, Huang S and Liang Y:
Inhibitory effects of B-cell lymphoma 2 on the vasculogenic mimicry
of hypoxic human glioma cells. Exp Ther Med. 9:977–981. 2015.
View Article : Google Scholar : PubMed/NCBI
|