Introduction
A complex process for the immune system is
preserving the integrity of the ‘self’, while protecting the ‘self
from ‘non-self’ and dangerous invaders (1). Tumors, which are derived from the
‘self’, exhibit a high proliferative potential and present a marked
risk to the host. In addition, due to the high mutation rate, it is
difficult for the immune system to respond; therefore, immune
escape may occur.
On identification of ‘non-self’ in the body, the
immune system initiates a series of responses to eliminate the
‘non-self’, during which various immune factors are synthesized,
including major histocompatibility complex class I chain-related
(MIC) molecules and natural killer group 2 member D (NKG2D). The
MIC family consists of seven members, however, only MIC A and MIC B
encode proteins (2). The MIC A/B
proteins are located in the cell membrane and act as ligands for
NKG2D. They are rarely expressed by normal cells, however, are
broadly expressed in a variety of malignancies (3–5). NKG2D
is the receptor that is expressed on natural killer (NK) cells.
Following ligand binding, the receptor transfers the signal
downstream to activate the cytotoxic activity of the NK cells
(6–8).
Nitric oxide (NO), a highly soluble gas, is
generated from L-arginine and oxygen, which is catalyzed by NO
synthase (9). The generated NO
activates soluble guanylyl cyclase (sGC) (10–14),
which leads to the formation of cyclic guanosine monophosphate
(cGMP), which in turn activates the cGMP-dependent protein kinase
(PKG) and downstream effectors. Previous studies have revealed that
NO inhibition of tumor growth may occur as a result of the
generation of hydroxyl radicals, inactivation of enzymes involved
in the respiratory chain or failure to replicate.
Materials and methods
Materials
TRIzol was purchased from Invitrogen Life
Technologies (Carlsbad, CA, USA) and M-MLV reverse transcriptase
was purchased from Promega Corporation (Madison, WI, USA). MIC A/B
and NKG2D mouse anti-human monoclonal antibodies were purchased
from Santa Cruz Biotechnology, Inc. (Santa Cruz, CA, USA),
hypoxia-inducible factor 1-α (HIF-1α) rabbit anti-human polyclonal
antibody was purchased from Boster Systems Inc. (Pleasanton, CA,
USA) and glyceryl trinitrate (GTN) transdermal patches were
purchased from Schwarz Pharma (Brussels, Belgium).
Cell culture
A PANC-1 cell line was obtained from the Shanghai
Institute of Biological Sciences (Shanghai, China) and maintained
in a monolayer culture in Dulbecco’s modified Eagle’s medium
supplemented with 20% fetal bovine serum (FBS). The study was
approved by the ethics committee of Central South University
(Changsha, China).
Analysis of tumorigenicity
All mice used were handled in compliance with the
guide for the care and use of laboratory animals. A total of 32
nude mice were divided into two groups; a GTN and a placebo group.
The mice were subcutaneously injected with 2×10⁷ cells
and tumor size was measured using a caliper. The tumor volume was
calculated using the following formula: Tumor volume
(mm3) = [(width)2 × length]/2. When tumors
had grown to a volume of 150 mm3 the GTN group was
treated with GTN transdermal patches (dose, 7.3 μg/h) while the
mice in the placebo group were administered untreated patches.
Immunohistochemistry
Tumor samples were fixed with 10% paraformaldehyde
and embedded in paraffin. Samples were cut into sections
(thickness, 4-μm) using a Leica-RM2135 rotary microtome (Leica,
Mannheim, Germany) and adhered to microscope slides. The sections
were dewaxed and washed three times with phosphate-buffered saline
(PBS). For non-specific blocking, sections were incubated in 10%
normal goat serum for 30 min at 37°C and incubated overnight with
the primary polyclonal rabbit anti-human HIF-1α and monoclonal
mouse anti-human MIC A/B antibodies at 4°C (Santa Cruz
Biotechnology, Inc.). Following three washes with PBS, the sections
were incubated in secondary mouse polyclonal anti-rabbit and goat
anti-mouse antibodies conjugated to biotin and horseradish
peroxidase (HRP) marked polyclonal anti-biotin for 30 min at 37°C
(Santa Cruz Biotechnology, Inc.). Next, the samples were incubated
in freshly prepared 3,3′-diaminobenzidine and counterstained with
hematoxylin. Finally, samples were observed under an optical
microscope (CX41, Olympus Corporation, Tokyo, Japan).
The positive reaction for the MIC A/B protein
results in is yellow or brown granules, located in the cell
membrane and/or the cytoplasm. Briefly, each slice was randomly
selected and 10 were viewed under a high-power field, the following
staining intensity score was used: 0, negative staining, all cancer
cells without staining; 1, weak positive staining, found in <20%
of cells. In a high power field the staining is markedly strong in
the cells compared with the interstitial tissue; 2, strong positive
staining, staining was markedly stronger in all cancer cells
compared with the interstitial tissue. MIC A/B expression was
subsequently divided as follows: 0–1 points, low expression group;
2 points, high expression group.
The positive result for the HIF-1α protein is the
observation of brown particles in the nucleus or cytoplasm. The
entire slice was viewed under a light microscope, (magnification,
×400) were randomly observed in 10 visual fields. The staining
score used was as follows: (−), no staining, or <1% nuclear
staining; (+), 1–10% nuclear staining and/or weak cytoplasmic
staining; (+), 10–50% nuclear staining and/or distinct cytoplasmic
staining; (+++): >50% nuclear staining and/or strong cytoplasmic
staining. (−)/(+) Low expression; (+)/(++) high expression.
Reverse transcription (RT)-polymerase
chain reaction (PCR)
All RNAs were extracted with TRIzol. RT was
conducted using 1 μg total RNA and the following oligo (dT)
primers: Forward, 5′-AGGTACATCTGGATGGTCAG-3′ and reverse,
5′-TTGTCTTCATGGATCTCACA-3′ for homo-MIC A, yielding an amplified
fragment of 232 bp; forward, 5′-CTTCGTTACAACCTCATGGT-3′ and
reverse, 5′-ATATGAGTCAG GGTCCTCCT-3′ for homo-MIC B, yielding an
amplified fragment of 227 bp; and forward,
5′-ACCACAGTCCATGCCATCAC-3′ and reverse, 5′-TCCACCACCCTGTTGCTGTA-3′
for homo-GAPDH, yielding an amplified fragment of 450 bp. A total
of 40 cycles of PCR were performed at an annealing temperature of
54°C.
Western blot analysis
Total proteins were extracted from the tumor tissues
and the protein concentration was determined using the Bradford
method (15). A total of 50 μg
protein was loaded per lane. Following electrophoresis, all
proteins were transferred to a cellulose acetate membrane (Koch
Membrane Systems, Inc., Wilmington, MA, USA) and the membrane was
blocked with 5% non-fat milk in PBS overnight at 4°C. The following
day, the blot was incubated with a primary monoclonal mouse
anti-human antibody (1:1,000; Santa Cruz Biotechnology, Inc.) for 2
h at 37°C and washed three times with PBS. Next, the blot was
incubated with a HRP-conjugated goat anti-mouse secondary antibody
(1:2,000; Santa Cruz Biotechnology, Inc.) for 1 h at 37°C and X-ray
films were used to observe the bands of the western blot. The
proteins were analysed using Scion Image version 4.0.3.2 (Scion
Corporation, Frederick, MD, USA). The protein content was observed
relative to that of the GAPDH control band.
ELISA
Two non-overlapping-epitope antibodies were used.
Plates were coated with the primary mouse anti-human MIC A/B
antibody overnight at 4°C, blocked with 5% FBS for 2 h at 37°C and
washed with PBS. Next, samples were added and incubated for 1 h at
37°C. The plates were washed with PBS and incubated with the
secondary mouse anti-human antibody conjugated with HRP for 1 h at
37°C. Finally, the substrate was added and the absorbance was
measured at a wavelength of 450 nm using ELISA (DU640, Beckman
Coulter, Miami, FL, USA).
Flow cytometry
Blood was collected from the eye of the mice.
Antibodies conjugated with fluorochrome were added and incubated
for 20 min at room temperature in the absence of visible light.
Next, hemolysin was added and the samples were centrifuged (JM-6,
Beckman Coulter) at 1,000 × g for 5 min to obtain the precipitates.
Following three washes with PBS, the cells were resuspended with 1%
paraformaldehyde and analyzed using a BD FACSCaliburTM
flow cytometer (BD Biosciences, Franklin Lakes, NJ, USA).
Statistical analysis
All statistical analyses were performed using the
SPSS 13.0 statistical software package (SPSS, Inc., Chicago, IL,
USA). Differences between groups were compared using a single
factor analysis of variance and Student’s t-test. P<0.05 was
considered to indicate a statistically significant difference.
Results
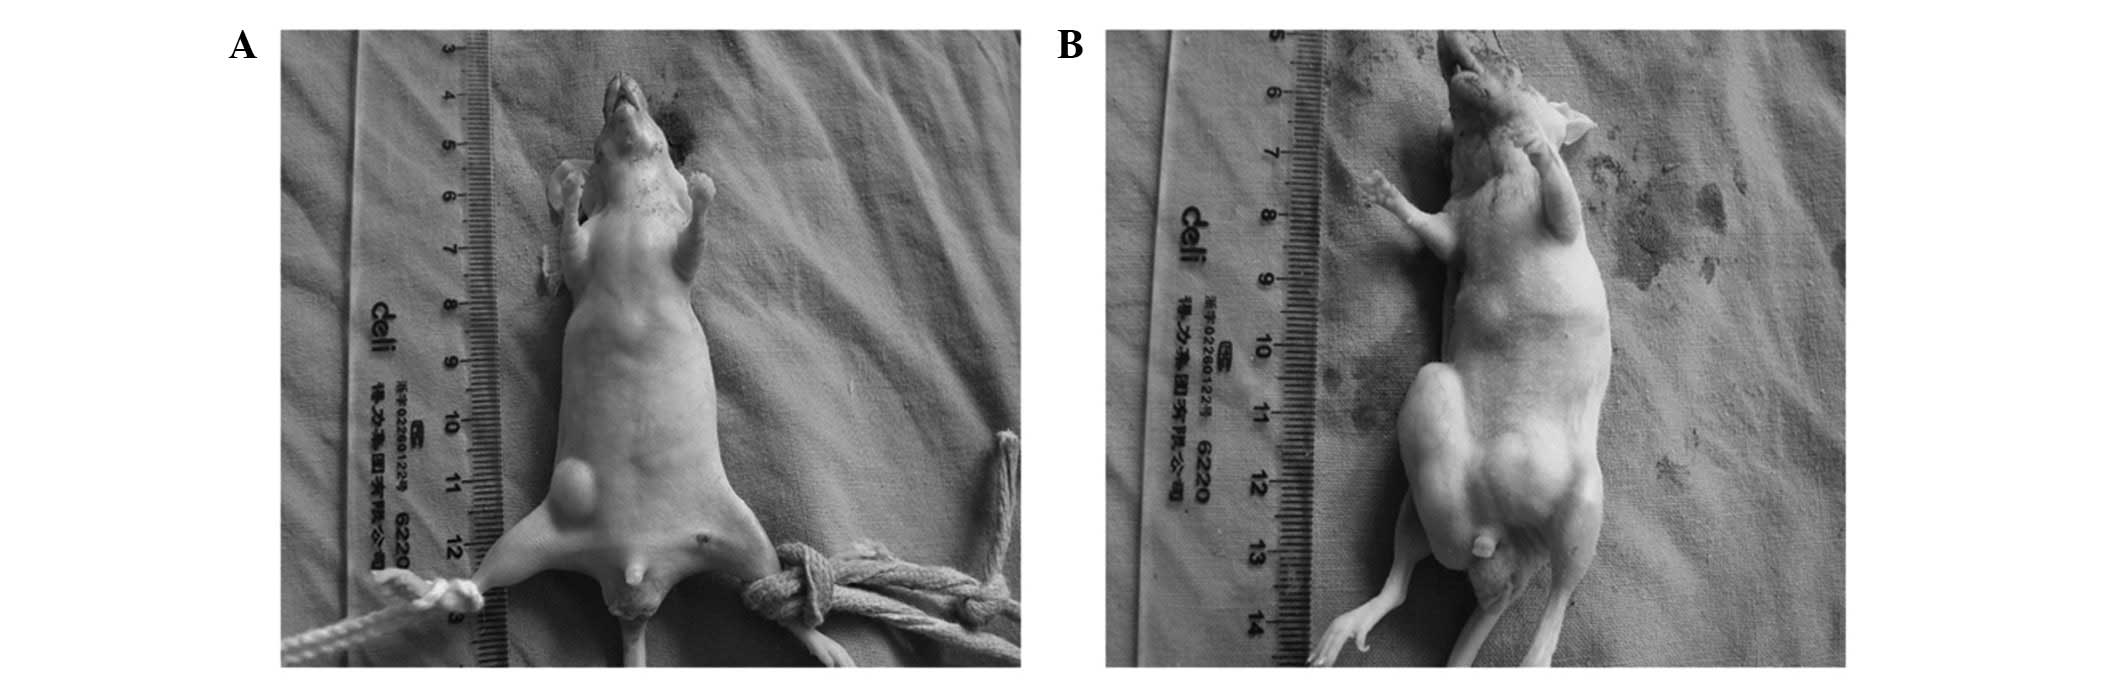
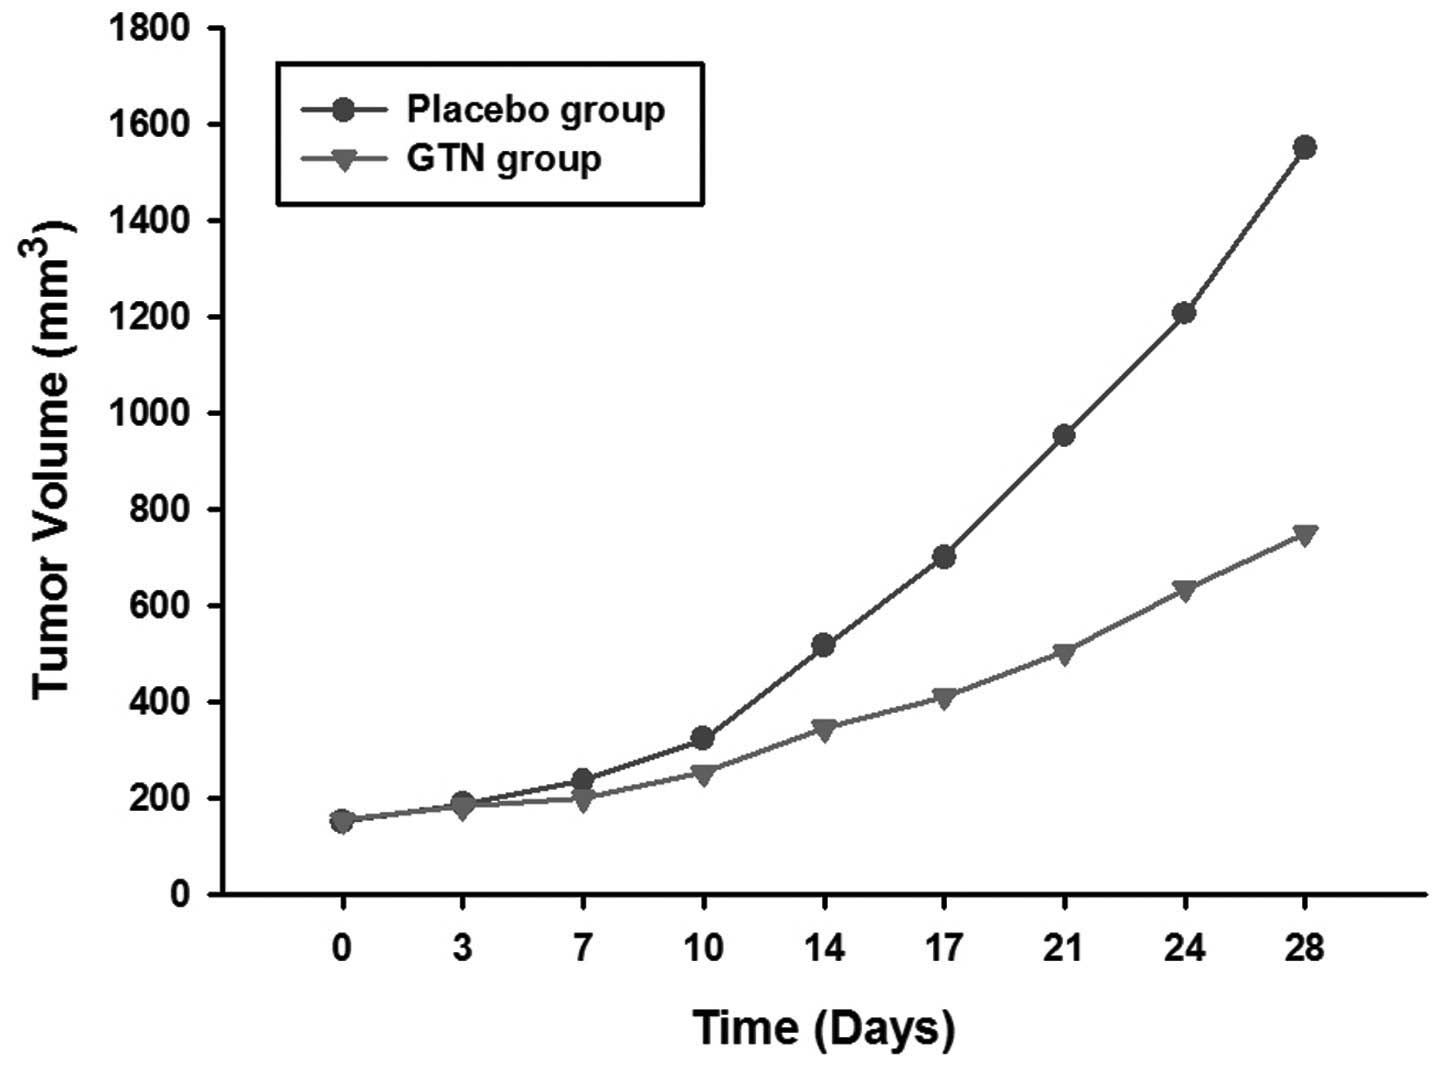
Effect of GTN on tumor growth
The mice were sacrificed following 28 days of
treatment. It was found that the tumors of the GTN group were
markedly smaller than those of the placebo group (Figs. 1 and 2; Table I)
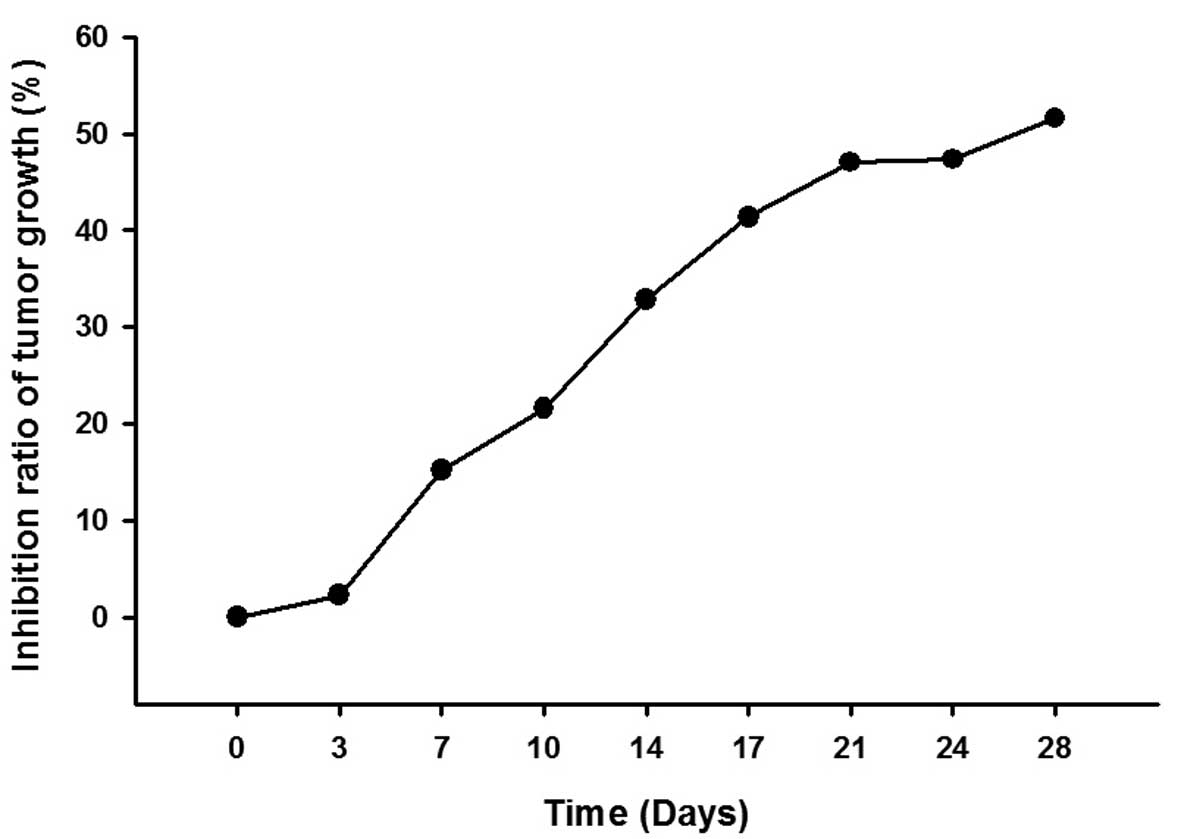
and the inhibition ratio of tumor growth increased in a
time-dependent manner (Fig. 3 and
Table II).
 | Table ITumor volumes for each group. |
Table I
Tumor volumes for each group.
| Tumor volume ±
standard deviation, mm3 |
|---|
|
|
|---|
| Time following
treatment, days | Placebo group | Glycerol trinitrate
group |
|---|
| 0 | 152.3±10.3 | 155.0±12.6 |
| 3 | 187.5±20.1 | 183.3±16.2 |
| 7 | 236.3±21.2 | 200.5±19.4 |
| 10 | 323.6±35.7 | 253.8±26.1 |
| 14 | 515.9±42.0 | 346.3±34.1 |
| 17 | 700.5±74.2 | 410.8±46.4 |
| 21 | 952.2±110.3 | 504.3±51.5 |
| 24 | 1206.4±116.5 | 635.4±61.0 |
| 28 | 1550.4±148.6 | 750.6±71.2 |
| Table IIMean inhibition ratio of tumor
growth. |
Table II
Mean inhibition ratio of tumor
growth.
| Time following
treatment, days | Inhibition ratio
(%) |
|---|
| 0 | 0 |
| 3 | 2.24 |
| 7 | 15.15 |
| 10 | 21.57 |
| 14 | 32.87 |
| 17 | 41.36 |
| 21 | 47.04 |
| 24 | 47.33 |
| 28 | 51.59 |
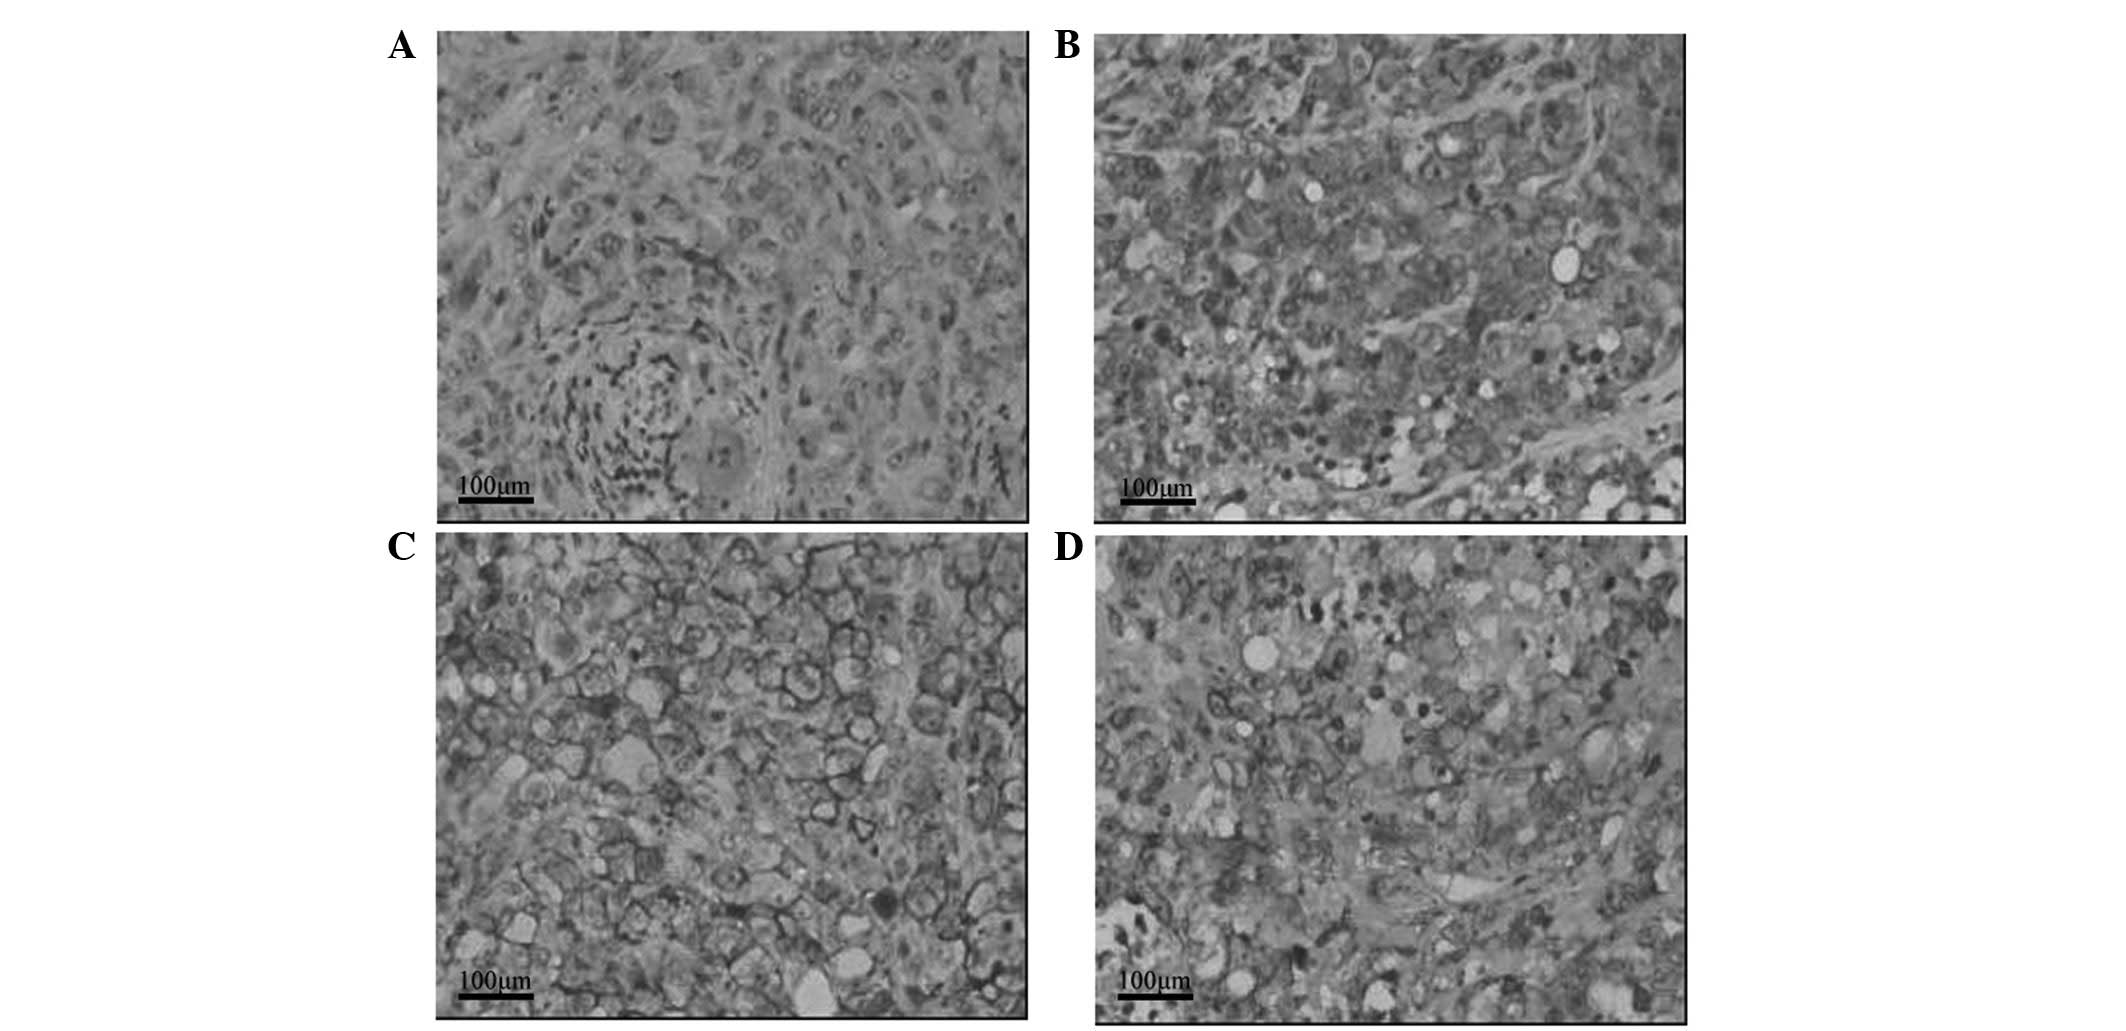
Effect of GTN on HIF-1α and MIC
expression in tumors
As shown in Table
III, HIF-1α expression was lower in the GTN group (8/16 mice)
than that of the placebo group (14/16 mice). Notably, 12/16 mice
from the GTN group highly expressed MIC when compared with the
placebo group, whereby only two mice expressed MIC. Furthermore,
immunohistochemical analysis revealed that HIF-1α expression was
lower in the GTN group and MIC expression was higher, when compared
with that of the placebo group (Fig.
4). Furthermore, HIF-1α and MIC were found to be negatively
correlated (Table IV).
| Table IIIExpression of HIF-1α and MIC proteins
in the tumors. |
Table III
Expression of HIF-1α and MIC proteins
in the tumors.
| | HIF-1α | MIC |
|---|
| |
|
|
|---|
| Group | n | − | + | ++ | +++ | P-value | 0a | 1a | 2a | P-value |
|---|
| GTN | 16 | 8 | 7 | 1 | 0 | <0.001 | 1 | 3 | 12 | 0.015 |
| Placebo | 16 | 2 | 2 | 4 | 8 | | 2 | 12 | 2 | |
| Table IVCorrelation between HIF-1α and MIC
expression in the tumors. |
Table IV
Correlation between HIF-1α and MIC
expression in the tumors.
| Expression | | |
|---|
|
| | |
|---|
| Expression | MIC 0/1a | MIC 2a | r | P-value |
|---|
| HIF-1α | | | −0.601 | <0.001 |
| −/+ | 6 | 13 | | |
| ++/+++ | 12 | 1 | | |
| Total | 18 | 14 | | |
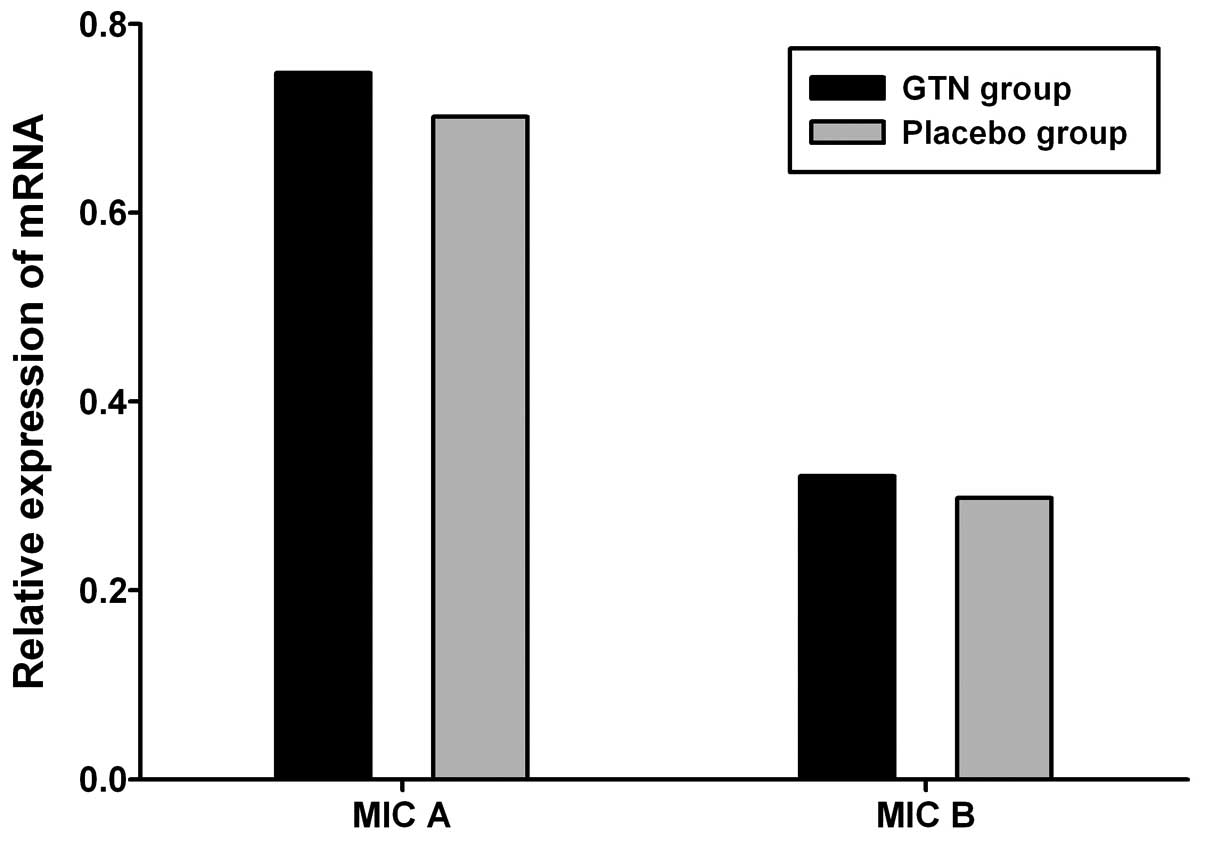
Effect of GTN on MIC A/B expression in
tumors
To investigate the effect of GTN on MIC A/B
expression, total RNA and protein was extracted from the tumors. No
significant difference in MIC A/B mRNA expression was identified
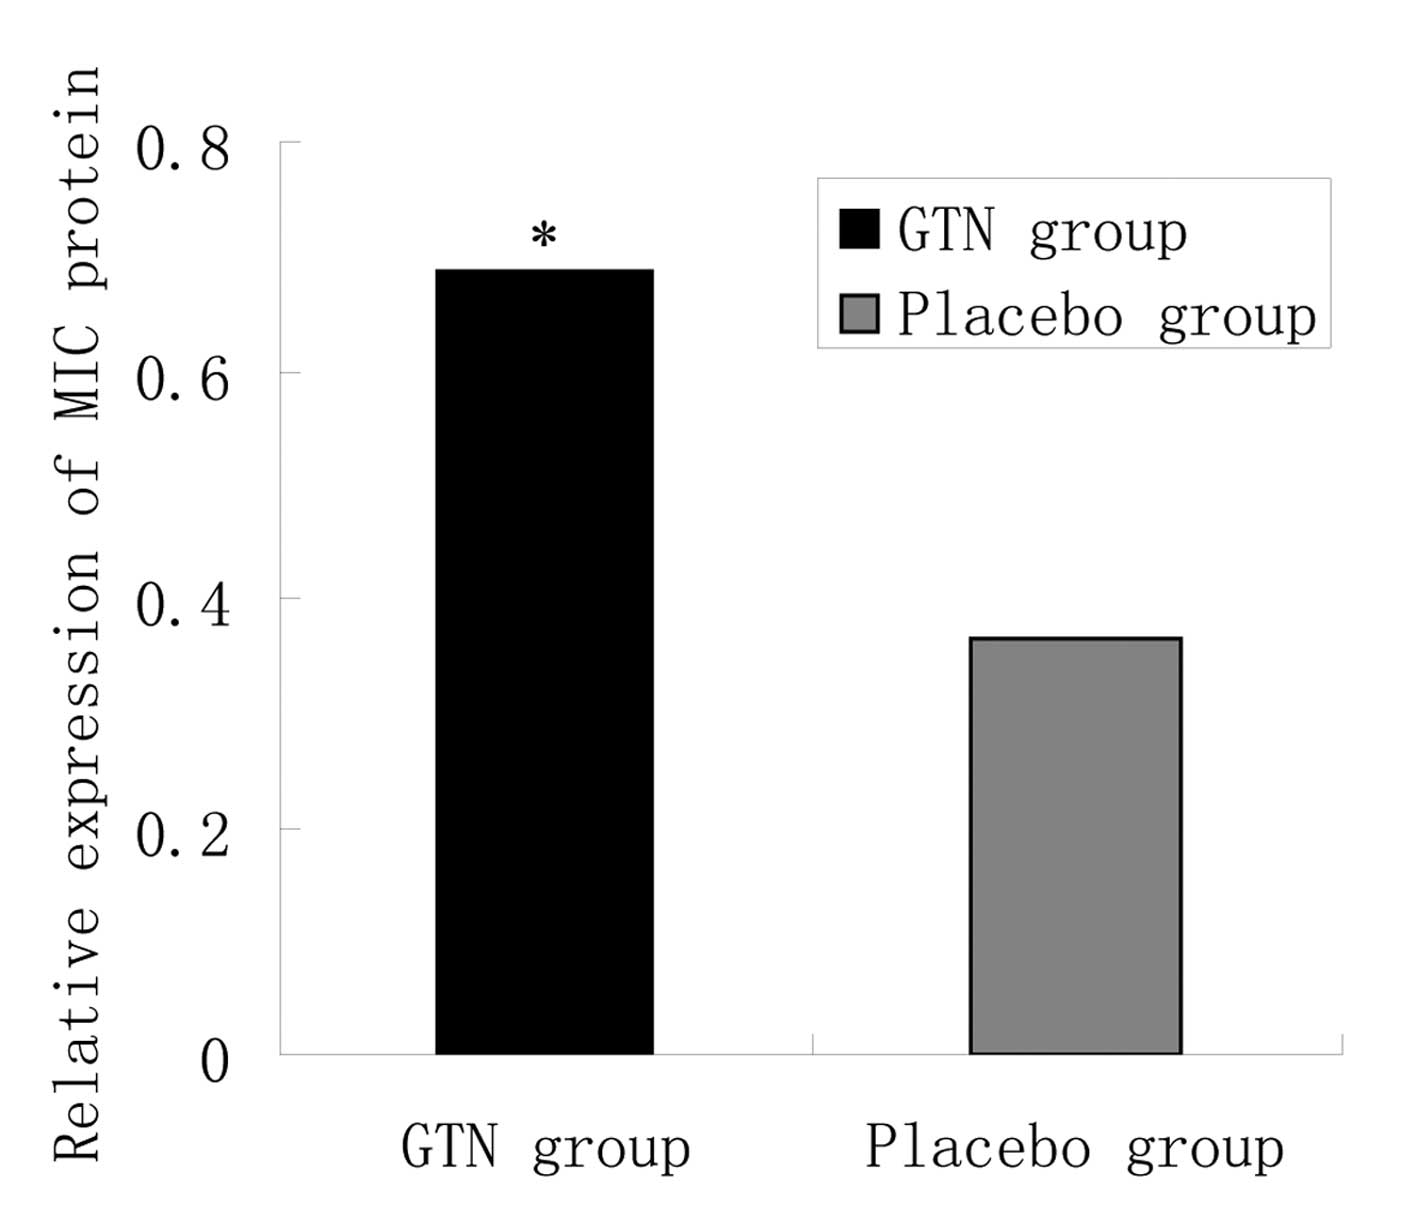
between the GTN and placebo groups (Fig. 5 and Table V; P>0.05). However, at the
protein level, MIC A/B expression was significantly higher in the
GTN group compared with that of the placebo group (Fig. 6 and Table VI; P<0.01).
| Table VRelative expression of MIC A/B mRNA in
the tumors. |
Table V
Relative expression of MIC A/B mRNA in
the tumors.
| Group | n | MIC A, mean ±SD | t-value | P-value | MIC B, mean ± SD | t-value | P-value |
|---|
| GTN | 16 | 0.748±0.112 | 0.402 | >0.05 | 0.321±0.131 | 0.183 | >0.05 |
| Placebo | 16 | 0.702±0.157 | | | 0.298±0.173 | | |
| Table VIRelative expression of the MIC protein
in the tumors. |
Table VI
Relative expression of the MIC protein
in the tumors.
| Group | n | MIC, mean ± standard
deviation | t-value | P-value |
|---|
| GTN | 16 | 0.688±0.214 | 3.969 | <0.01 |
| Placebo | 16 | 0.363±0.123 | | |
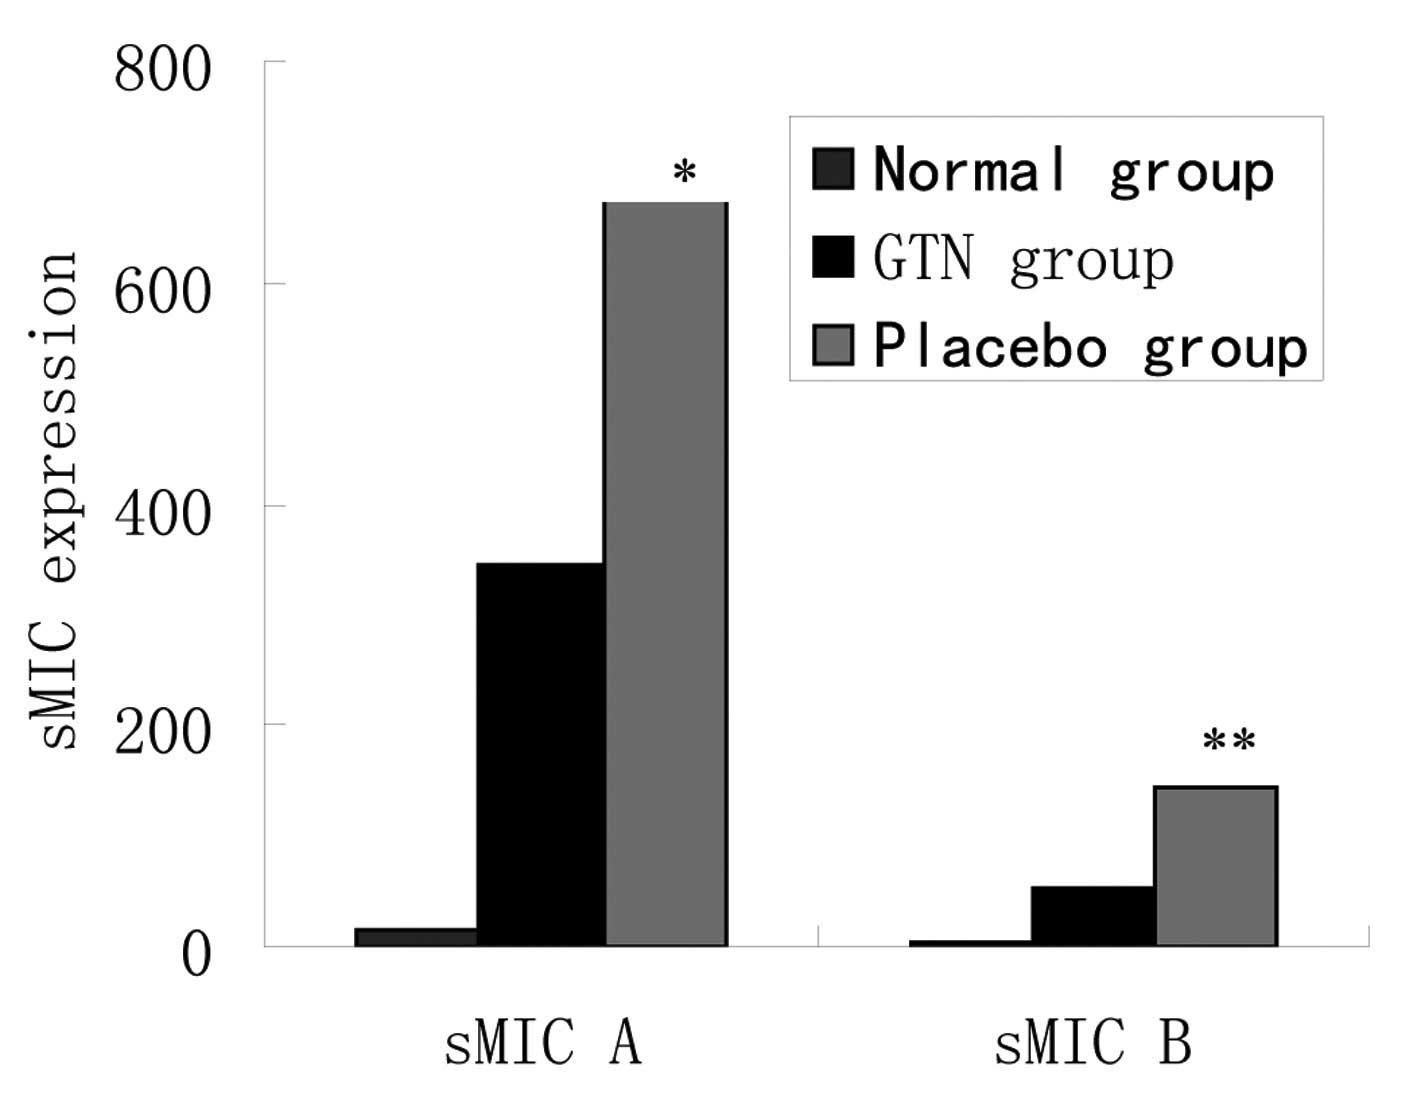
Effect of GTN on soluble MIC (sMIC) in
serum
As noted above, the same mRNA levels, but different
protein levels of MIC A/B were identified between the two groups.
To assess whether cellular MIC was transferred outside of the
membrane, the levels of sMIC in serum were investigated. ELISA
revealed that the placebo group exhibited higher levels of sMIC
than the GTN group and the two groups exhibited significantly
higher sMIC levels when compared with those of the normal mice
(Fig. 7 and Table VII).
| Table VIIExpression levels of sMIC in
serum. |
Table VII
Expression levels of sMIC in
serum.
| Group | n | sMIC A ± SD,
pg/ml | P-value | sMIC B ± SD,
pg/ml | P-value |
|---|
| Normal | 8 | 15.2±14.4 | <0.001 | 2.5±10.2 | <0.001 |
| GTN | 16 | 345.1±125.2 | | 52.8±25.2 | |
| Placebo | 16 | 674.2±205.4 | | 144.4±61.8 | |
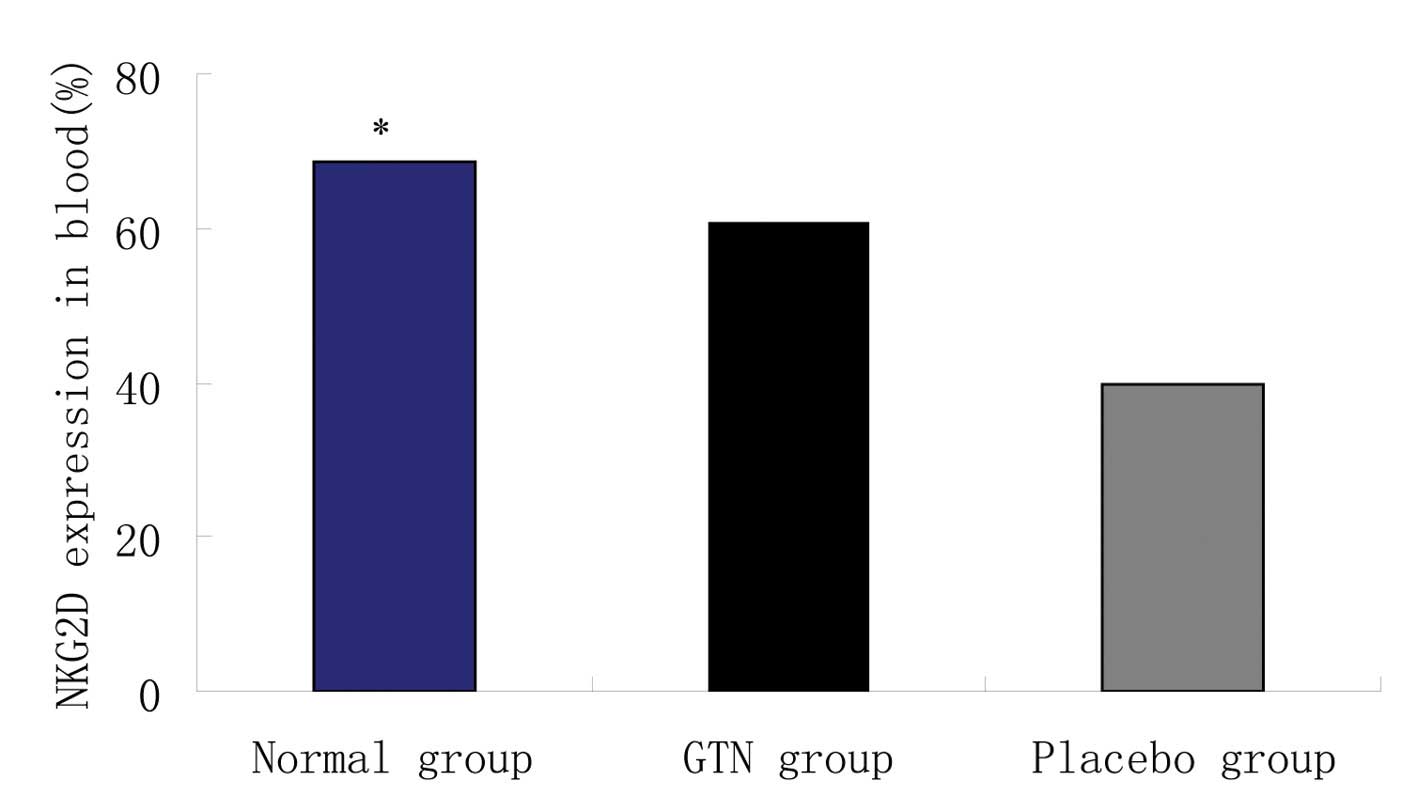
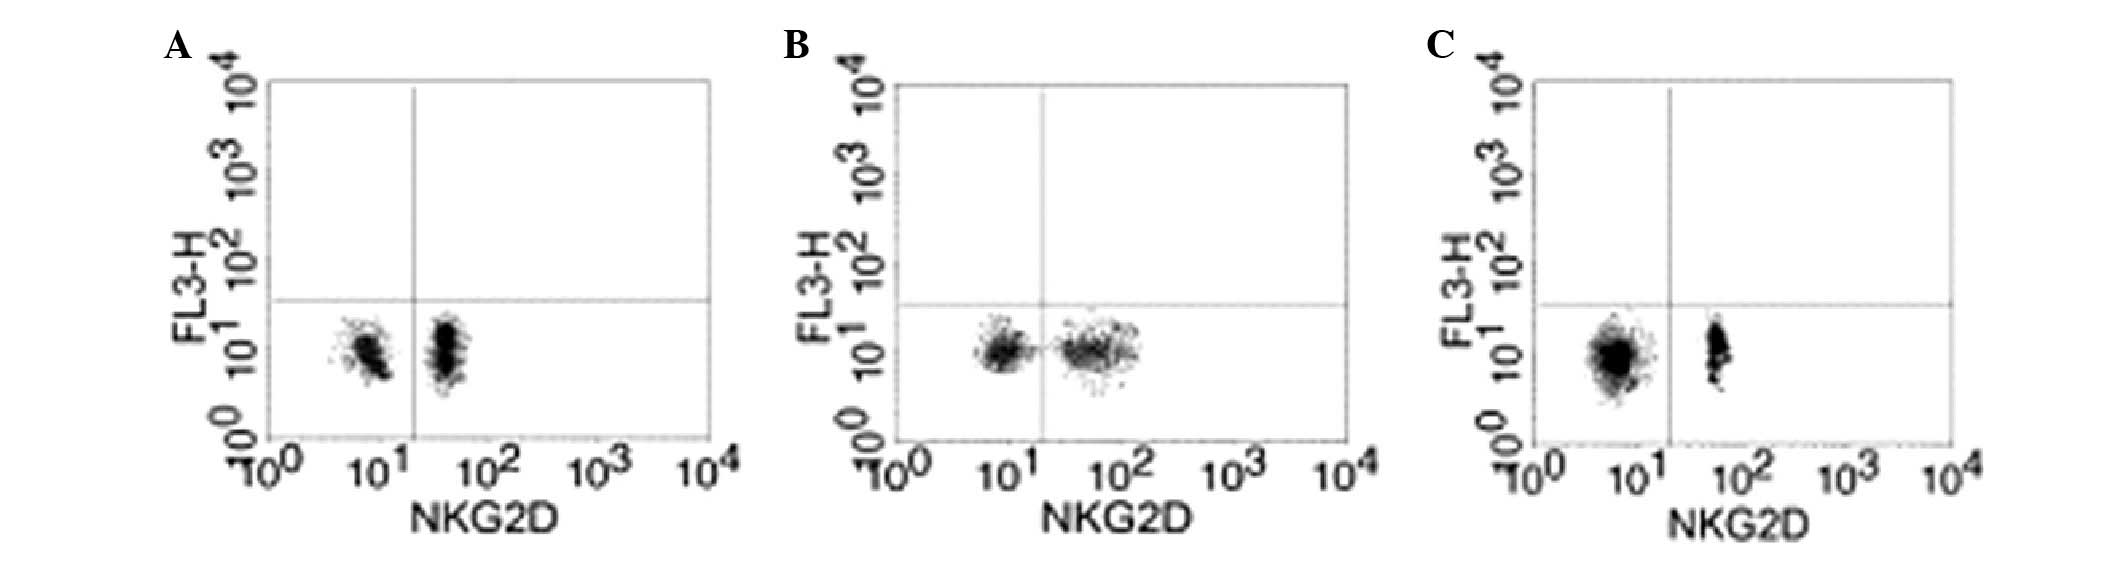
Effect of GTN on NKG2D in the blood
Blood samples were collected from the two groups to
analyze the levels of NKG2D. Flow cytometry revealed that the GTN
and normal groups exhibited significantly higher levels of NKG2D
when compared with the placebo group (Figs. 8 and 9; Table
VIII). In addition, NKG2D and sMIC were found to be negatively
correlated (data not shown).
| Table VIIINatural killer group 2 member D
expression in the blood. |
Table VIII
Natural killer group 2 member D
expression in the blood.
| Group | n | Natural killer
group 2 member D (mean ± standard deviation), % | P-value |
|---|
| Normal | 8 | 68.51±19.42 | <0.001 |
| Glyceryl
trinitrate | 16 | 60.52±10.52 | |
| Placebo | 16 | 39.88±10.14 | |
Discussion
NO, synthesized by NOS, is a soluble gas which
diffuses through the cell membrane and activates adenylate cyclase.
Subsequently, cellular cGMP increases and acts as a second
messenger to activate cGMP-dependent protein kinase G which
phosphorylates downstream proteins and regulates the biological
reaction, known as the NO-cGMP-PKG signaling pathway. Studies have
revealed that acitivation of the NO-cGMP pathway may reverse
hypoxia-induced tumor cell metastasis and chemotherapy
resistance.
The formation of cancer cells causes alteration of
the surface antigens to avoid immune system recognition and attack,
which is termed immune escape. Activation of the NO signaling
pathway may inhibit tumorigenesis. To investigate the effect of the
NO signaling pathway on tumorigenesis, a nude mice model was
established. All nude mice were injected with pancreatic carcinoma
cells (using a PANC-1 cell line) enabling the growth of tumors.
When tumor volumes reached 150 mm3 the GTN group were
administered with GTN transdermal patches (dose, 7.3 μg/h)
(16), while the placebo group were
administered untreated patches. The tumor volume was then measured
every 3–4 days for a period of 28 days. It was found that the
tumors of the GTN group were markedly smaller when compared with
those of the placebo group.
GTN, an NO donor, is commonly administered for the
treatment of cardiovascular disease. Previous studies have found
that GTN may also inhibit tumor cell growth, induce cell apoptosis
and downregulate blood vessel- and metastasis-associated genes
(17–19). GTN is firstly converted into nitrite
(20–22), which reacts with glutathione and
generates S-nitrosoglutathione (GSNO) (23). GSNO is subsequently decomposed and
NO is released. NO is a novel cellular messenger; it activates sGC
and enhances cGMP, which in turn promotes PKG as a second messenger
and transfers the signal downstream (24).
NO signaling pathway activation may also inhibit
immune escape. In the present study, the total RNA and protein of
the tumors were extracted following 28 days of treatment and no
significant difference in MIC A/B mRNA expression was identified
between the GTN and placebo group. However, a significant
difference was identified in the protein levels, whereby a greater
level of MIC A/B expression was identified in the GTN group than in
the placebo group. Furthermore, the GTN group exhibited lower
levels of sMIC, but higher levels of NKG2D when compared with the
placebo group. It was hypothesized that GTN does not regulate MIC
expression, but suppresses the detachment of MIC from the cell
membrane into the serum. Thus, sMIC levels were downregulated in
the GTN group and subsequently NKG2D levels were increased, which
triggered the immune system to kill the tumor cells. In addition,
HIF-1α expression was identified to be lower in the GTN group
compared with that in the placebo group.
In conclusion, it was hypothesized that the NO that
was released from GTN enhanced the blood circulation and oxygen
levels in the tumors, whilst decreasing endogenous NO synthesis and
intracellular oxygen consumption. GTN activated the NO signaling
pathway and also improved the hypoxic microenvironment, thus,
inhibiting the immune escape of tumors cell. This study provides
evidence that drugs which activate the NO pathway may present as
useful treatments in cases of tumor cell metastasis.
References
|
1
|
Seliger B and Massa C: The dark side of
dendritic cells: Development and exploitation of tolerogenic
activity that favor tumor outgrowth and immune escape. Front
Immunol. 4:4192013.
|
|
2
|
Groh V, Rhinehart R, Secrist H, Bauer S,
Grabstein KH and Spies T: Broad tumor-associated expression and
recognition by tumor-derived gamma delta T cells of MICA and MICB.
Proc Natl Acad Sci USA. 96:6879–6884. 1999.
|
|
3
|
Li K, Mandai M, Hamanishi J, Matsumura N,
Suzuki A, Yagi H, Yamaguchi K, Baba T, Fujii S and Konishi I:
Clinical significance of the NKG2D ligands, MICA/B and ULBP2 in
ovarian cancer: high expression of ULBP2 is an indicator of poor
prognosis. Cancer Immunol Immunother. 58:641–652. 2009.
|
|
4
|
Diefenbach A, Jensen ER, Jamieson AM and
Raulet DH: Rae1 and H60 ligands of the NKG2D receptor stimulate
tumour immunity. Nature. 413:165–171. 2001.
|
|
5
|
Groh V, Steinle A, Bauer S and Spies T:
Recognition of stress-induced MHC molecu1es by intestina1
epithelial gammadelta T cells. Science. 279:1737–1740. 1998.
|
|
6
|
Conejo-Garcia JR, Benencia F, Courreges
MC, Khang E, Zhang L, Mohamed-Hadley A, Vinocur JM, Buckanovich RJ,
Thompson CB, Levine B, et al: A tumor-associated NKG2D
immunoreceptor ligand, induces activation and expansion of effector
immune cells. Cancer Biol Ther. 2:446–451. 2003.
|
|
7
|
Vivier E, Tomasello E and Paul P:
Lymphocyte activation via NKG2D: towards a new paradigm in immune
recognition? Curr Opin Immunol. 14:306–311. 2002.
|
|
8
|
Holdenrieder S, Stieber P, Peterfi A,
Nagel D, Steinle A and Salih HR: Soluble MICA in malignant
diseases. Int J Cancer. 118:684–687. 2006.
|
|
9
|
Ota KT, Pierre VJ, Ploski JE, Queen K and
Schafe GE: The NO-cGMP-PKG signaling pathway regulates synaptic
plasticity and fear memory consolidation in the lateral amygdala
via activation of ERK/MAP kinase. Learn Mem. 15:792–805. 2008.
|
|
10
|
Bonthius DJ, Karacay B, Dai D, Hutton A
and Pantazis NJ: The NO-cGMP-PKG pathway plays an essential role in
the acquisition of ethanol resistance by cerebellar granule
neurons. Neurotoxicol Teratol. 26:47–57. 2004.
|
|
11
|
Bredt DS and Snyder SH: Nitric oxide, a
novel neuronal messenger. Neuron. 8:3–11. 1992.
|
|
12
|
Son H, Lu YF, Zhuo M, Arancio O, Kandel ER
and Hawkins RD: The specific role of cGMP in hippocampal LTP. Learn
Mem. 5:231–245. 1998.
|
|
13
|
Denninger JW and Marletta MA: Guanylate
cyclase and the NO/cGMP signaling pathway. Biochim Biophys Acta.
1411:334–350. 1999.
|
|
14
|
Arancio O, Antonova I, Gambaryan S,
Lohmann SM, Wood JS, Lawrence DS and Hawkins RD: Presynaptic role
of cGMP dependent protein kinase during long-lasting potentiation.
J Neurosci. 21:143–149. 2001.
|
|
15
|
Bradford MM: A rapid and sensitive for the
quantitation of microgram quantitites of protein utilizing the
principle of protein-dye binding. Anal Biochem. 72:248–254.
1976.
|
|
16
|
Siemens DR, Hu N, Sheikhi AK, Chung E,
Frederiksen LJ, Pross H and Graham CH: Hypoxia increases tumor cell
shedding of MHC Class I chain-related molecule: role of nitric
oxide. Cancer Res. 68:4746–4753. 2008.
|
|
17
|
Jiang H, Tian YP, Dong Z and Zhang YD:
Microarray technique for observing the regulation of glyceryl
trinitrate on angiogenesis gene expression of Hela. Xian Dai Kang
Fu. 29:6413–6415. 2004.
|
|
18
|
Cai YG, Yang SM and Fang DC: Effects of
heparin enzyme on the occurrence, development, metastasis and
prognosis rehabilitation of tumor. Xian Dai Kang Fu. 14:2086–2087.
2003.
|
|
19
|
Das T, Sa G, Chattopadhyay S and Ray PK:
Protein A-induced apoptosis of cancer cells is effected by soluble
immune mediators. Cancer Immunol Immunother. 51:376–380. 2002.
|
|
20
|
Feelisch M, Brands F and Kelm M: Human
endothelial cells bioactivate organic nitrates to nitric oxide:
implications for the reinforcement of endothelial defence
mechanisms. Eur J Clin Invest. 25:737–745. 1995.
|
|
21
|
Chen Z, Zhang J and Stamler JS:
Identification of the enzymatic mechanism of nitroglycerin
bioactivation. Proc Natl Acad Sci USA. 99:8306–8311. 2002.
|
|
22
|
Kearney MF, Brien JF, Marks GS, Lei H and
Nakatsu K: Thiol agents separate nitric oxide formation from
vasodilation induced by glyceryl trinitrate. Drug Metab Dispos.
26:547–551. 1998.
|
|
23
|
Ji Y, Akerboom TP and Sies H: Microsomal
formation of S-nitrosoglutathione from organic nitrites: possible
role of membrane-bound glutathione transferase. Biochem J.
313:377–380. 1996.
|
|
24
|
Thomas WJ, Thomas DL, Knezetic JA and
Adrian TE: The role of oxygen-derived free radicals and nitric
oxide in cytokine-induced anti-proliferation of pancreatic cancer
cells. Pancreas. 24:161–168. 2002.
|