Introduction
Leukemia, a malignancy that originates in
hematopoietic stem cells, now ranks as the seventh most common
malignant tumor in China, accounts for a population-standardized
incidence rate of 2.76/10 million, and is one of the most
significant causes of mortality in the Chinese population (1).
The overall efficacy of leukemia treatment remains
unsatisfactory, despite progress in basic research of its
pathogenesis and improvements in clinical therapy. Chemotherapy is
one of the most important treatments for leukemia. However,
conventional chemotherapy agents, such as Adriamycin (ADM), which
kill tumor cells by mediating cell apoptosis or necrosis, act on
normal cells in the same manner and are thought to result in
serious side-effects; therefore, the application of many such
agents is limited (2). The search
for new antileukemic agents with high efficiency and low toxicity
has become an important task. It has been revealed that certain
natural medicines, for example, flavonoids or natural polyphenolic
compounds, have extensive pharmacological effects with low toxicity
(3,4). Thus, they may be expected to have a
role in the treatment of leukemia and have attracted an increasing
amount of attention. Naringenin, a widely distributed natural
flavonoid that is one of the most abundant flavonoids in citrus
fruit, is formed from its precursor, naringin, by removal of part
of the molecule by gut bacteria following oral ingestion (5,6).
Naringenin exhibits extensive pharmacological effects, including
free radical-scavenging activity and antioxidant, antiproliferative
and anti-atherogenic effects (7–12).
Preliminary studies suggest that naringenin may play an important
role in cancer prevention and treatment, such as by inducing cell
cycle arrest or apoptosis, reversing drug resistance, inhibiting
subcellular signal transduction and promoting DNA repair (13–15).
Naringenin has exhibited antitumor activity against a variety of
tumor cells in previous studies (14–17).
Chen et al (18) reported
that naringenin effectively inhibited the proliferation of the
leukemia cell line HL-60, while having little cytotoxicity in
mature THP-1 monocytes and normal peripheral blood
polymorphonuclear leukocytes (PMNs), which suggests that naringenin
may be promising in leukemia treatment. However, the antileukemic
effects and antitumor mechanisms of naringenin are yet to be
understood and contradictions in existing reports remain to be
clarified (19).
The human leukemia cell line K562 was established by
Lozzio and Lozzio (20) from cells
obtained from a patient in the blastic phase of chronic
granulocytic leukemia. The phenotype of the cell line includes the
immunological markers CD3 (−), CD13 (+), CD19 (−), CD34 (−), CD41
(+), CD42 (+), CD71 (+) and CD235a (+), and the carrying of the
BCR/ABL fusion gene, which promotes cell growth, inhibits apoptosis
and causes defects of DNA repair (21). K562 cells are commonly used in cell
culture for studies of drug effects on leukemia. In the present
study, the effects of naringenin on the human leukemia cell line
K562 in vitro and the underlying mechanisms were explored.
Moreover, human peripheral blood PMNs were cultured as normal cells
of the control group so that the effect of naringenin on normal
granulocytes and its ability to ameliorate ADM-induced oxidative
damage could be evaluated. The aim of the study was to assess the
value of naringenin in leukemia treatment in order to explore new
methods for the therapy of leukemia.
Materials and methods
Reagents
Naringenin, Wright-Giemsa stain and Hoechst 33258
stain were obtained from Sigma-Aldrich (St. Louis, MO, USA).
Naringenin was of >98% purity, dissolved in DMSO at a
concentration of 400 mmol/l and stored at −20°C. ADM was from
Pharmacia & Upjohn (Peapack, NJ, USA). TRIzol, low melting
point agarose and horseradish peroxidase-conjugated goat anti-mouse
polyclonal immunoglobulin G (IgG) secondary antibody were from
Promega (Madison, WI, USA). RevertAid™ First Strand cDNA Synthesis
kit, Moloney murine leukemia virus (M-MLV) reverse transcriptase
and Taq DNA polymerase were from MBI Fermentas (Burlington, CA).
3-[4,5-Dimethylthiazol-2-yl]-2,5-diphenyltetrazolium bromide (MTT)
was from Sigma-Aldrich. RPMI-1640 medium, fetal bovine serum (FBS)
and trypsin-ethylenediamine tetraacetic acid (EDTA) were from
Hyclone (Thermo Scientific, Logan, UT, USA). Mouse anti-human
proliferating cell nuclear antigen (PCNA) monoclonal antibody,
horseradish peroxidase (HRP)-conjugated goat anti-mouse IgG
antibody, 3,3′-diaminobenzidine tetrahydrochloride and
H2O2 were from Santa Cruz Biotechnology, Inc.
(Santa Cruz, CA, USA). Normal goat serum was from Zhongshan
Bio-Tech Co., Ltd. (Beijing, China). Protein Detector™ Western Blot
kit was from KPL, Inc. (Gaithersburg, MD, USA). Polyvinylidene
fluoride (PVDF) membranes were from Millipore (Bedford, MA, USA).
The protein marker was from MBI Fermentas. MDA, superoxide
dismutase (SOD), ROS and glutathione peroxidase (GSH-Px) assay kits
were from Jiancheng Bioengineering Research Institute (Nanjing,
China). EDTA, penicillin and streptomycin were from Gibco
(Invitrogen Life Technologies, Carlsbad, CA, USA).
Cell culture
The human K562 cell line was obtained from the China
Center for Type Culture Collection (CCTCC) of Wuhan University
(Wuhan, China), and was cultured in RPMI-1640 medium containing 10%
FBS, 1 mmol/l glutamine and 10 U/l penicillin and streptomycin.
Human PMNs were isolated from the citrate-anticoagulated peripheral
blood of healthy donors by Polymorphprep centrifugation techniques
as described previously (22). The
purity of human PMNs was >95% as estimated by Wright-Giemsa
staining. PMNs were suspended in PBS containing 1 mmol/l
CaCl2 and 1 mmol/l MgSO4. All cells were
maintained in a humidified 5% CO2 atmosphere at 37°C.
Cells were split at a ratio of 1:2 once they reached 70–90%
confluence. Generally, the K562 cells grew into a monolayer within
2–3 days, and were continually cultured for 2 to 3 passages for use
in the experiments. Written approval for the derivation, culture
and experimental use of the PMNs was obtained from the Ethics
Committee, Zhongnan Hospital of Wuhan University (Wuhan,
China).
MTT assay
Cell viability was determined using an MTT assay.
Briefly, single cell suspensions of K562 cells and PMNs were seeded
onto 96-well plates at a density of 1×10⁵/well and
incubated for 24, 48 or 72 h at 37°C in a 5% CO2 culture
incubator. Cells were treated with naringenin at final
concentrations of 0, 50, 100, 200, 400 and 800 μmol/l respectively,
with five wells for each group. After incubation for 24 h, 20 μl
MTT reagent (5 mg/ml) was added to each well and the cells were
incubated for 4 h. Then, the formazan precipitate was dissolved in
150 μl DMSO and the absorbance value was measured using a
microplate reader (ELx808; BioTek, Winooski, VT, USA) at a
wavelength of 570 nm. The cell proliferation inhibition rate (%)
was calculated as: (A0−A)/A0 × 100%, where A
represents the mean absorbance value of the sample cells, and
A0 represents the mean absorbance value of the control
sample.
Immunocytochemical testing and labeling
index (LI) calculation
Immunocytochemical staining was carried out as
described previously (23).
Briefly, cells were fixed with methanol at −20°C for 15 min and
then were washed with PBS. The fixed cells were permeabilized with
1% NP-40 and blocked with 10% normal goat serum, followed by
incubation with appropriately diluted (1:100) PCNA primary antibody
for 24 h at 4°C. The cells were washed with PBS and exposed to the
horseradish peroxidase (HRP)-conjugated goat anti-mouse IgG
antibody (1:1,000) for 30 min at room temperature. Staining was
performed as a 5 min exposure to 3,3′-diaminobenzidine
tetrahydrochloride/H2O2, which formed a brown
precipitate on the labeled cells. Stains without the primary
antibody were used as negative controls. The presence of proteins
of interest was examined under a light microscope (CKX41; Olympus
Corporation, Tokyo, Japan). The LI was obtained by counting the
number of positive cells per 100 cultured cells in 10 fields of
vision.
Analysis of apoptotic cells
Light microscope observation
K562 cells with Wright-Giemsa staining and Hoechst
33258 staining were observed under an inverted microscope (CKX41;
Olympus Corporation) at ×400 magnification.
Immunofluorescent staining
Chromatin condensation was detected by nuclear
staining with Hoechst 33258. Briefly, cells were fixed with 2%
formaldehyde for 10 min, stained with phosphate-buffered saline
(PBS)/0.1% Triton-X 100/10 μM Hoechst 33258 for 5 min, then were
visualized by inverted fluorescence microscopy (Leica DM IRB; Leica
Microsystems GmbH, Wetzlar, Germany). Apoptotic cells were stained
bright blue due to chromatin condensation.
Ultrastructure observation by
transmission electron microscopy (TEM)
Briefly, 1×10⁵/ml K562 cells were seeded
and incubated for 24 h at 37°C in a 5% CO2 culture
incubator. Naringenin was added to attain various final
concentrations as previously described. After incubation for 48 h,
cells were harvested with serum-free Dulbecco’s modified Eagle’s
medium (DMEM) and fixed in 3% glutaraldehyde for 4 h. Then, the
cells were washed twice with PBS, fixed in 1% osmic acid for 1 h,
dehydrated and embedded. The 70-nm slices were prepared and
observed under a transmission electron microscope (JEM-2200FS;
Jeol, Ltd., Tokyo, JP) after staining with uranyl acetate and lead
citrate.
Flow cytometric analysis of the cell
cycle
K562 cells at a density of 1×10⁵/ml were
seeded in 6-well dishes, and naringenin was added to a final
concentration of 50, 100, 200, 400 and 800 μmol/l, respectively. 0
μmol/l naringenin was set as the control. After 24, 48 and 72 h of
culturing, cells were trypsinized, washed twice with cold PBS and
centrifuged at 16 × g for 3 min. The pellet was resuspended in 50
ml cold PBS and 450 μl cold methanol for 1 h at 4°C. The cells were
centrifuged at 1,000 × g for 5 min, and the pellet was washed twice
with cold PBS, suspended in 500 μl PBS, and incubated with 5 ml
RNase (20 μg/ml final concentration) for 30 min. The cells were
chilled over ice for 10 min and stained with propidium iodide (50
μg/ml final concentration) for 1 h and analyzed by flow cytometry
(FACScan; Becton Dickinson, Franklin Lakes, NJ, USA).
Semi-quantitative reverse transcription
polymerase chain reaction (RT-PCR) for p53 and p21/WAF1
After 24, 48 and 72 h of culture with 400 μmol/l
naringenin, total RNA was extracted from each group using TRIzol
reagent following the manufacturer’s instructions and quantitated
by absorbance at 260 nm. For the RT-PCR, the RevertAid™ First
Strand cDNA Synthesis kit was used with a total RT reaction volume
of 10 μl. The reaction temperature was 30°C for 10 min, 42°C for 20
min and 45°C for 30 min. For the PCR stage, the total reaction
volume was 50 μl. PCR was performed in a GeneAmp PCR system 2400
(Perkin Elmer, Waltham, MA, USA). Primers for p21 were, forward:
5′-GATGTCCGTCAGAACCCATG-3 and reverse: 5′-CCACATGGTCTTCCTCTGCTG-3′,
with an expected fragment size of 316 bp. For p53, the forward
primer was 5′-GTCTGTGACTTGCACGTACT-3′ and the reverse
5′-CAGTCAGAGCCAACCTCAGG-3′, with an expected fragment size of 326
bp. β-actin was used as the internal standard reference, with
forward primer 5′-GTGGGGCGCCCCAGGCACCA-3′, reverse primer
5′-CTCCTTAATGCACGCACGATTTC-3′, and an expected 500-bp band. After
cDNA (3 μl) and specific primers were added to the master mix, PCR
was conducted with initial denaturation at 94°C for 5 min, followed
by 24 cycles of denaturation at 94°C for 30 sec, annealing at 50°C
for 30 sec and extension at 72°C for 30 sec. A 5 μl sample of the
PCR products was visualized by electrophoresis on 1% agarose gel
stained with ethidium bromide and quantitated by densitometry using
the ImageMaster VDS system and associated software (GE Healthcare
Life Sciences, Uppsala, Sweden).
Western blot analysis of p53 and p21/WAF1
proteins
K562 cells were seeded in 6-well plates at a density
of 1.0×10⁵/ml and divided into four groups. Naringenin
was added to each group to attain a final concentration of 400
μmol/l. Then, cells in each group were cultured for 24, 48 and 72 h
respectively; a 0 h group was used as a control. Cells were
collected by centrifuging at 1,000 × g for 3 min and washed with
PBS. The cell pellets were resuspended in sodium dodecyl sulfate
(SDS) sample buffer (62.5 mmol/l Tris-HCl pH 6.8, 2% SDS, 10%
glycerol, 50 mmol/l dithiothreitol, 0.1% bromphenol blue),
incubated for 5 min at 95°C, cooled on ice for 5 min and stored at
−20°C until further use. Cell lysates were subjected to
SDS-polyacrylamide gel electrophoresis (PAGE) using 10%
polyacrylamide gels and transferred to PVDF membranes using a
semidry electroblot chamber. Proteins in the gel were assessed by
Coomassie brilliant blue staining. Membranes were blocked in
Tris-buffered saline pH 7.4 containing 0.1% Tween-20 and 5% bovine
serum albumin for 1 h at room temperature. Incubations with the
primary antibodies: Monoclonal mouse anti-human p53 and monoclonal
mouse anti-human p21/WAF1 (GE Healthcare, Piscataway, NJ, USA),
were carried out at 4°C overnight using antibody dilutions as
recommended by the manufacturer in Tris-buffered saline pH 7.4,
0.1% Tween-20. Following 1 h of incubation with
peroxidase-conjugated goat anti-mouse polyclonal IgG secondary
antibody (dilution 1:2,000) at room temperature, proteins were
detected by the electrogenerated chemiluminescence method according
to the manufacturer’s instructions (GE Healthcare). As a loading
control, blots were assayed against β-actin.
Attenuation of ADM chemotherapeutic
injury by low-dose naringenin
The MTT assay was used to test cell viability, as
described earlier. The concentration of ADM was set in five groups
as 0.75, 1.5, 3.0, 6.0 and 12.0 μmol/l, respectively, with three
wells for each group. After culturing for 48 h, the half maximal
(50%) inhibitory concentration (IC50), that is, the
working concentration of ADM, was determined for further
experiments. Then five different groups were established: Control,
naringenin, ADM, post 1 h (naringenin addition 1 h after
co-culturing with ADM) and post 24 h (naringenin addition 24 h
after co-culturing with ADM) groups. Final concentrations of
naringenin of 5, 10, 20, 40 and 80 μmol/l were used in each group.
In the control group, an equal volume of DMSO was used and its
final content was <5% by volume.
Detection of ROS, SOD, MDA and
GSH-Px
Cell lysates of K562 cells and PMNs were generated
as previously described (24). The
content of MDA and activities of SOD and GSH-Px were determined
using assay kits, following the manufacturer’s instructions.
Statistical analysis
Data were analyzed for significance with an unpaired
t-test and analysis of variance test. Statistical software SPSS
13.0 (SPSS, Inc., Chicago, IL, USA) was used in the analysis.
P<0.05 was considered to indicate a statistically significant
difference.
Results
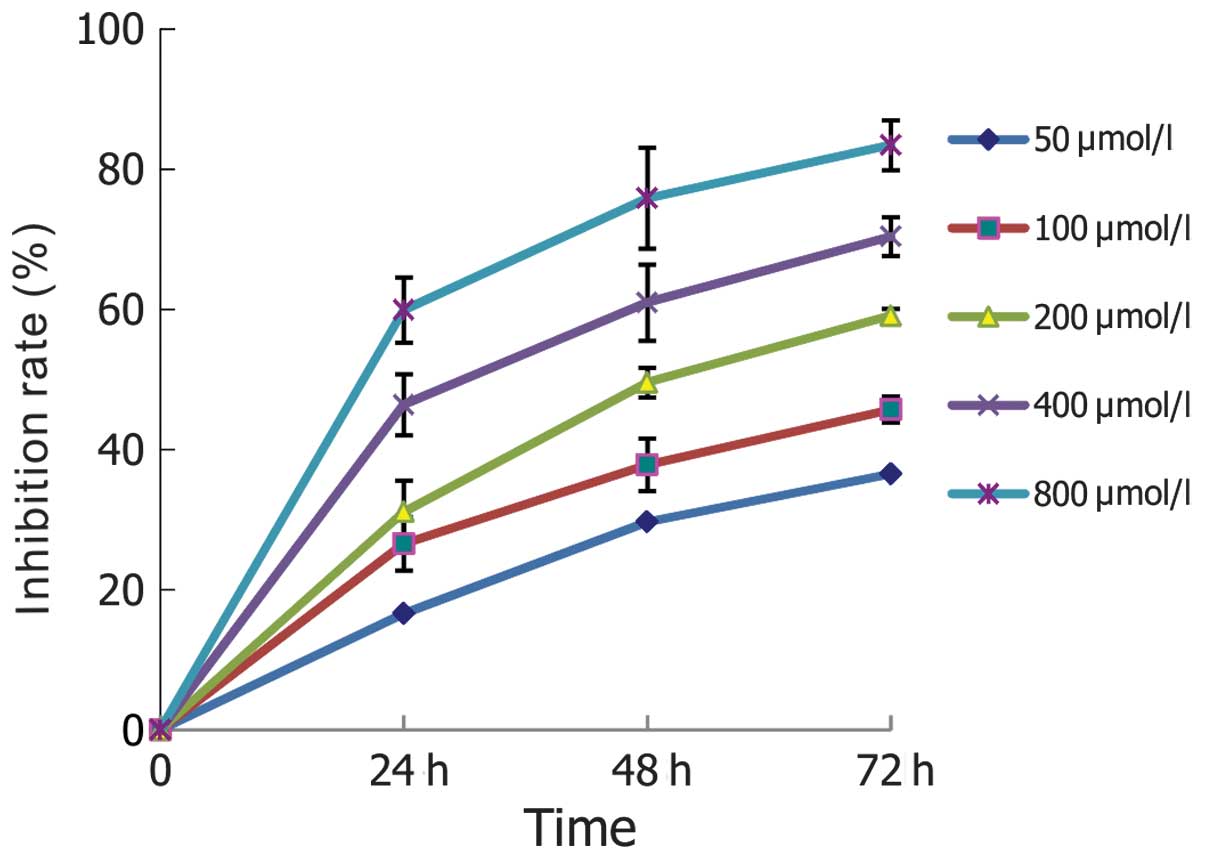
Effect of naringenin on the proliferation
of K562 cells
As shown in Fig. 1,
the growth of K562 cells was inhibited by naringenin in
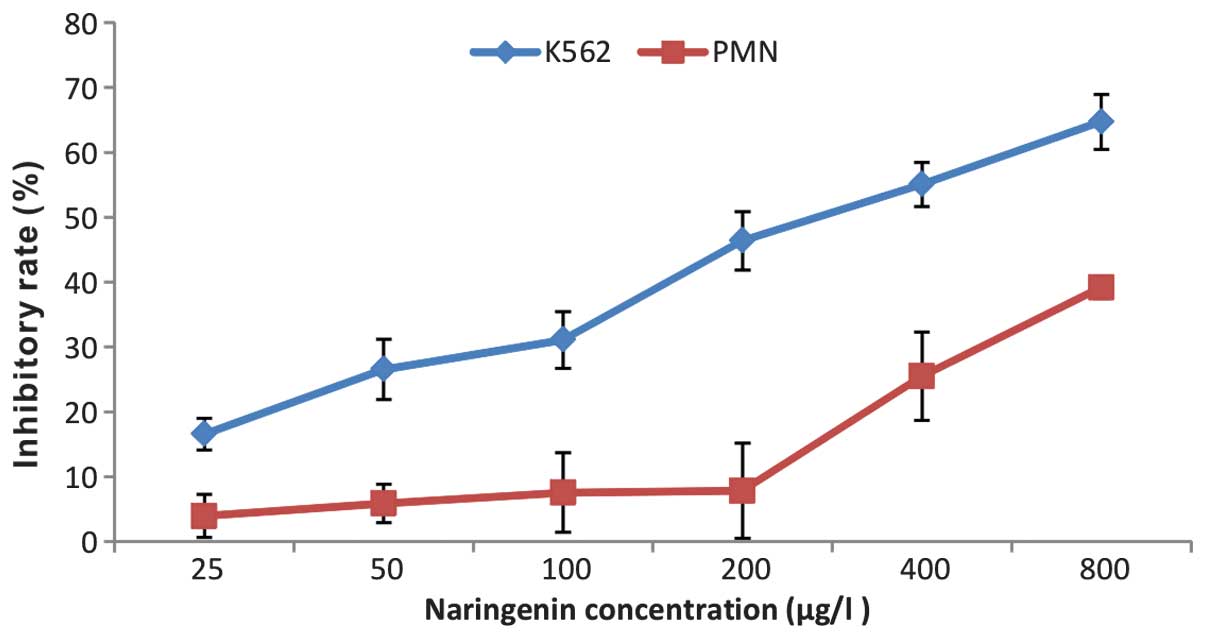
concentration- and time-dependent manner. However, naringenin at
low concentrations did not show a cytotoxic effect on normal PMNs
until its concentration was increased to 400 μmol/l (Fig. 2).
Effects of naringenin on cell
morphology
When observed under an inverted microscope (CKX41;
Olympus, Tokyo, Japan), the proliferation of K562 cells was
inhibited following treatment with naringenin. Morphologic changes
typical of apoptosis and the formation of apoptotic bodies were
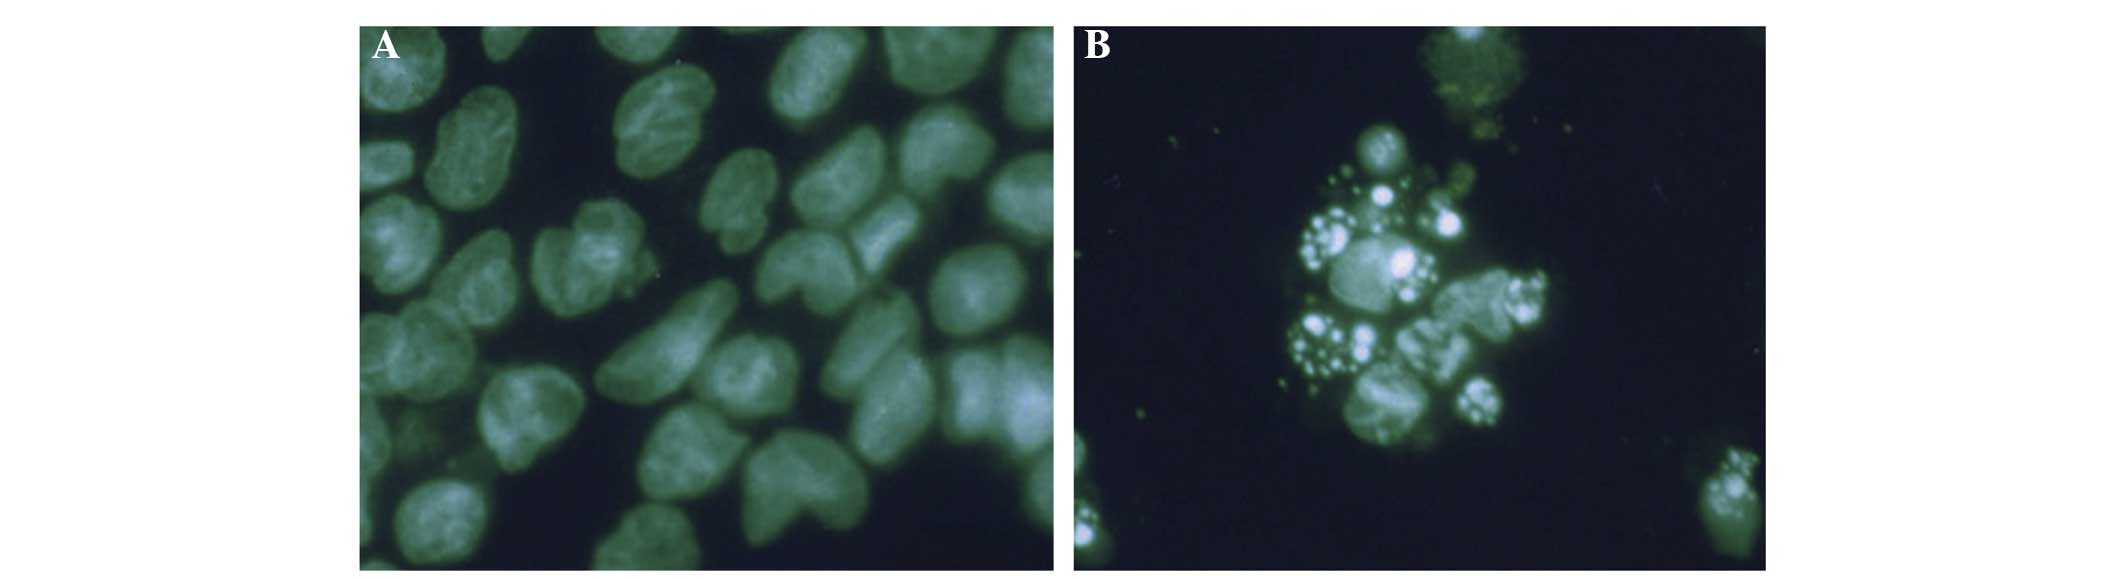
observed by Wright-Giemsa staining (Fig. 3). Immunofluorescent staining
results are shown in Fig. 4. Cells
in the control group presented abundant cytoplasm, complete
membrane integrity and homogeneous nuclear mass. However, cells in
the treatment groups exhibited shrinking membranes, smaller nuclei,
concentrated aggregates, and variously sized fragments formed by
nuclear fragmentation. Moreover, polygonal, circular or
petal-shaped apoptotic bodies, which represent the typical
morphology of apoptosis, were observed. Fragmentation of dead cells
occurred when the naringenin concentration was increased to the
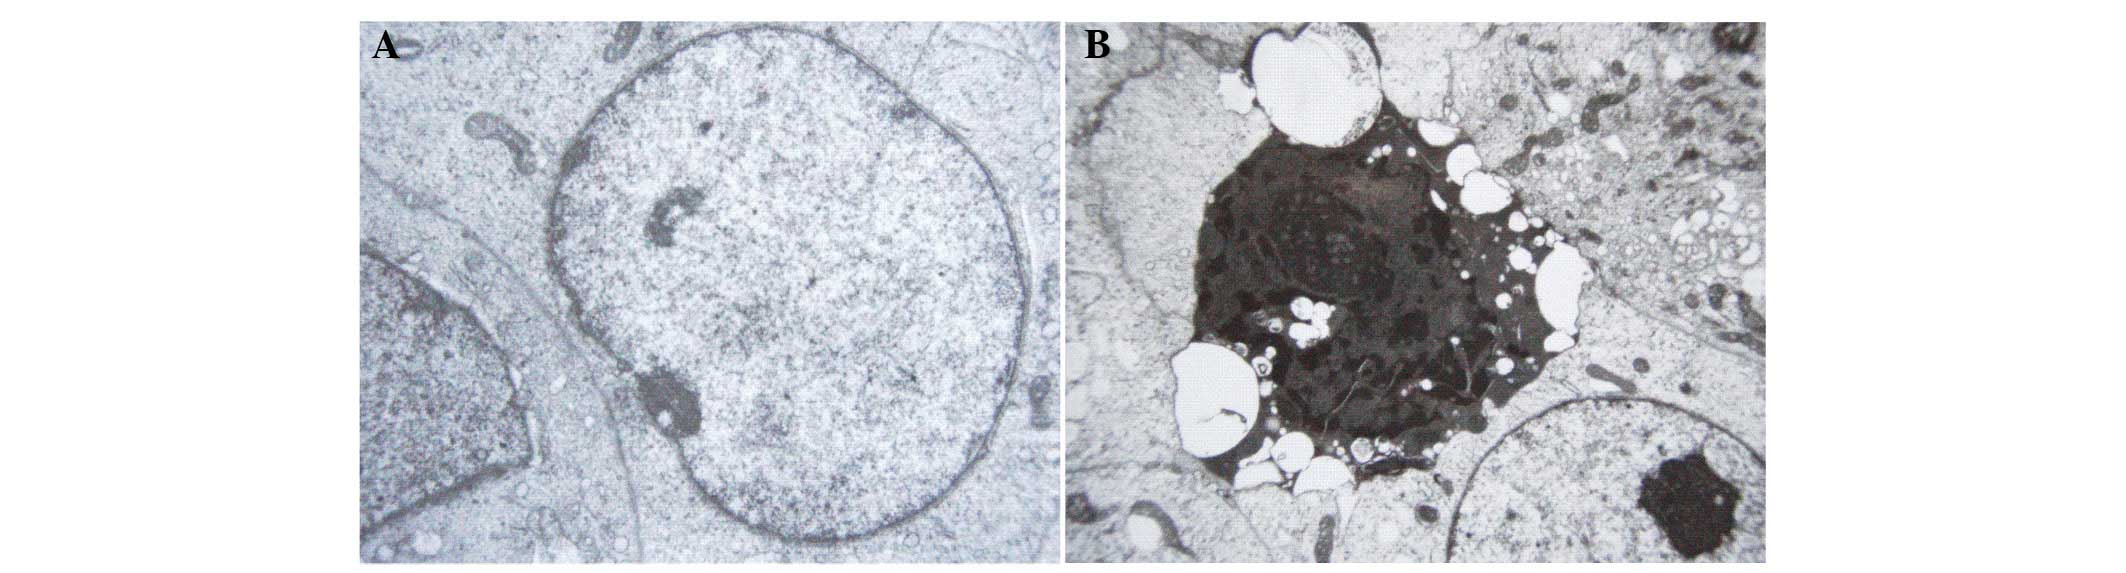
highest level (800 μmol/l). TEM observation revealed the
ultrastructural changes of K652 cells following naringenin
treatment. As is shown in Fig. 5,
cells in the control group exhibited large nuclei, uniform nuclear
chromatin, a small quantity of heterochromatin and prominent
nucleoli. However, in the naringenin-treated group, the cells
presented massive aggregation of nuclear chromatin, or fragmented
pieces that were coated with nuclear membrane, which indicated
apoptotic morphological change.
Immunocytochemical staining of PCNA and
LI results
It was observed that the positive expression of PCNA
was mainly located in the nucleus and was visible as brown staining
or particles in the nucleus or even part of the cytoplasm. LI
calculations indicated that the positive expression rate of PCNA in
the control group was significantly higher than that in the
naringenin-treated groups [33.14±3.6 vs. 19.67±2.21 (400 μmol/l, 24
h naringenin); P<0.05].
Flow cytometric analysis of the cell
cycle
As shown in Table
I, after 24 h of treatment with naringenin, the proportion of
K562 cells in the G0/G1 phase increased
whereas the proportion in the S phase decreased, which indicates
that naringenin probably contributed to G0/G1
phase arrest of the K562 cells.
 | Table IEffects of different concentrations
of naringenin on the cell cycle and apoptosis of K562 cells. |
Table I
Effects of different concentrations
of naringenin on the cell cycle and apoptosis of K562 cells.
| Cell cycle (%) | |
|---|
|
| |
|---|
| Concentration
(μmol/l) |
G0/G1 | S |
G2/M | Apoptosis rate
(%) |
|---|
| Control | 41.03±2.80 | 45.59±1.80 | 13.38±0.30 | 2.20±0.30 |
| 50 | 49.96±2.81a | 34.78±1.72 | 15.26±1.20 | 4.02±0.08b |
| 400 | 57.89±2.30b | 26.12±1.21 | 15.99±1.61 | 10.49±2.60b |
| 800 | 59.20±4.70a | 25.88±3.70 | 14.92±4.93 | 20.68±4.91b |
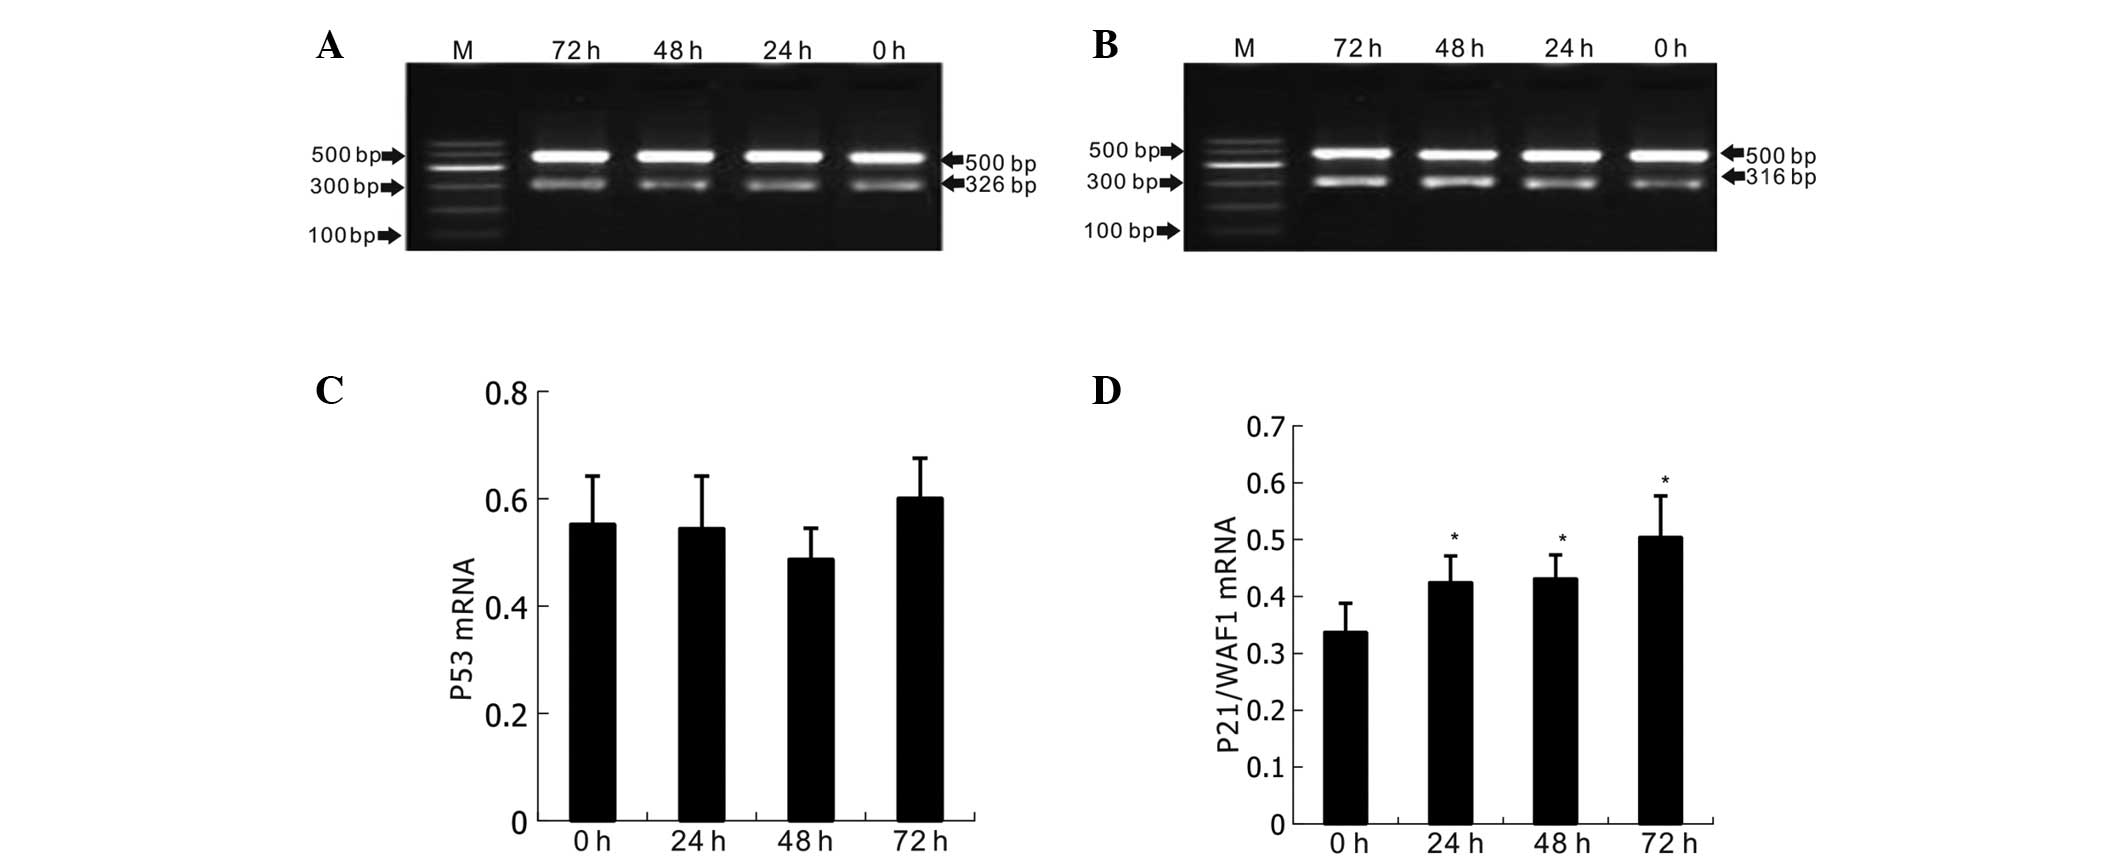
Semi-quantitative RT-PCR testing of the
expression of p53 and p21/WAF1
As shown in Fig. 6,
when naringenin at a concentration of 400 μmol/l was added and the
K562 cells were cultured for 24, 48 and 72, significant increases
in the expression levels of p21/WAF1 mRNA (P<0.05) were
detected, whereas p53 mRNA expression remained stable (P>0.05).
The results also indicated that p21/WAF1 mRNA was upregulated in a
time-dependent manner, and began as early as 24 h post naringenin
treatment.
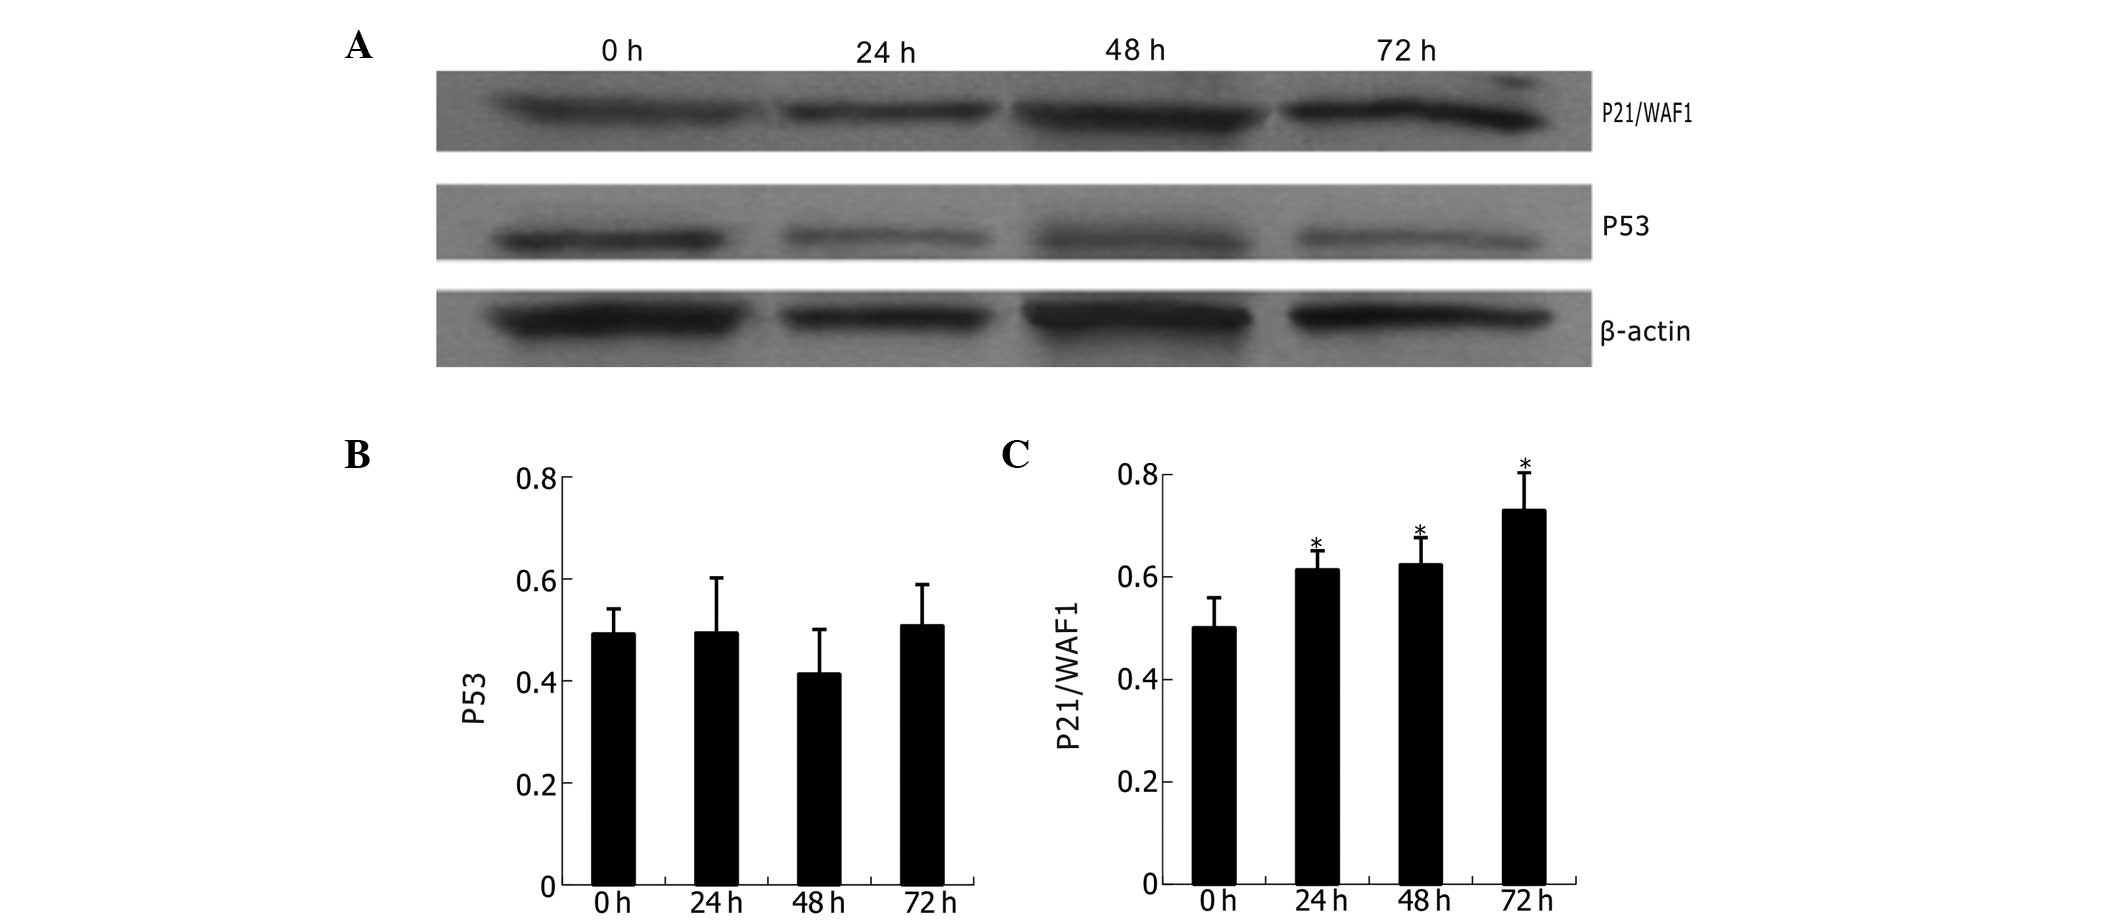
Western blot analysis of p53 and p21/WAF1
proteins
The expression of p53 and p21/WAF1 proteins is shown
in Fig. 7. Compared with untreated
K562 cells, the naringenin-treated cells (400 μmol/l) revealed
statistically significant upregulation of p21/WAF1 but not of p53
at different time points (24, 48 and 72 h). Analysis indicates a
time-dependent and p53-independent mode of p21/WAF1
upregulation.
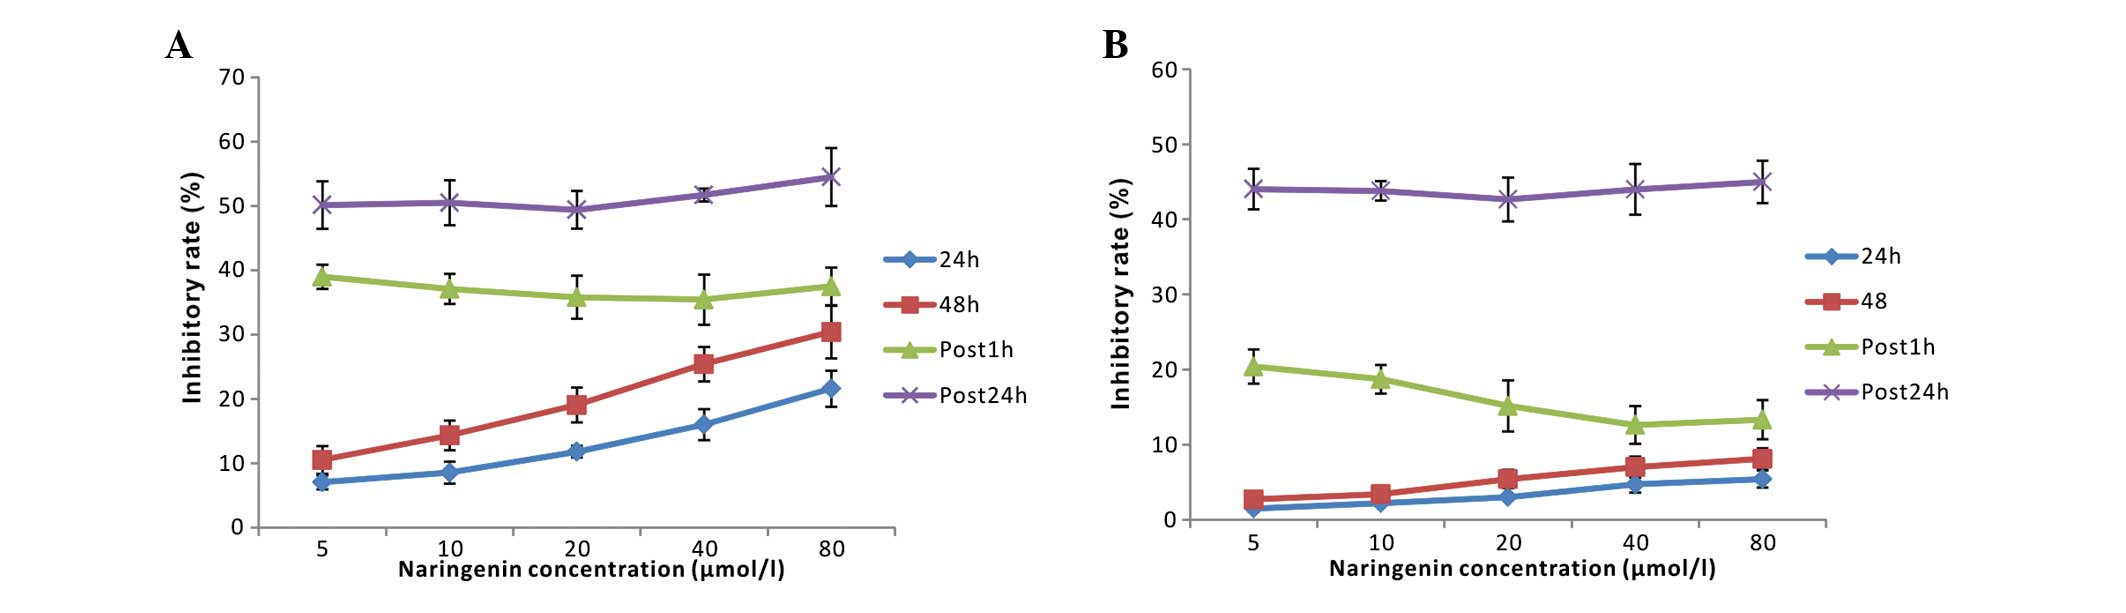
Modulating effect of low-dose naringenin
on ADM chemotherapeutic injury in PMNs and K562 cells
The inhibition rates of various concentrations of
ADM (0.75, 1.5, 3.0, 6.0 and 12.0 μmol/l) were as follows:
30.2±2.9, 44.9±3.8, 56.7±4.2, 66.6±3.7 and 75.4±5.3%, respectively.
According to these results, the IC50 was calculated to
be 2.05±0.24 μmol/l. Therefore, a working concentration of 2 μmol/l
of ADM was used for further experiments.
Naringenin exhibited a small suppressive effect
(<8.1%, P>0.05) on normal human PMNs, despite its 7–35%
inhibitory rate in K562 cells at low concentrations (5–80 μmol/l).
As shown in Fig. 8, neither post 1
h nor post 24 h naringenin addition significantly attenuated the
cytotoxic effect of ADM on K562 cells. However, for PMNs,
naringenin that was added post 1 h, but not post 24 h ADM
treatment, significantly decreased the injury induced by the ADM
chemotherapy, accounting for an inhibitory rate of 38.18±2.43%.
ROS, SOD, MDA and GSH-Px testing during
the modulation of ADM chemotherapeutic injury by naringenin
The effects of naringenin on the ADM-induced changes
in antioxidant enzyme activities in K562 cells and PMNs are shown
in Table II. The results revealed
that ADM significantly reduced the enzymatic activity of GSH-Px and
SOD in the K562 cells and PMNs. When naringenin (20 or 40 μmol/l)
was added 1 h post ADM treatment, the two intracellular enzymes
were significantly upregulated in PMNs but not in K562 cells;
however, no upregulating effect was observed in the post 24 h
group. Similarly, ADM alone caused increases in the levels of the
intracellular oxidation products of ROS and MDA in K562 cells and
PMNs, whereas low-dose naringenin in the post 1 h group benefitted
PMNs but not K562 cells by the reduction of intracellular ROS and
MDA levels (Table II). These data
indicate that low-dose naringenin ameliorates the chemotherapeutic
injury induced by ADM in normal PMNs without weakening the
cytotoxic effect of ADM on K562 tumor cells through its antioxidant
effect.
| Table IIEffects of naringenin on ADM-induced
GSH-Px, SOD, MDA and ROS changes in K562 cells and PMNs. |
Table II
Effects of naringenin on ADM-induced
GSH-Px, SOD, MDA and ROS changes in K562 cells and PMNs.
| | K562 cells | PMNs |
|---|
| |
|
|
|---|
| | Antioxidases | Oxidative
stress | Antioxidases | Oxidative
stress |
|---|
| |
|
|
|
|
|---|
| Group | Dose (μmol/l) | GSH-Px
(μmol/g) | SOD (U/g) | MDA (nmol/g) | ROS (U/g) | GSH-Px
(μmol/g) | SOD (U/g) | MDA (nmol/g) | ROS (U/g) |
|---|
| Control | 0 |
361.23±61.04a | 55.18±7.48a | 0.46±0.25a | 80.65±32.12a |
366.63±42.45a | 62.36±11.05a | 0.25±0.08a | 78.36±27.46a |
| ADM | 2 | 106.76±31.64 | 9.70±4.34 | 14.78±3.56 | 264.74±63.14 | 158.39±28.36 | 14.24±2.69 | 12.37±2.36 | 226.74±36.76 |
| NGEN | 20 |
265.81±56.23a | 24.33±3.35a | 1.45±5.05a | 94.63±33.51a |
285.13±35.60a | 28.93±2.53a | 1.15±3.12a | 82.01±35.43a |
| 40 |
329.56±50.12a | 30.84±4.75a | 2.56±3.25a |
116.42±43.25a |
342.72±40.23a | 39.26±4.68a | 2.42±2.48a | 93.69±42.48a |
| Post 1 h | 20 | 136.32±43.12 | 11.56±3.48b | 11.63±4.32 | 181.16±25.63 |
226.12±53.23a | 21.48±1.65a,c | 2.92±3.37a,c |
102.45±35.14a |
| 40 |
150.36±46.36b | 14.48±3.84b | 13.12±4.45b | 215.28±32.56 |
287.56±37.84a,c | 26.94±3.13a,c | 3.08±2.78a,c |
106.56±23.33a,c |
| Post 24 h | 20 |
106.79±17.02b | 10.32±2.53b | 15.60±6.32b |
251.85±53.26b |
145.39±35.23b | 11.30±2.40b | 13.29±2.43b |
211.34±49.79b |
| 40 |
124.63±40.56b | 12.64±3.13b | 16.39±4.25b |
273.98±43.13b | 160.74±65.18 | 13.82±3.45b | 16.15±2.34b |
237.35±45.56b |
Discussion
Natural medicine has become a popular topic in
hematological research in recent years due to the high
antineoplastic efficiency and low toxicity of certain natural
compounds. In the current study, the effects and mechanisms of the
natural flavonoid naringenin on the human leukemia cell line K562
as well as on normal human peripheral PMNs were investigated. In
addition, the effects of low-dose naringenin on ADM-induced injury
in K562 cells and PMNs were evaluated. In order to clarify the
dose-response relationship, naringenin concentrations ranging from
50 to 800 μmol/l were tested with the aim of rapidly obtaining
growth inhibition while concurrently avoiding the appearance of
cell necrosis over a certain period of time. The results indicate
that naringenin exerted significant cell proliferation suppressing
effects on K562 cells in a dose- and time-dependent manner.
Microscopic observation also revealed that significant necrosis,
which is indicative of cytotoxicity, occurred when the
concentration of naringenin was increased to 800 μmol/l.
PCNA, a 36-kDa non-histone nucleoprotein that is
synthesized at the G1 and S phases of the cell cycle and
is directly involved in DNA synthesis by acting as a cofactor of
DNA polymerase δ, is a one of the most common indicators of tumor
proliferation kinetics (25).
Gene-mediated regulation of PCNA is an important mechanism by which
cell proliferation is modulated (26). In the current study, it was
observed that the downregulation of PCNA was coincident with the
inhibition of proliferation in K562 cells, which revealed the cell
growth suppression efficiency of naringenin in K562 cells. It was
also found that <100 μmol/l naringenin exhibited a moderate
inhibition rate of <8.1% in PMNs (P>0.05), which was far less
than that in K562 cells. However, statistically significant growth
inhibition of PMNs appeared when the naringenin concentration was
increased to 400 μmol/l. These data suggest that naringenin at low
concentrations inhibited the growth of K562 cells but had little
effect on normal human neutrophils. This phenomenon reveals the
advantage of this natural medicine in antitumor application.
Although the exact mechanism remains unclear, it may be attributed
to the higher metabolic rate of tumor cells compared with that of
normal cells.
Abnormality of apoptosis and cell cycle control,
which widely exist in tumor cells and tissues, are important in
tumor progress and occurrence. As a result, strategies targeting
apoptosis or cell cycle control have been critically significant in
the development of new anticancer agents. In the present study,
morphological changes typical of apoptosis were observed by
Wright-Giemsa staining, immunofluorescent staining, and TEM
observation. However, cytotoxicity rapidly manifested as necrosis
when the concentration of naringenin was increased to 800 μmol. A
quick and accurate analysis of the cell cycle and apoptosis may be
achieved by quantifying cell chromosomes via flow cytometric
techniques. The results of the present study reveal that K562 cells
were arrested in the G0/G1 phase by
naringenin in a concentration-dependent manner. The foregoing
analysis indicates that inducing apoptosis and cell cycle arrest
may be a key mechanism by which naringenin inhibits K562 cell
proliferation. Moreover, cytotoxicity appeared when naringenin was
used at a higher concentration. Sanderson et al (17) reported an inhibitory effect of
naringenin on the human adrenocortical carcinoma cell line H295R
with an IC50 of 85 μmol/l, and found that cytotoxicity
occurred when the concentration exceeded 1,000 μmol/l. Previous
literature (18) suggests that
naringenin induces apoptosis through a caspase-3/CPP32 apoptotic
pathway in HL-60 cells, and has cytotoxic effects at high
doses.
Tumorigenesis is a multi-factorial, multi-stage and
cumulative process that is essentially characterized by the
activation of oncogenes and inactivation of tumor suppressor genes,
the reduction of apoptosis and increase of proliferation, cell
dedifferentiation abnormalities and numerous other aspects of cell
life dysregulation, which eventually lead to uncontrolled growth of
cells (27,28). However, almost all the
dysregulation of oncogenes, tumor suppressor genes and other cell
regulation factors eventually converge as abnormalities of cell
cycle regulation. Therefore, tumors are, in essence, a type of cell
cycle disease. Cell cycle progression is accurately regulated by
complicated network system that consist of cyclins-CDKs-CKIs and
oncogenes/tumor suppressor genes. For example, there is evidence
that p53 and p21 genes play extremely vital roles in regulating the
cell cycle (29). The p21 protein
binds to and inhibits the activity of cyclin-CDK2, −CDK1, and
−CDK4/6 complexes, and thus functions as a regulator of cell cycle
progression at the G1 and S phases (30). p21/WAF1 can also interact with
PCNA, a DNA polymerase accessory factor, and plays a regulatory
role in S phase DNA replication and DNA damage repair. p21/WAF1 is
also known as wild-type p53-activated fragment and acts through
inducing the activity of tumor suppressor gene p53 (31). Anything that impedes the activation
of p53 and p21/WAF1 will result in dysfunction of the negative
regulatory factors on the cell cycle protein complexes, finally
leading to the loss of normal control of the cell cycle and thus
malignant proliferation. In the present study, it was found that
the proliferation of K562 cells was inhibited by naringenin and
cell growth was arrested in the G0/G1 phase
of the cell cycle. In order to elucidate the underlying mechanism,
the expression of p53 and p21/WAF1 was examined by RT-PCR and
western blotting. It was found that p21/WAF1 was expressed at low
levels in the control group, but the expression level increased
significantly in a time-dependent manner following naringenin
treatment, which is similar to the findings reported by Panno et
al (32) in research
concerning the breast carcinoma cell line MCF-7. Therefore, it is
speculated that the induction of p21/WAF1 expression is likely to
be an important mechanism for the antiproliferative effect of
naringenin on K562 cells. However, p21 may inhibit apoptosis and
does not induce cell death on its own (33).
p21 is located downstream of the p53 gene. It has
been confirmed that p21 expression is mediated by p53-dependent and
p53-independent pathways (34–36).
In the former pathway, the expression of p21/WAF1 is tightly
controlled by the tumor suppressor protein p53, through which this
protein mediates p53-dependent cell cycle G1 phase
arrest in response to a variety of stress stimuli (37), including DNA damage or even cancer
cells themselves. However, p21/WAF1 can also be activated directly
by mitogens instead of p53 if cell proliferation is highly active,
which is referred to as a p53-independent pathway. The current
study indicates that the p53 gene was expressed in the control and
therapy groups, and that the expression level remained stable at
various time points and naringenin concentrations, which indicates
that naringenin functions in a p53-independent manner. In a study
concerning seven kinds of natural flavonoids with similar molecular
structures (18), it was reported
that the antitumor effects of these agents were dependent on the
manner of apoptosis induction in a p21- but not p53-dependent
pathway. Kanno et al (16)
concur with this antitumor mechanism of flavonoids. Apoptosis is
gene-encoded programmed cell death, has specific biological
characteristics and is coincident and interrelated with the cell
cycle (35). Conclusions can be
drawn from previous data and analysis that the upregulation of
p21/WAF1 may be the underlying mechanism by which naringenin
inhibits K562 tumor cell growth. However, whether there are other
mechanisms involved in this process is yet to be clarified.
As has been demonstrated by the results of the
present study, naringenin has modest cytotoxicity to normal PMNs.
Naringenin, similar to other natural flavonoids, has also been
demonstrated to be an antioxidant that is characterized by its
ability to scavenge free radicals (38,39).
The present study further explored whether low concentrations of
naringenin (5–80 μmol/l) could generate an antioxidative effect so
as to alleviate the toxicity of ADM to normal cells. ADM, one of
the most potent anthracyclines with a wide spectrum of anticancer
activity, has been shown to be effective in the treatment of acute
leukemia, lymphoma and several solid tumors (40). However, side-effects of the agent
are also evident as it kills normal cells in chemotherapy. In the
present study, when naringenin was added to PMNs 1 h after the
addition of ADM, the chemotherapeutic injury to the PMNs was
significantly decreased, whereas there was little effect on K562
cells to which exactly the same drug treatments were administered.
It was also observed that intracellular antioxidant enzyme
activities increased and oxidation products decreased in PMNs but
not K562 cells, when naringenin was added 1 h after ADM treatment;
thus, the effects of the ADM treatment in strongly upregulating the
oxidation products of ROS and MDA and downregulating the activities
of the antioxidant enzymes GSH-Px and SOD were attenuated. This
reveals that the addition of naringenin can help to reduce
chemotherapeutic injury to normal cells without decreasing the
cytotoxicity of ADM to K562 cells, as ADM may kill tumor cells by a
mechanism other than by the induction of oxidative damage. These
results suggest that low-dose naringenin helps to ameliorate the
ADM-induced chemotherapeutic injury of normal blood cells without
weakening its cytotoxic effect on tumor cells via oxidative
modulating effects on pathways inhibiting oxidant production and
increasing antioxidant activity.
Biomembranes of tissues are one of the most
important targets for free radicals to act on. Free radicals that
are not removed by the defense mechanism of the body may induce
lipid peroxidation of the membrane, resulting in its dysfunction,
such as by gap formation, enzyme inactivation and changing its
flowability. van Acker et al (41) reported that a glutathione-dependent
protective effect was restored when naringenin was injected into
α-tocopherol-deficient microsomes, which indicates that flavonoid
antioxidants such as naringenin act similarly to α-tocopherol. It
was observed that Fe2+- and vitamin C-induced lipid
peroxidation was inhibited by naringenin via restoration of the
protective effect of glutathione in liver microsomes. Jeon et
al (24) found that naringenin
and its metabolites significantly improved SOD and GSH-Px activity
in rat liver cytosol. Badary et al (42) observed a much higher antioxidant
enzyme level and statically improved renal function in rats treated
with a combination of naringenin and cisplatin compared with those
in rats treated with cisplatin alone in their study, indicating
that naringenin reduced cisplatin-induced renal toxicity. Arafa
et al (43) reported that
pretreatment with naringenin was helpful in reducing ADM-induced
cardiotoxicity in rats. The current study and the aforementioned
related findings provide new inspiration for chemotherapy using
exogenous antioxidants in clinical oncology.
In conclusion, the present study revealed the
promising value of naringenin in leukemia treatment. Naringenin
demonstrated a significant inhibitory effect on the growth of K562
cells, whereas at low concentrations it did not exhibit a cytotoxic
effect on normal PMNs. Furthermore, naringenin protected PMNs from
oxidative damage by ADM at low concentrations. Cell cycle arrest
and the induction of apoptosis, achieved via the p53-independent
upregulation of p21/WAF1, a downstream effect of the
phosphoinositide 3-kinase (PI3K) pathway, may be the mechanism of
the antileukemic effects exhibited by naringenin. The protective
effect against the damaging effects of ADM chemotherapy in PMNs may
be the result of the antioxidant activity of this agent at its low
concentrations. Future studies to elucidate the effects of
naringenin and its mechanism are required to further evaluate the
value of naringenin in leukemia treatment.
References
|
1
|
Yang C and Zhang X: Incidence survey of
leukemia in China. Chin Med Sci J. 6:65–70. 1991.PubMed/NCBI
|
|
2
|
Friesen C, Herr I, Krammer PH and Debatin
KM: Involvement of the CD95 (APO-1/FAS) receptor/ligand system in
drug-induced apoptosis in leukemia cells. Nat Med. 2:574–577. 1996.
View Article : Google Scholar : PubMed/NCBI
|
|
3
|
Durgo K, Koncar M, Komes D, et al:
Cytotoxicity of blended versus single medicinal mushroom extracts
on human cancer cell lines: contribution of polyphenol and
polysaccharide content. Int J Med Mushrooms. 15:435–448. 2013.
View Article : Google Scholar : PubMed/NCBI
|
|
4
|
Ravishankar D, Rajora AK, Greco F and
Osborn HM: Flavonoids as prospective compounds for anti-cancer
therapy. Int J Biochem Cell Biol. 45:2821–2831. 2013. View Article : Google Scholar : PubMed/NCBI
|
|
5
|
Ameer B, Weintraub RA, Johnson JV, Yost RA
and Rouseff RL: Flavanone absorption after naringin, hesperidin,
and citrus administration. Clin Pharmacol Ther. 60:34–40. 1996.
View Article : Google Scholar : PubMed/NCBI
|
|
6
|
Galati G, Chan T, Wu B and O’Brien PJ:
Glutathione-dependent generation of reactive oxygen species by the
peroxidase-catalyzed redox cycling of flavonoids. Chem Res Toxicol.
12:521–525. 1999. View Article : Google Scholar : PubMed/NCBI
|
|
7
|
Shi Y, Dai J, Liu H, et al: Naringenin
inhibits allergen-induced airway inflammation and airway
responsiveness and inhibits NF-kappaB activity in a murine model of
asthma. Can J Physiol Pharmacol. 87:729–735. 2009. View Article : Google Scholar : PubMed/NCBI
|
|
8
|
Arul D and Subramanian P: Inhibitory
effect of naringenin (citrus flavonone) on N-nitrosodiethylamine
induced hepatocarcinogenesis in rats. Biochem Biophys Res Commun.
434:203–209. 2013. View Article : Google Scholar : PubMed/NCBI
|
|
9
|
Lv Y, Zhang B, Xing G, Wang F and Hu Z:
Protective effect of naringenin against acetaminophen-induced acute
liver injury in metallothionein (MT)-null mice. Food Funct.
4:297–302. 2013. View Article : Google Scholar
|
|
10
|
Tsai SJ, Huang CS, Mong MC, Kam WY, Huang
HY and Yin MC: Anti-inflammatory and antifibrotic effects of
naringenin in diabetic mice. J Agric Food Chem. 60:514–521. 2012.
View Article : Google Scholar
|
|
11
|
Andrade JE and Burgess JR: Effect of the
citrus flavanone naringenin on oxidative stress in rats. J Agric
Food Chem. 55:2142–2148. 2007. View Article : Google Scholar : PubMed/NCBI
|
|
12
|
Lee S, Lee CH, Moon SS, et al: Naringenin
derivatives as anti-atherogenic agents. Bioorg Med Chem Lett.
13:3901–3903. 2003. View Article : Google Scholar : PubMed/NCBI
|
|
13
|
Totta P, Acconcia F, Leone S, Cardillo I
and Marino M: Mechanisms of naringenin-induced apoptotic cascade in
cancer cells: involvement of estrogen receptor alpha and beta
signalling. IUBMB Life. 56:491–499. 2004. View Article : Google Scholar : PubMed/NCBI
|
|
14
|
Harmon AW and Patel YM: Naringenin
inhibits glucose uptake in MCF-7 breast cancer cells: a mechanism
for impaired cellular proliferation. Breast Cancer Res Treat.
85:103–110. 2004. View Article : Google Scholar : PubMed/NCBI
|
|
15
|
Gao K, Henning SM, Niu Y, et al: The
citrus flavonoid naringenin stimulates DNA repair in prostate
cancer cells. J Nutr Biochem. 17:89–95. 2006. View Article : Google Scholar
|
|
16
|
Kanno S, Tomizawa A, Hiura T, et al:
Inhibitory effects of naringenin on tumor growth in human cancer
cell lines and sarcoma S-180-implanted mice. Biol Pharm Bull.
28:527–530. 2005. View Article : Google Scholar : PubMed/NCBI
|
|
17
|
Sanderson JT, Hordijk J, Denison MS,
Springsteel MF, Nantz MH and van den Berg M: Induction and
inhibition of aromatase (CYP19) activity by natural and synthetic
flavonoid compounds in H295R human adrenocortical carcinoma cells.
Toxicol Sci. 82:70–79. 2004. View Article : Google Scholar : PubMed/NCBI
|
|
18
|
Chen YC, Shen SC and Lin HY: Rutinoside at
C7 attenuates the apoptosis-inducing activity of flavonoids.
Biochem Pharmacol. 66:1139–1150. 2003. View Article : Google Scholar : PubMed/NCBI
|
|
19
|
Kanno S, Shouji A, Hirata R, Asou K and
Ishikawa M: Effects of naringin on cytosine arabinoside
(Ara-C)-induced cytotoxicity and apoptosis in P388 cells. Life Sci.
75:353–365. 2004. View Article : Google Scholar : PubMed/NCBI
|
|
20
|
Lozzio CB and Lozzio BB: Human chronic
myelogenous leukemia cell-line with positive Philadelphia
chromosome. Blood. 45:321–334. 1975.PubMed/NCBI
|
|
21
|
Gewirtz AM, Burger D, Rado TA, Benz EJ Jr
and Hoffman R: Constitutive expression of platelet glycoproteins by
the human leukemia cell line K562. Blood. 60:785–789.
1982.PubMed/NCBI
|
|
22
|
Iwabuchi K, Nagaoka I, Someya A and
Yamashita T: Type IV collagen-binding proteins of neutrophils:
possible involvement of L-selectin in the neutrophil binding to
type IV collagen. Blood. 87:365–372. 1996.PubMed/NCBI
|
|
23
|
Dalrymple S, Antony L, Xu Y, et al: Role
of notch-1 and E-cadherin in the differential response to calcium
in culturing normal versus malignant prostate cells. Cancer Res.
65:9269–9279. 2005. View Article : Google Scholar : PubMed/NCBI
|
|
24
|
Jeon SM, Kim HK, Kim HJ, et al:
Hypocholesterolemic and antioxidative effects of naringenin and its
two metabolites in high-cholesterol fed rats. Translat Res.
149:15–21. 2007. View Article : Google Scholar
|
|
25
|
Dieckman LM, Freudenthal BD and Washington
MT: PCNA structure and function: insights from structures of PCNA
complexes and post-translationally modified PCNA. Subcell Biochem.
62:281–299. 2012. View Article : Google Scholar : PubMed/NCBI
|
|
26
|
Gehen SC, Vitiello PF, Bambara RA, Keng PC
and O’Reilly MA: Downregulation of PCNA potentiates p21-mediated
growth inhibition in response to hyperoxia. Am J Physiol Lung Cell
Mol Physiol. 292:L716–L724. 2007. View Article : Google Scholar
|
|
27
|
Pedraza-Fariña LG: Mechanisms of oncogenic
cooperation in cancer initiation and metastasis. Yale J Biol Med.
79:95–103. 2006.
|
|
28
|
Croce CM: Oncogenes and cancer. New Engl J
Med. 358:502–511. 2008. View Article : Google Scholar : PubMed/NCBI
|
|
29
|
Lee EW, Lee MS, Camus S, et al:
Differential regulation of p53 and p21 by MKRN1 E3 ligase controls
cell cycle arrest and apoptosis. EMBO J. 28:2100–2113. 2009.
View Article : Google Scholar : PubMed/NCBI
|
|
30
|
Gartel AL and Radhakrishnan SK: Lost in
transcription: p21 repression, mechanisms, and consequences. Cancer
Res. 65:3980–3985. 2005. View Article : Google Scholar : PubMed/NCBI
|
|
31
|
Insinga A, Cicalese A, Faretta M, et al:
DNA damage in stem cells activates p21, inhibits p53, and induces
symmetric self-renewing divisions. Proc Natl Acad Sci USA.
110:3931–3936. 2013. View Article : Google Scholar : PubMed/NCBI
|
|
32
|
Panno ML, Giordano F, Mastroianni F, et
al: Evidence that low doses of Taxol enhance the functional
transactivatory properties of p53 on p21 waf promoter in MCF-7
breast cancer cells. FEBS Lett. 580:2371–2380. 2006. View Article : Google Scholar : PubMed/NCBI
|
|
33
|
Almond JB and Cohen GM: The proteasome: a
novel target for cancer chemotherapy. Leukemia. 16:433–443. 2002.
View Article : Google Scholar : PubMed/NCBI
|
|
34
|
Chinery R, Brockman JA, Peeler MO, Shyr Y,
Beauchamp RD and Coffey RJ: Antioxidants enhance the cytotoxicity
of chemotherapeutic agents in colorectal cancer: a p53-independent
induction of p21WAF1/CIP1 via C/EBPbeta. Nat Med. 3:1233–1241.
1997. View Article : Google Scholar : PubMed/NCBI
|
|
35
|
Waldman T, Zhang Y, Dillehay L, et al:
Cell-cycle arrest versus cell death in cancer therapy. Nat Med.
3:1034–1036. 1997. View Article : Google Scholar : PubMed/NCBI
|
|
36
|
Wu Q, Kirschmeier P, Hockenberry T, et al:
Transcriptional regulation during p21WAF1/CIP1-induced apoptosis in
human ovarian cancer cells. J Biol Chem. 277:36329–36337. 2002.
View Article : Google Scholar : PubMed/NCBI
|
|
37
|
Rodriguez R and Meuth M: Chk1 and p21
cooperate to prevent apoptosis during DNA replication fork stress.
Mol Biol Cell. 17:402–412. 2006. View Article : Google Scholar :
|
|
38
|
Rodriguez RJ, Miranda CL, Stevens JF,
Deinzer ML and Buhler DR: Influence of prenylated and
non-prenylated flavonoids on liver microsomal lipid peroxidation
and oxidative injury in rat hepatocytes. Food Chem Toxicol.
39:437–445. 2001. View Article : Google Scholar : PubMed/NCBI
|
|
39
|
Lee MK, Bok SH, Jeong TS, et al:
Supplementation of naringenin and its synthetic derivative alters
antioxidant enzyme activities of erythrocyte and liver in high
cholesterol-fed rats. Bioorg Med Chem. 10:2239–2244. 2002.
View Article : Google Scholar : PubMed/NCBI
|
|
40
|
Harrison C: Anticancer drugs: A double
strike at kinases. Nature reviews Drug Discov. 9:2702010.
View Article : Google Scholar
|
|
41
|
van Acker FA, Schouten O, Haenen GR, van
der Vijgh WJ and Bast A: Flavonoids can replace alpha-tocopherol as
an antioxidant. FEBS Lett. 473:145–148. 2000. View Article : Google Scholar : PubMed/NCBI
|
|
42
|
Badary OA, Abdel-Maksoud S, Ahmed WA and
Owieda GH: Naringenin attenuates cisplatin nephrotoxicity in rats.
Life Sci. 76:2125–2135. 2005. View Article : Google Scholar : PubMed/NCBI
|
|
43
|
Arafa HM, Abd-Ellah MF and Hafez HF:
Abatement by naringenin of doxorubicin-induced cardiac toxicity in
rats. J Egypt Natl Canc Inst. 17:291–300. 2005.
|