Introduction
Diabetic retinopathy (DR), or damage to blood
vessels of the retina, is a serious complication of diabetes. With
the rising incidence of diabetes, DR is a common ocular fundus
lesion and a leading cause of blindness and visual impairment
(1–4). Worldwide prevalence of DR is 30–60% of
individuals with diabetes and the prevalence in China is 35.6–63.5%
(1–4).
Diffusion-weighted imaging (DWI) is a functional
magnetic resonance imaging (MRI) technique that may be used in the
central nervous system and is able to effectively provide
information on pathological changes in the brain (5). DWI has become an important approach for
radiographic diagnosis of brain lesions, including Parkinson's
disease, tumors and cerebral apoplexy, as well as liver diseases
(6–8). DWI may be used to calculate the
apparent diffusion coefficient (ADC), a measure of brain injury, as
it assesses diffusion of water molecules from blood vessels
(9).
Early identification of DR is important to manage
the disease and prevent progression to blindness. DR has been
associated with injury to visual centers of the brain using
DWI-measured ADC values (10). As
the pathogenesis of brain injury is not fully understood, an
effective approach to detect early injuries is required to improve
the prognosis of individuals with DR.
The present study explored the correlation between
DR and functional brain injury by comparing clinical data and
weighted imaging from 63 individuals with type 2 diabetes and 21
healthy control individuals.
Subjects and methods
Subjects
The present study was approved by the Ethics
Committee of Heilongjiang Provincial Hospital (Harbin, China) and
informed consent was obtained from all subjects. The study cohort
included 63 individuals with type 2 diabetes who were admitted to
the Heilongjiang Provincial Hospital between April 2014 and April
2015. Of the 63 diabetic individuals, 31 were male (49.21%) and 32
were female (50.79%). Type 2 diabetes was diagnosed using the
criteria established by the American Diabetes Association (11,12).
Based on funduscopy and fundus fluorescein
angiography, diabetic individuals were divided into three groups.
Group 1 included 21 proliferative diabetic retinopathy (PDR) cases,
of which 11 were male (52.38%) and 10 were female (47.62%). Group 1
had a mean age of 54.95±10.86 years, a mean disease duration of
11.92±6.59 years and symptoms including vitreous hemorrhage and
preretinal hemorrhage. Group 2 was composed of 21 non-proliferative
diabetic retinopathy (NPDR) cases, of which 10 were male (47.62%)
and 11 were female (52.38%). Group 2 had a mean age of 55.10±8.95
years, a mean disease duration of 8.12±3.71 years and symptoms
including retinal hemorrhage and microangiomas. Group 3 included 21
diabetic without retinopathy cases, of which 10 were male (47.62%)
and 11 were female (52.38%). Group 3 had a mean age of 54.73±6.05
years and a mean disease duration of 5.67±2.48 years.
The study also included 21 healthy volunteers who
received examinations at Heilongjiang Provincial Hospital during
the same period. Of the 21 healthy individuals, 11 were male
(52.38%) and 10 were female (47.62%), with a mean age of 55.12±7.60
years. The diagnostic criteria for healthy volunteers were as
follows: No type 2 diabetes; no cataracts, glaucoma or other eye
lesions; no history of symptomatic cerebral apoplexy; and no other
brain diseases. Regarding sex and age, there were no significant
differences between the PDR, NPDR, diabetic without retinopathy and
healthy control groups (P>0.05).
Data collection
Patients' blood glucose and glycated hemoglobin
(HbAlc) levels were measured 10 h after fasting. Following this,
fundus fluorescein angiography was performed. The
immunoturbidimetry reagents for detection of HbAlc, matched quality
control and calibration were manufactured by Randox Laboratories,
Ltd. (Crumlin, UK). The tests were conducted on an automatic
biochemistry analyzer (Hitachi 7600; Hitachi, Ltd., Tokyo, Japan)
for quality control using fresh blood with anticoagulant
ethylenediaminetetraacetic acid-K2 (Humica Weihai International
Co., Ltd., Weihai, China).
MRI
A Philips Intera Master 3.0T superconducting MR
scanner (Philips Medical Systems, Eindhoven, The Netherlands) was
used for all MRI. Scan sequences included DWI, fluid-attenuated
inversion recovery (FLAIR), T1-weighted imaging (T1WI) and
T2-weighted imaging (T2WI). Scan parameters were as follows: DWI,
echo time (TE)=60 msec and repetition time (TR)=1,924 msec; FLAIR,
TE=136 msec and TR=8,700 msec; T1WI, TE=15 msec and TR=560 msec;
and T2WI, TE=61 msec and TR=2,363 msec. Other parameters included:
Field of view of 230 mm; matrix size of 128×128 mm; number of
excitations of 2; slice thickness of 4 mm; number of slices of 25;
scan time of 28 sec; slice gap of 1 mm; and diffusion sensitivity
of 0 or 1,000 sec/mm2.
ADC
ADC was used as an index of the magnitude of
diffusion, and mean ADC values were calculated to analyze diffusion
changes. As previously described, seven regions of interest (ROI)
in the brain were selected, and their ADC values were measured
(10). When selecting ROI, regions
that contained cerebrospinal fluid and artifacts were avoided to
preserve the accuracy of ADC values. The areas of measured regions
included: Thalamus, 50–60 mm2; visual cortex, 80–100
mm2; corona radiate, 70–80 mm2; dorsolateral
frontal cortex; cingulate gyrus; dorsomedial frontal cortex; and
orbitofrontal cortex, 30–40 mm2 (Fig. 1).
Statistical analysis
Double data entry was performed using EpiData
version 3.1 software (EpiData Association, Odense, Denmark) to
create a data bank, and logic checks were performed with SAS
version 9.2 software (SAS Institute, Inc., Cary, NC, USA).
Statistical methods included analysis of variance (ANOVA) with
Student-Newman-Keuls (SNK) method for comparison among multiple
means and Spearman's rho correlation. MedCalc (version 16.2;
MedCalc Software, Ostend, Belgium) was used to draw receiver
operating characteristic (ROC) curves. Data are presented as the
mean ± standard deviation. P<0.05 was considered to indicate a
statistically significant difference.
Results
Comparison of disease duration and
HbAlc levels
ANOVA demonstrated that disease duration
(P<0.001) and HbAlc levels (P=0.004) were significantly
different among the PDR, NPDR and diabetic without retinopathy
groups (Table I). However, SNK
method comparison demonstrated that disease duration was only
significantly different between the PDR and diabetic without
retinopathy groups, with PDR having a longer disease duration than
the diabetic without retinopathy group (P<0.05). HbAlc levels
were also significantly higher in the PDR group than in the
diabetic without retinopathy group (P<0.05); however, this did
not differ significantly between the other groups.
 | Table I.Demographic and clinical features of
patients. |
Table I.
Demographic and clinical features of
patients.
| Group | n | Disease duration,
years | HbAlc, % |
|---|
| PDR | 21 |
12.25±7.03a |
9.71±2.73a |
| NPDR | 21 | 8.24±3.59 | 7.92±1.68 |
| Diabetic without
retinopathy | 21 | 5.57±2.73 | 7.13±0.84 |
| F |
| 8.47 | 6.95 |
| P-value |
| <0.001 |
0.004 |
Comparison of mean ADC values in
functional areas of the brain
Mean ADC values in cingulate gyri, orbitofrontal
cortices and visual cortices were significantly different among
PDR, NPDR, diabetic without retinopathy and control groups
(P<0.001; Table II). SNK method
comparison demonstrated that mean ADC values in cingulate gyri,
orbitofrontal cortices and visual cortices were significantly
higher in the PDR group than NPDR group, and significantly higher
in the NPDR group than diabetic without retinopathy or control
groups (P<0.05). Mean ADC values in thalami, coronae radiatae,
dorsolateral frontal cortices and dorsomedial frontal cortices did
not significantly differ among the four groups (P>0.05).
| Table II.ADC in functional brain areas of
patients. |
Table II.
ADC in functional brain areas of
patients.
|
|
| ADC |
|---|
|
|
|
|
|---|
| Group | n | Cingulate gyrus | OFC | Visual cortex | Thalamus | Corona radiate | DMFC | DLFC |
|---|
| PDR | 21 | 813.71±26.76 | 827.93±35.04 | 810.64±18.32 | 730.62±22.07 | 706.29±28.41 | 714.87±23.36 | 712.03±23.41 |
| NPDR | 21 |
786.91±26.10a |
796.57±28.16a |
791.98±28.42a | 727.34±21.36 | 703.50±14.82 | 710.02±16.07 | 709.12±15.62 |
| Diabetic without
retinopathy | 21 |
723.68±18.96b |
723.50±24.76b |
711.08±23.17b | 727.12±18.67 | 706.11±11.70 | 709.50±25.67 | 703.87±16.60 |
| Control | 21 |
733.60±23.82a,b |
713.07±23.14a,b |
709.35±25.73a,b | 721.06±19.30 | 702.93±20.65 | 708.71±20.62 | 701.36±21.75 |
| F |
| 70.69 | 71.25 | 67.53 | 0.86 | 0.17 | 0.45 | 0.89 |
| P-value |
| <0.001 | <0.001 | <0.001 | 0.403 | 0.73 | 0.61 | 0.42 |
Correlations of HbAlc levels and
disease duration with mean ADC values in functional areas of the
brain
Spearman's rho correlation was used to analyze
correlations of HbAlc levels and disease duration with mean ADC
values in the cingulate gyri, orbitofrontal cortices and visual
cortices in PDR, NPDR and diabetic without retinopathy groups.
HbAlc levels were positively correlated with mean ADC values in
cingulate gyri (r=0.287; P=0.047), orbitofrontal cortices (r=0.328;
P=0.021), and visual cortices (r=0.361; P=0.015; Table III). Disease duration was also
positively correlated with mean ADC values in cingulate gyri
(r=0.517; P=0.006), orbitofrontal cortices (r=0.583; P<0.001)
and visual cortices (r=0.467; P=0.001).
| Table III.Correlation of ADC with disease
duration and HbAlc level. |
Table III.
Correlation of ADC with disease
duration and HbAlc level.
|
| ADC, R (P) |
|---|
|
|
|
|---|
| Variable | Cingulate gyrus | OFC | Visual cortex |
|---|
| HbAlc | 0.287 (0.047) | 0.328 (0.021) | 0.361 (0.015) |
| Disease duration | 0.517 (0.006) | 0.583
(<0.001) | 0.467 (0.001) |
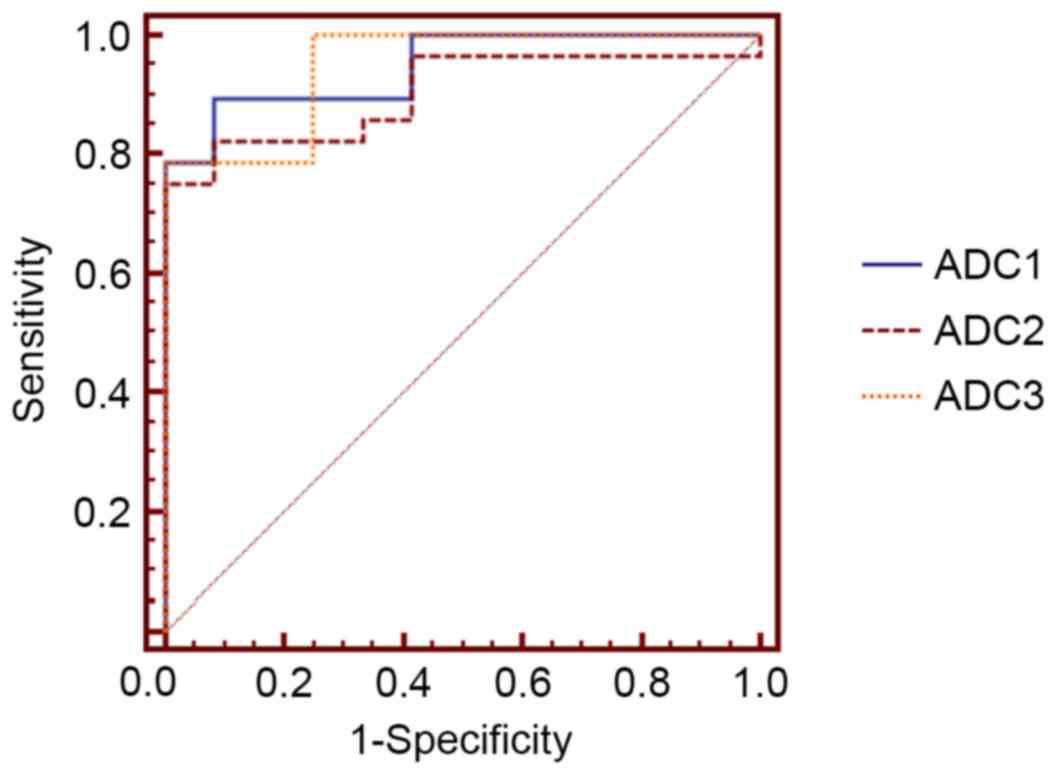
ROC curve analysis of functional brain
injuries in patients with type 2 diabetes with retinopathy
ROC curve analysis of ADC values was used to judge
injuries to visual centers of the brain in type 2 diabetic patients
with retinopathy. In the cingulate gyrus, the area under the ROC
curve was 0.902 [95% confidence interval (CI)=0.766–0.973], with a
diagnostic cut-off value of 753.000, a sensitivity of 0.816 and a
specificity of 0.851 (Fig. 2). In
the orbitofrontal cortex, the area under the ROC curve was 0.946
(95% CI=0.826–0.993), with a diagnostic cut-off value of 749.600, a
sensitivity of 0.855 and a specificity of 0.907. In the visual
cortex, the area under the ROC curve was 0.952 (95%
CI=0.826–0.993), with a diagnostic cut-off value of 739.800, a
sensitivity of 0.862 and a specificity of 0.914.
Discussion
DR is a leading cause of blindness and visual
impairment in patients with diabetes and is correlated with
functional brain injuries (13). DWI
is able to effectively provide information on pathological changes
in the brain, including information on the diffusion rate of water
molecules in tissues, transport of intracellular and extracellular
water molecules, and microscopic and geometric structures of
tissues, thus it offers an important basis for early diagnosis of
diabetic encephalopathy (14). DWI
may be used to calculate ADC, a measure of the diffusion capacity
of water molecules in tissues, which can assess the degree of
microstructural injuries in human tissues.
In the present study, mean ADC values were
significantly higher in specific brain regions of individuals in
the PDR group compared to the NPDR group. Mean ADC values were also
significantly higher in the same brain regions of the NPDR group
than in the diabetic without retinopathy or control groups. This
result suggests that injuries to functional areas of the brain are
correlated with DR. The results of the present study correlate with
previous reports of increased ADC values in functional brain areas,
which may be correlated with gliosis or nerve cell death (10,15). ADC
values in visual cortices of PDR and NPDR groups may be higher than
those in diabetic without retinopathy and control groups as DR may
reduce stimulation of visual cortices and lead to fine structural
changes. Similarly, previous studies have demonstrated that visual
dysfunction may lead to structural changes in the occipital cortex
of amblyopic patients (16).
HbAlc levels represent a patient's blood sugar level
over the past 3 months and are an important indicator of DR
(17). Effective control of blood
sugar may reduce the incidence of DR. In the present study, HbAlc
levels were positively correlated with mean ADC values in the
cingulate gyri, orbitofrontal cortices and visual cortices. Disease
duration was also positively correlated with mean ADC values in
these areas of the brain. This may be because longer disease
duration affords greater diffusion capacity of water molecules,
which is caused by neuronal degeneration in functional areas of the
brain (18).
In the present study, ROC curve analysis was used to
determine ADC values to judge functional brain injuries. In the
cingulate gyrus, orbitofrontal cortex and visual cortex, all areas
under ROC curves were >0.9, with high sensitivities and
specificities, indicating that ADC may be used to assess functional
brain injuries caused by DR. In conclusion, the results from the
present study demonstrate that retinopathy in individuals with type
2 diabetes is correlated with functional brain injuries. DWI is an
effective tool to assess such injuries in early DR and therefore
may be a powerful technique for the prevention and treatment of
DR.
References
|
1
|
Sivaprasad S, Gupta B, Crosby-Nwaobi R and
Evans J: Prevalence of diabetic retinopathy in various ethnic
groups: A worldwide perspective. Sur Ophthalmol. 57:347–370. 2012.
View Article : Google Scholar
|
|
2
|
Liu L, Wu X, Liu L, Geng J, Yuan Z, Shan Z
and Chen L: Prevalence of diabetic retinopathy in mainland China: A
meta-analysis. PLoS One. 7:e452642012. View Article : Google Scholar : PubMed/NCBI
|
|
3
|
Xu J, Xu L, Wang YX, You QS, Jonas JB and
Wei WB: Ten-year cumulative incidence of diabetic retinopathy. The
Beijing Eye Study 2001/2011. PLoS One. 9:e1113202014. View Article : Google Scholar : PubMed/NCBI
|
|
4
|
Liu L and Chen L: Awareness of diabetic
retinopathy is the key step for early prevention, diagnosis and
treatment of this disease in China. Patient Educ Couns. 94:284–285.
2014. View Article : Google Scholar : PubMed/NCBI
|
|
5
|
Rangarajan K, Das CJ, Kumar A and Gupta
AK: MRI in central nervous system infections: A simplified
patterned approach. World J Radiol. 6:716–725. 2014. View Article : Google Scholar : PubMed/NCBI
|
|
6
|
Mars RB, Jbabdi S, Sallet J, O'Reilly JX,
Croxson PL, Olivier E, Noonan MP, Bergmann C, Mitchell AS, Baxter
MG, et al: Diffusion-weighted imaging tractography-based
parcellation of the human parietal cortex and comparison with human
and macaque resting-state functional connectivity. J Neurosci.
31:4087–4100. 2011. View Article : Google Scholar : PubMed/NCBI
|
|
7
|
Taouli B: Diffusion-weighted MR imaging
for liver lesion characterization: A critical look. Radiology.
262:378–380. 2012. View Article : Google Scholar : PubMed/NCBI
|
|
8
|
Vargas HA, Akin O, Franiel T, Mazaheri Y,
Zheng J, Moskowitz C, Udo K, Eastham J and Hricak H:
Diffusion-weighted endorectal MR imaging at 3 T for prostate
cancer: Tumor detection and assessment of aggressiveness.
Radiology. 259:775–784. 2011. View Article : Google Scholar : PubMed/NCBI
|
|
9
|
Shakir A, Aksoy D, Mlynash M, Harris OA,
Albers GW and Hirsch KG: Prognostic value of quantitative
diffusion-weighted MRI in patients with traumatic brain injury. J
Neuroimaging. 26:103–108. 2016. View Article : Google Scholar : PubMed/NCBI
|
|
10
|
Dogan M, Ozsoy E, Doganay S, Burulday V,
Firat PG, Ozer A and Alkan A: Brain diffusion-weighted imaging in
diabetic patients with retinopathy. Eur Rev Med Pharmacol Sci.
16:126–131. 2012.PubMed/NCBI
|
|
11
|
Buysschaert M, Medina JL, Buysschaert B
and Bergman M: Definitions (and current controversies) of diabetes
and prediabetes. Curr Diabetes Rev. 12:8–13. 2016. View Article : Google Scholar : PubMed/NCBI
|
|
12
|
Sacks DB, Arnold M, Bakris GL, Bruns DE,
Horvath AR, Kirkman MS, Lernmark A, Metzger BE and Nathan DM;
National Academy of Clinical Biochemistry; Evidence-Based
Laboratory Medicine Committee of the American Association for
Clinical Chemistry, : Guidelines and recommendations for laboratory
analysis in the diagnosis and management of diabetes mellitus.
Diabetes Care. 34:e61–e99. 2011. View Article : Google Scholar : PubMed/NCBI
|
|
13
|
Hajar S, Al Hazmi A, Wasli M, Mousa A and
Rabiu M: Prevalence and causes of blindness and diabetic
retinopathy in Southern Saudi Arabia. Saudi Med J. 36:449–455.
2015. View Article : Google Scholar : PubMed/NCBI
|
|
14
|
Glaser NS, Marcin JP, Wootton-Gorges SL,
Buonocore MH, Rewers A, Strain J, DiCarlo J, Neely EK, Barnes P and
Kuppermann N: Correlation of clinical and biochemical findings with
diabetic ketoacidosis-related cerebral edema in children using
magnetic resonance diffusion-weighted imaging. J Pediatr.
153:541–546. 2008. View Article : Google Scholar : PubMed/NCBI
|
|
15
|
Rock JP, Scarpace L, Hearshen D, Gutierrez
J, Fisher JL, Rosenblum M and Mikkelsen T: Associations among
magnetic resonance spectroscopy, apparent diffusion coefficients,
and image-guided histopathology with special attention to radiation
necrosis. Neurosurgery. 54:1111–1119. 2004. View Article : Google Scholar : PubMed/NCBI
|
|
16
|
Löwel S and Engelmann R: Neuroanatomical
and neurophysiological consequences of strabismus: Changes in the
structural and functional organization of the primary visual cortex
in cats with alternating fixation and strabismic amblyopia.
Strabismus. 10:95–105. 2002. View Article : Google Scholar : PubMed/NCBI
|
|
17
|
Nakagami T, Takahashi K, Suto C, Oya J,
Tanaka Y, Kurita M, Isago C, Hasegawa Y, Ito A and Uchigata Y:
Diabetes diagnostic thresholds of the glycated hemoglobin A1c and
fasting plasma glucose levels considering the 5-year incidence of
retinopathy. Diabetes Res Clin Pract. 124:20–29. 2017. View Article : Google Scholar : PubMed/NCBI
|
|
18
|
Ishii A, Takemoto M, Iida S and Kanatsuka
A: Abdominal induration caused by repeated same site insulin
injections is related to the HbAlc level and diurnal fasting blood
glucose variation in type 2 diabetics. J Japan Diab Soc. 58:94–99.
2015.
|