Introduction
Cerebral glioma is the most important and common
type of primary brain tumor (1).
Sufficient grading of gliomas is important, as the clinical
treatment and prognosis differ between distinct grades of tumor.
However, conventional magnetic resonance imaging (MRI) may not
accurately predict the glioma grade in all instances. Several
advanced MRI methods have therefore been introduced for grading of
gliomas (2,3). Diffusion-weighted imaging (DWI) is
applied routinely for grading gliomas, as it provides the valuable
information of cellularity and extracellular spaces within tumors
(4). The apparent diffusion
coefficient (ADC) derived from DWI is negatively correlated with
cell density and certain proliferation indices (4–6).
Furthermore, the ADC is significantly different between low-grade
gliomas (LGGs) and high-grade gliomas (HGGs) (6,7).
However, discrepancies in the DWI results exist
among available studies (8,9), as the pathological criterion for
grading gliomas includes not only cellularity, but also vascular
and cellular proliferation (10).
Therefore, susceptibility-weighted imaging (SWI) has been added to
routine neuroimaging to increase the sensitivity vs. susceptibility
effects of microvenous structures and blood products (11). Intratumoral susceptibility signal
intensity (ITSS) is defined as low signal intensity seen within the
tumor on magnitude images of SWI and is useful for assessing the
World Health Organization (WHO) tumor grade (12). Various studies have demonstrated the
usefulness of this technique at 3T or 7T for grading gliomas
(13–15).
Combination of different imaging modalities has the
potential to increase the diagnostic accuracy by providing
complementary information (2,16) and
comparative analysis of these techniques is also required. However,
only few studies have combined the diagnostic performance of SWI
with other methods for glioma grading (12,17). To
the best of our knowledge, the combination of SWI with DWI has not
been fully addressed, yet. Furthermore, the present study
hypothesized that there may be a correlation between the parameters
derived from DWI and SWI, as the cell density and proliferation are
expected to be associated with microvenous structures and remnants
of blood in tumors. The present study aimed to evaluate the
contribution of DWI and SWI in the grading of gliomas and assess
the association between DWI- and SWI-derived parameters.
Materials and methods
Subjects
The local institutional review board of the
Affiliated Wujin Hospital of Jiangsu University (Jiangsu, China)
approved the present study. Due to the retrospective nature of the
study, informed consent was waived. The study included all glioma
patients who underwent surgery (subtotal or total resection of the
tumor) and were confirmed by an experienced neuropathologist
according to the WHO classification system at the Affiliated Wujin
Hospital of Jiangsu University (Jiangsu, China) between February
2015 and August 2016 (18). The
exclusion criteria were as follows: i) Contraindication regarding
the application of gadopentetate dimeglumine (renal dysfunction or
allergy), ii) radiotherapy or chemotherapy prior to surgery, iii)
contraindication for high-field strength MRI (known metallic
implants and/or claustrophobia) and iv) poor visualization of the
tumor on MRI. None of the patients had any history of surgery for
brain tumors. The parameters derived from DWI and SWI were
retrospectively evaluated.
Image acquisition
All examinations were performed on a Siemens Trio
Tim 3 T Excite HDMR scanner (Siemens AG, Munich, Germany) using an
eight-channel head coil. All patients underwent T1-weighted imaging
(T1WI), T2WI, fluid-attenuated inversion recovery, DWI, SWI and
contrast-enhanced T1WI. DWI was performed using a single-shot
echo-planar imaging sequence with the following parameters:
Repetition time (TR)/echo time (TE), 6,000/60 msec; number of
excitations (NEX), 2; flip angle (FA), 90°; slice thickness, 5 mm;
slice gap, 1 mm; field of view (FOV), 220×220 mm; matrix size,
128×128; total acquisition time, 1 min 59 sec. ADC maps were
generated from DWI in the b-value range of 1,000 and 0
s/mm2. Imaging parameters for SWI were as follows:
TR/TE, 27/20 msec; NEX, 2; FA, 10°; slice thickness, 1.5 mm; slice
gap, 0 mm; FOV, 172×230 mm; matrix, 182×256; total acquisition
time, 2 min 59 sec.
Data analysis
All images were reviewed independently by two
radiologists with 16 years and 18 years of clinical experience in
MRI, who were blinded to the histopathological results. First, the
ADC maps were generated by using the DWI post processing software
of the MR system. The ADC values represent averaged ADC values of
three regions of interest (ROIs). ROIs were carefully positioned to
avoid cystic, necrotic and hemorrhagic regions. The ratio between
the ADC of the solid portion of the tumor and that of the
contralateral normal white matter (rADC) was calculated in order to
standardize variations in each examination.
Furthermore, the corrected-phase images and
magnitude images were obtained by using the SWI post-processing
software of the MR system. The susceptibility effects were foci of
hypointensity in the tumor on the magnitude images and calcium was
excluded by generating phase images of SWI and computed tomography
images. Intratumoral susceptibility signal intensity (ITSS) was
defined as low signal intensity seen within the tumor on magnitude
images of SWI. For assessment of the dominant hypointense
structure, the degrees of ITSS were divided into 4 grades: 0, no
hypointense focus in the tumor; 1, hypointense foci indicating
bleeding (dot-like or conglomerated dot shape) in the tumor; 2,
hypointense foci indicating bleeding and vascular structure (linear
or tortuous shape) less than half of the tumor on any image; 3,
hypointense foci almost equally present in the tumor in any image
(14,15,19).
Statistical analysis
Data are presented as the mean ± standard deviation.
Statistical analysis was performed using SPSS version 19.0 (IBM,
Corp., Armonk, NY, USA). P<0.01 was considered to indicate a
statistically significant difference. The rADC was compared between
two groups using an independent-samples t-test. The degree of the
ITSS on SWI was compared between two groups using the Mann-Whitney
U-test. The receiver operating characteristic (ROC) curve was
analyzed to compare the diagnostic performances and the area under
ROC curve (AUC) was calculated. Using an optimal cut-off value
determined by the ROC analysis, the sensitivity, specificity,
positive predictive value (PPV) and negative predictive value (NPV)
for grading of gliomas were calculated. Spearman's correlation
coefficient was also calculated to examine the correlation between
DWI- and SWI-derived parameters.
Results
Patient characteristics
A total of 51 patients with gliomas were
retrospectively analyzed. Two patients were excluded, as their maps
were not suitable for diagnosis due to severe movement. The
remaining 49 patients (26 females and 23 males; median age, 45
years; age range, 13–71 years) with histologically confirmed
gliomas at our hospital were finally enrolled. Regarding the
histological type, 2 gliomas were grade 1, 18 were grade 2, 15 were
grade 3 and 14 were grade 4. Gliomas of WHO grades 1 and 2 were
grouped as low-grade gliomas and those of WHO grades 3 and 4 were
grouped as high-grade gliomas for the purpose of analysis.
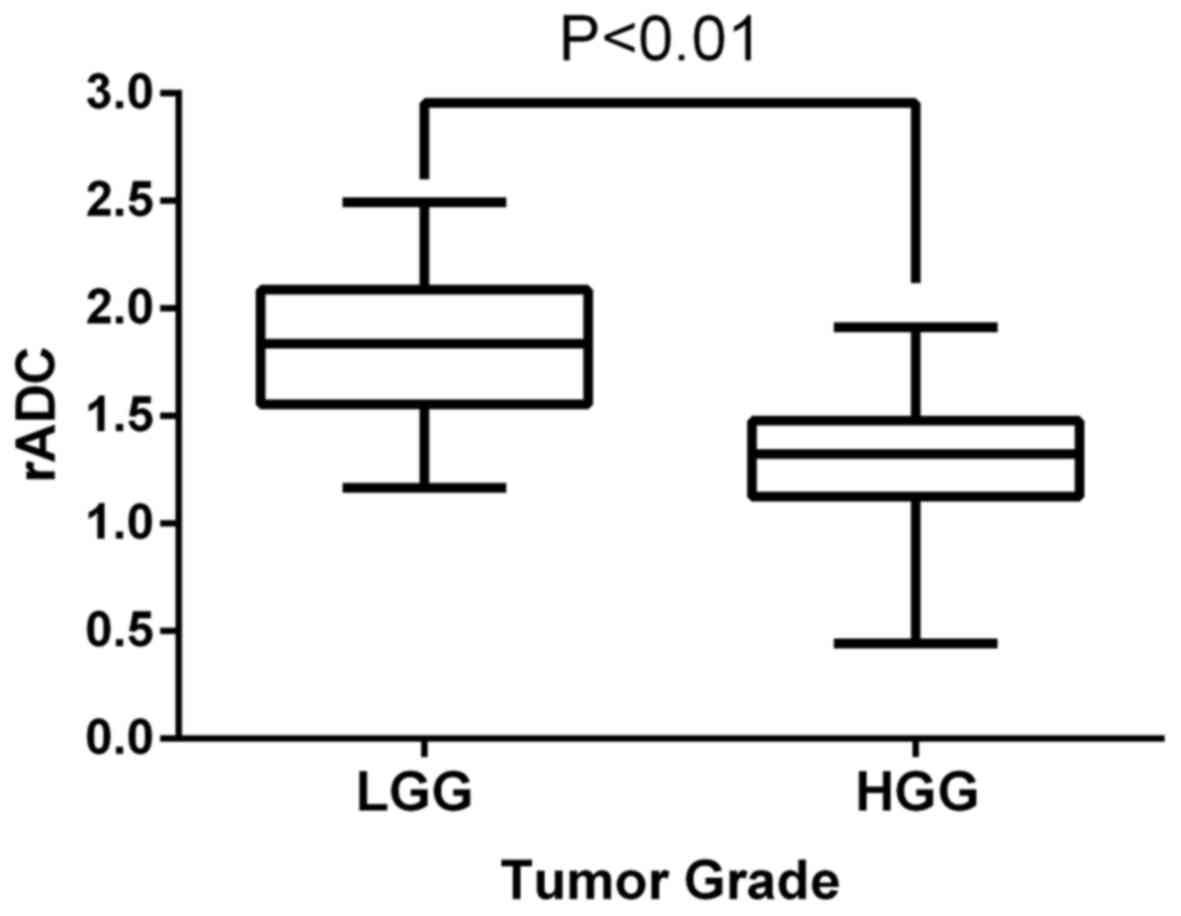
The rADC and degrees of ITSS in the LGGs and HGGs
are presented in Tables I and
II. The rADC in HGGs was lower than
that in LGGs (t=5.977, P<0.01; Fig.
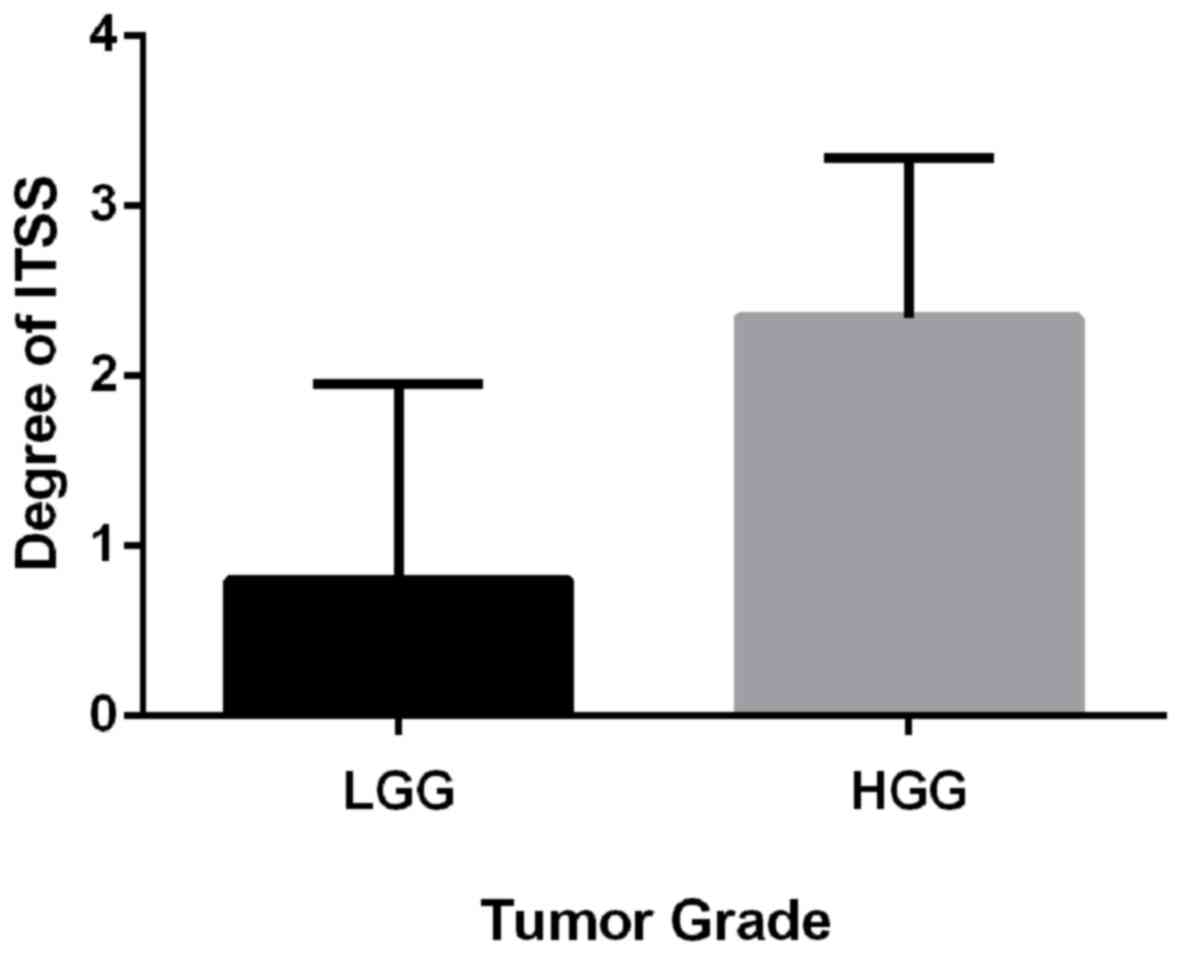
1). ITSS was identified in 27 out of 29 HGGs (93%) and in 8 out
of 20 LGGs (40%). The degree of ITSS within the tumor in HGGs was
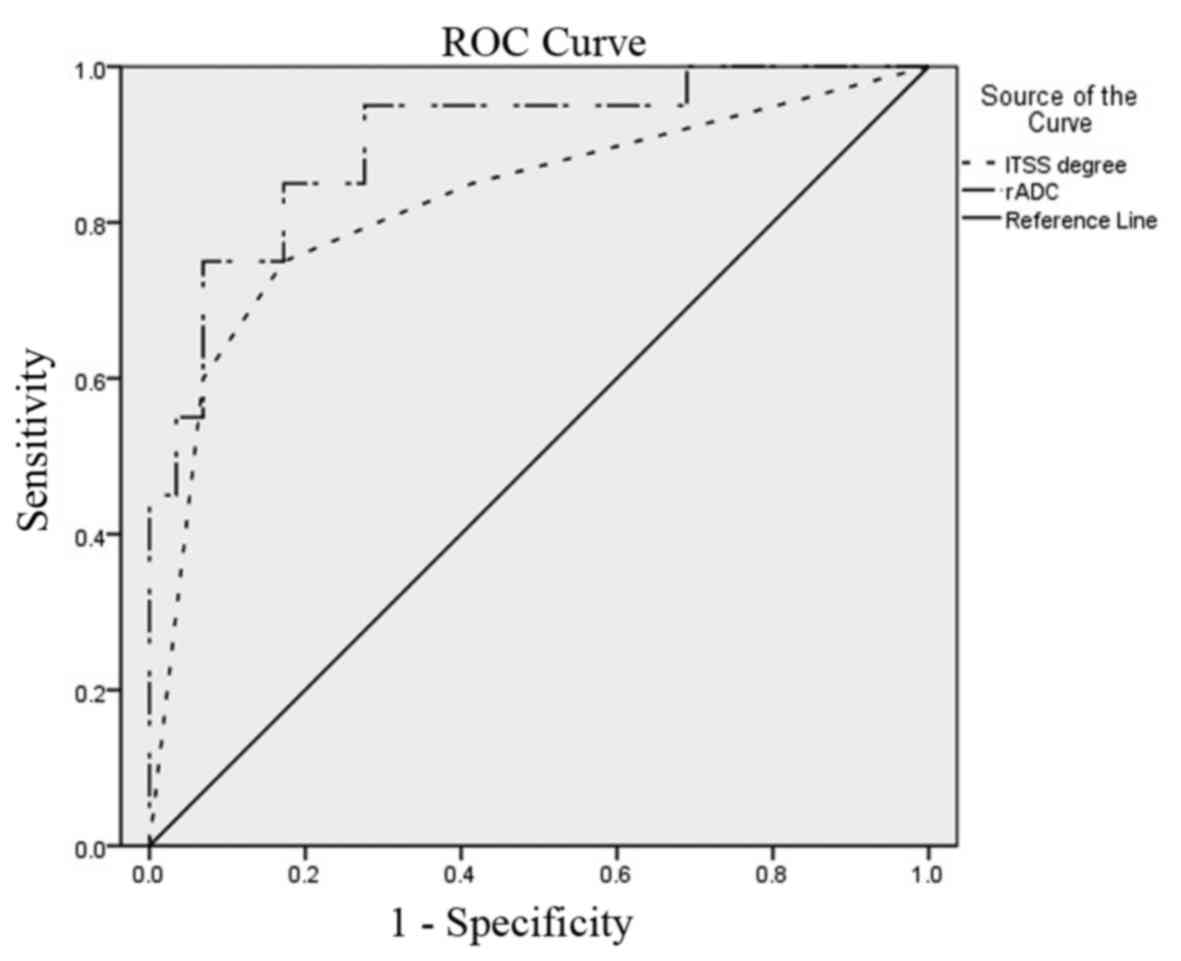
significantly higher than that in LGGs (Z=4.05, P<0.01; Fig. 2). Typical ROC curves for the rADC and
degree of ITSS are presented in Fig.
3. ROC curve analysis indicated that the rADC was a better
index for grading of gliomas compared with the ITSS degree. A
threshold value of 1.497 for rADC provided an AUC of 0.903 and the
cut-off value of 1.5 for the ITSS degree resulted in an AUC of
0.826. As presented in Table III,
statistical analysis demonstrated that the value of 1.497 for rADC
provided a sensitivity, specificity, PPV and NPV of 86.2, 85.0,
89.3 and 81.0% for determining HGGs, respectively. For the ITSS
degree, the value of 1.5 was defined as a threshold to identify
HGGs and a sensitivity, specificity, PPV and NPV of 82.8, 75.0,
82.8 and 75.0% were obtained, respectively.
 | Table I.Comparison of ADC values and the rADC
in LGGs and HGGs. |
Table I.
Comparison of ADC values and the rADC
in LGGs and HGGs.
| Parameter | LGG | HGG | P-value |
|---|
| ADC (Solid portion of
tumors) | 1.35±0.23 | 0.98±0.23 | <0.01 |
| ADC (Contralateral
normal white matter) | 0.74±0.07 | 0.78±0.07 | 0.109 |
| rADC | 1.82±0.33 | 1.23±0.31 | <0.01 |
| Table II.Comparison of the degree of ITSS in
LGGs and HGGs (n). |
Table II.
Comparison of the degree of ITSS in
LGGs and HGGs (n).
|
| Grade |
|
|---|
|
|
|
|
|---|
| Group | 0 | 1 | 2 | 3 | P-value |
|---|
| LGG | 12 | 3 | 2 | 3 | <0.01 |
| HGG | 2 | 3 | 7 | 17 | <0.01 |
| Table III.Results of ROC curve analysis |
Table III.
Results of ROC curve analysis
| Parameter | Sensitivity (%) | Specificity (%) | PPV (%) | NPV (%) |
|---|
| rADC (1.497) | 86.2 | 85.0 | 89.3 | 81.0 |
| ITSS degree
(1.5) | 82.8 | 75.0 | 82.8 | 75.0 |
The present study also evaluated the correlation
between the rADC and the ITSS degree. The ITSS degree exhibited a
moderate inverse correlation with the rADC (r=−0.498, P<0.01).
Furthermore, as presented in Table
IV, the rADC values were >1.497 in three cases of HGG, but
the respective degrees of ITSS were 1, 2 and 3. In addition, the
rADC values were <1.497 in three cases of LGG, while the
respective degrees of ITSS were 0, 0 and 1.
| Table IV.Comparison of results between the rADC
value and the ITSS degree (r=−0.498, P<0.01). |
Table IV.
Comparison of results between the rADC
value and the ITSS degree (r=−0.498, P<0.01).
| Parameter | rADC | ITSS degree |
|---|
| HGG | >1.497 | 1 | 2 | 3 |
| LGG | <1.497 | 0 | 0 | 1 |
Discussion
The present study evaluated the value of SWI and DWI
for grading of gliomas and the correlation between the rADC and the
degree of ITSS. The results regarding DWI were consistent with
those of previous studies. Reportedly, ADC values have been
correlated with the degree of tumor cellularity (5,20).
Murakami et al (21)
demonstrated that the minimum ADC corresponds to the highest-grade
glioma foci within heterogeneous tumors. In the present study, the
rADC was calculated in order to standardize variations, which were
lower in HGGs than that in LGGs.
However, in another study, in which the regional
heterogeneity of gliomas is taken into account, this inverse
correlation between ADC and cell density was not confirmed
(22). HGGs and LGGs have a large
overlap of ADC values, regardless of whether the mean, minimum or
normalized ADC value is used (7,20). The
present results also indicated a certain overlap in the rADC and
accordingly, the differentiation between HGGs and LGGs should not
be based solely on the rADC. The rate of tissue diffusion in tumors
is not only affected by tumor cellularity and cell density, but
also influenced by other determinants, including the
nucleus-to-cytoplasm ratio, the presence of peritumoral vasogenic
edema or tumor necrosis, the degree of neuroarchitectural
destruction and the pore sizes of the extracellular space (23). The final ADC value is determined by
combination of all of these factors, which may account for the
overlapping of ADC values.
Therefore, another contributing factor in the
malignancy of tumors is their ability to synthesize vascular
networks for further growth and proliferation (24). SWI is a useful tool for evaluating
intratumoral structures, including microvasculature (13). However, probably due to angiogenesis
and increased blood supply to the tumor, HGG contains a relatively
large amount of deoxyhemoglobin, which generates susceptibility
effects and causes signal-intensity loss. Pinker et al
(15) reported that the ITSS is
correlated with the tumor grade as determined by positron-emission
tomography and histopathology. Park et al (19) reported that glioblastoma multiforme
have the highest degree of ITSS, suggesting that ITSS may be useful
in the correct diagnosis of HGGs. The present results also
indicated that the degree of ITSS within the tumor was
significantly higher in HGGs than that in LGGs patients.
However, the present results were inconsistent with
those of a previous study, which reported that ITSS was seen in all
glioblastomas but never in any LGGs (19). This discrepancy may be due to the
lack of established objective methods for evaluation of images. The
intratumoral susceptibility effect on SWI may be easily changed by
small variations in imaging parameters or post-processing methods
(25). In addition, the distribution
of the microvenous structures in HGG is often irregular, including
uneven thickness, circuity disorder, formation of clusters and easy
occurrence of thrombosis and hemorrhage, which makes it difficult
to grade tumors within vascular structures, hemorrhage and tumor
vascular thrombosis.
In the present study, the results revealed a
moderate inverse correlation between rADC and the degree of ITSS.
DWI is generally applied to obtain information on cellularity, and
SWI to determine the sensitivity to susceptibility effects of
microvenous structures. It is therefore not surprising that
increased tumor cellularity is associated with increased tumor
vascularity. However, these parameters are not direct measures of
the same phenomenon. The direct correspondence between the rADC and
the degree of ITSS was variable. In the present study, the rADC
values were >1.497 in three cases of HGG, but the respective
degrees of ITSS were 1, 2 and 3. In addition, the rADC values were
<1.497 in three cases of LGG, while the respective degrees of
ITSS were 0, 0 and 1.
This observation demonstrated that the information
provided by the rACD values alone is not always conclusive and that
further parameters should be considered. Future studies pursuing a
point-to-point approach for targeting tumor tissues for surgical
biopsy may validate the power of this pre-operative glioma grading
method.
In the present study, although the results indicated
that rADC was a better index for grading gliomas compared with the
degree of ITSS, it must be emphasized that SWI may be used as a
valid contributing parameter, for example when DWI fails or when
conventional MR parameters are inconclusive. In the present study,
SWI was used to assess the extent of hemorrhage in the tumor, which
may potentially affect ADC values. Hence, the use these parameters
increases the confidence in grading gliomas. Furthermore,
conventional MRI with gadolinium-based contrast agents is an
established and useful tool in the characterization of cerebral
tumors (26). Contrast enhancement
on T1WI signifies blood-brain barrier breakdown and its pattern and
extent have been suggestive of malignant potential (27). Radiological grading of tumors with
conventional MRI is not always accurate and errors may occur
(28). DWI and SWI parameters are
quantitative physiological metrics for tumor microenvironments and
will complement glioma grading. DWI and SWI without contrast
material may also reduce the risk associated with injection of
contrast agents.
In addition, histopathology for grading of gliomas
may also be inaccurate when biopsy samples are not taken from the
tumor region with the highest degree of malignancy or when the
tumor is not completely resected (10). The limitation of histopathology
includes tissue heterogeneity and inherent sampling errors, often
resulting in an underestimation of the histological grade (2). Hence, an imaging-based method for
determining the glioma grade is appealing due to its
non-invasiveness and the possibility to cover larger areas of
heterogeneous tumors, which may enhance the reliability of the
histopathological grading. The lowest ADC value indicates that the
region with the greatest cellularity and the information regarding
venous vasculature and hemorrhage provided by SWI may be helpful in
selecting biopsy targets.
The present study has several limitations. First,
the sample size was relatively small and patient age was not
appropriately controlled. Furthermore, a retrospective approach was
used to select the cases examined and selection bias may have
prevailed. In addition, the placement of the ROI and the
quantitative scoring were performed in a subjective manner and the
results may have been different if other individuals had performed
the assessment. Finally, no other advanced MR techniques, including
spectroscopy, perfusion or diffusion tensor imaging, were performed
in the present study.
In conclusion, depending on pathological
angiogenesis, malignant tumors usually have a high tumor
cellularity, rapid growth of vascular structure and multiple
microbleeds. Information on tumor cell proliferation, cell density,
capillary formation and tumor hemorrhage will facilitate the
pre-operative grading of gliomas. Therefore, DWI and SWI may have a
complementary diagnostic role for grading of gliomas.
Acknowledgements
Not applicable.
Funding
No funding was received.
Availability of data and materials
The analyzed data sets generated during the present
study are available from the corresponding author on reasonable
request.
Authors' contributions
JX and HX carried out the data analysis and drafted
the manuscript; JX and WZ significantly contributed to the
acquisition of data; JZ and JX revised the manuscript; WZ carried
out the quality control of the data; JZ and JX significantly
contributed to the study design and reviewed the manuscript; HX and
WZ contributed to the conception and design of the study,
supervised the research program and edited the manuscript. All
authors read and approved the final manuscript.
Ethics approval and consent to
participate
The local institutional review board of the
Affiliated Wujin Hospital of Jiangsu University (Jiangsu, China)
approved the present study. Due to the retrospective nature of the
study, informed consent was waived.
Consent for publication
Not applicable.
Competing interests
All authors have no conflict of interest to
declare.
References
|
1
|
Inoue T, Ogasawara K, Beppu T, Ogawa A and
Kabasawa H: Diffusion tensor imaging for preoperative evaluation of
tumor grade in gliomas. Clin Neurol Neurosurg. 107:174–180. 2005.
View Article : Google Scholar : PubMed/NCBI
|
|
2
|
Yoon JH, Kim JH, Kang WJ, Sohn CH, Choi
SH, Yun TJ, Eun Y, Song YS and Chang KH: Grading of cerebral glioma
with multiparametric MR imaging and 18F-FDG-PET. Concordance and
Accuracy. Eur Radiol. 24:380–389. 2014. View Article : Google Scholar : PubMed/NCBI
|
|
3
|
Van Cauter S, De Keyzer F, Sima DM, Sava
AC, D'Arco F, Veraart J, Peeters RR, Leemans A, Van Gool S, Wilms
G, et al: Integrating diffusion kurtosis imaging, dynamic
susceptibility-weighted contrast-enhanced MRI, and short echo time
chemical shift imaging for grading gliomas. Neuro Oncol.
16:1010–1021. 2014. View Article : Google Scholar : PubMed/NCBI
|
|
4
|
Guo AC, Cummings TJ, Dash RC and
Provenzale JM: Lymphomas and high-grade astrocytomas: Comparison of
water diffusibility and histologic characteristics. Radiology.
224:177–183. 2002. View Article : Google Scholar : PubMed/NCBI
|
|
5
|
Sugahara T, Korogi Y, Kochi M, Ikushima I,
Shigematu Y, Hirai T, Okuda T, Liang L, Ge Y, Komohara Y, et al:
Usefulness of diffusion-weighted MRI with echo-planar technique in
the evaluation of cellularity in gliomas. J Magn Reson Imaging.
9:53–60. 1999. View Article : Google Scholar : PubMed/NCBI
|
|
6
|
Higano S, Yun X, Kumabe T, Watanabe M,
Mugikura S, Umetsu A, Sato A, Yamada T and Takahashi S: Malignant
astrocytic tumors: Clinical importance of apparent diffusion
coefficient in prediction of grade and prognosis. Radiology.
241:839–846. 2006. View Article : Google Scholar : PubMed/NCBI
|
|
7
|
Bulakbasi N, Guvenc I, Onguru O, Erdogan
E, Tayfun C and Ucoz T: The added value of the apparent diffusion
coefficient calculation to magnetic resonance imaging in the
differentiation and grading of malignant brain tumors. J Comput
Assist Tomogr. 28:735–746. 2004. View Article : Google Scholar : PubMed/NCBI
|
|
8
|
Kono K, Inoue Y, Nakayama K, Shakudo M,
Morino M, Ohata K, Wakasa K and Yamada R: The role of
diffusion-weighted imaging in patients with brain tumors. AJNR Am J
Neuroradiol. 22:1081–1088. 2001.PubMed/NCBI
|
|
9
|
Lam WW, Poon WS and Metreweli C: Diffusion
MR imaging in glioma: Does it have any role in the pre-operation
determination of grading of glioma? Clin Radiol. 57:219–225. 2002.
View Article : Google Scholar : PubMed/NCBI
|
|
10
|
Arvinda HR, Kesavadas C, Sarma PS, Thomas
B, Radhakrishnan VV, Gupta AK, Kapilamoorthy TR and Nair S: Glioma
grading: Sensitivity, specificity, positive and negative predictive
values of diffusion and perfusion imaging. J NeuroOncol. 94:87–96.
2009. View Article : Google Scholar : PubMed/NCBI
|
|
11
|
Sehgal V, Delproposto Z, Haacke EM, Tong
KA, Wycliffe N, Kido DK, Xu Y, Neelavalli J, Haddar D and
Reichenbach JR: Clinical applications of neuroimaging with
susceptibility-weighted imaging. J Magn Reson Imaging. 22:439–450.
2005. View Article : Google Scholar : PubMed/NCBI
|
|
12
|
Wang XC, Zhang H, Tan Y, Qin JB, Wu XF,
Wang L and Zhang L: Combined value of susceptibility-weighted and
perfusion-weighted imaging in assessing WHO grade for brain
astrocytomas. J Magn Reson Imaging. 39:1569–1574. 2014. View Article : Google Scholar : PubMed/NCBI
|
|
13
|
Di Ieva A, Göd S, Grabner G, Grizzi F,
Sherif C, Matula C, Tschabitscher M and Trattnig S:
Three-dimensional susceptibility-weighted imaging at 7 T using
fractal-based quantitative analysis to grade gliomas.
Neuroradiology. 55:35–40. 2013. View Article : Google Scholar : PubMed/NCBI
|
|
14
|
Hori M, Mori H, Aoki S, Abe O, Masumoto T,
Kunimatsu S, Ohtomo K, Kabasawa H, Shiraga N and Araki T:
Three-dimensional susceptibility-weighted imaging at 3 T using
various image analysis methods in the estimation of grading
intracranial gliomas. Magn Reson Imaging. 28:594–598. 2010.
View Article : Google Scholar : PubMed/NCBI
|
|
15
|
Pinker K, Noebauer-Huhmann IM, Stavrou I,
Hoeftberger R, Szomolanyi P, Karanikas G, Weber M, Stadlbauer A,
Knosp E, Friedrich K and Trattnig S: High-resolution
contrast-enhanced, susceptibility-weighted MR imaging at 3T in
patients with brain tumors. correlation with positron-emission
tomography and histopathologic findings. AJNR Am J Neuroradiol.
28:1280–1286. 2007. View Article : Google Scholar : PubMed/NCBI
|
|
16
|
Heiss WD, Raab P and Lanfermann H:
Multimodality assessment of brain tumors and tumor recurrence. J
Nucl Med. 52:1585–1600. 2011. View Article : Google Scholar : PubMed/NCBI
|
|
17
|
Furtner J, Schöpf V, Preusser M, Asenbaum
U, Woitek R, Wöhrer A, Hainfellner JA, Wolfsberger S and Prayer D:
Non-invasive assessment of intratumoral vascularity using arterial
spin labeling: A comparison to susceptibility-weighted imaging for
the differentiation of primary cerebral lymphoma and glioblastoma.
Eur J Radiol. 83:806–810. 2014. View Article : Google Scholar : PubMed/NCBI
|
|
18
|
Kleihues P, Louis DN, Scheithauer BW,
Rorke LB, Reifenberger G, Burger PC and Cavenee WK: The WHO
Classification of tumors of the nervous system. J Neuropathol Exp
Neurol. 61:215–225. 2002. View Article : Google Scholar : PubMed/NCBI
|
|
19
|
Park MJ, Kim HS, Jahng GH, Ryu CW, Park SM
and Kim SY: Semiquantitative assessment of intratumoral
susceptibility signals using non-contrast-enhanced high-field
high-resolution susceptibility-weighted imaging in patients with
gliomas: Comparison with MR perfusion imaging. AJNR Am J
Neuroradiol. 30:1402–1408. 2009. View Article : Google Scholar : PubMed/NCBI
|
|
20
|
Castillo M, Smith JK, Kwock L and Wilber
K: Apparent diffusion coefficients in the evaluation of high-grade
cerebral gliomas. AJNR Am J Neuroradiol. 22:60–64. 2001.PubMed/NCBI
|
|
21
|
Murakami R, Hirai T, Sugahara T, Fukuoka
H, Toya R, Nishimura S, Kitajima M, Okuda T, Nakamura H, Oya N, et
al: Grading astrocytic tumors by using apparent diffusion
coefficient parameters: Superiority of a one- versus two-parameter
pilot method. Radiology. 251:838–845. 2009. View Article : Google Scholar : PubMed/NCBI
|
|
22
|
Sadeghi N, D'Haene N, Decaestecker C,
Levivier M, Metens T, Maris C, Wikler D, Baleriaux D, Salmon I and
Goldman S: Apparent diffusion coefficient and cerebral blood volume
in brain gliomas: Relation to tumor cell density and tumor
microvessel density based on stereotactic biopsies. AJNR Am J
Neuroradiol. 29:476–482. 2008. View Article : Google Scholar : PubMed/NCBI
|
|
23
|
Wu CC, Guo WY, Chen MH, Ho DM, Hung AS and
Chung HW: Direct measurement of the signal intensity of
diffusion-weighted magnetic resonance imaging for preoperative
grading and treatment guidance for brain gliomas. J Chin Med Assoc.
75:581–588. 2012. View Article : Google Scholar : PubMed/NCBI
|
|
24
|
Toyooka M, Kimura H, Uematsu H, Kawamura
Y, Takeuchi H and Itoh H: Tissue characterization of glioma by
proton magnetic resonance spectroscopy and perfusion-weighted
magnetic resonance imaging: Glioma grading and histological
correlation. Clin Imaging. 32:251–258. 2008. View Article : Google Scholar : PubMed/NCBI
|
|
25
|
Rauscher A, Sedlacik J, Deistung A,
Mentzel HJ and Reichenbach JR: Susceptibility weighted imaging:
Data acquisition, image reconstruction and clinical applications. Z
Med Phys. 16:240–250. 2006. View Article : Google Scholar : PubMed/NCBI
|
|
26
|
Felix R, Schorner W, Laniado M, Niendorf
HP, Claussen C, Fiegler W and Speck U: Brain tumors: MR imaging
with gadolinium-DTPA. Radiology. 156:681–688. 1985. View Article : Google Scholar : PubMed/NCBI
|
|
27
|
Kurki T, Lundbom N, Kalimo H and Valtonen
S: MR classification of brain gliomas: Value of magnetization
transfer and conventional imaging. Magn Reson Imaging. 13:501–511.
1995. View Article : Google Scholar : PubMed/NCBI
|
|
28
|
Scott JN, Brasher PM, Sevick RJ, Rewcastle
NB and Forsyth PA: How often are nonenhancing supratentorial
gliomas malignant? A population study. Neurology. 59:947–949. 2002.
View Article : Google Scholar : PubMed/NCBI
|