Introduction
Liver cancer is one of the most common malignancies
of the digestive system (1) and the
fourth most frequent cause of cancer-associated mortality
worldwide. The most common liver cancer type is hepatocellular
carcinoma (HCC) (2). Since HCC lacks
reliable clinical and biochemical features in the early stages, the
majority of patients are only definitively diagnosed with HCC at an
advanced stage. At present, in addition to hepatectomy, combination
therapy also has a significant role in HCC treatment, but a
suitable and effective curative treatment strategy is yet to be
developed. Of note, ~70% of patients with HCC exhibit tumor
recurrence or metastasis within 5 years of receiving the currently
applied curative treatment (3). The
majority of HCCs occur in patients with underlying liver disease,
mostly as a result of hepatitis B or C virus infection and/or
alcohol abuse (4-6). Numerous risk
factors associated with poor prognosis and recurrence of HCC have
been identified, including histological grade, regional invasion
and distant metastasis (7,8). In the last decade, with the wide
application of genome-wide gene expression chips, several molecular
markers have been detected based on gene expression profiles,
several of which are used in the clinical treatment of HCC. These
markers have proven valuable for early diagnosis, molecular typing,
sensitivity to chemotherapy and drug resistance, prediction of
prognosis and monitoring.
Several pathways involved in the generation and
development of HCC have been identified, including the PI3K/Akt,
mitogen-activated protein kinase/ERK (9-11),
Janus kinase 2/STAT3 (12,13) and Wnt/β-catenin signaling pathways
(14). However, numerous molecular
mechanisms of hepatocarcinogenesis remain elusive. In the present
study, genetic markers and their clinical value in HCC were
identified based on data from the Gene Expression Omnibus (GEO)
database and The Cancer Genome Atlas (TCGA), and gene expression
was then analyzed in association with HCC prognosis and
progression.
Materials and methods
Differentially expressed genes (DEGs)
from the GEO database
The mRNA expression datasets GSE87630, GSE74656 and
GSE76427 were downloaded from the GEO database (https://www.ncbi.nlm.nih.gov/geo/). The GSE87630
dataset consisted of 64 HCC and 30 non-tumor samples (Illumina
HumanHT-12 V3.0 expression BeadChip), the GSE74656 dataset
consisted of 5 HCC and 5 non-tumor samples (GeneChip®
PrimeView™ Human Gene Expression Array) and the GSE76427 dataset
consisted of 115 HCC and 52 non-tumor samples (Illumina HumanHT-12
V4.0 expression BeadChip). Calculations for each dataset were
performed using the GEO2R online analysis tools (https://www.ncbi.nlm.nih.gov/geo/geo2r/). Genes with
an adjusted P<0.05 and |log2(fold change)|≥1 were
considered differentially expressed. The ‘Roubust Rank Aggreg’ R
package was used to screen the list of DEGs from the 3 microarray
datasets obtained using the GEO2R online analysis tools. The list
of up- or downregulated DEGs in the 3 chips was used for subsequent
analysis.
Functional and pathway analysis of
DEGs
DEGs were uploaded to the Database for Annotation,
Visualization and Integrated Discovery (https://david.ncifcrf.gov/) for analysis of gene
ontology (GO) terms, including GO functional analysis [categories:
Biological processes (BP), cellular component (CC) and molecular
function (MF)] and Kyoto Encyclopedia of Genes and Genomes (KEGG)
pathways. Terms with P<0.05 were considered staistically
significant.
Candidate gene selection
The Search Tool for the Retrieval of Interacting
Genes/Proteins (version 11.0; https://string-db.org/) is a system used to identify
the interactions and functional associations between DEGs. The
protein-protein interaction (PPI) was visualized using Cytoscape
3.5.1 (https://cytoscape.org/) to create
integrated networks. The CytoHubba plugin was used to screen for
hub genes using the maximal clique centrality (MCC) algorithm. In
addition, together with document and enrichment analysis, the hub
genes that may be interrelated with other hub genes and took part
in the same pathway as the genetic markers were selected and used
for further analysis and validation.
Survival analysis and clinical
features of genetic markers
The expression levels of genetic markers were
validated using the Oncomine database (https://www.oncomine.org/) and the Human Protein Atlas
(HPA) database (http://www.proteinatlas.org/) (15). Prognostic analysis was performed for
genetic markers using the UALCAN online analysis tool (http://ualcan.path.uab.edu/index.html)
(16), which incorporates the
prognostic data from the TCGA database. Patients with low gene
expression (75%) were assigned to the low/medium expression group
and those with high gene expression (25%) were categorized into the
high expression group. A Kaplan-Meier curve for the OS of patients
with HCC from the TCGA was obtained according to the low and high
expression of each gene. Regression analysis was also performed to
identify the clinical features of the genetic markers using TCGA
data. Gene expression correlation analysis was used to determine
the correlation between genetic marker expression and HCC staging.
Spearman's method was used to calculate the correlation coefficient
and the datasets, including normal tissue and cancer tissue at
different stages were used for analysis. The receiver operating
characteristic (ROC) curve was plotted and the area under the curve
(AUC) was calculated with SPSS 22.0 (IBM Corp.) to evaluate the
capability of genetic markers in distinguishing recurrent and
non-recurrent HCC using TCGA data.
Reverse transcription-quantitative
(RT-q)PCR
A total of 16 HCC and 16 paired adjacent non-tumor
tissues were obtained following surgeries performed between August
2016 and September 2018 at the Oncology Affiliated Hospital of
Guangxi Medical University (Guangxi, China). Informed consent was
obtained from all patients prior to use of their tissues. The
present study was approved by the Ethics Committee of Guangxi
Medical University (Guangxi, China) and in accordance with the
Guangxi Medical University ethical guidelines and regulations.
Total RNA was extracted from tissues using the E.Z.N.A. FFPE RNA
Isolation kit (Omega Bio-Tek, Inc.). Complementary (c)DNA was
obtained using the PrimeScript RT-qPCR kit (Takara Bio, Inc.)
according to the manufacturer's protocol. PCR amplification was
performed using the GoTaq qPCR Master Mix with SYBR green I (Takara
Bio, Inc.). The mRNA expression level was normalized to GAPDH. The
primer sequences for cyclin B2 (CCNB2), nucleolar and
spindle-associated protein 1 (NUSAP1) and thymidine kinase 1 (TK1)
and GAPDH were as follows: CCNB2 forward,
5'-ATGCGTGCCATCCTAGTGGA-3' and reverse, 5'-CGGGAAACTGGCTGAACCTG-3';
NUSAP1 forward, 5'-GGTGCAAGACTGTCCGTGTGG-3' and reverse,
5'-TGGTGCTCGTCTGGTGGAGAAG-3'; TK1 forward,
5'-GTTCTCAGGAAAAAGCACAGAG-3' and reverse,
5'-GTCTTTGGCATACTTGATCACC-3'; GAPDH forward,
5'-AGGTCGGTGTGAACGGATTTG-3' and reverse, 5'-GGGGTCGTTGATGGCAACA-3'
(Sangon Biotech Co., Ltd.). The PCR thermocycling conditions were
as follows: Initial denaturation at 95˚C for 30 sec and 40 cycles
of 95˚C for 5 sec and 60˚C for 34 sec. For each sample, the
experiment was performed in triplicate in a 20-µl reaction volume
containing 1 µl diluted cDNA, 8 pmol/µl forward and reverse
primers, 10 µl SYBR Premix Ex Taq™ (Takara Bio, Inc.) and 0.4 µl
ROX II Reference Dye (Takara Bio, Inc.). The relative expression of
CCNB2, NUSAP1 and TK1 to GAPDH was calculated using the
2-∆∆Cq method (17).
Statistical analysis
Statistical analysis was performed using R-3.5.3 and
SPSS 22.0 (IBM Corp.). The χ2 test and Fisher's exact
test were performed to compare count data and a Student's t-test
was performed to compare continuous data between groups.
Kaplan-Meier curves were drawn and log-rank tests were performed to
assess patient survival. P<0.05 was considered to indicate a
statistically significant difference.
Results
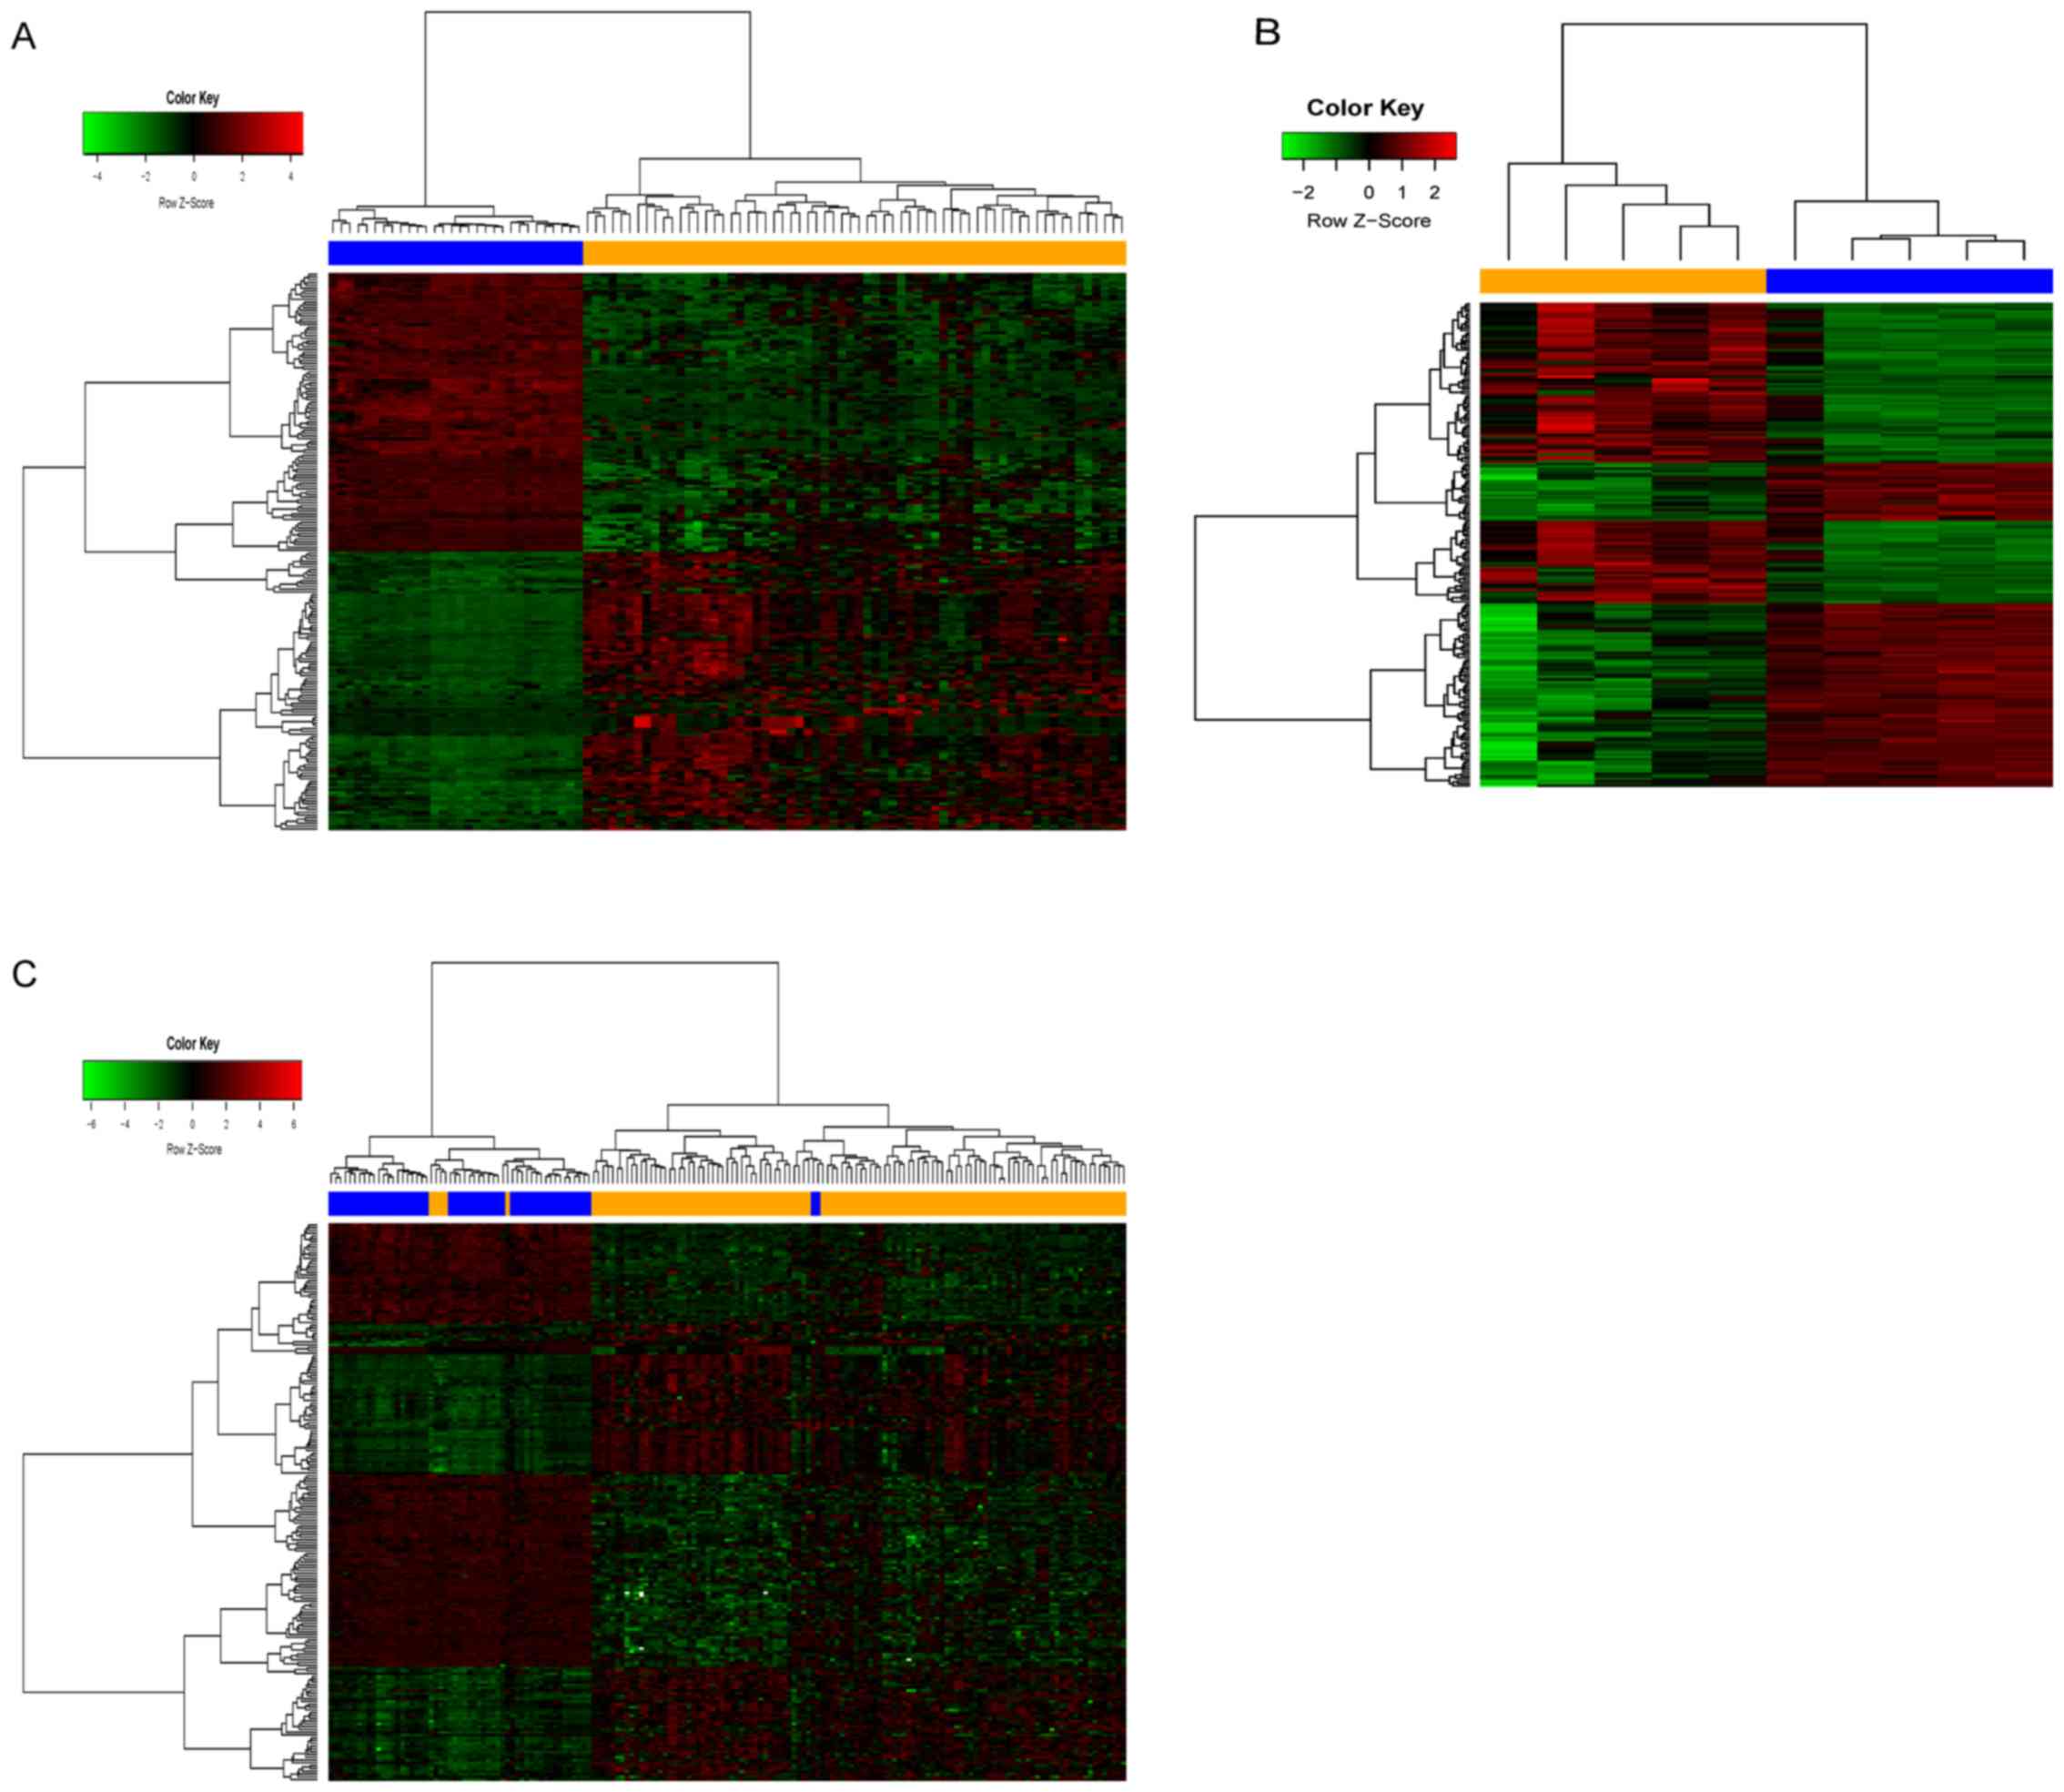
Screening of DEGs
The HCC expression microarray datasets were
processed using the GEO2R online analysis tool to obtain DEGs. A
total of 1,163 DEGs were screened from the GSE87630 dataset,
including 395 up- and 768 downregulated genes. The cluster heatmap
of the top 100 up- and downregulated genes is presented in Fig. 1A. A total of 971 DEGs were screened
from the GSE74656 dataset, including 556 up- and 414 downregulated
genes. The cluster heatmap of the top 100 up- and downregulated
genes is provided in Fig. 1B. A
total of 494 DEGs were screened from the GSE76427 dataset,
including 92 up- and 402 downregulated genes. The cluster heatmap
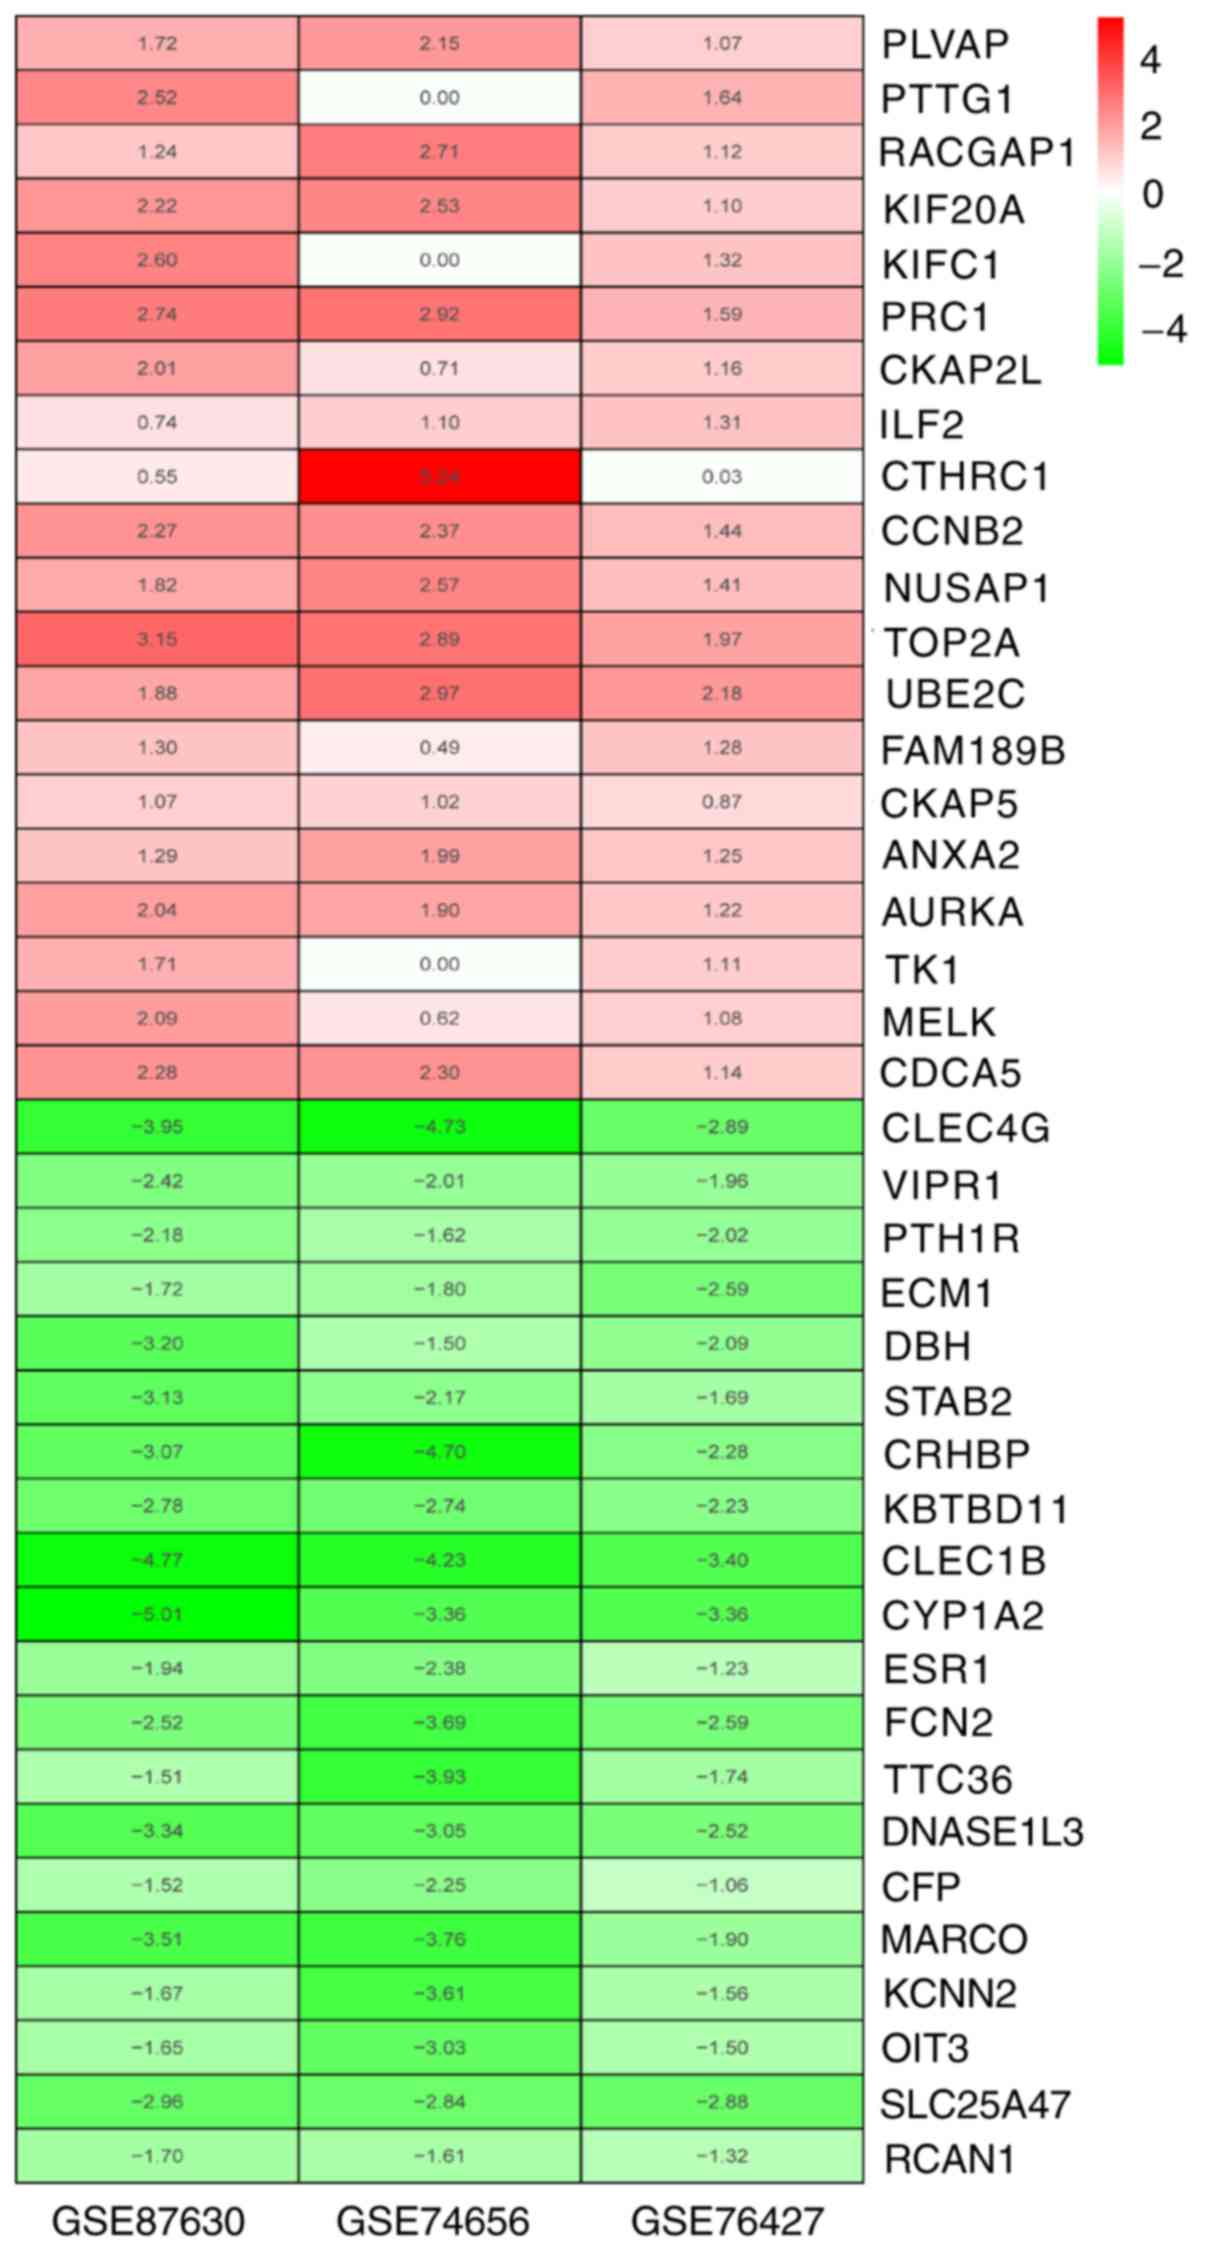
of the top 100 up- and downregulated genes is presented in Fig. 1C. Using the robust rank aggregation
(RRA) method (corrected P<0.05), 96 integrated DEGs were
identified, including 25 up- and 71 downregulated genes. The
heatmap of the top 20 up- and downregulated integrated DEGs is
provided in Fig. 2.
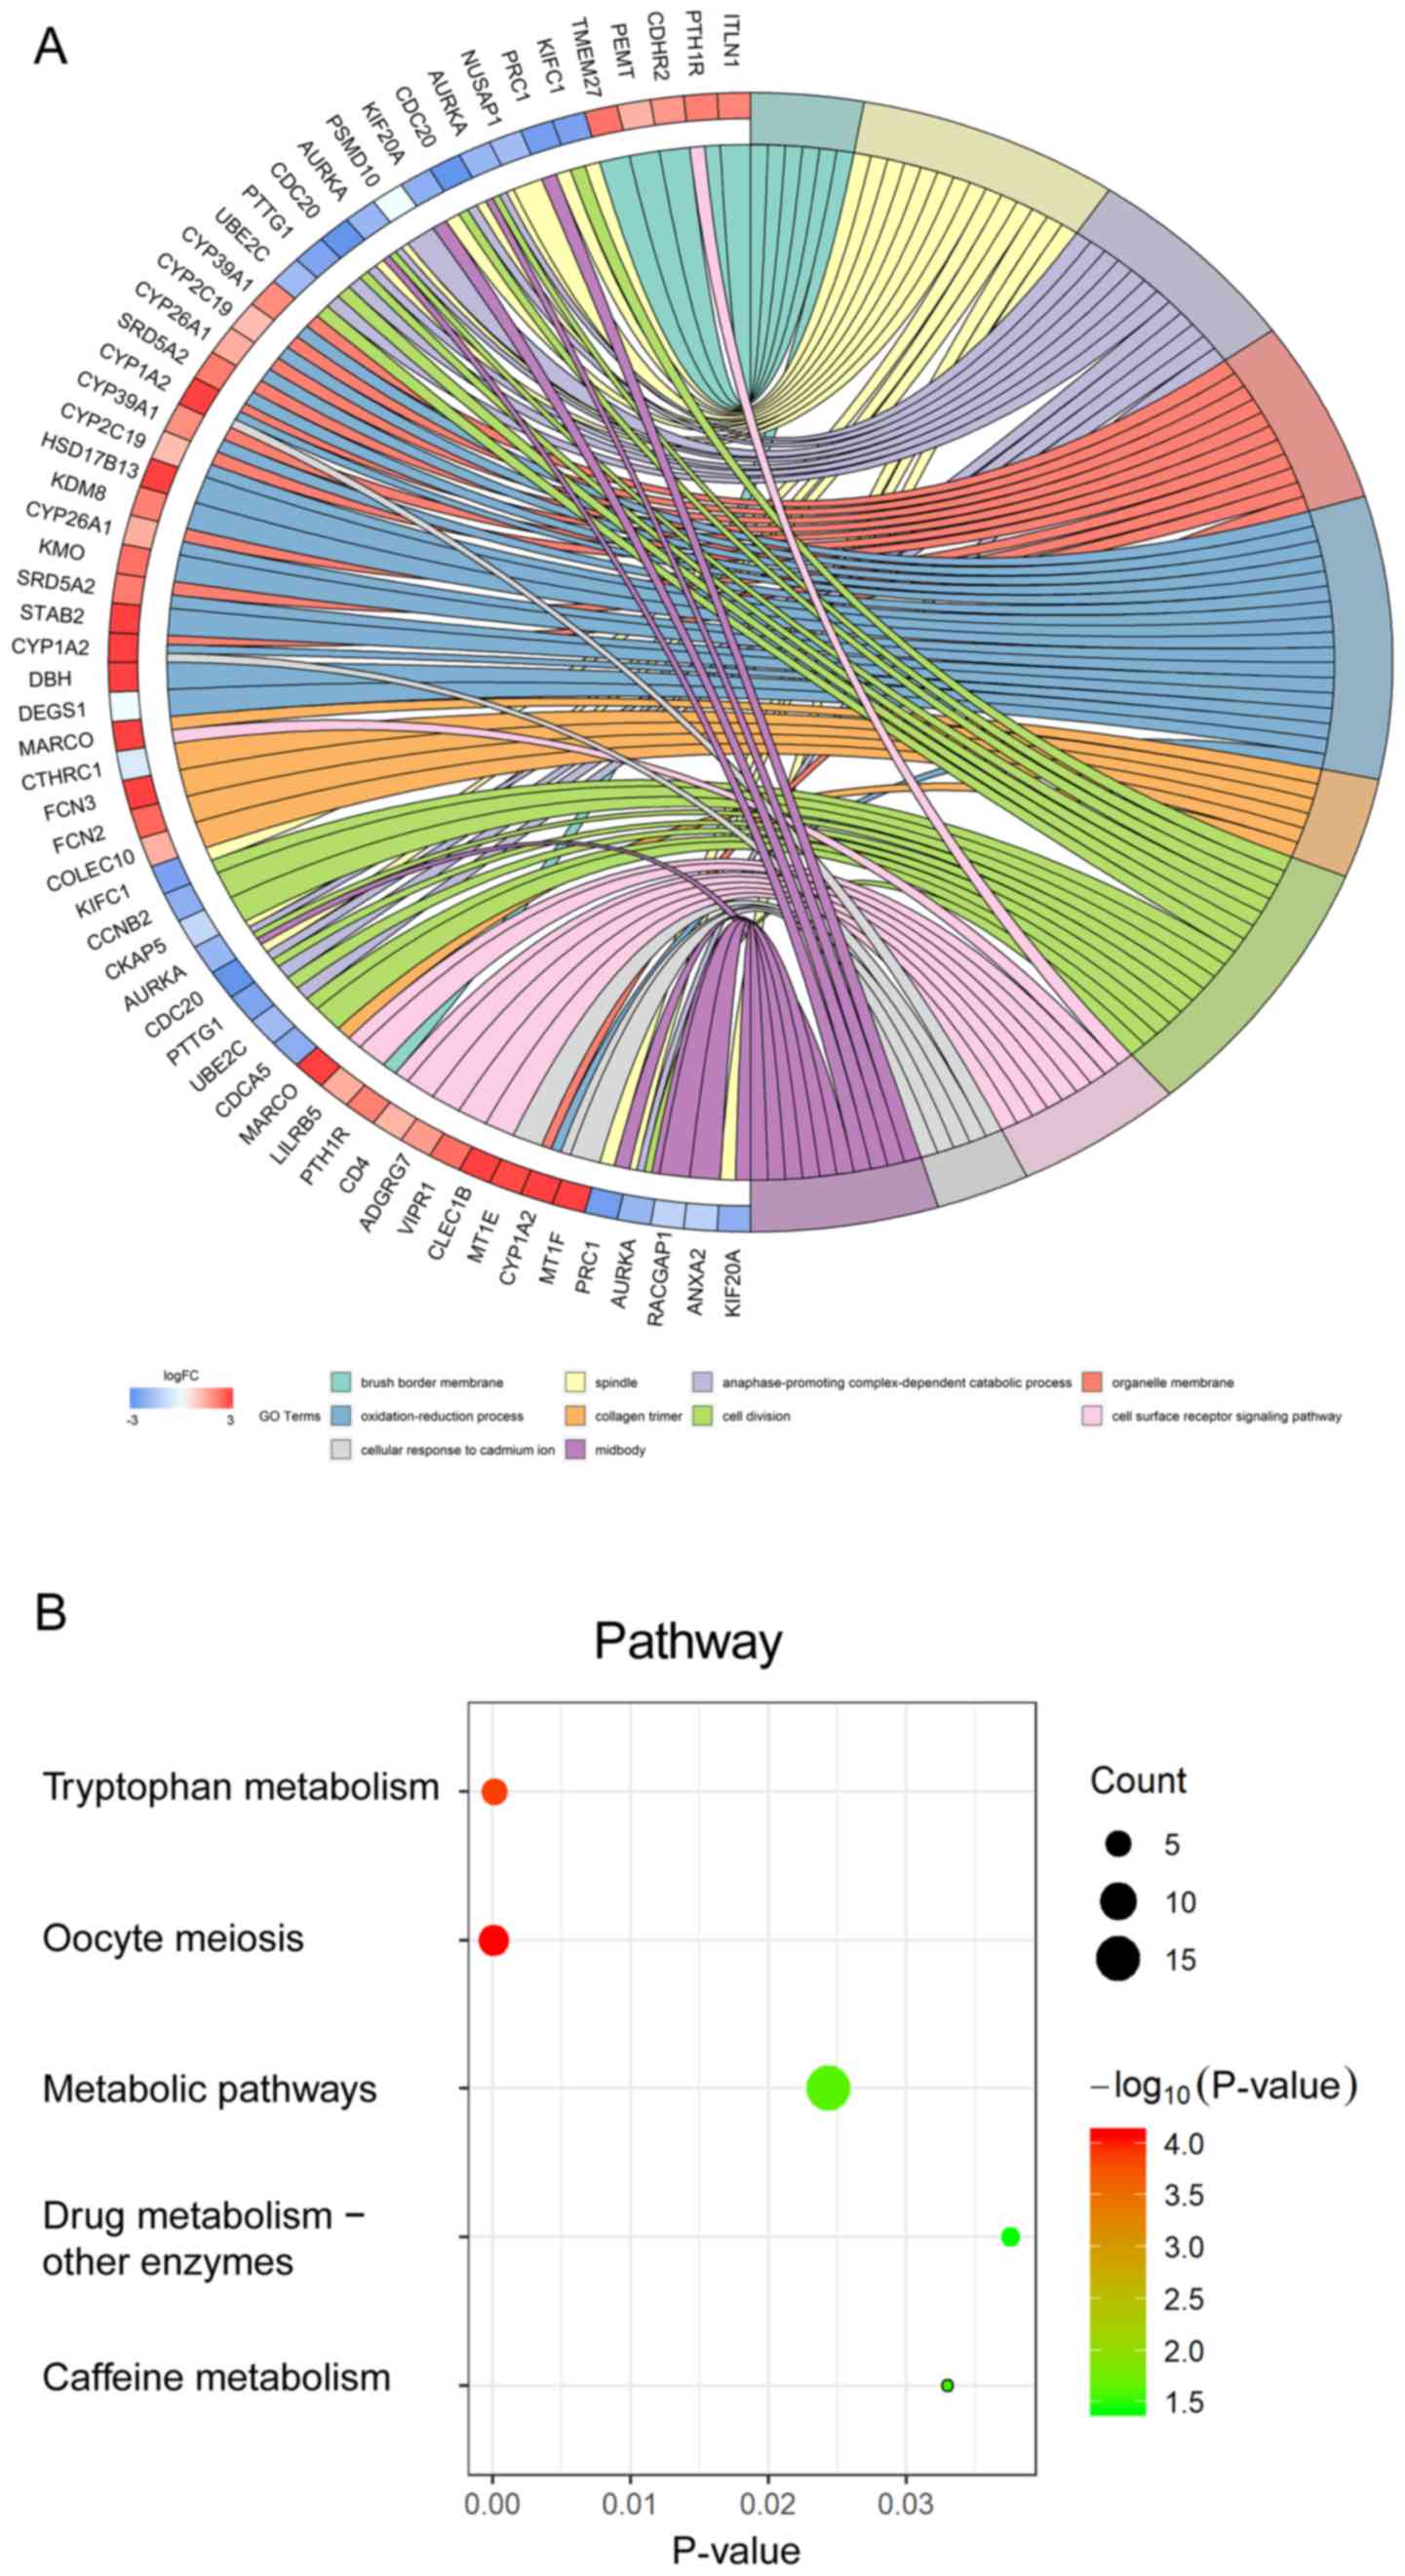
DEG enrichment analysis
Significant terms and pathways from the GO
enrichment and KEGG analysis of DEGs in HCC are presented in Tables
I and II, respectively, and in Fig.
3A and B, respectively. The significantly enriched GO terms in
the category BP were ‘anaphase-promoting complex-dependent
catabolic process’, ‘oxidation-reduction process’ and ‘cell
division’. The significantly enriched GO terms in the category MF
were ‘transmembrane signaling receptor activity’, ‘enzyme binding’
and ‘serine-type endopeptidase activity’. The significantly
enriched GO terms in the category CC were ‘brush border membrane’,
‘spindle’ and ‘organelle membrane’ (Fig.
3A). Furthermore, the KEGG analysis revealed the highest
accumulation of the DEGs in ‘tryptophan metabolism’ and ‘metabolic
pathways’. The present results indicated that DEGs were
significantly enriched in cell division and metabolic pathways
(Fig. 3B).
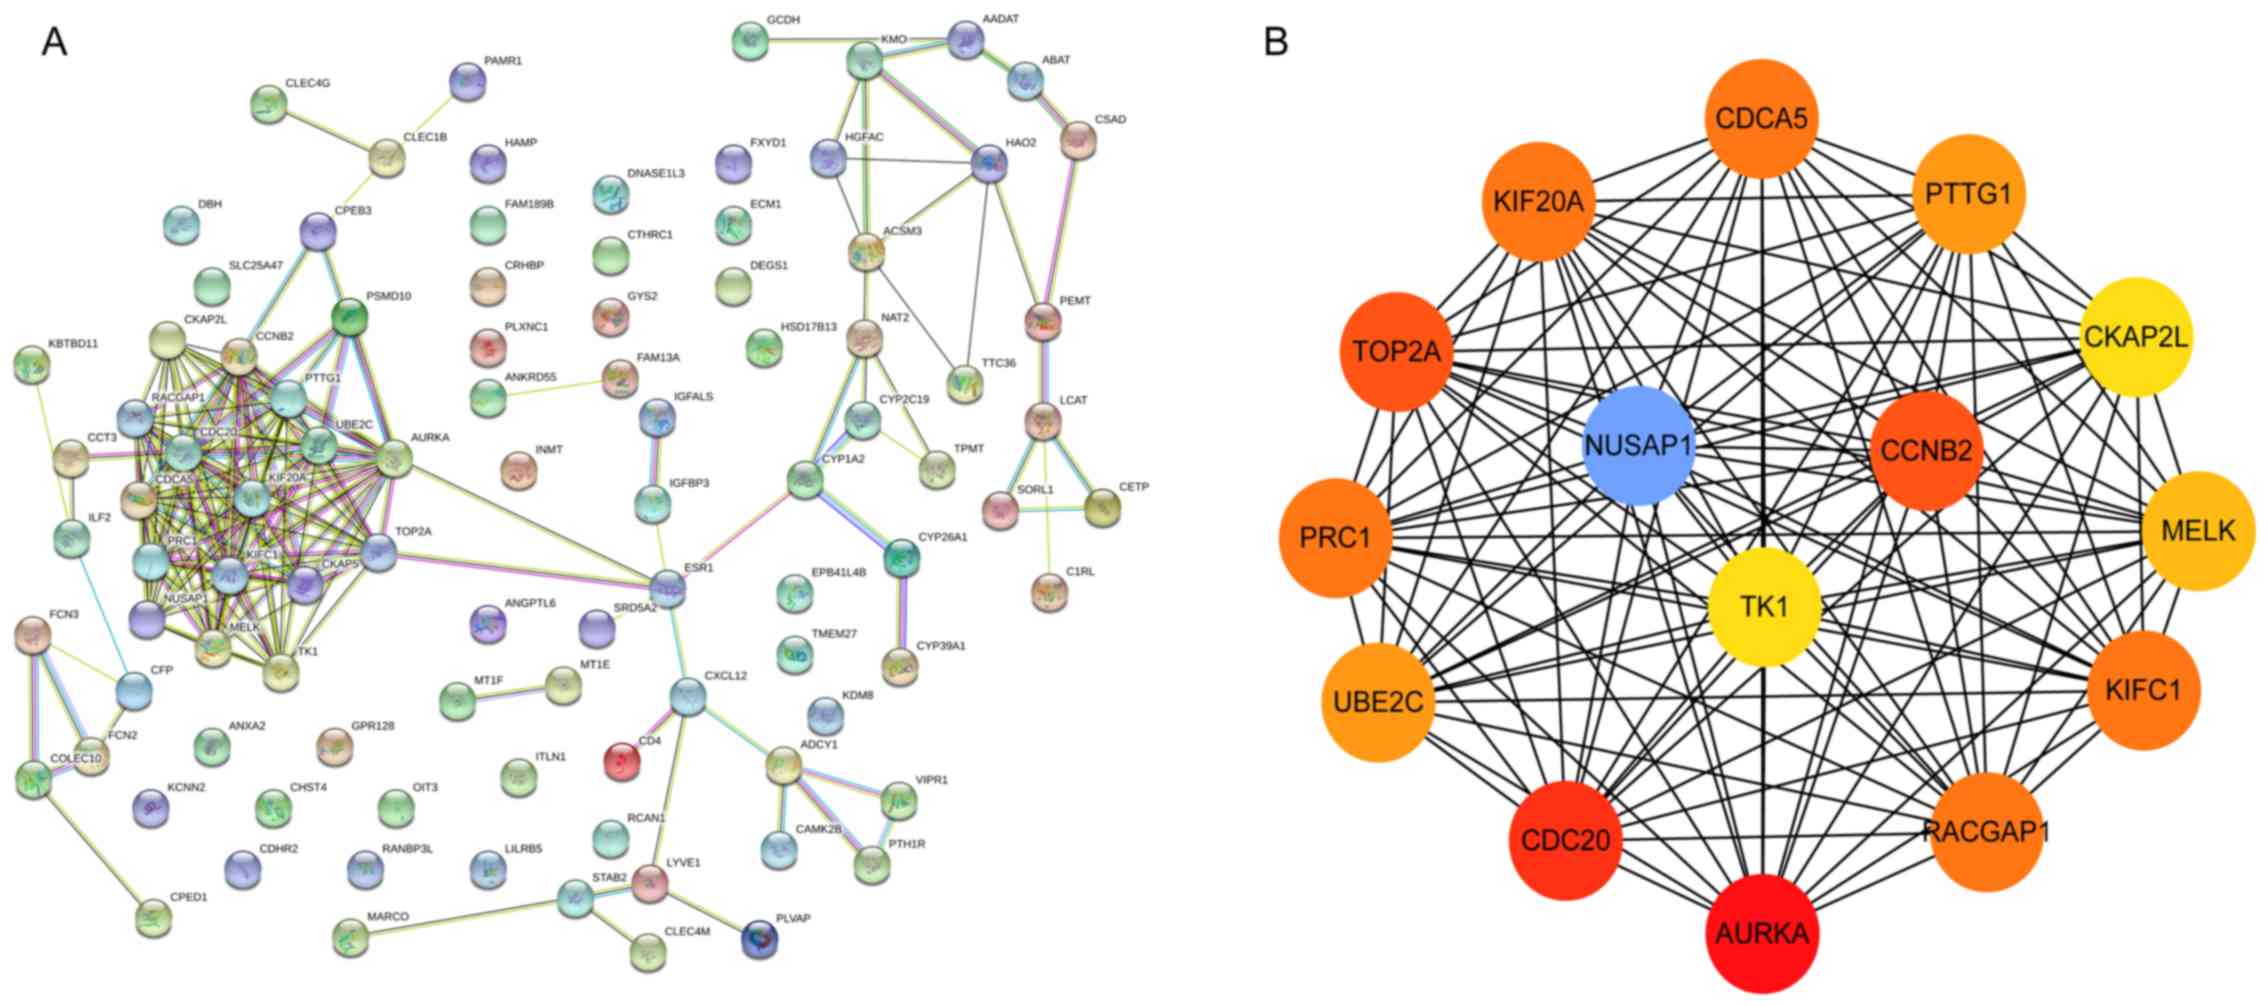
PPI network analysis of DEGs
A total of 96 DEGs, including 25 up- and 71
downregulated genes, were used to construct a PPI network, as
presented in Fig. 4A. The top 15 hub
genes were screened according to their MCC values and the hub genes
identified were aurora kinase (AURKA), cell division cycle (CDC20),
DNA topoisomerase IIα (TOP2A), CCNB2, kinesin family member
(KIFC1), protein regulator of cytokinesis (PRC1), KIF20A, Rac
GTPase-activating protein 1 (RACGAP1), PTTG1, ubiquitin-conjugating
enzyme (UBE2C), maternal embryonic leucine zipper kinase (MELK),
NUSAP1, cytoskeleton-associated protein 2 like (CKAP2L) and TK1.
Among the 15 hub genes, CCNB2, NUSAP1 and TK1 were indicated to
have a close association with each other. In a previous study using
integration of GRNInfer with GO, KEGG, BioCarta, GNF-U133A,
UNIGENE-EST, Disease and GenMAPP databases by DAVID and MAS 3.0, a
corresponding BRCA1 and E2F transcription factor 1 (E2F1)
feedback-interactive network as constructed and CCNB2-NUSAP1 was
indicated to be activated upstream and TK1 was located downstream
in HCC (18). In the present study,
CCNB2, NUSAP1 and TK1 were identified as genetic markers with
involvement of E2F1 and interacting with the BRCA1 pathway in HCC,
and were also indicated to be closely associated with other hub
genes (Fig. 4B).
Prognostic potential and correlation
analysis of 3 genetic markers in HCC
Based on the TCGA data, it was investigated whether
any correlation was present between the expression of CCNB2 and
NUSAP1 or TK1. The results indicated that the 3 genetic markers had
a moderately or highly positive correlation; the expression of
CCNB2 and NUSAP1 was highly correlated, while the expression of TK1
was moderately correlated with that of CCNB2 and NUSAP1 (P<0.05;
Fig. 5A-C).
The influence of the expression of CCNB2, NUSAP1 and
TK1 on survival and of patients with HCC was also analyzed. The
expression of CCNB2 was revealed to be positively associated with
survival. Higher expression of CCNB2 was associated with poorer
survival, while the expression of NUSAP1 and TK1 was not associated
with survival. A slight trend for high expression was associated
with poor prognosis (P<0.05; Fig. 5D-F).
Regression analysis was performed to determine the
association between the expression of CCNB2, NUSAP1 or TK1 and the
histopathological grade. The results suggested that the expression
of each of the 3 genetic markers exhibited a mild positive
correlation with the histopathological grade (Fig. 5G-I).
ROC curve analysis was used to assess the ability of
the expression levels of CCNB2, NUSAP1 and TK1 to distinguish
between patients with recurrent and not-recurrent HCC. The results
suggested that AUC values of NUSAP1 and TK1 were >0.5
(P<0.05), whereas CCNB2 had no significant potential to
distinguish between patients with recurrent and non-recurrent HCC
(Fig. 5J-L). However, the AUCs in the present study are relatively
small (~0.56) and may not be sufficient for each molecule on its
own to predict recurrence. Hence, they may be used in combination
with other predictive factors.
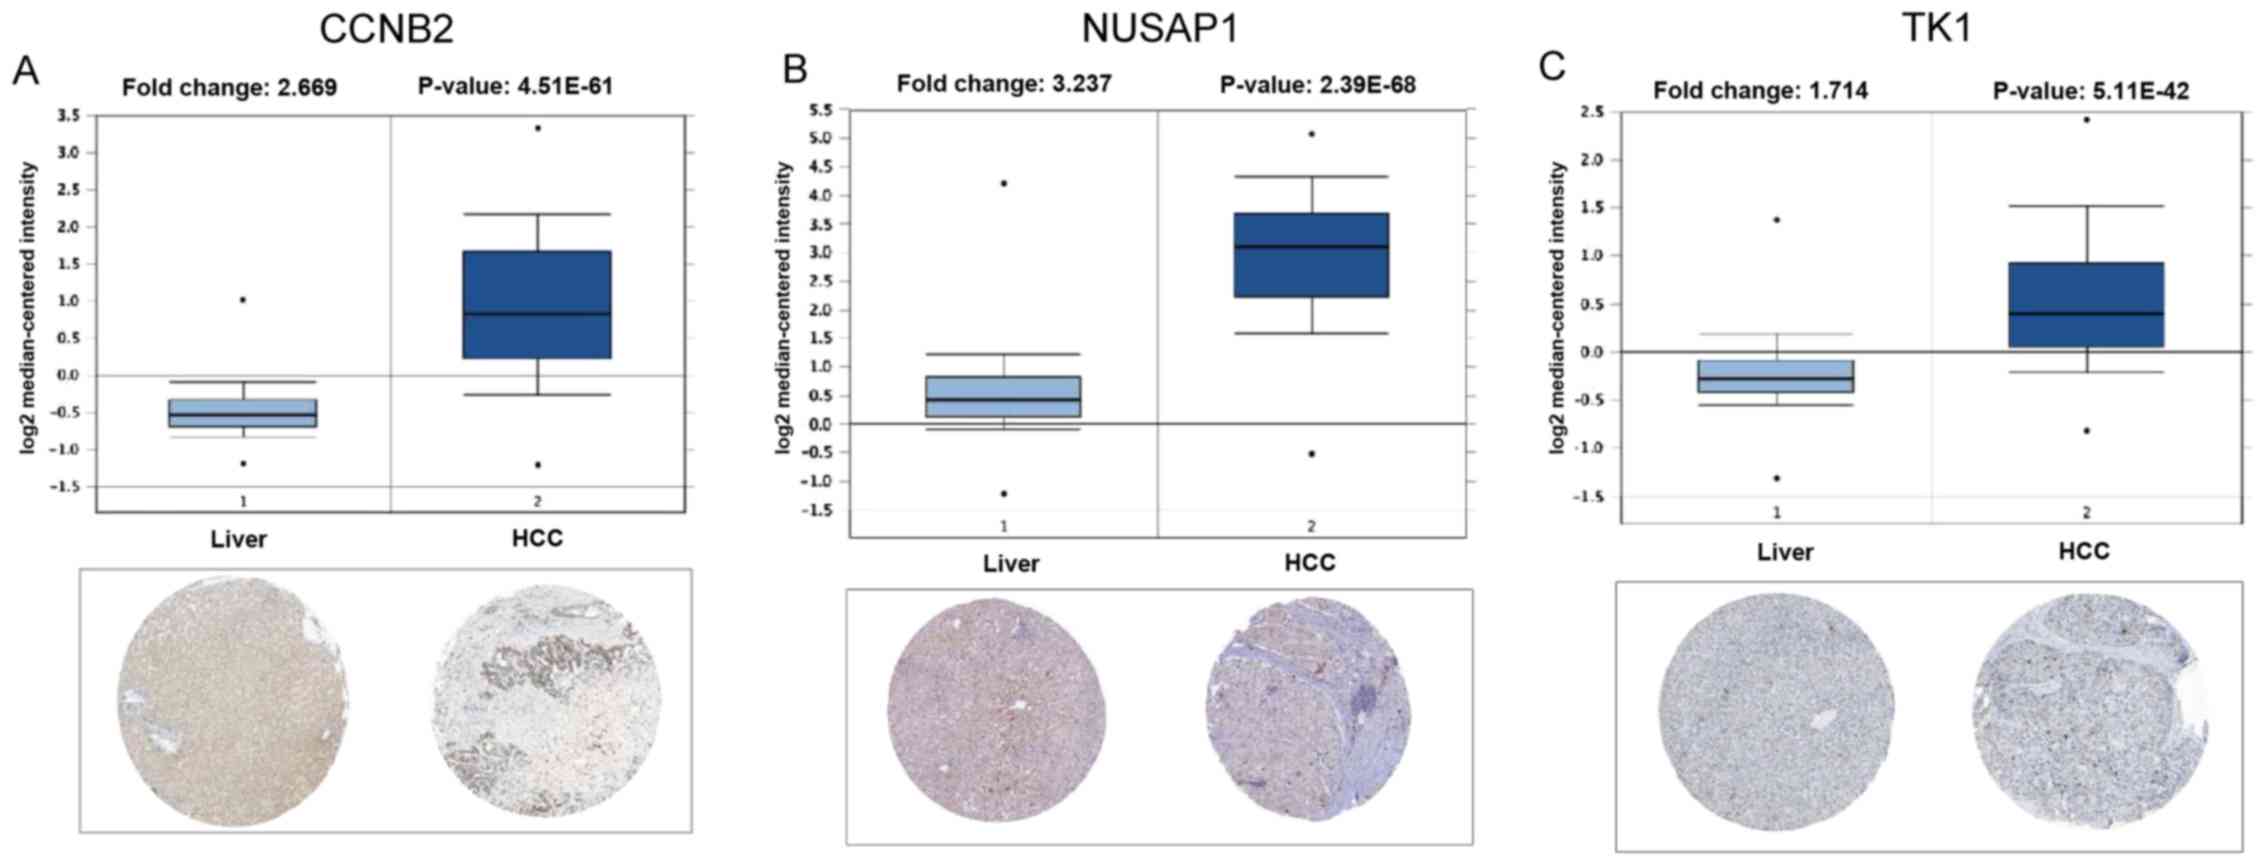
Expression levels of genetic markers
in HCC tissue
To investigate the clinical significance of the
expression of the genetic markers identified in HCC, the expression
of CCNB2, NUSAP1 and TK1 was compared between normal human liver
and HCC tissues using the Oncomine database. The Human Protein
Atlas database was also used to verify the protein expression
levels of these genetic markers. The analysis of a representative
dataset (Roessler Liver 2) revealed that CCNB2, NUSAP1 and TK1 mRNA
expression was maintained at significantly higher levels in HCC vs.
normal liver tissues, which was consistent with the microarray
results. The expression of the 3 genetic markers in HCC determined
in the above analysis was also consistent with the histological
evaluation results from the Human Protein Atlas database (Fig. 6). Furthermore, RT-qPCR was used to
verify the expression levels of the 3 genetic markers in primary
HCC and paired adjacent tissues. In the 16 HCC tissues, CCNB2,
NUSAP1 and TK1 were significantly upregulated as compared with
those in their matched adjacent tissues (P<0.001; Fig. 7A-C). In
addition, a highly positive correlation was determined between the
expression of CCNB2 and NUSAP1 (P<0.05), while the expression of
CCNB2 and TK1 and that of NUSPA1 and TK1 exhibited a moderate
positive correlation (P<0.05; Fig. 7D-F).
Discussion
In the present study, DEGs from 3 GEO datasets were
screened. A total of 96 DEGs were identified following RRA
analysis, including 25 up- and 71 downregulated genes. Following
enrichment and PPI analysis, 15 genes were identified as hub genes.
Among these 15 hub genes, CCNB2, NUSAP1 and TK1 were closely
correlated with one another, and may participate in the E2F1
pathway interacting with the BRCA1 pathway. It was also indicated
that these genes may be involved in HCC progression.
DEG enrichment analysis suggested that
‘anaphase-promoting complex-dependent catabolic process’,
‘oxidation-reduction process’ and ‘cell division’ were the top 3
most significantly enriched BPs. The major reason for tumorigenesis
may be cell cycle imbalance, which then induces excessive cell
proliferation. Furthermore, several of the 15 hub genes were
indicated to be involved in cancer cell growth and survival.
Targeting of AURKA by inhibitor alisertib potently induced
apoptosis in HCC cells, which was consistent with the results of
clinical trials for hematological malignancies and solid tumors
(19,20). CDC20 has been reported to be closely
associated with the tumorigenesis and progression of multiple
cancers (21). TOP2A overexpression
is implicated in early-stage HCC development, short survival and
chemoresistance in patients with HCC (22,23).
KIFC1 is considered a potential biomarker for non-small cell lung
cancer and may have a significant reference value for ovarian
adenocarcinoma metastasis (24,25).
Increased KIFC1 mRNA expression in HCC induced cell metastasis
through the G-ankyrin/AKT/TWIST1 signaling pathway (26). PRC1 was not only overexpressed in
several types of cancer, but it was also reported to enhance early
HCC development through the Wnt/β-catenin pathway (27-29).
KIF20A is a downstream target of Hedgehog signaling and crucial to
the growth of human HCC cells through the GLI family zinc finger
2/KIF20A axis (30,31). RACGAP1 was reported to be highly
upregulated in multiple types of cancer (32,33). A
recent study also suggested that RACGAP1 was essential for HCC cell
cytokinesis and suppressed the Hippo/yes-associated protein-1
pathway (34). PTTG1 is closely
associated with hepatitis B virus x (HBx) protein and was indicated
to be highly expressed in HBx-immunoreactive cells, which may
contribute to cirrhosis and HCC in patients with chronic hepatitis
B (35,36). The expression of CDCA5 was reported
to be closely linked to microvascular invasion and tumor diameter,
and inhibition of CDCA5 expression impeded hepatoma cell
proliferation and induced apoptosis (37). UBE2C was indicated to be highly
expressed in HCC tumor tissues and patients with upregulated UBE2C
were more likely to have higher-grade tumors and poor prognosis
(38,39). Overexpression of MELK leads to cell
cycle- and mitosis-associated gene expression, which influences
cell division. In addition, MELK was defined as an oncogenic kinase
in early HCC recurrence (40,41). To
date, the function of CKAP2L in cancer has rarely been investigated
and its mechanism has remained elusive (42,43).
Besides the hub genes mentioned above, the present
study focused on the CCNB2, NUSAP1 and TK1 genes, and PPI analysis
suggested that CCNB2, NUSAP1 and TK1 are closely associated with
other hub genes. BRCA1 was indicated to be one of the protein
targets of double-stand breaks and ATM/ATR and E2F1 was involved in
the cell cycle by influencing the formation of RAD51 foci, which
was controlled by BRCA1 and BRCA2(44), and BRCA1 has two splice variants,
BRCA1a and BRCA1b, which are able to associate with E2F
transcriptional factors, including cyclins/cyclin D kinase (CDK) to
regulate the cell cycle (45). In a
previous study, based on integration of GRNInfer with GO, KEGG,
BioCarta, GNF-U133A, UNIGENE-EST, Disease and GenMAPP databases by
DAVID and MAS 3.0, CCNB2, NUSAP1 and TK1 were key molecules in a
novel hypothetic mechanism of the E2F1 interacting with the BRCA1
pathway, where CCNB2 and NUSAP1 were upstream molecules and TK1 an
important downstream molecule (18).
CCNB2 belongs to the B-type cyclin family and is known to activate
CDKs during the cell cycle; inhibition of the expression of CCNB2
in BEL-7404 cells was reported to decrease cell proliferation and
migration, increase cell apoptosis and induce S-phase arrest
(46,47). NUSAP1 is a 55-kDa protein involved in
cell proliferation, which interacts with microtubules and causes
chromosome segregation. NUSAP1 has a key role in BRCA1-regulated
pathways, as it regulates BRCA1 protein levels from the early
S-phase into G2-phase (48). There
are two CCAAT boxes and binding sites for E2F1 in the promoter
region of NUSAP and overexpression of E2F1 results in increased
expression of NUSAP; NUSAP overexpression appears to be driven in
part by E2F1 activation (49). TK1
is involved in DNA repair and is upregulated during S-phase. A
study on pancreatic ductal adenocarcinoma suggested that patients
with upregulated TK1 had poor prognosis and that the transcription
factor E2F1 may lead to tumor cell proliferation by regulating TK1
expression (50-53).
In the present study, further analysis using data
from TCGA indicated a close correlation among CCNB2, NUSAP1 and
TK1. CCNB2 was significantly associated with the survival of
patients with HCC. The ROC curve and calculated AUC suggested that
NUSAP1 and TK1 were capable of distinguishing between recurrent and
non-recurrent HCC. In addition, CCNB2, NUSAP1 and TK1 were all
highly correlated with the HCC grade. Furthermore, the Oncomine
database and the HPA database were used to verify the
transcriptional and translational expression levels of the 3 genes.
It was revealed that, as compared with normal tissue, the 3 genes
were significantly upregulated in HCC. In addition, RT-qPCR
demonstrated that the mRNA expression of CCNB2, NUSAP1 and TK1 was
increased in 16 primary HCC tissues as compared with that in the
matched adjacent tissues, and the 3 genes were closely correlated
with one another. The increase in CCNB2 and NUSAP1 expression was
highly correlated with the expression of TK1, and based on the
Kaplan Meier analysis, high expression levels of TK1 was linked to
poor prognosis, indicating that it may be more accurate if the
combination of CCNB2. While NUSAP1 and TK1 is used as a prognostic
marker for HCC, the detailed mechanism of CCNB2-NUSAP1-TK1 on the
cell cycle and apoptosis of HCC cells warrants further
investigation.
Only a few studies have focused on the association
between these 3 genes and their role in the E2F1 pathway
interacting with the BRCA1 pathway. This was attempted in the
present study. The present results demonstrated that CCNB2, NUSAP1
and TK1 were significantly upregulated in HCC tissues compared with
adjacent normal tissues through RT-qPCR analysis, as well as
bioinformatics analyses of the TCGA and GEO databases. High
expression levels of CCNB2, NUSAP1 and TK1 in HCC tissues were
associated with poor prognosis and high risk of reccurrence.
However, further studies are required to explore the biological
functions of these 3 genes in HCC and/or other cancer types,
including metabolism and cell cycle. This may indicate their
utility as targets in the treatment of HCC and/or other cancer
types and provide details on the interactions between them. The
roles of the other 12 hub genes that do not interact with E2F1 and
the BRCA1 pathway in HCC also require further investigation.
In conclusion, using a series of rigorous
bioinformatics analyses, it was indicated that the expression
levels of CCNB2, NUSAP1 and TK1 were not only closely correlated
with the HCC grade but also associated with OS, and the expression
of the 3 genes at the transcriptional and translational level also
proved their vital role in HCC. These genes not only regulate key
steps of the cell cycle and catabolic processes, targeting
individual genes and potentially affecting cancer cell development
and growth, but are also closely associated with one another.
CCNB2, NUSAP1 and TK1 may therefore be reliable prognostic
biomarkers for HCC, and even as possible oncogenes and therapeutic
targets in HCC.
In the present study, bioinformatics analyses were
used to screen for DEGs between HCC and non-tumor tissues. Among
the 15 hub genes, CCNB2, NUSAP1 and TK1 were indicated to be
correlated with one another, and those genes were indicated to be
able to help predict the prognosis of HCC patients. The results of
the present study may prove valuable from the perspectives of basic
research and clinical treatment for HCC. However, even though the
present results may contribute to the understanding of the
progression of HCC, further studies are required to verify genes
associated with HCC.
Acknowledgements
Not applicable.
Funding
This research was funded by the National Natural
Science Foundation of China (grant nos. 81572994 and 81872491),
Guangxi Science and Technology Base and Talent Special Project
(grant no. 2017AD10045), Key Laboratory of the Ministry of
Education Project for Early Prevention and Treatment of Regional
High-risk Tumors (grant no. GKE2018-03) and the Guangxi Nanning
Qing Xiu District Science and Technology Research and Technology
Project (grant no. 2014S03).
Availability of data and materials
The datasets used and/or analyzed during the present
study are available from the corresponding author on reasonable
request.
Author's contributions
LL and AC were involved in drafting the manuscript,
design of the study, acquisition and analysis of data and approval
of the final version to be published. SC, WS, QY and PW contributed
to the conception and design of the study and the acquisition of
the data. SZ was responsible for analysis and interpretation of the
data. All authors read and approved the final manuscript.
Ethics approval and consent to
participate
The present study was approved by the Ethics
Committee of Guangxi Medical University (Guangxi, China) and in
accordance with the Guangxi Medical University guidelines and
regulations. The patients provided written informed consent;
furthermore, the authors made efforts to remove any identifying
information to protect the privacy of the patients.
Patient consent for publication
Not applicable.
Competing interests
The authors declare that they have no competing
interests.
References
|
1
|
Siegel RL, Miller KD and Jemal A: Cancer
statistics, 2019. CA Cancer J Clin. 69:7–34. 2019.PubMed/NCBI View Article : Google Scholar
|
|
2
|
Villanueva A: Hepatocellular carcinoma. N
Engl J Med. 380:1450–1462. 2019. View Article : Google Scholar
|
|
3
|
Bertuccio P, Turati F, Carioli G,
Rodriguez T, La Vecchia C, Malvezzi M and Negri E: Global trends
and predictions in hepatocellular carcinoma mortality. J Hepatol.
67:302–309. 2017.PubMed/NCBI View Article : Google Scholar
|
|
4
|
Mak LY, Cruz-Ramón V, Chinchilla-López P,
Torres HA, LoConte NK, Rice JP, Foxhall LE, Sturgis EM, Merrill JK,
Bailey HH, et al: Global epidemiology, prevention, and management
of hepatocellular carcinoma. Am Soc Clin Oncol Educ Book.
38:262–279. 2018.PubMed/NCBI View Article : Google Scholar
|
|
5
|
Bosetti C, Turati F and La Vecchia C:
Hepatocellular carcinoma epidemiology. Best Pract Res Clin
Gastroenterol. 28:753–770. 2014.PubMed/NCBI View Article : Google Scholar
|
|
6
|
Turati F, Galeone C, Rota M, Pelucchi C,
Negri E, Bagnardi V, Corrao G, Boffetta P and La Vecchia C: Alcohol
and liver cancer: A systematic review and meta-analysis of
prospective studies. Ann Oncol. 25:1526–1535. 2014.PubMed/NCBI View Article : Google Scholar
|
|
7
|
Jindal A, Thadi A and Shailubhai K:
Hepatocellular carcinoma: Etiology and current and future drugs. J
Clin Exp Hepatol. 9:221–232. 2019.PubMed/NCBI View Article : Google Scholar
|
|
8
|
Bedard PL, Hansen AR, Ratain MJ and Siu
LL: Tumour heterogeneity in the clinic. Nature. 501:355–364.
2013.PubMed/NCBI View Article : Google Scholar
|
|
9
|
Ward PS and Thompson CB: Metabolic
reprogramming: A cancer hallmark even warburg did not anticipate.
Cancer Cell. 21:297–308. 2012.PubMed/NCBI View Article : Google Scholar
|
|
10
|
Pavlova NN and Thompson CB: The emerging
hallmarks of cancer metabolism. Cell Metab. 23:27–47.
2016.PubMed/NCBI View Article : Google Scholar
|
|
11
|
Dimri M, Humphries A, Laknaur A, Elattar
S, Lee TJ, Sharma A, Kolhe R and Satyanarayana A: NAD(P)H quinone
dehydrogenase 1 ablation inhibits activation of the
phosphoinositide 3-kinase/Akt Serine/threonine kinase and
mitogen-activated protein kinase/extracellular signal-regulated
kinase pathways and blocks metabolic adaptation in hepatocellular
carcinoma. Hepatology: Jun 19, 2019 (Epub ahead of print). doi:
10.1002/hep.30818.
|
|
12
|
Liu Y, Gong W, Yang ZY, Zhou XS, Gong C,
Zhang TR, Wei X, Ma D, Ye F and Gao QL: Quercetin induces
protective autophagy and apoptosis through ER stress via the
p-STAT3/Bcl-2 axis in ovarian cancer. Apoptosis. 22:544–557.
2017.PubMed/NCBI View Article : Google Scholar
|
|
13
|
Wu L, Li J, Liu T, Li S, Feng J, Yu Q,
Zhang J, Chen J, Zhou Y, Ji J, et al: Quercetin shows anti-tumor
effect in hepatocellular carcinoma LM3 cells by abrogating
JAK2/STAT3 signaling pathway. Cancer Med. 8:4806–4820.
2019.PubMed/NCBI View Article : Google Scholar
|
|
14
|
Anastas JN and Moon RT: WNT signalling
pathways as therapeutic targets in cancer. Nat Rev Cancer.
13:11–26. 2013.PubMed/NCBI View
Article : Google Scholar
|
|
15
|
Uhlén M, Fagerberg L, Hallström BM,
Lindskog C, Oksvold P, Mardinoglu A, Sivertsson Å, Kampf C,
Sjöstedt E, Asplund A, et al: Proteomics. Tissue-based map of the
human proteome. Science. 347(1260419)2015.PubMed/NCBI View Article : Google Scholar
|
|
16
|
Chandrashekar DS, Bashel B, Balasubramanya
SAH, Creighton CJ, Ponce-Rodriguez I, Chakravarthi BVSK and
Varambally S: UALCAN: A portal for facilitating tumor subgroup gene
expression and survival analyses. Neoplasia. 19:649–658.
2017.PubMed/NCBI View Article : Google Scholar
|
|
17
|
Livak KJ and Schmittgen TD: Analysis of
relative gene expression data using real-time quantitative PCR and
the 2(-Delta Delta C(T)) method. Methods. 25:402–408.
2001.PubMed/NCBI View Article : Google Scholar
|
|
18
|
Chen Q, Wang L, Jiang M, Huang J, Jiang Z,
Feng H and Ji Z: E2F1 interactive with BRCA1 pathway induces HCC
two different small molecule metabolism or cell cycle regulation
via mitochondrion or CD4+ T to cytosol. J Cell Physiol.
233:1213–1221. 2018.PubMed/NCBI View Article : Google Scholar
|
|
19
|
Goldenson B and Crispino JD: The aurora
kinases in cell cycle and leukemia. Oncogene. 34:537–545.
2015.PubMed/NCBI View Article : Google Scholar
|
|
20
|
Schneider MA, Christopoulos P, Muley T,
Warth A, Klingmueller U, Thomas M, Herth FJ, Dienemann H, Mueller
NS, Theis F and Meister M: AURKA, DLGAP5, TPX2, KIF11 and CKAP5:
Five specific mitosis-associated genes correlate with poor
prognosis for non-small cell lung cancer patients. Int J Oncol.
50:365–372. 2017.PubMed/NCBI View Article : Google Scholar
|
|
21
|
Chu Z, Zhang X, Li Q, Hu G, Lian CG and
Geng S: CDC20 contributes to the development of human cutaneous
squamous cell carcinoma through the Wnt/β-catenin signaling
pathway. Int J Oncol. 54:1534–1544. 2019.PubMed/NCBI View Article : Google Scholar
|
|
22
|
Nitiss JL: DNA topoisomerase II and its
growing repertoire of biological functions. Nat Rev Cancer.
9:327–337. 2009.PubMed/NCBI View
Article : Google Scholar
|
|
23
|
Wong N, Yeo W, Wong WL, Wong NL, Chan KY,
Mo FK, Koh J, Chan SL, Chan AT, Lai PB, et al: TOP2A overexpression
in hepatocellular carcinoma correlates with early age onset,
shorter patients survival and chemoresistance. Int J Cancer.
124:644–652. 2009.PubMed/NCBI View Article : Google Scholar
|
|
24
|
Yu K, Hou L, Zhu JQ, Ying XP and Yang WX:
KIFC1 participates in acrosomal biogenesis, with discussion of its
importance for the perforatorium in the Chinese mitten crab
Eriocheir sinensis. Cell Tissue Res. 337:113–123. 2009.PubMed/NCBI View Article : Google Scholar
|
|
25
|
Pawar S, Donthamsetty S, Pannu V, Rida P,
Ogden A, Bowen N, Osan R, Cantuaria G and Aneja R: KIFCI, a novel
putative prognostic biomarker for ovarian adenocarcinomas:
Delineating protein interaction networks and signaling circuitries.
J Ovarian Res. 7(53)2014.PubMed/NCBI View Article : Google Scholar
|
|
26
|
Han J, Wang F, Lan Y, Wang J, Nie C, Liang
Y, Song R, Zheng T, Pan S, Pei T, et al: KIFC1 regulated by
miR-532-3p promotes epithelial-to-mesenchymal transition and
metastasis of hepatocellular carcinoma via gankyrin/AKT signaling.
Oncogene. 38:406–420. 2019.PubMed/NCBI View Article : Google Scholar
|
|
27
|
Chen J, Rajasekaran M, Xia H, Zhang X,
Kong SN, Sekar K, Seshachalam VP, Deivasigamani A, Goh BK, Ooi LL,
et al: The microtubule-associated protein PRC1 promotes early
recurrence of hepatocellular carcinoma in association with the
Wnt/β-catenin signalling pathway. Gut. 65:1522–1534.
2016.PubMed/NCBI View Article : Google Scholar
|
|
28
|
Subramanian R, Wilson-Kubalek EM, Arthur
CP, Bick MJ, Campbell EA, Darst SA, Milligan RA and Kapoor TM:
Insights into antiparallel microtubule crosslinking by PRC1, a
conserved nonmotor microtubule binding protein. Cell. 142:433–443.
2010.PubMed/NCBI View Article : Google Scholar
|
|
29
|
Wang SM, Ooi LL and Hui KM: Upregulation
of Rac GTPase-activating protein 1 is significantly associated with
the early recurrence of human hepatocellular carcinoma. Clin Cancer
Res. 17:6040–6051. 2011.PubMed/NCBI View Article : Google Scholar
|
|
30
|
Verhey KJ and Hammond JW: Traffic control:
Regulation of kinesin motors. Nat Rev Mol Cell Biol. 10:765–777.
2009.PubMed/NCBI View
Article : Google Scholar
|
|
31
|
Shi C, Huang D, Lu N, Chen D, Zhang M, Yan
Y, Deng L, Lu Q, Lu H and Luo S: Aberrantly activated Gli2-KIF20A
axis is crucial for growth of hepatocellular carcinoma and predicts
poor prognosis. Oncotarget. 7:26206–26219. 2016.PubMed/NCBI View Article : Google Scholar
|
|
32
|
Imaoka H, Toiyama Y, Saigusa S, Kawamura
M, Kawamoto A, Okugawa Y, Hiro J, Tanaka K, Inoue Y, Mohri Y and
Kusunoki M: RacGAP1 expression, increasing tumor malignant
potential, as a predictive biomarker for lymph node metastasis and
poor prognosis in colorectal cancer. Carcinogenesis. 36:346–354.
2015.PubMed/NCBI View Article : Google Scholar
|
|
33
|
Saigusa S, Tanaka K, Mohri Y, Ohi M,
Shimura T, Kitajima T, Kondo S, Okugawa Y, Toiyama Y, Inoue Y and
Kusunoki M: Clinical significance of RacGAP1 expression at the
invasive front of gastric cancer. Gastric Cancer. 18:84–92.
2015.PubMed/NCBI View Article : Google Scholar
|
|
34
|
Yang XM, Cao XY, He P, Li J, Feng MX,
Zhang YL, Zhang XL, Wang YH, Yang Q, Zhu L, et al: Overexpression
of Rac GTPase activating protein 1 contributes to proliferation of
cancer cells by reducing hippo signaling to promote cytokinesis.
Gastroenterology. 155:1233–1249, e22. 2018.PubMed/NCBI View Article : Google Scholar
|
|
35
|
Zou H, McGarry TJ, Bernal T and Kirschner
MW: Identification of a vertebrate sister-chromatid separation
inhibitor involved in transformation and tumorigenesis. Science.
285:418–422. 1999.PubMed/NCBI View Article : Google Scholar
|
|
36
|
Molina-Jiménez F, Benedicto I, Murata M,
Martin-Vilchez S, Seki T, Antonio Pintor-Toro J, Tortolero M,
Moreno-Otero R, Okazaki K, Koike K, et al: Expression of pituitary
tumor-transforming gene 1 (PTTG1)/securin in hepatitis B virus
(HBV)-associated liver diseases: Evidence for an HBV X
protein-mediated inhibition of PTTG1 ubiquitination and
degradation. Hepatology. 51:777–787. 2010.PubMed/NCBI View Article : Google Scholar
|
|
37
|
Tian Y, Wu J, Chagas C, Du Y, Lyu H, He Y,
Qi S, Peng Y and Hu J: CDCA5 overexpression is an Indicator of poor
prognosis in patients with hepatocellular carcinoma (HCC). BMC
Cancer. 18(1187)2018.PubMed/NCBI View Article : Google Scholar
|
|
38
|
Rape M and Kirschner MW: Autonomous
regulation of the anaphase-promoting complex couples mitosis to
S-phase entry. Nature. 432:588–595. 2004.PubMed/NCBI View Article : Google Scholar
|
|
39
|
Fernandez Esmerats J, Villa-Roel N, Kumar
S, Gu L, Salim MT, Ohh M, Taylor WR, Nerem RM, Yoganathan AP and Jo
H: Disturbed flow increases UBE2C (Ubiquitin E2 Ligase C) via loss
of miR-483-3p, inducing aortic valve calcification by the pVHL (von
Hippel-Lindau protein) and HIF-1α (hypoxia-inducible factor-1α)
pathway in endothelial cells. Arterioscler Thromb Vasc Biol.
39:467–481. 2019.PubMed/NCBI View Article : Google Scholar
|
|
40
|
Xia H, Kong SN, Chen J, Shi M, Sekar K,
Seshachalam VP, Rajasekaran M, Goh BKP, Ooi LL and Hui KM: MELK is
an oncogenic kinase essential for early hepatocellular carcinoma
recurrence. Cancer Lett. 383:85–93. 2016.PubMed/NCBI View Article : Google Scholar
|
|
41
|
Blot J, Chartrain I, Roghi C, Philippe M
and Tassan JP: Cell cycle regulation of pEg3, a new Xenopus protein
kinase of the KIN1/PAR-1/MARK family. Dev Biol. 241:327–338.
2002.PubMed/NCBI View Article : Google Scholar
|
|
42
|
Hussain MS, Battaglia A, Szczepanski S,
Kaygusuz E, Toliat MR, Sakakibara S, Altmüller J, Thiele H,
Nürnberg G, Moosa S, et al: Mutations in CKAP2L, the human homolog
of the mouse Radmis gene, cause Filippi syndrome. Am J Hum Genet.
95:622–632. 2014.PubMed/NCBI View Article : Google Scholar
|
|
43
|
Xiong G, Li L, Chen X, Song S, Zhao Y, Cai
W and Peng J: Up-regulation of CKAP2L expression promotes lung
adenocarcinoma invasion and is associated with poor prognosis. Onco
Targets Ther. 12:1171–1180. 2019.PubMed/NCBI View Article : Google Scholar
|
|
44
|
Chen J, Zhu F, Weaks RL, Biswas AK, Guo R,
Li Y and Johnson DG: E2F1 promotes the recruitment of DNA repair
factors to sites of DNA double-strand breaks. Cell Cycle.
10:1287–1294. 2011.PubMed/NCBI View Article : Google Scholar
|
|
45
|
Wang H, Shao N, Ding QM, Cui J, Reddy ES
and Rao VN: BRCA1 proteins are transported to the nucleus in the
absence of serum and splice variants BRCA1a, BRCA1b are tyrosine
phosphoproteins that associate with E2F, cyclins and cyclin
dependent kinases. Oncogene. 15:143–157. 1997.PubMed/NCBI View Article : Google Scholar
|
|
46
|
Li R, Jiang X, Zhang Y, Wang S, Chen X, Yu
X, Ma J and Huang X: Cyclin B2 overexpression in human
hepatocellular carcinoma is associated with poor prognosis. Arch
Med Res. 50:10–17. 2019.PubMed/NCBI View Article : Google Scholar
|
|
47
|
Wu T, Zhang X, Huang X, Yang Y and Hua X:
Regulation of cyclin B2 expression and cell cycle G2/m transition
by menin. J Biol Chem. 285:18291–18300. 2010.PubMed/NCBI View Article : Google Scholar
|
|
48
|
Raemaekers T, Ribbeck K, Beaudouin J,
Annaert W, Van Camp M, Stockmans I, Smets N, Bouillon R, Ellenberg
J and Carmeliet G: NuSAP, a novel microtubule-associated protein
involved in mitotic spindle organization. J Cell Biol.
162:1017–1029. 2003.PubMed/NCBI View Article : Google Scholar
|
|
49
|
Gulzar ZG, McKenney JK and Brooks JD:
Increased expression of NuSAP in recurrent prostate cancer is
mediated by E2F1. Oncogene. 32:70–77. 2013.PubMed/NCBI View Article : Google Scholar
|
|
50
|
Zhu X, Shi C, Peng Y, Yin L, Tu M, Chen Q,
Hou C, Li Q and Miao Y: Thymidine kinase 1 silencing retards
proliferative activity of pancreatic cancer cell via E2F1-TK1-P21
axis. Cell Prolif. 51(e12428)2018.PubMed/NCBI View Article : Google Scholar
|
|
51
|
Mao R, Liu J, Liu G, Jin S, Xue Q, Ma L,
Fu Y, Zhao N, Xing J, Li L, et al: Whole genome sequencing of
matched tumor, adjacent non-tumor tissues and corresponding normal
blood samples of hepatocellular carcinoma patients revealed dynamic
changes of the mutations profiles during hepatocarcinogenesis.
Oncotarget. 8:26185–26199. 2017.PubMed/NCBI View Article : Google Scholar
|
|
52
|
Kauffman MG and Kelly TJ: Cell cycle
regulation of thymidine kinase: Residues near the carboxyl terminus
are essential for the specific degradation of the enzyme at
mitosis. Mol Cell Biol. 11:2538–2546. 1991.PubMed/NCBI View Article : Google Scholar
|
|
53
|
Ke PY and Chang ZF: Mitotic degradation of
human thymidine kinase 1 is dependent on the anaphase-promoting
complex/cyclosome-CDH1-mediated pathway. Mol Cell Biol. 24:514–526.
2004.PubMed/NCBI View Article : Google Scholar
|