Introduction
Diffusion-weighted magnetic resonance imaging
(DWMRI) is a functional imaging technique based on the microscopic
random translational motion of water molecules in biological
tissues (1). The magnitude of this
motion is characterized by its apparent diffusion coefficient (ADC)
values. Water molecules can diffuse relatively freely in tissues
with normal cellularity, which results in a loss of signal on
diffusion-weighted imaging (DWI) and thus a high ADC (1). Conversely, the diffusion of water is
restricted in tissues with increased cellularity (such as tumors),
resulting in a high signal on DWI and a low ADC (2). DWMRI holds promise for use as a method
of detecting and diagnosing cancer due to its sensitivity to
macromolecular and microstructural changes that occur at the
cellular level and prior to anatomical changes (3). ADC in DWI can be used predict the
prognosis of patients with esophageal squamous cell carcinoma and
treatment response (3).
Traditionally, determination of the ADC is based on the assumption
of a Gaussian distribution of displacement probabilities of water
molecules due to water self-diffusion (4,5). The
DWI approach to data analysis was founded on the hypothesis that
water molecules diffuse within a voxel following a single direction
with Gaussian behavior and no restrictions (4,5). The
discovery of aquaporin (AQP) by Agre et al (6) in 1993 challenged this concept. AQPs
are a family of 13 small hydrophobic integral transmembrane water
channel proteins involved in transcellular and transepithelial
water movement, transport of fluid and cell migration (7,8). Due
to the presence of AQPs, water molecules within biological tissues
exhibit a non-Gaussian phenomenon known as diffusion kurtosis
imaging (DKI), as proposed by Jensen and Helpern and Jensen et
al (4,9). This approach evaluates the kurtosis
coefficient (K), which shows the deviation of diffusion from the
Gaussian-predicted approach, and the diffusion coefficient (D)
corrected for non-Gaussian bias. Several studies have shown that
DKI is more accurate than traditional ADC mapping in tumor
detection and grading assessment (5,10-15).
DWI using quantitative parameters (ADC and DKI) may serve as an
imaging biomarker to more effectively identify patients that are
more likely to benefit from aggressive neoadjuvant treatments
(16,17). In the present study, an animal model
of esophageal carcinoma was used to examine the predictive value of
DKI on the effects of radiotherapy, and the associated mechanisms
underlying the clinical applications of the technology were
investigated.
Materials and methods
Cell culture
Eca-109 human esophageal carcinoma cells (Shanghai
Institute of Biological Sciences) were cultured at 37˚C in a 5%
CO2 incubator with RPMI-1640 medium (Costar; Corning,
Inc.) supplemented with 10% FBS (Gibco; Thermo Fisher Scientific,
Inc.). Adherent cell cultures were used to increase growth during
passaging.
Experimental animals and model
construction
Immune-deficient BALB/c nude mice (4-6 weeks old;
male, 18-20 g) were purchased from Beijing Vital River Laboratory
Animal Technology Co., Ltd.; Charles River Laboratories, Inc., and
reared in the Animal Experiment Center of Hebei Medical University
Fourth Affiliated Hospital and Hebei Provincial Tumor Hospital in a
specific pathogen-free environment with a 12 h light/dark cycle,
ad libitum access to water and food, 50±10% relative
humidity and 23±2˚C temperature. The cell suspension was amplified
by the pancreatic digestion enzyme method. Using 1 ml injection to
extract the collected cell suspensions, the right forelimbs of nude
mice were chosen as the inoculation site, and the number of
inoculated cells in every nude mice was 5x10⁶/0.2 ml. At
~2 weeks after inoculation, a short diameter of about 10 mm
subcutaneous tumor can be formed.
Nude mice were anesthetized using 2% pentobarbital
injections of 0.05 ml/mouse (50 mg/kg) before MRI scanning. Animal
health and behavior were monitored once every other day, the cell
injections produced no observable behavioral effects and these mice
gained weight normally. A total of 132 mice were used, and eight
mice were found dead caused by overdose of pentobarbital at the
beginning of the experiment. At the end of the experiments, all
animals were euthanized by overdose of pentobarbital for
histological experiments. The mice stopped breathing and their
heartbeats stopped. The entire experiment lasted 42 weeks. All
animal experiments were approved by the Animal Protection Committee
of the Hebei Medical University Fourth Affiliated Hospital and
Hebei Provincial Tumor Hospital (approval no. 201618; Hebei,
China).
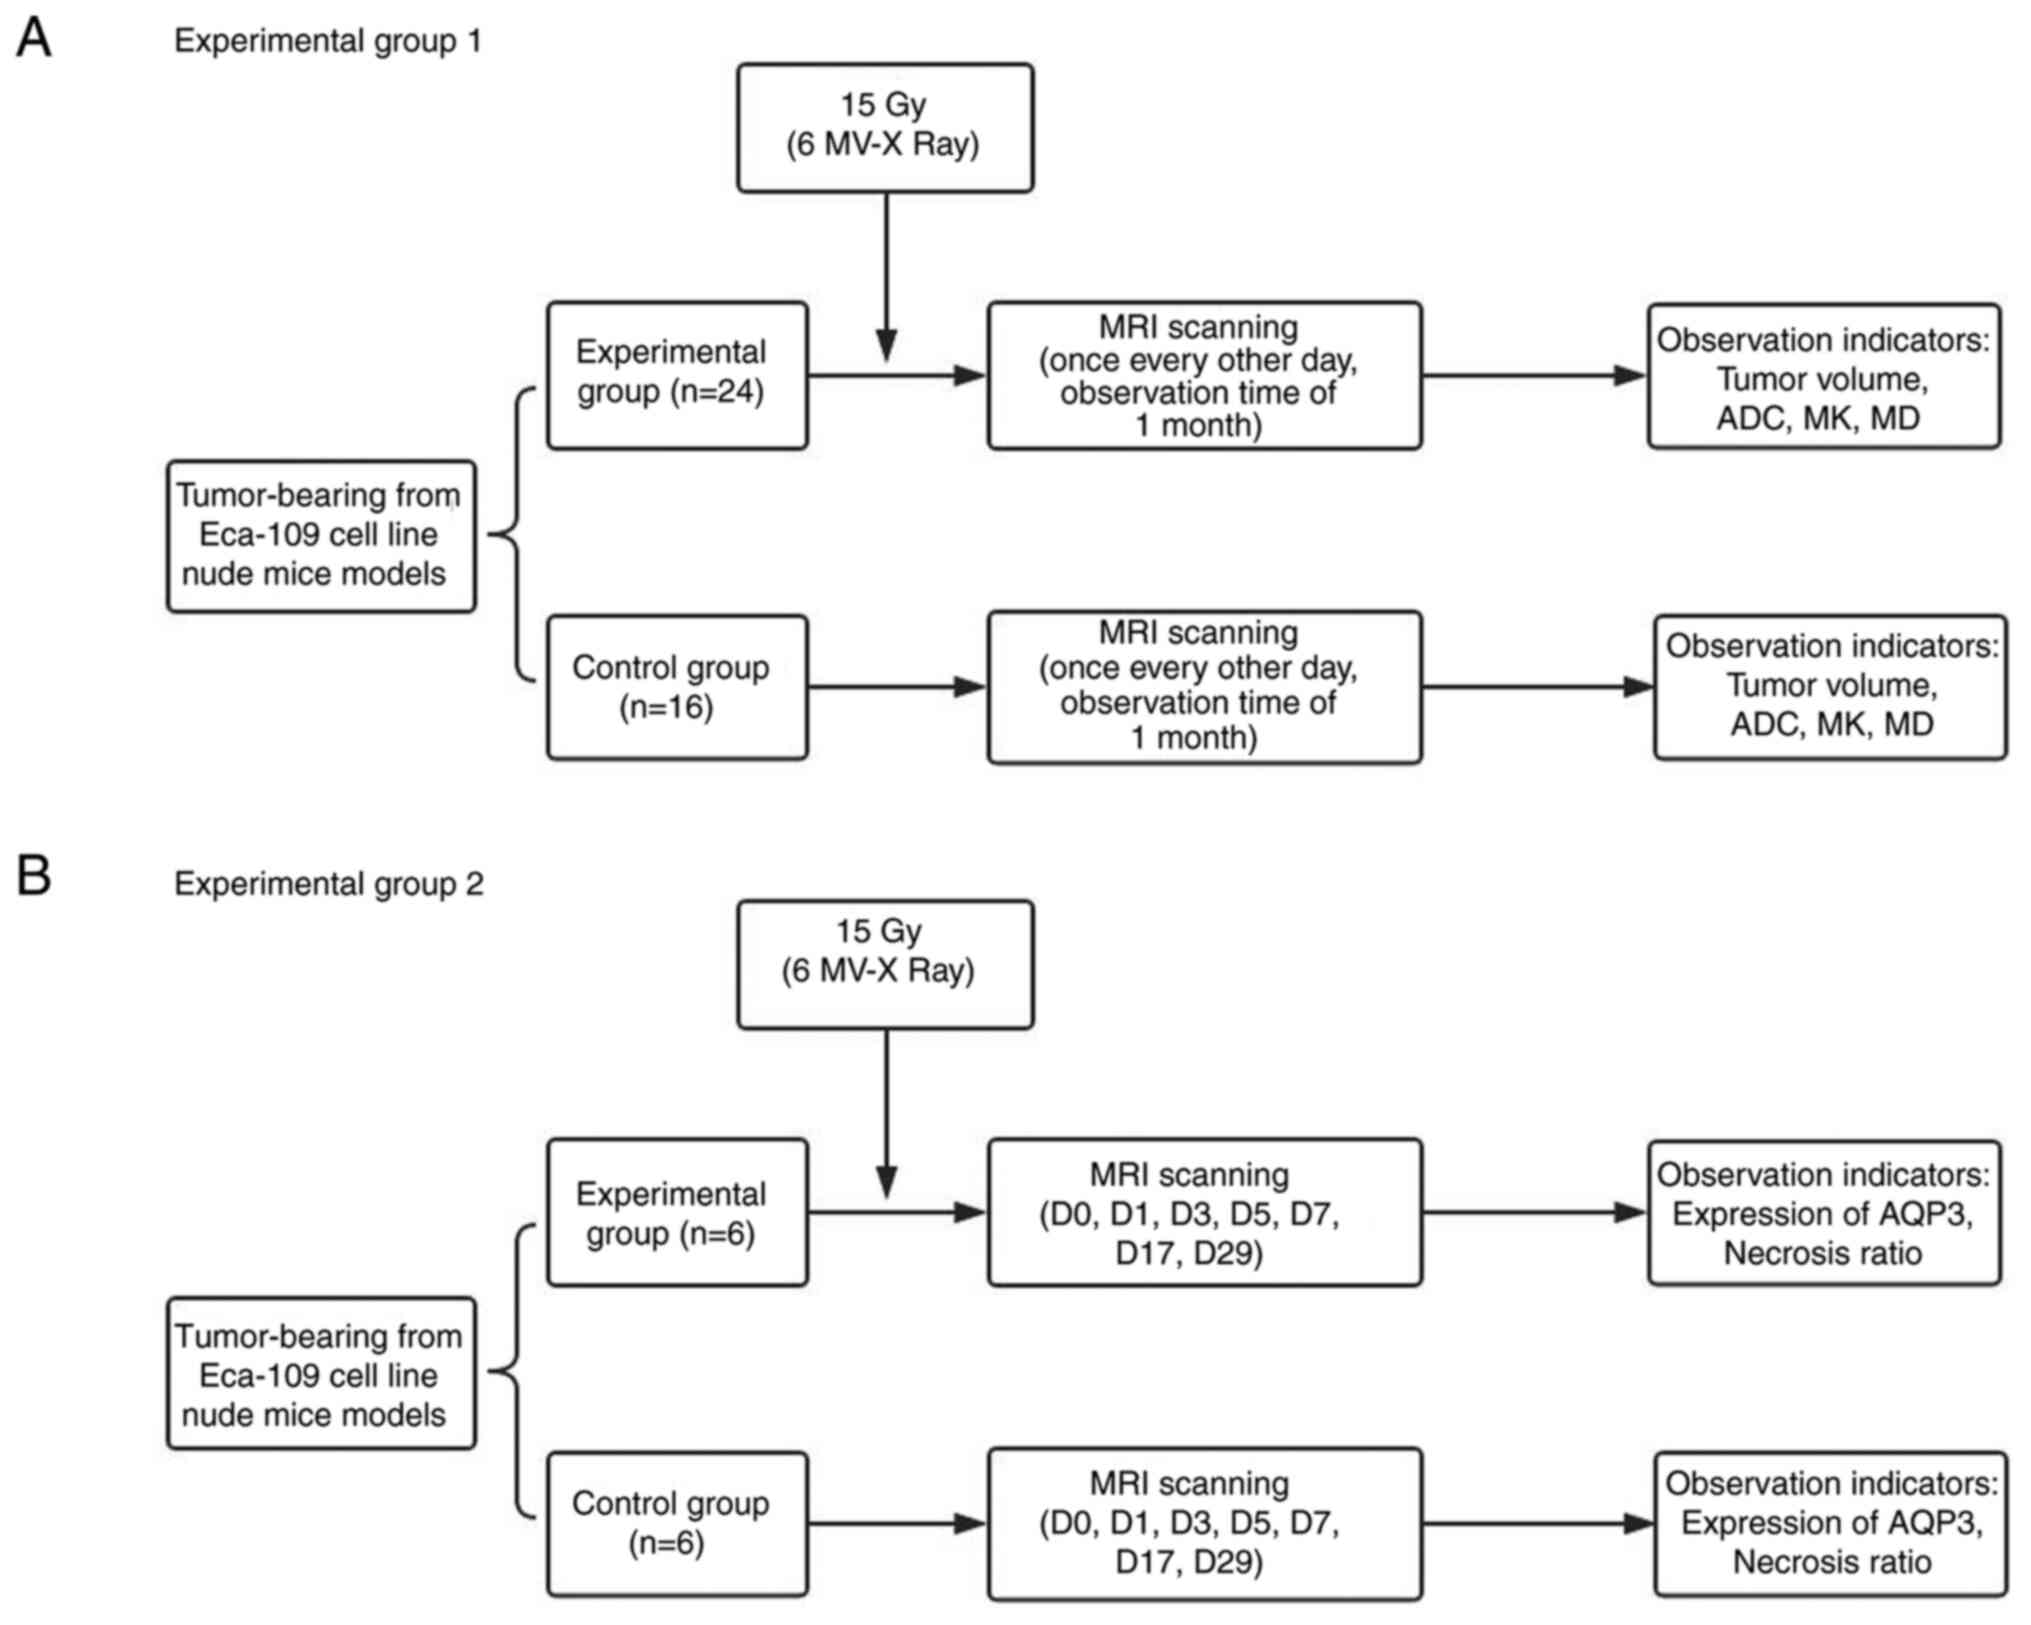
Experimental grouping
The schematic diagram of experimental groupings is
shown in Fig. 1. For experiment 1,
a total of 40 tumor-bearing nude mice were randomly divided into
two groups. The experimental group (24 mice) received 6 MV-X ray of
15 Gy radiotherapy (18). The
control group (16 mice) did not receive treatment. The two groups
were scanned before radiotherapy once every other day, for 1 month
after radiotherapy, for a total of 16 time points.
For experiment 2, according to the results of the
initial radiotherapy experiments, seven key time points were
selected, and mice were divided into seven groups, and 12 mice in
each group were randomly divided into the experimental and control
groups. MRI scans were performed on the mice before radiotherapy
and 1, 3, 5, 7, 17 and 29 days after radiotherapy. After completing
the MRI scan, the tumor-bearing nude mice were immediately
sacrificed via dislocation of the cervical vertebra, and the tumor
tissue was removed and soaked in 10% formalin solution.
Irradiation mode
An Elekta linear accelerator (Elekta Instrument AB)
was utilized with a 6 MV-X ray. The shooting field was 2x2 cm. The
source skin distance was 100 cm. The dose rate was 300 cGy/min, and
a single dose of 15 Gy was administered and covered with 1 cm
tissue compensation membrane. All the tumor-bearing nude mice in
the experimental group were fixed in the prone position and
received radiotherapy whilst they were awake.
MRI examination
MRI examination involved a Siemens 3.0 T MRI scanner
(Siemens Healthineers), loop coil and scanning sequence, including
T1 weighted imaging (T1WI), T2 weighted imaging (T2WI) and DWI
sequences (Table I), with a
diffusion time of ~10 min. B (dispersion-sensitive gradient)
selection was as follows (19,20):
0, 500, 800, 1,000, 1,500, 2,000, 2,500 and 3,000
sec/mm2. Nude mice were anesthetized using 2%
pentobarbital injection (0.05 ml/mouse) before scanning, and the
tumor-bearing nude mice were wrapped in fresh pork to reduce the
magnetic susceptibility artifact (21) and placed in the loop coils.
 | Table IMRI scan sequences and
parameters. |
Table I
MRI scan sequences and
parameters.
| Scan
parameters | T1WI
(Location) | T2WI (Coronal) | DWI (Axial) |
|---|
| TR (msec) | 700 | 3,500 | 2,400 |
| TE (msec) | 29 | 81 | 76 |
| TA | 2:00 | 2:08 | 13:26 |
| FOV read (mm) | 90 | 180 | 100 |
| FOV phase (%) | 100 | 100 | 100 |
| Slice thickness
(mm) | 2.5 | 1.4 | 3.0 |
| Number of
excitations | 1 | 1 | 3 |
| Dist. factor
(%) | 30 | 30 | 40 |
| Flip angle (˚) | 150 | 90 | 90 |
| Base
resolution | 448 | 320 | 34 |
| Phase
resolution | 336 | 256 | 34 |
| Scan trace | - | - | 3 |
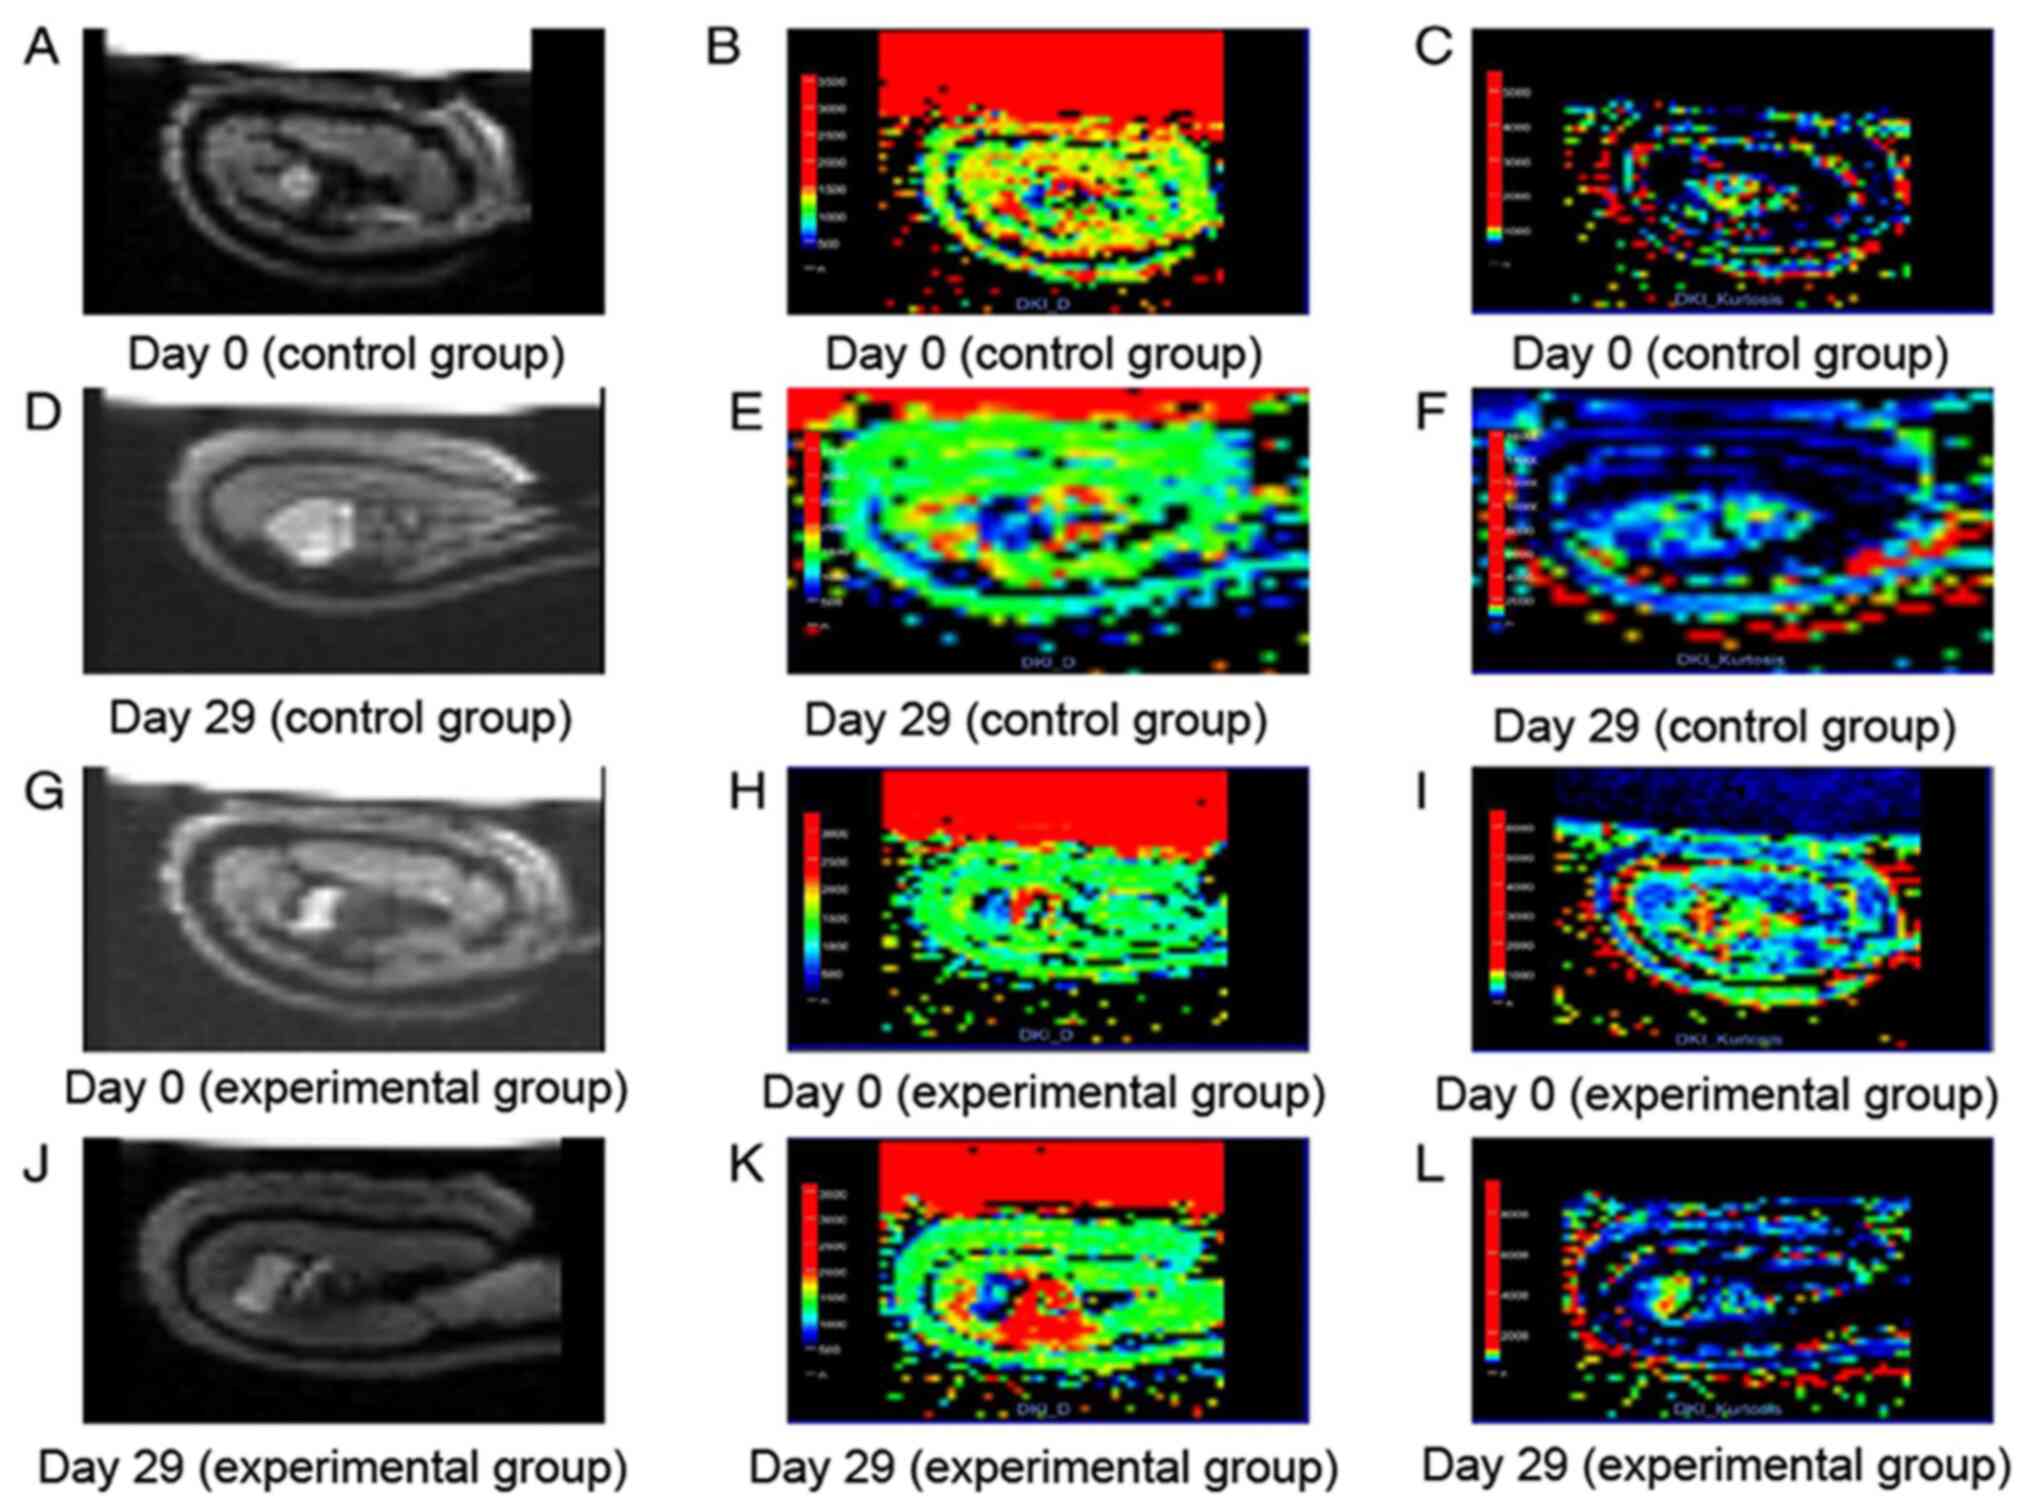
Calculation of parameters and
measurement of tumor volume
The DKI parametric maps were reconstructed using a
prototype software (Body Diffusion Toolbox 1.3; Siemens
Healthineers). Regions of interest (ROI) was delineated on special
b value images (1,000 s/mm2) due to a high contrast
between lesions and background. All ROIs were drawn with a criteria
where as much lesion tissue as possible were included, and as
little unconcerned tissue as possible were included. If necessary,
a T1WI contrast-enhanced or T2WI images were referred to. For the
measurement of volume or parameters, ITK SNAP software version
3.8.0 (https://itk.org/) was used, which is an open
source image analysis tool that can be used in medical image
segmentation and measurement. Mean values of measured lesions on
concerned parametric maps were used as the final index. MR images
across all timepoints were analyzed by the consensus of two
experienced radiologists (with 10 and 8 years of experience in
clinical MR, respectively). To assess the intra-observer
reproducibility of the measured values, consistency analysis was
performed on the 50 images using the values measured by both the
radiologists, and the averages of the values measured by the two
radiologists were used for final analysis (Fig. 2).
Detection of AQP expression in
tumors
Total RNA was extracted from the frozen tumors
tissue samples using TRIzol® reagent (Invitrogen; Thermo
Fisher Scientific, Inc.). RNA quality was assessed using a NanoDrop
1000 (Thermo Fisher Scientific, Inc.). cDNA was synthesized using
the First-strand cDNA synthesis kit (Thermo Fisher Scientific,
Inc.) according to the manufacturer's instructions. Reverse
transcription-quantitative PCR (RT-qPCR) was performed on an ABI
PRISM 7500 (Applied Biosystems) using SYBR Green Supermix with ROX
(Invitrogen; Thermo Fisher Scientific, Inc.) according to the
manufacturer's instructions. Thermocycling conditions were as
follows: 10 min at 95˚C, followed by 10 sec at 95˚C, 30 sec at 58˚C
and 25 sec at 72˚C, for a total of 40 cycles, then 1 min at 95˚C,
30 sec at 72˚C and 30 sec at 95˚C. Primers for AQPs were purchased
from GeneCopoeia, Inc. (Product IDs: GAPDH, HQP006940; AQP1,
HQP009689; AQP2, HQP009705; AQP3, HQP009724; AQP4, HQP009734; AQP5,
HQP101117; AQP6, HQP009760; AQP7, HQP009768; AQP8, HQP009420; AQP9,
HQP009790; AQP10, HQP021803; AQP11, HQP099040 and AQP12B,
HQP068062). Amplification signals for samples were normalized to
GAPDH, and the relative expression was calculated using the
2-ΔΔCq method (22).
Western blotting analysis
Total protein from xenograft tumor was extracted
using RIPA lysis buffer with freshly added protease inhibitor
(Roche Diagnostics). The expression of AQP3 protein in tumors was
detected using western blotting. Briefly, 60 µg total protein
extract was separated by 10% SDS-PAGE followed by transfer onto a
PVDF membrane (Roche Diagnostics), which was determined using a BCA
kit (Sigma-Aldrich; Merck KGaA). Membranes were blocked with 5%
skim milk at 25˚C for 2 h, incubated with rabbit polyclonal
antibodies against human AQPs (1:500; cat. no. ARG10648; Arigo
Biolaboratories Corp.) or GAPDH (1:10,000; Santa Cruz
Biotechnology, Inc.) overnight at 4˚C, followed by incubation with
secondary Goat anti-Rabbit IgG antibodies (HRP conjugated; 1:5,000;
cat. no. ARG65351; Arigo Biolaboratories Corp.) at 25˚C for 2 h.
Proteins were visualized with an ECL reagent (Thermo Fisher
Scientific, Inc.) using the FluorChem® HD2 protein
imprinting imaging system (Alpha InnoTec).
Detection of necrotic ratio in
tumors
The pathological sections of tumors obtained from
the xenograft mouse model of esophageal carcinoma were fixed in 10%
neutral buffered formalin solution at 25˚C for 24 h. Tumor tissues
were paraffin embedded and cut into 4-µm thick sections. The
sections were stained with Hematoxylin and Eosin, and were scored
by two experienced hepatopathologist (YW and NZ) in a blinded
manner. The necrotic ratio was based on three randomly selected
complete and non-overlapping macroscopic views (light microscope;
Nikon Corporation; magnification, x40) for each tissue slice, and
analyzed using ImageJ (v2.1.4.7, National Institutes of Health).
The following equation was used: Tumor necrosis ratio = (necrosis
area/tumor area) x100%.
Statistical analysis
Statistical analysis was performed using SPSS
version 22.0 (IBM Corp.). The normality of quantitative data was
assessed using a Kolmogorov-Smirnov test. All of data conformed to
the normal distribution, and are presented as the mean ± SD.
Continuous data that were normally distributed were analyzed using
a Student's t-test. The variables at different time points were
compared using repeated measures ANOVA. P<0.05 was considered to
indicate a statistically significant difference.
Results
Comparison of tumor volume between the
experimental and control groups before and after radiotherapy
In experiment 1, the growth doubling time was 17
days in the experimental group and 5 days in the control group.
There was a significant difference in tumor volume in the
experimental group at different time points (F=39.366; P<0.001),
and tumor volume in the control group at different time points
(F=61.561; P<0.001). The volume, V0, of the two
groups was 1.043±0.374 and 0.917±0.310 cm3,
respectively, and there was no statistically significant difference
between the two groups (P=0.270). The tumor volume in the control
group was approximately equal to the experimental group on the 1st
and 3rd days, and significant differences between the two were
observed on the 7th day after radiotherapy, and the xenograft
volume of the experimental group was significantly smaller compared
with the control group (P<0.05; Table II).
| Table IIComparison of transplanted tumor
volumes between experimental and control groups after
radiotherapy. |
Table II
Comparison of transplanted tumor
volumes between experimental and control groups after
radiotherapy.
| Day | Control group
(cm3) | Experimental group
(cm3) | P-value |
|---|
| D0 | 0.917±0.310 | 1.043±0.374 | 0.270 |
| D1 | 1.116±0.389 | 1.275±0.460 | 0.264 |
| D3 | 1.610±0.619 | 1.638±0.745 | 0.903 |
| D5 | 2.098±0.815 | 1.794±0.773 | 0.240 |
| D7 | 2.671±0.915 | 1.729±0.906 | 0.003 |
| D9 | 3.267±1.240 | 1.872±0.918 | <0.001 |
| D11 | 3.554±1.428 | 1.890±0.928 | <0.001 |
| D13 | 4.107±1.820 | 1.968±0.972 | <0.001 |
| D15 | 4.803±2.207 | 2.030±0.997 | <0.001 |
| D17 | 5.339±2.426 | 2.101±1.082 | <0.001 |
| D19 | 5.919±2.662 | 2.118±1.068 | <0.001 |
| D21 | 6.473±2.726 | 2.238±1.119 | <0.001 |
| D23 | 6.892±2.892 | 2.345±1.178 | <0.001 |
| D25 | 7.558±3.107 | 2.565±1.282 | <0.001 |
| D27 | 8.291±3.363 | 2.762±1.334 | <0.001 |
| D29 | 8.985±3.772 | 2.929±1.389 | <0.001 |
Comparison of ADC before and after
radiotherapy
The ADC of the experimental group decreased on the
1st day and increased rapidly on the 3rd day peaking on the 7th
day, after which, ADC remained relatively stable and gradually
declined after 17 days. However, the ADC in the control group began
to decrease from the 1st day and showed a monotonical decrease
which continued at a relatively low level from the 7th day. There
were differences in ADC in the experimental group at different time
points (F=12.613; P<0.001), and there were significant
differences in ADC in the control group at different time points
(F=3.288; P=0.009). There was no significant difference between the
two groups in ADC0 and ADC1 (P>0.05). A significant difference
between ADC in the two groups was first observed on day 3 after
radiotherapy, where the experimental group showed a significantly
higher ADC than the control group (P<0.05; Table III).
| Table IIIComparison of apparent diffusion
coefficient values between experimental and control groups at
different timepoints after radiotherapy. |
Table III
Comparison of apparent diffusion
coefficient values between experimental and control groups at
different timepoints after radiotherapy.
| Day | Control group
(x10-6 mm2/sec) | Experimental group
(x10-6 mm2/sec) | P-value |
|---|
| D0 | 507.62±112.62 | 492.40±113.22 | 0.679 |
| D1 | 457.48±49.35 | 462.30±131.71 | 0.872 |
| D3 | 445.60±73.99 | 594.55±120.87 | <0.001 |
| D5 | 423.70±61.78 | 615.38±84.90 | <0.001 |
| D7 | 414.93±44.01 | 645.40±87.15 | <0.001 |
| D9 | 401.39±42.89 | 641.96±103.28 | <0.001 |
| D11 | 428.90±68.18 | 637.12±86.04 | <0.001 |
| D13 | 420.08±76.40 | 607.30±73.64 | <0.001 |
| D15 | 417.56±49.46 | 590.13±98.61 | 0.002 |
| D17 | 400.43±44.08 | 506.33±59.38 | <0.001 |
| D19 | 419.90±57.24 | 486.75±83.14 | 0.008 |
| D21 | 431.51±88.76 | 489.71±57.26 | 0.029 |
| D23 | 398.40±94.66 | 472.25±80.52 | 0.012 |
| D25 | 417.09±73.82 | 501.53±116.47 | 0.014 |
| D27 | 429.28±57.32 | 500.05±123.73 | 0.039 |
| D29 | 432.28±60.14 | 503.39±125.47 | 0.022 |
Comparison of MK before and after
radiotherapy
The MK of the experimental group began to decline on
the 1st day after treatment reaching its lowest point on the 9th
day; after which it gradually increased to the pretreatment levels
by the 17th day, where it remained stable at a slightly higher
level than before treatment. In the control group, MK began to rise
gradually on the 1st day and remained at a relatively high level on
the 17th day. There were significant differences in MK in the
experimental group at different time points (F=11.837; P<0.001),
and the control group at different time points (F=3.963; P=0.000).
There was no significant difference between MK0 and
MK1 between the two groups, and the MK of the
experimental group was lower compared with the control group
(P<0.05) from the 3rd day after radiotherapy (Table IV).
| Table IVComparison of mean kurtosis values
between experimental and control groups at different timepoints
after radiotherapy. |
Table IV
Comparison of mean kurtosis values
between experimental and control groups at different timepoints
after radiotherapy.
| Day | Control group
(x10-3) | Experimental group
(x10-3) | P-value |
|---|
| D0 | 782.71±166.49 | 799.75±171.13 | 0.757 |
| D1 | 821.02±153.29 | 712.97±181.78 | 0.058 |
| D3 | 867.54±134.18 | 640.58±165.65 | <0.001 |
| D5 | 911.27±115.73 | 628.38±182.32 | <0.001 |
| D7 | 936.58±193.56 | 621.72±92.30 | <0.001 |
| D9 | 951.49±117.93 | 602.74±114.56 | <0.001 |
| D11 | 964.10±140.67 | 613.91±129.21 | <0.001 |
| D13 | 1005.52±125.77 | 643.35±138.54 | <0.001 |
| D15 | 986.63±151.90 | 745.79±117.50 | <0.001 |
| D17 | 1022.76±135.83 | 807.09±147.13 | <0.001 |
| D19 | 955.91±143.92 | 843.19±137.63 | 0.017 |
| D21 | 1000.91±103.94 | 848.89±126.35 | <0.001 |
| D23 | 1024.61±163.18 | 854.71±190.74 | 0.006 |
| D25 | 963.46±131.69 | 827.65±189.73 | 0.017 |
| D27 | 962.62±152.73 | 832.95±182.90 | 0.025 |
| D29 | 966.81±158.50 | 821.24±180.10 | 0.012 |
Comparison of MD before and after
radiotherapy
The trend in change in MD was similar to that of the
ADC. The experimental group exhibited a small decrease in MD on the
1st day after radiotherapy which increased rapidly on the 3rd day,
peaking on the 7th day, and then gradually decreasing to a
relatively stable level on the 17th day, but lower compared with
before treatment. The MD of the control group gradually decreased
on the first day, reaching its lowest point on the 7th day, after
which it increased, but did not reach pretreatment levels. There
were differences in MD in the experimental group at different time
points (F=4.948; P<0.001), and there were significant
differences in the MD in the control group at different time points
(F=2.371; P=0.044). There was no significant difference between
MD0 and MD1 between the two groups, and the
MD of the experimental group was higher compared with the control
group (P<0.05) from the 3rd day after radiotherapy (Table V).
| Table VComparison of mean diffusivity values
between experimental and control groups at different
timepoints. |
Table V
Comparison of mean diffusivity values
between experimental and control groups at different
timepoints.
| Day | Control group
(x10-6 mm2/sec) | Experimental group
(x10-6 mm2/sec) | P-value |
|---|
| D0 | 753.21±232.37 | 753.54±227.88 | 0.996 |
| D1 | 663.96±136.91 | 739.67±197.88 | 0.191 |
| D3 | 618.95±76.17 | 837.14±196.76 | <0.001 |
| D5 | 600.52±87.40 | 912.44±182.04 | <0.001 |
| D7 | 570.78±74.43 | 995.20±235.50 | <0.001 |
| D9 | 641.01±115.88 | 958.93±226.07 | <0.001 |
| D11 | 694.86±153.79 | 922.07±149.15 | <0.001 |
| D13 | 692.80±186.12 | 944.92±158.75 | <0.001 |
| D15 | 702.47±137.78 | 918.65±143.01 | <0.001 |
| D17 | 663.11±116.75 | 853.86±150.38 | <0.001 |
| D19 | 708.50±163.64 | 819.54±128.34 | 0.021 |
| D21 | 691.72±175.65 | 796.07±101.64 | 0.043 |
| D23 | 662.61±181.83 | 780.09±131.66 | 0.023 |
| D25 | 667.06±146.94 | 789.66±196.80 | 0.040 |
| D27 | 705.00±115.20 | 827.84±210.91 | 0.040 |
| D29 | 649.42±79.02 | 822.15±223.47 | 0.002 |
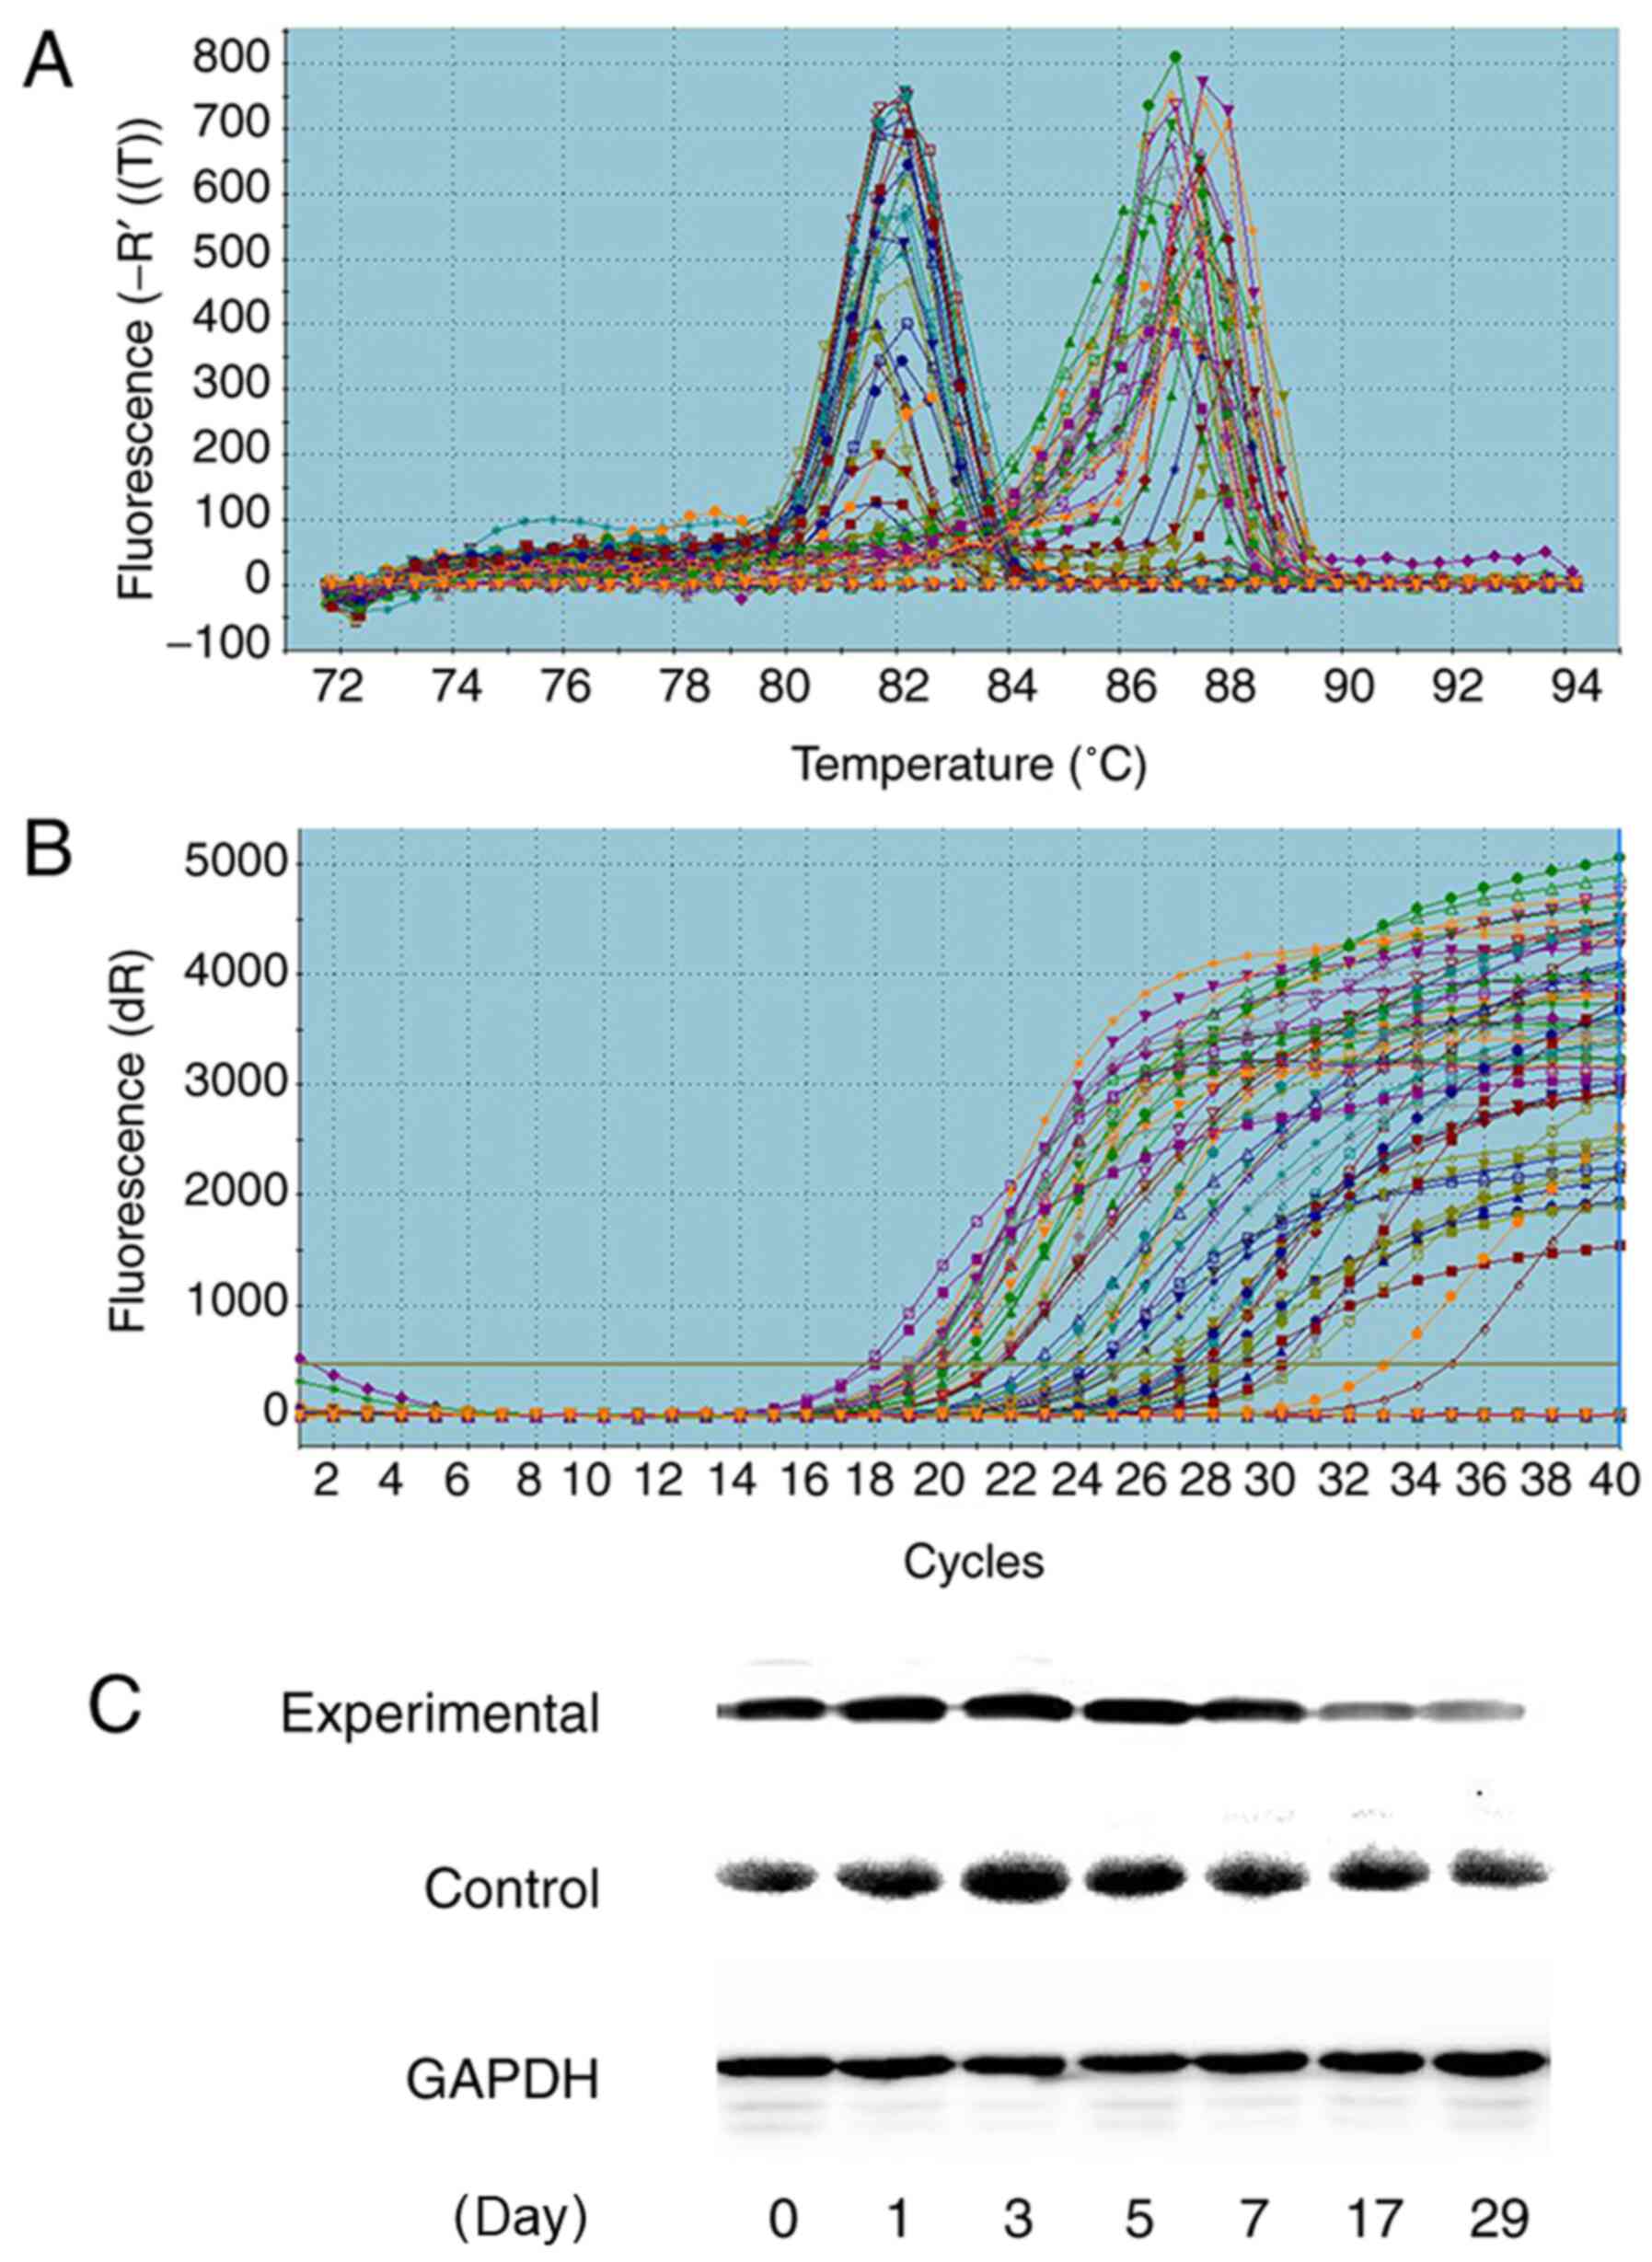
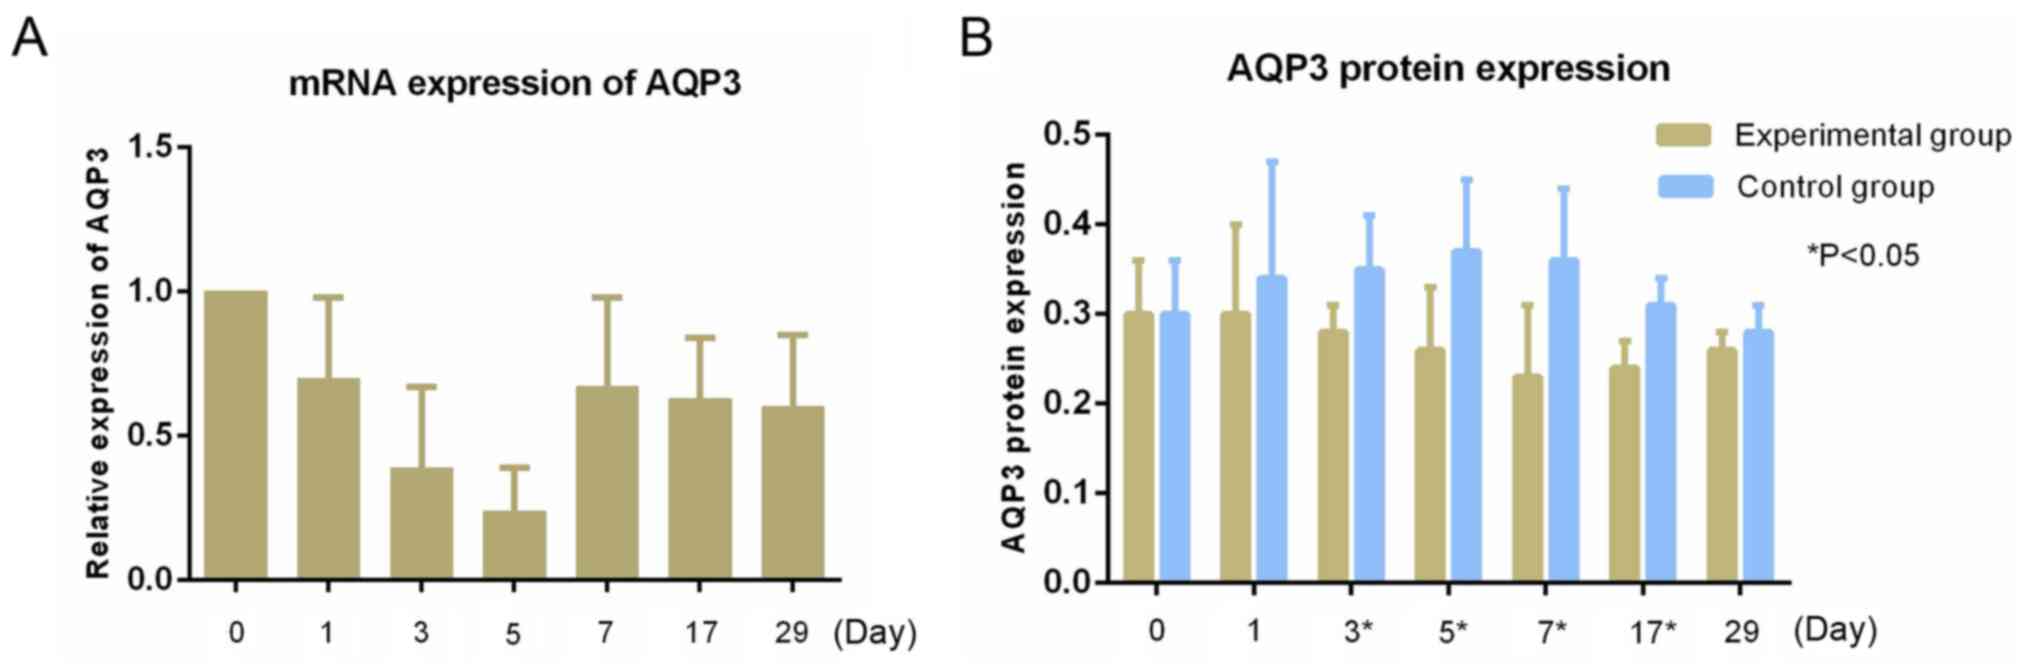
mRNA expression of AQP3 in tumors
RT-qPCR showed high expression of AQP3 mRNA in the
tumors, and no expression of the other AQPs (Figs. 3 and 4). The relative expression of AQP3 mRNA at
matched time points were 1.00±0.00, 0.70±0.28, 0.39±0.27,
0.24±0.15, 0.67±0.31, 0.63±0.21 and 0.60±0.25, respectively. The
expression of the AQP3 mRNA before radiotherapy was similar, and
the relative expression of AQP3 mRNA began to decrease on the first
day after radiotherapy, reaching its lowest point on the 5th day,
after which the expression began to increase to a stable level.
There were statistically significant differences in the relative
expression of AQP3 mRNA at different time points (F=5.114; P=0.001;
Fig. 3).
AQP3 protein expression in tumors
The relative expression of AQP3 protein between the
experimental group and control group at different time points are
shown in Table VI and Fig. 4. Western blotting showed the
relative expression of AQP3 protein in the experimental group
increased slightly on the first day after radiotherapy, and began
to decrease on the third day, reaching its lowest level on the 7th
day, after which expression gradually increased. The relative
expression of AQP3 protein in the control group began to increase
on the first day after radiotherapy, peaking on the 5th day, and
then showing a downward trend in expression. The relative
expression of the two groups of AQP3 protein showed statistically
significant differences on the 3rd (P=0.016), 5th (P=0.025), 7th
(P=0.019) and 17th (0.007) days after radiotherapy (Fig. 3 and Table VI).
| Table VIRelative expression of aquaporin 3
protein between experimental and control groups. |
Table VI
Relative expression of aquaporin 3
protein between experimental and control groups.
| Day | Experimental group
(%) | Control group
(%) | P-value |
|---|
| D0 | 0.30±0.06 | 0.30±0.06 | 0.868 |
| D1 | 0.30±0.10 | 0.34±0.13 | 0.337 |
| D3 | 0.28±0.03 | 0.35±0.06 | 0.016 |
| D5 | 0.26±0.07 | 0.37±0.08 | 0.025 |
| D7 | 0.23±0.08 | 0.36±0.08 | 0.019 |
| D17 | 0.24±0.03 | 0.31±0.03 | 0.007 |
| D29 | 0.26±0.02 | 0.28±0.03 | 0.228 |
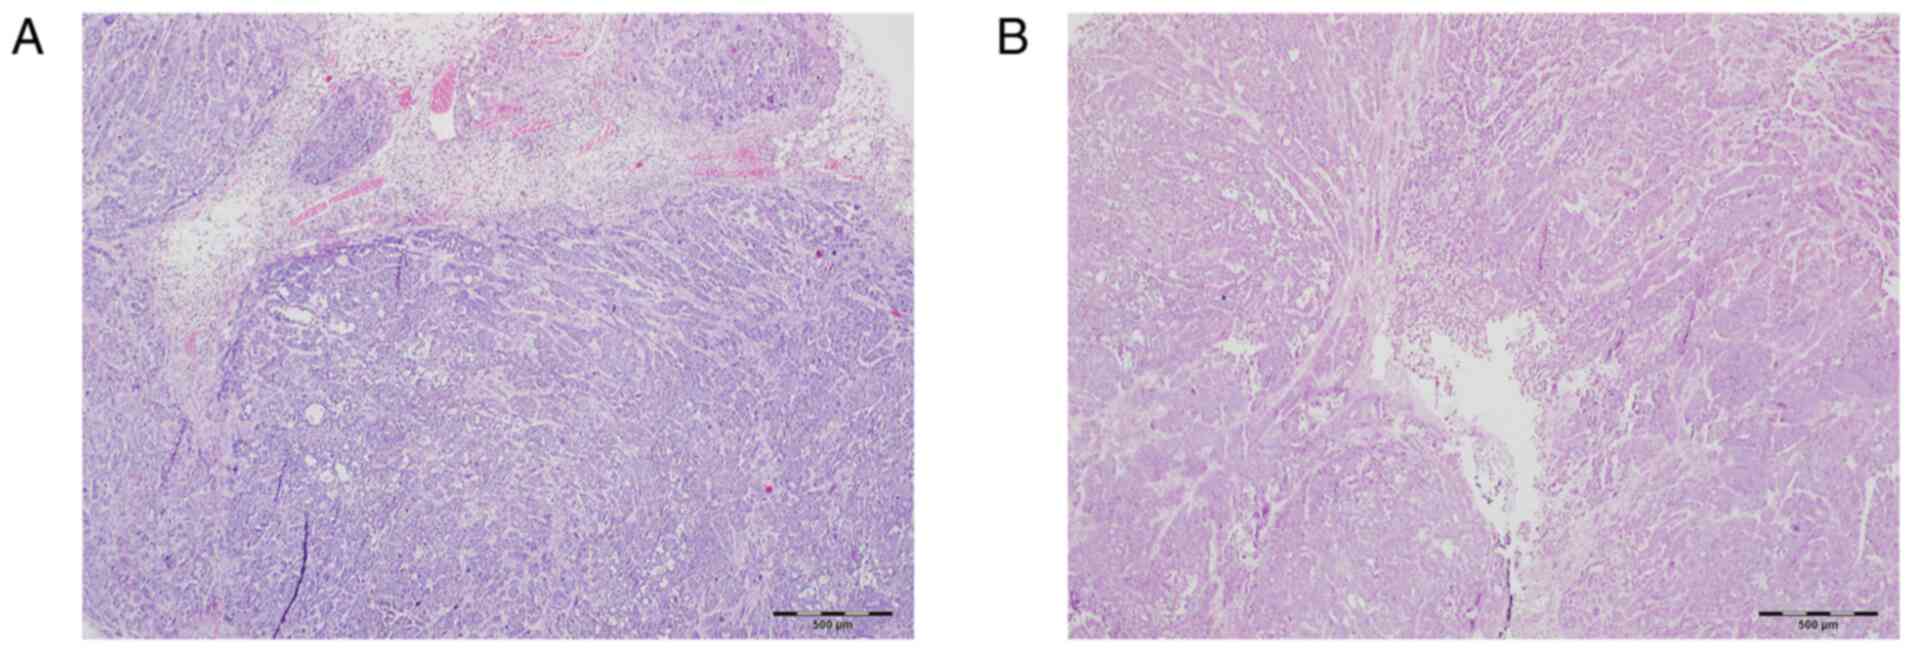
Comparison of the necrosis ratio
The results of necrosis analysis are shown in
Table VII. The rate of necrosis
in the experimental group gradually increased, but on the 7th day
began to gradually decrease. The control group showed a slightly
gradual downward trend and stabilized after the 7th day. The
proportion of necrotic tissue in the experimental group was higher
than that of the control group after the 3rd day (P<0.05;
Fig. 5).
| Table VIIComparison of necrosis ratio between
experimental and control groups. |
Table VII
Comparison of necrosis ratio between
experimental and control groups.
| Day | Experimental group
(%) | Control group
(%) | P-value |
|---|
| D0 | 30.73±4.86 | 32.86±1.36 | 0.342 |
| D1 | 31.54±4.41 | 31.95±4.78 | 0.879 |
| D3 | 32.19±1.21 | 29.16±2.16 | 0.013 |
| D5 | 38.70±9.41 | 26.85±2.50 | 0.026 |
| D7 | 53.17±2.88 | 29.16±2.16 | <0.001 |
| D17 | 47.96±4.45 | 29.49±2.17 | <0.001 |
| D29 | 44.06±2.26 | 29.49±2.03 | <0.001 |
Discussion
The ADC, as a quantitative parameter of MRDWI, has
shown advantages in evaluating treatment efficacy (23). Quantitative determination of the ADC
before, during and/or after chemotherapy and/or radiotherapy is
expected to predict treatment response and prognostic assessment
(24-28).
However, as the b value increases, the diffusion of water molecules
within the tissue shows greater deviation from the Gaussian
distribution (4,9). However, DKI is based on a non-Gaussian
distribution model (29), which may
provide more information that is also more accurate (9). In the present study, representative MK
and MD values from the animal model were selected to create a new
sensitivity index for evaluation of the efficacy of esophageal
cancer radiotherapy and provide a theoretical basis for the
clinical application of this technique.
The results showed that irradiation with a single
dose at 15 Gy did not cause death in nude mice, but it was an
effective and feasible dose for observing the change in tumor
volume. There was a significant growth delay in human esophageal
carcinoma implanted in nude mice with single high-dose
radiotherapy. The tumor size in the experimental group grew slowly,
and the volume increased at only one time point at the end of the
observations, whereas in the control group, tumors grew stably and
increased to ~8 times the initial volume. Tumor growth in the
experimental group began to slow starting from the 5th day
following radiotherapy, and there was a slight drop on the 7th day.
A possible reason for the increase in volume is tissue edema, and
another reason may be due to a secondary effect following a single
dose of radiation. Cells can perform several mitotic cycles before
death, which is defined as compensatory cell proliferation
(30). Subsequently, due to the
gradual disappearance of the compensatory proliferative effect of
tumor cells, apoptotic signaling pathways were activated by
radiotherapy, and tumor cells underwent apoptosis (30), thus tumor growth slowed down or even
shrunk. However, a single dose of 15 Gy radiotherapy was not
sufficient to kill all the tumor cells, and the tumor volume in the
experimental group continued to increase slowly due to the
proliferation of the cells that survived the treatment. In the
initial stage, following high-energy X-ray exposure, the cell
membranes of tumor tissues were damaged, and this may have led to
the dysfunction of active transmembrane transportation of water
molecules (31). However, the water
molecules from the extracellular regions could still pass through
the cell membrane via passive osmosis, thereby resulting in an
increase in the intracellular water content and cell density,
causing tumor cell edema. The cell interstitial gaps were smaller
than before radiotherapy, thus the ADC values of the experimental
group decreased on the 1st day. Therefore, high dose of radiation
may lead to the initiation of apoptosis in xenograft cells
(30). The decreased number of
tumor cells was likely the result of a lower cell density followed
by an enlargement of extracellular space. The restriction of
movement of water molecules was relatively eased prior to
treatment, and the ADC value increased gradually and reached its
peak when the tumor volume was about to decrease (on the 5th day),
indicating a substantial decrease in restriction of water diffusion
within the extracellular space, intercellular space, or both. With
the proliferation of tumors in the control group, the volume
gradually increased, and the ADC value gradually decreased. The
significant differences in the volumes of the two groups of tumors
was observed on the 7th day, whereas the differences in the ADC
values were observed on the 3rd day. Changes in the ADC values
preceded the change in morphological changes of the tumor. Thus,
the observed variation in ADC in the present study appeared to be
in line with the expected effect of successful treatment.
The ADC, MD and MK values are all related to the
diffusion of water molecules. The MD value is the average of the
degree of diffusion of the water molecules in the diffusion
gradient field, and it can reflect the overall diffusion,
independent of the direction (32).
MK is an index which measures the complexity of the organizational
structure. The more complex the imaging of the carcinoma structure,
the greater the degree of deviation of water molecules from the
Gaussian distribution, and the greater the average kurtosis value
(33,34). The degree of water molecule
diffusion is related to the complexity of the tissue structure; the
more notable the difference between tumor tissue and normal tissue
and the greater diversity of cell nucleomorphology, the richer the
interstitial blood vessels, the greater the cell density, the
smaller the extracellular gap, the more limited the diffusion of
water molecules and the more complex the structure. This will all
result in more deviation of water diffusion from Gaussian
distribution and, therefore, smaller ADC and MD values and a larger
MK value (1,2,33,34).
In the present study, the trends of the MK value were opposite to
that of the ADC and MD values. Similar results were also observed
following irradiation of nasopharyngeal carcinoma in a xenograft
model (35). Induction of MD and
reduction of MK were observed during the initial stages of fraction
irradiation in xenografts of high radio-sensitive cell-lines, which
occurred prior to morphological changes. Therefore, both MD and MK
values are valuable imaging markers for the early detection of
radio-sensitivity in a xenograft model of nasopharyngeal carcinoma.
A previous study showed that measurement of ADC and MD after
chemoradiotherapy (CRT) can reliably differentiate the pathologic
complete remission (pCR) from the non-pCR group, and both the ADC
and MD values in patients with rectal cancer increased following
neoadjuvant chemoradiation therapy, whereas the opposite trend was
seen with MK (36). The change
ratio of ADC and MD were significantly higher for the pCR patients
than for the non-pCR patients, and the MK showed relatively high
sensitivity (92.9%) and high specificity (83.3%) in comparison to
other imaging indices. The results of the present study were
consistent with the above study; tumor growth corresponded to the
ADC, MD and MK values, and the changes in indicators all occurred
prior to changes in general tumor morphology. In the present study,
the ADC value was based on the reference, which suggests that DKI
exhibits predictive value for the sensitivity of esophageal cancer
to radiotherapy during the early stages.
AQPs serve a crucial role in tumor growth and are
involved in cell migration, proliferation and angiogenesis
(37-39).
AQPs are strongly expressed in tumor cells of different origins.
Kusayama et al (40)
reported that AQP3 expression was upregulated in esophageal cancer,
and the proliferative and metastatic potential of esophageal
squamous cell carcinoma were correlated with AQP3 expression. The
correlation between the level of AQP expression in tumor cells and
the amount of tumor edema, as revealed by MRI, suggested the
involvement of AQPs in tumor edema formation (41). In the present study, AQP3 expression
in the experimental group decreased from day 3 onwards, reaching
its lowest point on day 7, and this may be associated with
radiotherapy-mediated destruction of cell membranes (31). AQP3 expression in the control group
began to increase from the 1st day, reaching its peak on the 5th
day, which indicated proliferation and invasion of the tumor
(8). AQP3 in the control group then
showed a downward trend, which may be associated with tumor
necrosis. Furthermore, studies have shown that the ADC value is
slightly negatively correlated with AQP3 expression (42-44);
however, the association between AQP3 and DKI parameters requires
further study.
In the second part of the experiments, the control
of tumor growth over time was assessed. The proportion of necrotic
cells in the tumor tissues increased following radiotherapy in the
experimental group, and this was associated with cell dissolution
and tissue necrosis caused by irradiation. However, the necrotic
ratio decreased due to tumor cell proliferation and regrouping at
the later stages. The control group showed a gradual downward trend
in necrotic ratio and tended to stabilize after the 7th day. This
may have been due to the rapid proliferation during the early
stages and stabilization of proliferation in the later stages of
tumor development. The ratio of necrotic cells was significantly
higher in the experimental group from day 3 onwards. Similar
results were obtained in other animal studies (45,46).
Zhong et al (45) found that
DKI findings can provide valuable bio-information for
nasopharyngeal carcinoma (NPC) tissue characterization. DKI imaging
might be utilized as a surrogate biomarker for the non-invasive
assessment of tumor microstructures. Zheng et al (46) suggested that Changes in MD and MK
parameters after fractional irradiation are closely related with
cellular and pathological characteristics, especially size
reduction and necrosis induction. These parameters exhibit
potential abilities of monitoring the response to fractional
irradiation in radio-sensitive NPC xenografts. Both ADC and MD
increased with persistent cell death or tumor necrosis following
treatment (47), suggesting that
these two parameters may be used to reflect the degree of necrosis
following treatment. Guo et al (48) found that MD and ADC values of
hepatocellular carcinoma in the sorafenib induction group were
significantly higher compared with the control group. MD was
significantly increased, which may be due to decreased tumor cell
density, increased intratumoral necrosis and increased
extracellular space. These values again showed positive correlation
with the histopathological necrotic fraction, and changes in the MK
values were observed before morphological changes in hepatocellular
carcinoma.
In summary, single high-dose radiotherapy can
inhibit tumor growth following radiotherapy, and the ADC, MK and MD
values of tumors following radiotherapy were preceded by the change
in tumor withdrawal before morphological changes. The pathological
comparison showed that the changes in the cell density and necrotic
ratio of tumors were in agreement with the change in the ADC, MK
and MD values. The present study used several time points to assess
the changes, allowing for increased confidence in the changes
observed. However, the motion artifacts in some images, as well as
the magnetic-sensitive artifacts, which may have occurred when the
fit of mice when wrapped in pork was poor, may have affected the
accuracy of the data to some extent. Additionally, there appears to
be a lack of consensus in b-values (49,50).
The stability and reliability of DKI requires additional research
and improvements, in addition to clinical studies to further
confirm the results of the present study. Additionally, the
association between AQP3 and DKI parameters requires further
study.
In conclusion, single large fraction doses of
radiotherapy can inhibit the growth of a xenograft. ADC, MK and MD
were altered prior to morphological changes in the tumor. The
change in AQP3 expression and necrosis ratio were associated with
DKI parameters. Thus, DKI exhibits early predictive ability for
detecting the sensitivity of radiotherapy in esophageal
carcinoma.
Acknowledgements
Thank is given to Dr Shi Qinglei (Siemens) for the
technical guidance given for this study.
Funding
Funding: This research is supported by the Public Health
Department of Hebei (grant no. 20170170).
Availability of data and materials
The datasets used and/or analyzed during the present
study are available from the corresponding author on reasonable
request.
Authors' contributions
ADZ made substantial contributions to conception and
design the study and wrote the manuscript. XHS made substantial
contributions to the acquisition of the data and analysis and
interpretation of data and involved in drafting the manuscript. YFW
and NZ performed the experiments. GFS made substantial
contributions to conception of the study, revised the draft
critically for important intellectual content and give final
approval of the version to be published and agreed to be
accountable for all aspects of the work in ensuring that questions
related to the accuracy or integrity of any part of the work are
appropriately investigated and resolved. CH made substantial
contributions to conception and design, and was responsible for
guiding experiments. All authors read and approved the final
manuscript.
Ethics approval and consent to
participate
The animal use protocol listed below has been
reviewed and approved by the Laboratory Animal Ethical Committee
Fourth Hospital Hebei Medical University (approval no. 201618) and
complied with institutional, national or international guidelines
and relevant guidelines.
Patient consent for publication
Not applicable.
Competing interests
The authors declare that they have no competing
interests.
References
|
1
|
Patterson DM, Padhani AR and Collins DJ:
Technology insight: Water diffusion MRI-a potential new biomarker
of response to cancer therapy. Nat Clin Pract Oncol. 5:220–233.
2008.PubMed/NCBI View Article : Google Scholar
|
|
2
|
Lambregts DM, Vandecaveye V, Barbaro B,
Bakers FC, Lambrecht M, Maas M, Haustermans K, Valentini V, Beets
GL and Beets-Tan RG: Diffusion-weighted MRI for selection of
complete responders after chemoradiation for locally advanced
rectal cancer: A multicenter study. Ann Surg Oncol. 18:2224–2231.
2011.PubMed/NCBI View Article : Google Scholar
|
|
3
|
Aoyagi T, Shuto K, Okazumi S, Shimada H,
Kazama T and Matsubara H: Apparent diffusion coefficient values
measured by diffusionweighted imaging predict chemoradiotherapeutic
effect for advanced esophageal cancer. Dig Surg. 28:252–257.
2011.PubMed/NCBI View Article : Google Scholar
|
|
4
|
Jensen JH and Helpern JA: MRI
quantification of non-Gaussian water diffusion by kurtosis
analysis. NMR Biomed. 23:698–710. 2010.PubMed/NCBI View
Article : Google Scholar
|
|
5
|
Sun K, Chen X, Chai W, Fei X, Fu C, Yan X,
Zhan Y, Chen K, Shen K and Yan F: Breast cancer: Diffusion kurtosis
MR imaging-diagnostic accuracy and correlation with
clinicalpathologic factors. Radiology. 277:46–55. 2015.PubMed/NCBI View Article : Google Scholar
|
|
6
|
Agre P, Sasaki S and Chrispeels MJ:
Aquaporins: A family of water channel proteins. Am J Physiol.
265(F461)1993.PubMed/NCBI View Article : Google Scholar
|
|
7
|
King LS and Agre P: Pathophysiology of the
aquaporin water channels. Annu Rev Physiol. 58:619–648.
1996.PubMed/NCBI View Article : Google Scholar
|
|
8
|
Verkman AS: More than just water channels:
Unexpected cellular roles of aquaporins. J Cell Sci. 118:3225–3232.
2005.PubMed/NCBI View Article : Google Scholar
|
|
9
|
Jensen JH, Helpern JA, Ramani A, Lu H and
Kaczynski K: Diffusional kurtosis imaging: The quantification of
non-gaussian water diffusion by means of magnetic resonance
imaging. Magn Reson Med. 53:1432–1440. 2005.PubMed/NCBI View Article : Google Scholar
|
|
10
|
Suo S, Chen X, Wu L, Zhang X, Yao Q, Fan
Y, Wang H and Xu J: Non-Gaussian water diffusion kurtosis imaging
of prostate cancer. Magn Reson Imaging. 32:421–427. 2014.PubMed/NCBI View Article : Google Scholar
|
|
11
|
Nogueira L, Brandão S, Matos E, Nunes RG,
Loureiro J, Ramos I and Ferreira HA: Application of the diffusion
kurtosis model for the study of breast lesions. Eur Radiol.
24:1197–1203. 2014.PubMed/NCBI View Article : Google Scholar
|
|
12
|
Rosenkrantz AB, Sigmund EE, Winnick A,
Niver BE, Spieler B, Morgan GR and Hajdu CH: Assessment of
hepatocellular carcinoma using apparent diffusion coefficient and
diffusion kurtosis indices: Preliminary experience in fresh liver
explants. Magn Reson Imaging. 30:1534–1540. 2012.PubMed/NCBI View Article : Google Scholar
|
|
13
|
Van Cauter S, Veraart J, Sijbers J,
Peeters RR, Himmelreich U, De Keyzer F, Van Gool SW, Van Calenbergh
F, De Vleeschouwer S, Van Hecke W and Sunaert S: Gliomas: Diffusion
kurtosis MR imaging in grading. Radiology. 263:492–501.
2012.PubMed/NCBI View Article : Google Scholar
|
|
14
|
Raab P, Hattingen E, Franz K, Zanella FE
and Lanfermann H: Cerebral gliomas: Diffusional kurtosis imaging
analysis of microstructural differences. Radiology. 254:876–881.
2010.PubMed/NCBI View Article : Google Scholar
|
|
15
|
Rosenkrantz AB, Sigmund EE, Johnson G,
Babb JS, Mussi TC, Melamed J, Taneja SS, Lee VS and Jensen JH:
Prostate cancer: Feasibility and preliminary experience of a
diffusional kurtosis model for detection and assessment of
aggressiveness of peripheral zone cancer. Radiology. 264:126–135.
2012.PubMed/NCBI View Article : Google Scholar
|
|
16
|
Fusco R, Petrillo M, Granata V, Filice S,
Sansone M, Catalano O and Petrillo A: Magnetic resonance imaging
evaluation in neoadjuvant therapy of locally advanced rectal
cancer: A systematic review. Radiol Oncol. 51:252–262.
2017.PubMed/NCBI View Article : Google Scholar
|
|
17
|
Petrillo M, Fusco R, Catalano O, Sansone
M, Avallone A, Delrio P, Pecori B, Tatangelo F and Petrillo A: MRI
for assessing response to neoadjuvant therapy in locally advanced
rectal cancer using DCE-MR and DW-MR data sets: A preliminary
report. Biomed Res Int. 2015(514740)2015.PubMed/NCBI View Article : Google Scholar
|
|
18
|
Pan J, Zang L, Zhang Y, Hong J, Yao Y, Zou
C, Zhang L and Chen Y: Early changes in apparent diffusion
coefficients predict radiosensitivity of human nasopharyngeal
carcinoma xenografts. Laryngoscope. 122:839–843. 2012.PubMed/NCBI View Article : Google Scholar
|
|
19
|
Yuan ZG, Wang ZY, Xia MY, Li FZ, Li Y,
Shen Z and Wang XZ: Comparison of diffusion kurtosis imaging versus
diffusion weighted imaging in predicting the recurrence of early
stage single nodules of hepatocellular carcinoma treated by
radiofrequency ablation. Cancer Imaging. 19(30)2019.PubMed/NCBI View Article : Google Scholar
|
|
20
|
Li T, Hong Y, Kong D and Li K: Histogram
analysis of diffusion kurtosis imaging based on whole-volume images
of breast lesions. J Magn Reson Imaging. 51:627–634.
2020.PubMed/NCBI View Article : Google Scholar
|
|
21
|
Livak KJ and Schmittgen TD: Analysis of
relative gene expression data using real-time quantitative PCR and
the 2(-Delta Delta C(T)) method. Methods. 25:402–408.
2001.PubMed/NCBI View Article : Google Scholar
|
|
22
|
Menglin N, Lan W, Chun H, Liang X, Xuejiao
R, Shutang L, Liu L and Hua T: Experimental study on radiotherapy
response of esophageal cancer xenograft models by
diffusion-weighted magnetic resonance imaging method. Chin J Radiol
Med Prot. 37:896–901. 2017.
|
|
23
|
Xie H, Sun T, Chen M, Wang H, Zhou X,
Zhang Y, Zeng H, Wang J and Fu W: Effectiveness of the apparent
diffusion coefficient for predicting the response to
chemoradiationtherapy in locally advanced rectal cancer: A
systematic review and meta-analysis. Medicine (Baltimore).
94(e517)2015.PubMed/NCBI View Article : Google Scholar
|
|
24
|
Zheng H, Ren W, Pan X, Zhang Q, Liu B, Liu
S, He J and Zhou Z: Role of intravoxel incoherent motion MRI in
early assessment of the response of esophageal squamous cell
carcinoma to chemoradiotherapy: A pilot study. J Magn Reson
Imaging. 48:349–358. 2018.PubMed/NCBI View Article : Google Scholar
|
|
25
|
Giganti F, Salerno A, Ambrosi A, Chiari D,
Orsenigo E, Esposito A, Albarello L, Mazza E, Staudacher C, Del
Maschio A and De Cobelli F: Prognostic utility of diffusion
weighted MRI in oesophageal cancer: Is apparent diffusion
coefficient a potential marker of tumour aggressiveness? Radiol
Med. 121:173–180. 2016.PubMed/NCBI View Article : Google Scholar
|
|
26
|
Liu S, Zhen F, Sun N, Chen J, Cao Y, Zhang
S, Cheng H, Ge X and Sun X: Apparent diffusion coefficient values
detected by diffusion-weighted imaging in the prognosis of patients
with locally advanced esophageal squamous cell carcinoma receiving
chemoradiation. Onco Targets Ther. 9:5791–5796. 2016.PubMed/NCBI View Article : Google Scholar
|
|
27
|
Wang L, Liu L, Han C, Liu S, Tian H, Li Z,
Ren X, Shi G, Wang Q and Wang G: The diffusion-weighted magnetic
resonance imaging (DWI) predicts the early response of esophageal
squamous cell carcinoma to concurrent chemoradiotherapy. Radiother
Oncol. 121:246–251. 2016.PubMed/NCBI View Article : Google Scholar
|
|
28
|
van Rossum PSN, van Hillegersberg R, Lever
FM, Lips IM, van Lier AL, Meijer GJ, van Leeuwen MS, van Vulpen M
and Ruurda JP: Imaging strategies in the management of oesophageal
cancer: What's the role of MRI? Eur Radiol. 23:1753–1765.
2013.PubMed/NCBI View Article : Google Scholar
|
|
29
|
Wu D, Li G, Zhang J, Chang S, Hu J and Dai
Y: Characterization of breast tumors using diffusion kurtosis
imaging (DKI). PLoS One. 9(e113240)2014.PubMed/NCBI View Article : Google Scholar
|
|
30
|
Ou G, Itasaka S, Zeng L, Shibuya K, Yi J,
Harada H and Hiraoka M: Usefulness of HIF-1 imaging for determining
optimal timing of combining bevacizumab and radiotherapy. Int J
Radiat Oncol Biol Phys. 75:463–467. 2009.PubMed/NCBI View Article : Google Scholar
|
|
31
|
Freeman A, Hetzel U, Cripps P and
Mobasheri A: Expression of the plasma membrane markers aquaporin 1
(AQP1), glucose transporter 1 (GLUT1) and Na, K-ATPase in canine
mammary glands and mammary tumours. Vet J. 185:90–93.
2010.PubMed/NCBI View Article : Google Scholar
|
|
32
|
Filli L, Wurnig M, Nanz D, Luechinger R,
Kenkel D and Boss A: Whole-body diffusion kurtosis imaging: Initial
experience on non-Gaussian diffusion in various organs. Invest
Radiol. 49:773–778. 2014.PubMed/NCBI View Article : Google Scholar
|
|
33
|
Zhu L, Pan Z, Ma Q, Yang W, Shi H, Fu C,
Yan X, Du L, Yan F and Zhang H: Diffusion kurtosis imaging study of
rectal adenocarcinoma associated with histopathologic prognostic
factors: Preliminary findings. Radiology. 284:66–76.
2017.PubMed/NCBI View Article : Google Scholar
|
|
34
|
Liu X, Zhou L, Peng W, Wang H and Zhang Y:
Comparison of stretched-exponential and monoexponential model
diffusion-Weighted imagingin prostate cancer and normal tissues. J
Magn Reson Imaging. 42:1078–1085. 2015.PubMed/NCBI View Article : Google Scholar
|
|
35
|
Zheng X, Chen Y, Xiao Y, Zheng D and Chen
W: Early diagnosis of radio-insensitive human nasopharyngeal
carcinoma xenograft models bydiffusion kurtosis imaging. Magn Reson
Imaging. 55:128–132. 2019.PubMed/NCBI View Article : Google Scholar
|
|
36
|
Hu F, Tang W, Sun Y, Wan D, Cai S, Zhang
Z, Grimm R, Yan X, Fu C, Tong T and Peng W: The value of diffusion
kurtosis imaging in assessing pathological complete response to
neoadjuvant chemoradiation therapy in rectal cancer: A comparison
with conventional diffusion-weighted imaging. Oncotarget.
8:75597–75606. 2017.PubMed/NCBI View Article : Google Scholar
|
|
37
|
Verkman AS, Hara-Chikuma M and
Papadopoulos MC: Aquaporins-new players in cancer biology. J Mol
Med (Berl). 86:523–529. 2008.PubMed/NCBI View Article : Google Scholar
|
|
38
|
Papadopoulos MC, Saadoun S and Verkman AS:
Aquaporins and cell migration. Pflugers Arch. 456:693–700.
2008.PubMed/NCBI View Article : Google Scholar
|
|
39
|
Hu J and Verkman AS: Increased migration
and metastatic potential of tumor cells expressing aquaporin water
channels. FASEB J. 20:1892–1894. 2006.PubMed/NCBI View Article : Google Scholar
|
|
40
|
Kusayama M, Wada K, Nagata M, Ishimoto S,
Takahashi H, Yoneda M, Nakajima A, Okura M, Kogo M and Kamisaki Y:
Critical role of aquaporin 3 on growth of human esophageal and oral
squamous cell carcinoma. Cancer Sci. 102:1128–1136. 2011.PubMed/NCBI View Article : Google Scholar
|
|
41
|
Nico B, Mangieri D, Tamma R, Longo V,
Annese T, Crivellato E, Pollo B, Maderna E, Ribatti D and Salmaggi
A: Aquaporin-4 contributes to the resolution of peritumoural brain
oedema in human glioblastoma multiforme after combined chemotherapy
and radiotherapy. Eur J Cancer. 45:3315–3325. 2009.PubMed/NCBI View Article : Google Scholar
|
|
42
|
Tan Y, Zhang H, Wang XC, Qin JB and Wang
L: The value of multi ultra high-b-value DWI in grading cerebral
astrocytomas and its association with aquaporin-4. Br J Radiol.
91(20170696)2018.PubMed/NCBI View Article : Google Scholar
|
|
43
|
Kong L, Lian G, Zheng W, Liu H, Zhang H
and Chen R: Effect of alcohol on diffuse axonal injury in rat
brainstem: Diffusion tensor imaging and aquaporin-4 expression
study. Biomed Res Int. 2013(798261)2013.PubMed/NCBI View Article : Google Scholar
|
|
44
|
Yao X, Derugin N, Manley GT and Verkman
AS: Reduced brain edema and infarct volume in aquaporin-4 deficient
mice after transient focal cerebral ischemia. Neurosci Lett.
584:368–372. 2015.PubMed/NCBI View Article : Google Scholar
|
|
45
|
Zhong J, Shi P, Chen Y, Huang R, Xiao Y,
Zheng X, Zheng D and Peng L: Diffusion kurtosis imaging of a human
nasopharyngeal carcinoma xenograft model: Initial experience with
pathological correlation. Magn Reson Imaging. 47:111–117.
2018.PubMed/NCBI View Article : Google Scholar
|
|
46
|
Zheng X, Chen Y, Zheng D, Xiao Y, Chen J,
Pan J and Chen W: Diffusion kurtosis imaging and tumour
microstructure for monitoring response to radiotherapy in human
nasopharyngeal carcinoma xenografts. Jpn J Clin Oncol. 50:548–555.
2020.PubMed/NCBI View Article : Google Scholar
|
|
47
|
Yang SH, Lin J, Lu F, Han ZH, Fu CX, Lv P,
Liu H and Gao DM: Evaluation of antiangiogenic and
antiproliferative effects of sorafenib by sequential histology and
intravoxel incoherent motion diffusion-weighted imaging in an
orthotopic hepatocellular carcinoma xenograft model. J Magn Reson
Imaging. 45:270–280. 2017.PubMed/NCBI View Article : Google Scholar
|
|
48
|
Guo R, Yang SH, Lu F, Han ZH, Yan X, Fu
CX, Zhao ML and Lin J: Evaluation of intratumoral heterogeneity by
using diffusion kurtosis imaging and stretched exponential
diffusion-weighted imaging in an orthotopic hepatocellular
carcinoma xenograft model. Quant Imaging Med Surg. 9:1566–1578.
2019.PubMed/NCBI View Article : Google Scholar
|
|
49
|
Zhu L, Cheng Q, Luo W, Bao L and Guo G: A
comparative study of apparent diffusion coefficient and intravoxel
incoherent motion-derivedparameters for the characterization of
common solid hepatic tumors. Acta Radiol. 56:1411–1418.
2015.PubMed/NCBI View Article : Google Scholar
|
|
50
|
Liu G, Yang Z, Li T, Yang L, Zheng X and
Cai L: Optimization of b-values in diffusion-weighted imaging for
esophageal cancer: Measuring the longitudinal length of gross tumor
volume and evaluating chemoradiotherapeutic efficacy. J Cancer Res
Ther. 13:748–755. 2017.PubMed/NCBI View Article : Google Scholar
|