Introduction
A thoracic aortic aneurysm (TAA) is a severe
condition characterized by localized dilation of the thoracic aorta
that expands >50% of its normal diameter, with an increased risk
of rupture. TAAs can eventually lead to thoracic aortic dissection
(TAD), a life-threatening condition. It is estimated that 6-8 per
100,000 individuals are affected by the disease annually, and its
incidence continues to rise worldwide (1,2).
Globally, TAA is the most common cause of death and the second most
prevalent aortic disease after atherosclerosis (3). Hypertension, atherosclerosis,
diabetes mellitus, smoking and hypercholesterolemia are considered
risk factors for TAA (4). Given
this background, the lack of effective treatment options to
prevent, treat or manage TAA is a major concern. The current
treatment strategy for TAA primarily involves surgical
interventions (5). In recent
years, advances in high-throughput OMICS technologies, including
genomics, transcriptomics, proteomics and metabolomics, have
provided novel insights into the molecular mechanisms underlying
the development and progression of TAA (2). The discovery and development of novel
and effective therapeutic interventions for the prevention and
treatment of TAA are of significant importance to public
health.
The aortic wall is comprised of an organized
architecture of different concentric layers consisting of cells and
the extracellular matrix (ECM). The ECM consists of a diverse array
of proteins, glycoproteins and proteoglycans, forming a dynamic
microenvironment that provides structural support, mechanical
strength and biochemical cues to cells (6). Notably, the ECM also functions as a
signaling platform that regulates cellular behavior, including
proliferation, migration, differentiation and apoptosis (7). Dynamic ECM remodeling plays a crucial
role in cardiovascular disease, including remodeling of cardiac
hypertrophy, atherosclerosis and plaque formation (8). Understanding the intricate
interactions within the ECM signaling pathway could potentially
provide novel strategies for treating and managing cardiovascular
diseases. Vascular smooth muscle cells (VSMCs) are the primary
cells that compose the vascular wall tissue, and maintain vascular
tension and mechanotransduction (3). Although the pathogenetic mechanisms
of TAA remain to be fully elucidated, the development of this
vascular disease is characterized by disruption of the ECM and VSMC
phenotypic switching (9). In
healthy blood vessels, most VSMCs are quiescent, contractile and
proliferate slowly; however, following certain injuries, VSMCs
change their phenotype in the presence of several injurious
stimuli, switching from a contractile to a synthetic, migrating and
proliferating phenotype (3), in a
process termed VSMC phenotypic switching. Numerous studies have
identified a strong relationship between VSMC phenotypic switching
and atherosclerosis (10-12).
The ECM contributes to providing resilience and tensile strength to
tissues through elastic and collagen fibers (13). Moreover, the ECM contributes to the
structural integrity of the vessel wall, which primarily consists
of elastin, collagen, glycoproteins and proteoglycans (6). The ECM provides tensile strength and
elasticity to vessel walls and regulates several processes,
including proliferation, migration, differentiation and adhesion of
VSMCs (3,6). An imbalance between anabolic (ECM
synthesis) and catabolic (ECM degradation) phases in the
composition of the ECM can result in the development of aortic
aneurysms (14).
Epigenetic regulation also participates in VSMC
phenotypic switching and disruption of the ECM (2). Epigenetic modification refers to a
genetic change that involves gene function or gene expression but
is unrelated to the DNA sequence (15). Numerous recent studies have shown
several epigenetic signs of TAA that are correlated with chromatin
alterations, including local DNA hypermethylation, altered histone
methylation/demethylation (16)
and histone acetylation/deacetylation balance (17). Enhancer of zeste homolog 2 (EZH2)
is a histone methyltransferase that di- and tri-methylates H3 at
lys27 (H3K27me2 and H3K27me3) to suppress gene transcription
(6,18). One study has shown that EZH2 plays
a key role in the physiology, pathology and development of the
cardiovascular system (18). It
maintains the integrity of the developing vasculature by inhibiting
the expression of Creb3l1, Fosl1, Klf5 and
Mmp9. Wang et al (19) demonstrated that EZH2 expression
increases the migration of pulmonary arterial smooth muscle cells
(SMCs) and participates in the pathogenesis of pulmonary arterial
hypertension. EZH2 enhances apoptosis in SMCs and the formation of
abdominal aortic aneurysms (20).
However, the biological effects of EZH2, as well as the association
between EZH2 and TAA, remain unclear.
The present study explored the role of EZH2 in the
occurrence of TAA and its impact on the phenotypic transformation
of VSMCs. Using RNA sequencing and qChIP, the current study sought
to identify the signaling pathways directly regulated by
Ezh2 and key target genes, further investigating the effect
of the Ezh2-target gene axis on smooth muscle cell invasion
and calcification. This study provides a valuable foundation for
further research into the molecular mechanisms of TAA, highlighting
the potential for targeted EZH2 therapy for TAA.
Materials and methods
Antibodies and reagents
The following antibodies were used at the stated
dilutions in the present study: Anti-EZH2 (1:1,000; cat. no. 5246;
Cell Signaling Technology, Inc.), anti-ITGB3 (1:1,000; cat. no.
18309-1-AP; ProteinTech Group, Inc.), anti-β-actin (1:50,000; cat.
no. 3700S; Cell Signaling Technology, Inc.), anti-GAPDH (1:100,000;
cat. no. 5174; Cell Signaling Technology, Inc.), anti-MMP2
(1:1,000; cat. no. 10373-2-AP; ProteinTech Group, Inc.), anti-MMP9
(1:1,000; cat. no. 13667S; Cell Signaling Technology, Inc.),
anti-transgelin (TAGLN; 1:1,000; cat. no. ab14106; Abcam),
anti-α-smooth muscle actin (α-SMA; 1:1,000; cat. no. 19245T; Cell
Signaling Technology, Inc.), anti-cleaved caspase 3 (1:1,000; cat.
no. 9664; Cell Signaling Technology, Inc.), anti-caspase 8
(1:1,000; cat. no. ab25901; Abcam), anti-Fas (1:1,000; cat. no.
4233; Cell Signaling Technology, Inc.) and anti-Bax (1:10,000; cat.
no. 50599-2-Ig; ProteinTech Group, Inc.).
Cell culture and transfection
The aortic VSMCs used in the present study were
derived from 4-week-old C57BL/6J wild-type littermate control mice
who are the same as those in the ‘Mouse model’ using an explant
technique (21). The method of
mice sacrifice was the same method used in the ‘Mouse model’
subsection. After the mice were anesthetized by intraperitoneal
injection of 400 mg/kg 10% chloral hydrate without peritonitis to
minimize pain and discomfort, they were euthanized by cervical
dislocation. The aorta was first separated from the arch, and the
surrounding adipose tissue was stripped as much as possible. The
media of the aorta were then dissected under a microscope and cut
into 1-2 mm sections in PBS. Subsequently, VSMCs would move out of
the finely divided media of the aorta tissue in DMEM (cat. no.
A5669401; Gibco; Thermo Fisher Scientific, Inc.) supplemented with
10% FBS (cat. no. 11965118; Gibco; Thermo Fisher Scientific, Inc.)
and 1% penicillin/streptomycin (cat. no. 1514022; Gibco; Thermo
Fisher Scientific, Inc.). All cells were maintained in a humidified
incubator with 5% CO2 at 37˚C. Transfections were
performed using Lipofectamine® RNAiMAX (Invitrogen;
Thermo Fisher Scientific, Inc.) according to the manufacturer's
protocol. Subsequently, 7-10x104 VSMCs were transfected
with 100 nM small interfering (si)RNA, and the cells were collected
immediately after transfection at 37˚C for 48 h to extract RNA and
protein.. Each experiment was performed at least three times as
biological triplicates. For RNA interference experiments, three
independent siRNA sequences were tested for each gene. The
sequences of the siRNAs used were: siEzh2-1, forward
5'-CAGCUCAAGAGGUUCAGAATT-3' and reverse
5'-UUCUGAACCUCUUGAGCUGTT-3'; siEzh2-2, forward
5'-GCACAAGUCAUCCCGUUAATT-3' and reverse
5'-UUAACGGGAUGACUUGUGCTT-3'; siEzh2-3, forward
5'-CAACACCCAACACAUAUAATT-3' and reverse
5'-UUAUAUGUGUUGGGUGUUGTT-3'; siItgb3-1, forward
5'-GCCCAUGUUUGGCUACAAATT-3' and reverse
5'-UUUGUAGCCAAACAUGGGCTT-3'; siItgb3-2, forward
5'-GCAGGCUACAGUAUGUGAUTT-3' and reverse
5'-AUCACAUACUGUAGCCUGCTT-3'; siItgb3-3, forward
5'-GCCGUGAAUUGUACCUACATT-3' and reverse
5'-UGUAGGUACAAUUCACGGCTT-3'; and negative control (non-targeting)
siRNA, forward 5'-UUCUCCGAACGUGUCACGUTT-3' and reverse
5'-ACGUGACACGUUCGGAGAATT-3'. All siRNAs were obtained from
MilliporeSigma. Three independent siRNA sequences for Ezh2 and
Itgb3 were effective. In the western blotting experiment, three
siRNAs were all selected, and in the phenotypic transformation
experiment the most efficient siRNA (siEzh2-1 and siItgb3-1) were
selected.
Reverse transcription-quantitative PCR
(RT-qPCR)
Total RNA was extracted from the patient and mouse
samples or VSMCs using TRIzol® reagent (Invitrogen;
Thermo Fisher Scientific, Inc.) according to the manufacturer's
protocol. Potential DNA contamination was removed by treating the
RNA extraction products with RNase-free DNase (Promega
Corporation). cDNA, used as the qPCR template, was generated from
mRNA using MMLV Reverse Transcriptase according to the
manufacturer's protocol (Roche Diagnostics GmbH). To amplify the
cDNA, 1 µl forward and reverse primers (5 µM each) were mixed with
5.5 µl RNase-free water, 7.5 µl 2X SYBR Green Mix buffer (Toyobo
Life Science) and 1 µl cDNA. The qPCR thermocycling conditions
were: Initial denaturation at 95˚C for 10 min, followed by 40
cycles at 95˚C for 15 sec and 60˚C for 1 min. The relative
quantification of all transcripts was detected using the RT-qPCR
PRISM ABI 7500 rapid sequence detection system (Applied Biosystems;
Thermo Fisher Scientific, Inc.). The fold changes were calculated
using the 2-IICq method (22). Mouse and human Gapdh were used as
an internal control. Determinations were independently performed at
least three times. The following primer pairs (all from Sangon
Biotech, Co., Ltd.) were used for qPCR: Gapdh, forward
5'-AGGTCGGTGTGAACGGATTTG-3' and reverse, 5'-GGGGTCGTTGATGGCAACA-3';
Ezh2, forward 5'-AGCACAAGTCATCCCGTTAAAG-3' and reverse
5'-AATTCTGTTGTAAGGGCGACC-3'; Ccnd2, forward
5'-GAGTGGGAACTGGTAGTGTTG-3' and reverse 5'-CGCACAGAGCGATGAAGGT-3';
Agtr1a, forward 5'-TTGTCCACCCGATGAAGTCTC-3' and reverse
5'-AAAAGCGCAAACAGTGATATTGG-3'; Cldn1, forward
5'-TGCCCCAGTGGAAGATTTACT-3' and reverse 5'-CTTTGCGAAACGCAGGACAT-3';
Sele, forward 5'-ATGAAGCCAGTGCATACTGTC-3' and reverse
5'-CGGTGAATGTTTCAGATTGGAGT-3'; Itga8, forward
5'-TGTCTGGCGTTCAACTTGGAT-3' and reverse
5'-TCCAGTGAGTAGCCGAAGTAG-3'; Igf1, forward
5'-CACATCATGTCGTCTTCACACC-3' and reverse
5'-GGAAGCAACACTCATCCACAATG-3'; End2, forward
5'-GCTGGATCTAACCCAAGGACA-3' and reverse 5'-GACAGCGGTTGCAGGTACTC-3';
Itgb3, forward 5'-GGCGTTGTTGTTGGAGAGTC-3' and reverse
5'-CTTCAGGTTACATCGGGGTGA-3'; Efnb2, forward,
5'-TTGCCCCAAAGTGGACTCTAA-3' and reverse 5'-GCAGCGGGGTATTCTCCTTC-3';
Tnnt2, forward 5'-CAGAGGAGGCCAACGTAGAAG-3' and reverse
5'-CTCCATCGGGGATCTTGGGT-3'; Vcan, forward
5'-TGGCCCAGAACGGAAATATCA-3' and reverse
5'-ACTAGCCCGGAGTTTGACCAT-3'; Itga2, forward
5'-TGTCTGGCGTATAATGTTGGC-3' and reverse
5'-TGCTGTACTGAATACCCAAACTG-3'; Ednrb, forward
5'-AAGCCACGCTGTCACTTCTC-3' and reverse 5'-GAGGAACGCATCAGACTGGA-3';
Fasl, forward 5'-CAGCCCATGAATTACCCATGT-3' and reverse
5'-ATTTGTGTTGTGGTCCTTCTTCT-3'; Mmp2, forward
5'-ACCTGAACACTTTCTATGGCTG-3' and reverse 5'-CTTCCGCATGGTCTCGATG-3';
Mmp9, forward 5'-GCAGAGGCATACTTGTACCG-3' and reverse
5'-TGATGTTATGATGGTCCCACTTG-3'; Acta2, forward
5'-CCCAGACATCAGGGAGTAATGG-3' and reverse
5'-TCTATCGGATACTTCAGCGTCA-3'; Tagln, forward
5'-CCAACAAGGGTCCATCCTACG-3' and reverse 5'-ATCTGGGCGGCCTACATCA-3';
Itgb7, forward 5'-ACCTGAGCTACTCAATGAAGGA-3' and reverse
5'-CACCGTTTTGTCCACGAAGG-3'; Itgb8, forward
5'-TGCATGTTGTAACGTCAAGTGA-3' and reverse
5'-GATGCTGACACATCAACCAGATA-3'; Cd44, forward
5'-TCGATTTGAATGTAACCTGCCG-3' and reverse
5'-CAGTCCGGGAGATACTGTAGC-3'; Thbs2, forward
5'-CTGGGCATAGGGCCAAGAG-3' and reverse
5'-GTCTTCCGGTTAATGTTGCTGAT-3'; Itga6, forward
5'-TGCAGAGGGCGAACAGAAC-3' and reverse 5'-CGTGCTGCCGTTTCTCATATC-3';
Itgb6, forward 5'-ATGGGGATTGAGCTGGTCTG-3' and reverse
5'-GACAGGTGGGTGAAATTCTCC-3'; Vwf, forward
5'-CTCTTTGGGGACGACTTCATC-3' and reverse
5'-TCCCGAGAATGGAGAAGGAAC-3'; and Agrn, forward
5'-GCGGTACTTGAAAGGCAAAGA-3' and reverse
5'-CTCCAAAGCCACCAATTACCA-3'; Gapdh, forward
5'-GGAGCGAGATCCCTCCAAAAT-3' and reverse
5'-GGCTGTTGTCATACTTCTCATGG-3'; Ezh2, forward
5'-AATCAGAGTACATGCGACTGAGA-3' and reverse
5'-GCTGTATCCTTCGCTGTTTCC-3'; Itgb3, forward
5'-GTGACCTGAAGGAGAATCTGC-3' and reverse
5'-CCGGAGTGCAATCCTCTGG-3'.
Western blotting
Total protein from the human aortic tissues and
VSMCs was extracted using RIPA lysis buffer (cat. no. 89901; Thermo
Fisher Scientific, Inc.) supplemented with a Protease Inhibitor
Cocktail (cat. no. HY-k0010; MedChemExpress). The Pierce™ BCA
Protein Assay Kit (Thermo Fisher Scientific, Inc.) was used to
determine protein concentrations. For western blotting, 5X loading
buffer was added to the protein sample after it had been subjected
to high-temperature denaturation at 95˚C for 10 min. Samples (20
µg/lane) were then loaded on an 8% separating gel for resolving
80-100 KDa proteins or a 10% separating gel for resolving 20-80 KDa
proteins, and samples were resolved using SDS-PAGE. Separated
proteins were then transferred to PVDF membranes (cat. no.
IPVH00010; MilliporeSigma), which were blocked in 5% non-fat milk
for 1 h at 25˚C, followed by incubation with the primary antibodies
overnight at 4˚C. The following day, membranes were washed and
incubated with horseradish peroxidase-conjugated goat anti-mouse
IgG (1:10,000; cat. no. A25012; Abbkine, Inc.) or mouse anti-rabbit
secondary antibodies (1:10,000; cat. no. A25022; Abbkine, Inc.) for
1 h at 25˚C. An Immobilon Western HRP Substrate (cat. no.
WBKLS0100; Millipore, Inc.) substrate was added, and the protein
signals were visualized using X-ray exposure in a darkroom. Western
blotting was semi-quantified using ImageJ (Java 1.8.0_345; National
Institutes of Health).
RNA-sequencing (RNA-seq) analysis
Total RNA was extracted by using TRIzol®
reagent (Invitrogen; Thermo Fisher Scientific, Inc.) according to
the manufacturer's protocol. The concentration and integrity of RNA
samples from mouse aortic SMCs treating with siRNAs against
Ezh2 and control oligonucleotides were assessed using an
Agilent 2100 RNA nano 6000 Assay Kit (Agilent Technologies, Inc.).
Sequencing libraries were generated using a VAHTS Universal V6
RNA-seq Library Prep Kit for Illumina (cat. no. NR604-01/02; Vazyme
Biotech Co., Ltd.) according to the manufacturer's protocol; index
codes were added to attribute sequences to each sample. Briefly,
mRNA was purified from total RNA (1 mg) using poly-T oligo-attached
magnetic beads. Then, fragmentation buffer was added to break the
mRNA into short fragments. First-strand cDNA synthesis was
performed using random hexamer primers and RNase H. Second-strand
cDNA synthesis was subsequently performed using nuclease-free water
buffer, dNTPs, DNA polymerase I and RNase H. The double-stranded
cDNA was purified using AMPure P beads (Agilent Technologies,
Inc.). The purified double-stranded cDNA was repaired at the end, a
tail was added and the sequence was connected to a connector, then
the fragment size was selected, and finally, the cDNA library was
obtained by PCR enrichment. These libraries were sequenced on the
Illumina sequencing platform (Illumina NovaSeq 6000 S4; Illumina,
Inc.) and 150 bp paired-end reads were generated. The RNA
concentration of the library was diluted to 10 nM. The fluorescence
qPCR instrument (Bio-Rad CFX 96, Bio-Rad Laboratories, Inc.) was
used to accurately quantify the effective concentration of the
library (library effective concentration: 100 nM), using iQ SYBRGRN
(Bio-Rad Laboratories, Inc.). The cluster generation and sequencing
were performed on a NovaSeq 6000 S4 platform, using a NovaSeq 6000
S4 Reagent kit V1.5 (Illumina, Inc.). Genes with fragments per
kilobase of exon per million fragments mapped (FPKM) values of ≤0
across all samples were excluded from the analysis. Differentially
expressed genes (DEGs) screened from VSMCs using siRNAs against
Ezh2 and control oligonucleotides were selected based on the
selection criteria of P<0.001 and fold-change >|1.5|.
Functional enrichment analysis
Gene Ontology (23,24)
enrichment of DEGs was performed using a hypergeometric test, in
which the P-values were calculated and adjusted as q-values, and
the background data were the genes in the entire genome. GO terms
with a q-value <0.05 were considered to be significantly
enriched. GO enrichment analysis can be used to determine the
biological functions of the DEGs. Kyoto Encyclopedia of Genes and
Genomes is a database containing a collection of manually drawn
pathway maps representing knowledge on the molecular interactions
and reaction networks (25). KEGG
enrichment of DEGs was performed using a hypergeometric test, in
which the P-values were adjusted using multiple comparisons as
q-values. KEGG terms with a q-value <0.05 were considered to be
significantly enriched. The Rich Factor represents the ratio of the
number of target genes to the total genes annotated in a pathway. A
greater Rich Factor indicates greater intensity. The q-value
represents the corrected P-value, ranging from 0-1; a lower q-value
indicates greater intensity. Data were analyzed using R package
clusterProfiler (version 4.1.0) (26). Gene Set Enrichment Analysis (GSEA)
was performed using the R package clusterProfiler (version 4.1.0)
(26).
ChIP, quantitative ChIP (qChIP) and
ChIP-PCR
ChIP and qChIP experiments were performed using
VSMCs. Briefly, a pre-clearance step was performed and
1x10⁷ cells were treated with 1% formaldehyde for 10 min
at 25˚C, sonicated at 4˚C every 1 sec (ultrasound 12-15 times as
one cycle and repeated for 10 cycles) and cross-linked. ChIP lysis
buffer consisted of 50 mM Tris-HCl, 5 mM EDTA and 1% SDS was added
to the cells. Then, the cells were incubated with 2-3 µg primary
antibody against rabbit IgG (control) (cat. no. Ab313801; Abcam)
and EZH2 (cat. no. 5246; Cell Signaling Technology, Inc.). For ChIP
assays, 30 µl protein G magnetic beads (Thermo Fisher Scientific,
Inc.) adding to the lysate-bound antibodies were sequentially
washed in the following buffers: 1 ml ChIP buffer I (20 mM
Tris-HCl, 1% Triton X-100, 150 mM NaCl, 2 mM EDTA, 0.1% SDS), 1 ml
ChIP buffer II (20 mM Tris-HCl, 1% Triton X-100, 500 mM NaCl, 2 mM
EDTA, 0.1% SDS), and 1 ml ChIP buffer III (20 mM Tris-HCl, 1% w/v
sodium deoxycholate, 0.25 M LiCl, 1 mM EDTA, 1% NP-40) for 5 min
per wash at 4˚C. Next, the beads were washed with TE buffer (10 mM
Tris-HCl, 1 mM EDTA) twice for 5 min at 4˚C. A total of 100 µl ChIP
elution buffer (0.1 M NaHCO3, 1% SDS) was added to each
sample for 40 min at 37˚C; this step was repeated once. Finally,
the ChIP eluent was placed in a constant temperature water bath at
65˚C for 12 h. qChIP was performed using 2X SYBR Green Mix buffer
(Toyobo Life Science). PCR amplification was performed under the
following: 94˚C for 3 min; 30 cycles of 94˚C for 30 sec, 55˚C for
40 sec, and 72˚C for 50 sec, followed by 72˚C for 5 min. After
amplification, the products were separated in a 10% agarose gel
containing 0.03% ethidium bromide and visualized using the FastGene
FAS-DIGI PRO Gel imaging system. A NucleoSpin Gel and PCR Clean-up
kit was used for DNA gel extraction according to the manufacturer's
protocol (cat. no. 740609.50; Machery-Nagel GmbH). For ChIP-PCR
assays, DNA template enrichment was performed using conventional
PCR with primers specific to the target gene promoter. The
following primer pairs were used for qChIP (Sangon Biotech, Co.,
Ltd.): Gapdh, forward 5'-TACTAGCGGTTTTACGGGCG-3' and reverse
5'-TCGAACAGGAGGAGCAGAGAGCGA-3'; Itgb3, forward
5'-CCATTGCACTGGGATTAC-3' and reverse 5'-CTAGGCTACATAACAGGAAAGT-3';
Efnb2, forward 5'-GGACTGTGCCTTCCACCTAC-3' and reverse
5'-AACCACGGCTGTGACTTCTAC-3'; Tnnt2, forward
5'-TCAGAGGCTCGTGAAGTG-3' and reverse 5'-GGGAACAGGCTTGTAACATA-3';
Vcan, forward 5'-TAACTGTTTGACCCTTTGC-3' and reverse
5'-CCCTACTCAGGCTTATCCA-3'; Itga2, forward
5'-CTTATTTCTGTCCCTTTCTCC-3' and reverse 5'-CAAGCCATAGCCCTCAAT-3';
Ednrb, forward 5'-TTTTGGTCCTTTGGGTGG-3' and reverse,
5'-TCCCGAAATCTGCTTGGT-3'; and Fasl, forward
5'-GGGAAGTGGGATGGATAG-3' and reverse 5'-GACCAAGGAGTTCGGCTA-3'.
Human aorta samples
Male patients aged 40-70 years old with TAD and
coronary heart disease, who were diagnosed and received treatment
at Jinan Central Hospital between May 2021 and July 2022, were
recruited to the present study. The basic information on patients
is listed in Appendix S1 and
Table SI. Patients were excluded
if they had other significant cardiovascular conditions, severe
comorbidities, a history of previous aortic surgery or
interventions, or known allergies, and/or were unable to provide
informed consent. Only male patients aged 40-70 years with a
clinically confirmed diagnosis that provided informed consent were
included in the present study. The experimental group consisted of
patients with TAD, who were treated with total aortic arch
artificial vessel replacement, and frozen stent elephant trunk and
mechanical aortic valve replacement. The control group consisted of
patients with coronary heart disease (but who had healthy arteries)
who received aortic arc-coronary artery bypass grafting. For
further analysis, samples were either frozen immediately and stored
at a temperature of -80˚C, or fixed overnight in 4%
paraformaldehyde at 4˚C for staining.
For hematoxylin and eosin (H&E) staining, fixed
samples were embedded in paraffin, sectioned into 4-µm slices, and
stained with hematoxylin for 5 min at 25˚C followed by staining
with eosin for 5 min at 25˚C. For elastica van Gieson (EVG)
staining, the paraffin sections were immersed successively in
Environmentally Friendly Dewaxing Transparent Liquid I (cat. no.
G1128; Wuhan Servicebio Technology Co., Ltd.) for 20 min at 25˚C,
Environmentally Friendly Dewaxing Transparent Liquid II (cat. no.
G1128; Wuhan Servicebio Technology Co., Ltd.) for 20 min at 25˚C,
anhydrous ethanol I for 5 min at 25˚C, anhydrous ethanol II for 5
min at 25˚C and 75% alcohol for 5 min at 25˚C, followed by washing
with tap water at 25˚C. The EVG dye set utilized was (cat. no.
G1042) from Wuhan Servicebio Technology Co., Ltd. EVG dye solution
A, EVG dye solution B and EVG dye solution C were mixed in a ratio
of 5:2:2 to form the EVG dye solution, prepared 2 days in advance.
The sections were immersed in the EVG dye solution for 5 min at
25˚C and then rinsed with tap water. EVG dye B was diluted twice to
5% concentration after slight differentiation, and the sections
were washed with tap water. This process was repeated under
microscopic control until the elastic fibers appeared
purplish-black, the background turned gray and nearly colorless. To
form VG dye, 9 ml of EVG dye E and 1 ml of EVG dye D were mixed.
The sections were dyed for 1-3 min at 25˚C, depending on the
tissue's elastic fiber composition. Rapid water washing ensued,
followed by three rounds of 100% anhydrous ethanol for rapid
dehydration. Xylene was used for transparency for 20 sec, repeated
twice for 5 min each (xylene exclusive, not shared with other
xylene) at 25˚C. The sections were finally sealed with neutral gum.
Light microscopy was employed for image acquisition and analysis,
revealing purplish-black elastic fibers, red collagen fibers and a
yellow background.
Immunohistochemistry staining
The sections were sequentially treated with
environmentally friendly dewaxing solution I for 10 min at 25˚C,
environmentally friendly dewaxing solution II for 10 min at 25˚C,
environmentally friendly dewaxing solution III for 10 min and
anhydrous ethanol I, II and III for 5 min at 25˚C each, followed by
distilled water at 25˚C. The slices were subjected to repair using
EDTA (pH 8.0; cat. no. G1206; Wuhan Servicebio Technology Co.,
Ltd.) in a microwave at medium heat (wattage at 400 W) for 9 min,
followed by an 8-min cooling period, and then a 7-min cycle at
medium-low heat (wattage at 300 W). After the repair process, the
slices were allowed to cool naturally. Subsequently, the glass
slides were placed in PBS (pH 7.4) and shaken on a decolorizing
shaking table for three wash cycles, each lasting 5 min at 25˚C.
The sections were then immersed in a 3% hydrogen peroxide solution
and incubated at room temperature away from light for 25 min.
Subsequently, the slides were placed in PBS (Ph 7.4) and washed
three times on a decolorizing shaking table for 5 min each at 25˚C.
To block non-specific binding, the tissue was uniformly covered
with 3% BSA (cat. no. GC305010; Wuhan Servicebio Technology Co.,
Ltd.) in the tissue chemical circle and left at room temperature
for 30 min. After gently shaking off the sealing solution, PBS and
the primary antibodies anti-SMA (1:1,000; cat. no. NB300978; Novus
Biologicals Co., Ltd.) or anti-EZH2 (1:1,000; cat. no. A11085;
ABclonal Biotech Co., Ltd.) were added to the sections, which were
then placed flat in a wet box at 4˚C for overnight incubation. The
following day, the slides were placed in PBS (pH 7.4) and washed by
shaking on the decolorizing shaker for three times, 5 min each at
25˚C. After slight drying of the sections, the tissue was covered
with the secondary antibodies HRP-labeled goat anti-rabbit IgG
(1:1,000; cat. no. GB23303; Wuhan Servicebio Technology Co., Ltd.)
or FITC-labeled donkey anti-goat IgG (1:200; cat. no. GB22404;
Wuhan Servicebio Technology Co., Ltd.), and incubated at room
temperature for 50 min. The slides were washed in PBS (pH 7.4) on
the decolorizing table for three times, 5 min each at 25˚C.
Following slight drying, freshly prepared DAB color developing
solution was added into the circle, and the color developing time
was controlled under the microscope ~30 sec at 25˚C. Positive
coloration appeared as brown and yellow, and the sections were
rinsed with tap water to terminate the color development.
Hematoxylin (cat. no. G1004; Wuhan Servicebio Technology Co., Ltd.)
re-staining was performed for ~3 min at 25˚C, followed by washing
with tap water, and hematoxylin differentiation solution (cat. no.
G1039; Wuhan Servicebio Technology Co., Ltd.) was applied for ~10
sec at 25˚C. After hematoxylin (cat. no. G1004; Wuhan Servicebio
Technology Co., Ltd.) re-staining for ~3 min at 25˚C, the sections
were washed with tap water. Subsequently, hematoxylin
differentiation solution (cat. no. G1039; Wuhan Servicebio
Technology Co., Ltd.) was applied for ~30 sec at 25˚C, followed by
rinsing with tap water. The sections were then treated with
hematoxylin return to blue solution (cat. no. G1040; Wuhan
Servicebio Technology Co., Ltd.) for ~30 sec at 25˚C and rinsed.
The slices were immersed successively in 75% alcohol for 5 min at
25˚C, 85% alcohol for 5 min at 25˚C, anhydrous ethanol for 5 min,
anhydrous ethanol for another 5 min at 25˚C, n-butanol for 5 min
and xylene for 5 min at 25˚C to undergo dehydration and achieve
transparency. After briefly drying the slices, they were taken out
of xylene and sealed with neutral gum (cat. no. WG10004160; Wuhan
Servicebio Technology Co., Ltd.). The interpretation of results was
conducted under a white light microscope (Leica Microsystems GmbH).
Immunohistochemistry staining was semi-quantified using ImageJ
(Java 1.8.0_345; National Institutes of Health).
Mouse model
A total of 12 C57BL/6J male mice 4-week-old male
mice (~20 grams each; Pengyue Experimental Animal Breeding Co., Ltd
) were divided into two groups of six mice each. The TAD model was
induced by administering β-aminopropionitrile (BAPN; 1 g/kg/day;
cat. no. A3134-25G; Sigma-Aldrich; Merck KGaA) in drinking water or
an equivalent amount of saline as control group for 4 weeks, as
previously described (27). All
mice were housed in a clean and well-ventilated cage with
appropriate bedding material, access to fresh water and food, a
controlled environment with a temperature range of 20-26˚C and
humidity maintained between 40-60%, in a specific pathogen-free
environment with a 12-h light-dark cycle. Mice were anesthetized
via intraperitoneal injection of 10% chloral hydrate (400 mg/kg),
without signs of peritonitis, pain or discomfort, and were
euthanized by cervical dislocation.
Flow cytometry
Cells were resuspended in sorting buffer [1X PBS, 3%
FBS (v/v), and 3 mM EDTA (v/v)] before analysis. VSMCs were
incubated with Annexin V-FITC and PI solutions for 20 min at 25˚C
in the dark. The samples were then subjected to flow cytometric
analysis (BD FACSverse Flow Cytometer; BD Biosciences). Subsequent
data analyses were performed using FlowJo version 9.2 (FlowJo
LLC).
EdU incorporation assay
For the EdU incorporation assay, a Click-iT™ Edu
Cell Proliferation kit was used. VSMCs cells were seeded at a
density of 3-5x10⁴ cells/well in 12-well plates with
glass slides in each well. Cells were then treated with siRNAs
which were diluted to a working concentration of 100 nM. The medium
was replaced with normal medium after 8 h, and the cells were
subsequently cultured for an additional 24 h. EdU solution Alexa
Fluor™ 488 dye (Invitrogen; Thermo Fisher Scientific, Inc.) was
added to the medium for the last 3 h of the 24 h incubation period.
Then, the cells were fixed with 4% paraformaldehyde for 30 min at
25˚C and incubated with 2 mg/ml glycine for 5 min at 25˚C to
neutralize paraformaldehyde. Cells were incubated with 1X Apollo
staining solution (Invitrogen; Thermo Fisher Scientific, Inc.) for
30 min at 25˚C in the dark after washing with PBS containing 0.5%
Triton X-100 for 10 min. Next, the cells were washed again with
0.5% Triton X-100 PBS solution and incubated with 1X Hoechst 33342
for 30 min at room temperature in the dark. Finally, the cells were
washed three times with PBS. Fluorescent images of the cells were
obtained using a fluorescence microscope (Leica Microsystems
GmbH).
Cell invasion assay
Transwell chamber filters (MilliporeSigma) were
coated with Matrigel (Becton, Dickinson and Company) at 37˚C for 2
h and used for cell invasion assays. Subsequently, Ezh2 knockdown
cells were resuspended in serum-free medium and pipetted into the
upper chamber of the 8.0 µm pore size Transwell system
(3x10⁴ cells/0.5 ml serum-free medium). The lower
chamber was filled with 500 µl medium supplemented with 10% FBS and
incubated for 18-24 h at 37˚C. Next, cotton swabs were used to
remove the cells that had not invaded, followed by staining of the
membrane with crystal violet for 30 min at 25˚C. The images were
captured and the number of cells that had invaded was counted. Each
membrane was divided into three visual fields and the cells were
counted using a light microscope.
Wound healing assay
Ezh2 knockdown cells and the respective negative
control cells were seeded in 6-well dishes and grown to 80%
confluence. A linear wound was introduced using a 200-µl pipette
tip to scratch along the sub-confluent cell monolayer, and the
debris were washed away with PBS. The cells were subsequently
incubated in DMEM without FBS. Images were captured 0 and 24 h
after scratching, and wound closure was semi-quantified using
ImageJ (Java 1.8.0_345; National Institutes of Health). Images were
captured using a light microscope. For the wound healing assay,
three repeats were performed.
In vitro VSMC calcification
VSMC calcification was induced in osteogenic media
containing 0.25 mM L-ascorbic acid and 10 mM β-glycerophosphate
(Sigma-Aldrich; Merck KGaA) with H2O2 (0.4
mM) for 3 weeks. Calcification was determined by Alizarin Red
staining (cat. no. G1450; Beijing Solarbio Science & Technology
Co., Ltd.) according to the manufacturer's protocol.
Statistical analysis
Data are presented as the mean ± SD of three
independent experiments unless otherwise indicated. Statistical
comparisons were performed using a two-tailed unpaired Student's
t-test or a one-way ANOVA for normally distributed variables.
F-testing was used to test homogeneity of variance. If equal
variance was not assumed, unpaired t-tests with Welch' s correction
or Welch ANOVA tests were used. Differences among non-normally
distributed variables were analyzed using the Mann-Whitney U-test
or Kruskal-Wallis H-test. Statistical analyses were performed using
GraphPad Prism version 8.0 (Dotmatics). P<0.05 was considered to
indicate a statistically significant difference.
Results
EZH2 expression is upregulated in
patients with TAD
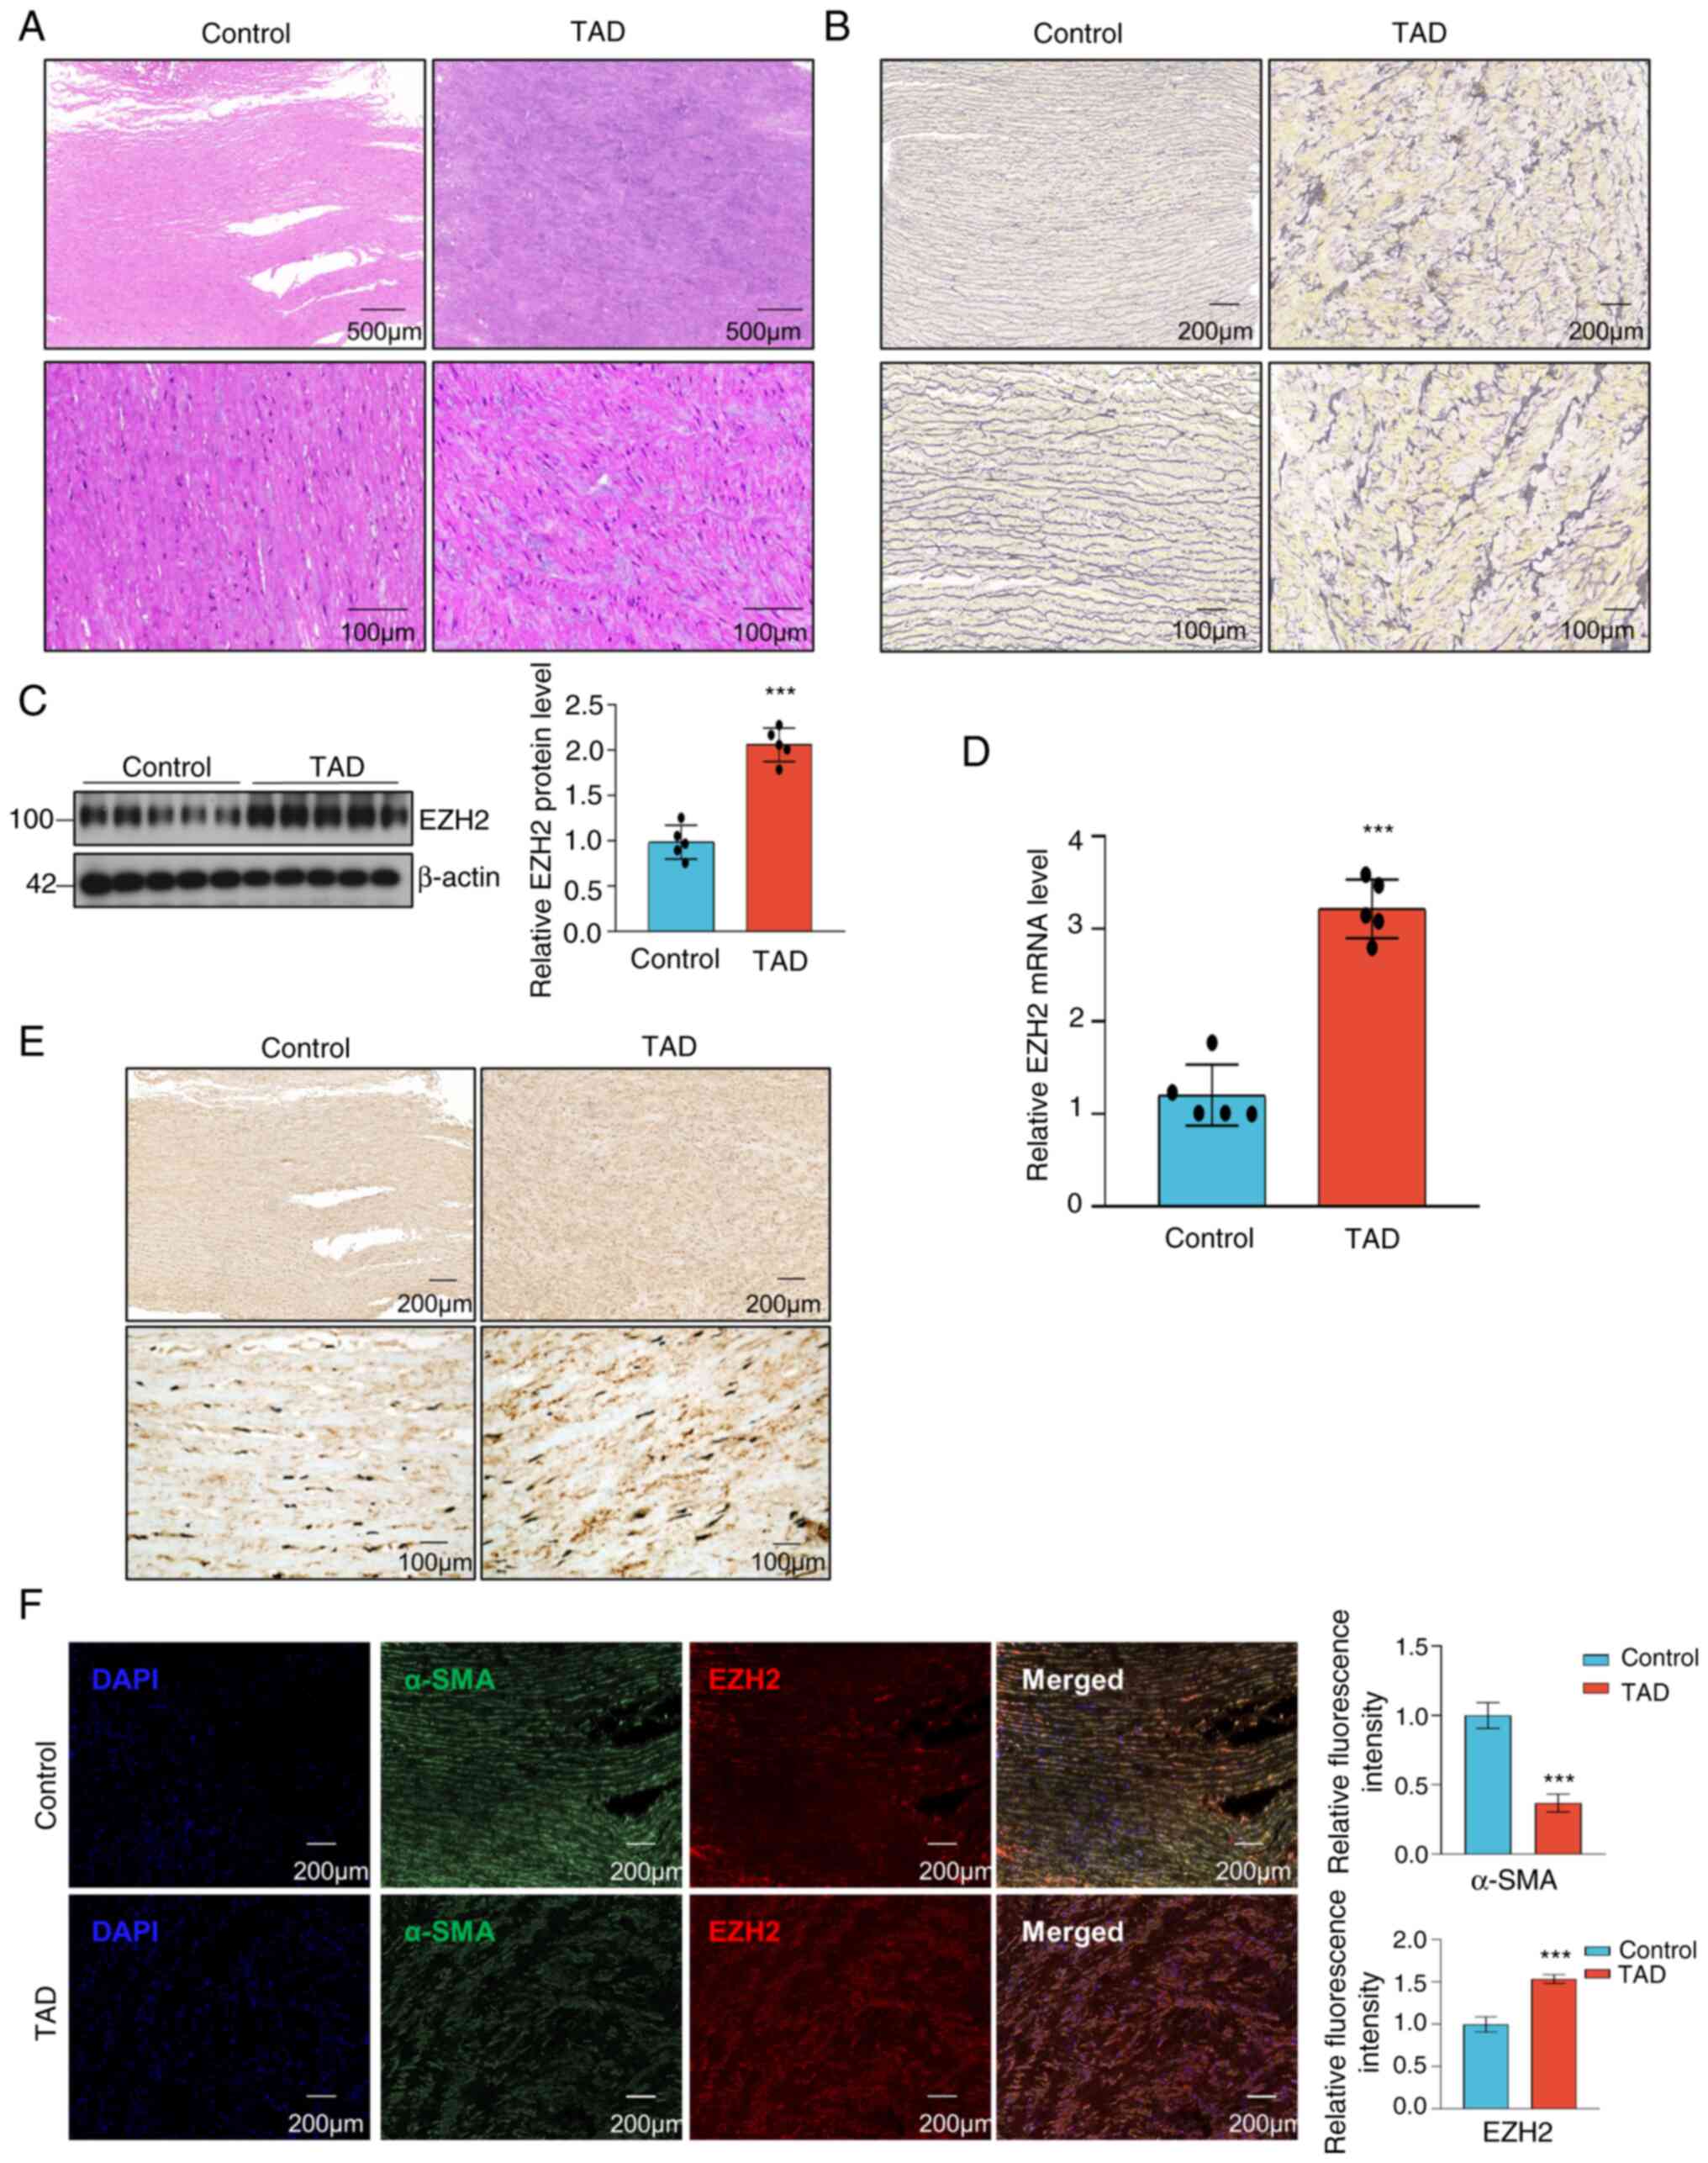
To determine the potential involvement of EZH2 in
the regulation of TAA progression, aortic wall specimens were
collected from patients with TAD alongside control group consisted
of patients with coronary heart disease at Jinan Central Hospital.
H&E staining and elastica van Gieson (EVG) staining were used
to visualize disordered and excessive proliferation of SMCs, which
are hallmarks of TAD development (Fig.
1A and B). Western blotting
and RT-qPCR were used to evaluate EZH2 expression in the aortic
walls of patients with TAD, and they both showed that EZH2
expression was increased in the aortic samples of patients with TAD
compared with the control samples (Fig. 1C and D). The immunohistochemistry and
immunofluorescence staining for EZH2 showed a statistically
significant increase in EZH2 expression in the aortic media of
patients with TAD (Fig. 1E and
F). Immunofluorescence analysis
revealed that α-SMA protein was highly expressed in control group
(Fig. 1F). These data suggested
that EZH2 may be involved in TAD development.
Ezh2 expression is increased in the
mouse model of TAA
To further confirm the association between EZH2
expression and TAA, a well-established experimental arterial
aneurysm mouse model that was generated from wild-type C57BL/6J
mice administered BAPN (1 g/kg/day) in drinking water for 4 weeks
or an equivalent amount of saline (control) was used (27). Given the anatomical changes,
establishment of the model was considered successful (Fig. 2A). Consistently, H&E and EVG
staining revealed that elastin breakage was markedly increased in
TAA mice and the VSMCs were disorganized (Fig. 2B and C). Western blotting and RT-qPCR analyses
showed that Ezh2 expression was increased in the aortic tissues of
TAA mice when compared with control mice (Fig. 2D and E). Moreover, increased Ezh2 expression
was detected in the aorta of TAA mice compared with in the control
aorta (Fig. 2F). As observed by
immunostaining, the experimental mice showed a significant increase
in the positive expression of Ezh2 and minimal expression of α-Sma
in aortic tissues compared with the control mice (Fig. 2G). These results demonstrated that
Ezh2 plays an essential role in the development of TAA in mice.
Similarly, the expression of Ezh2 was higher in the aortic media of
TAA mice, which is consistent with the findings in patients with
TAD.
Ezh2 knockdown influences VSMC
phenotypic switching
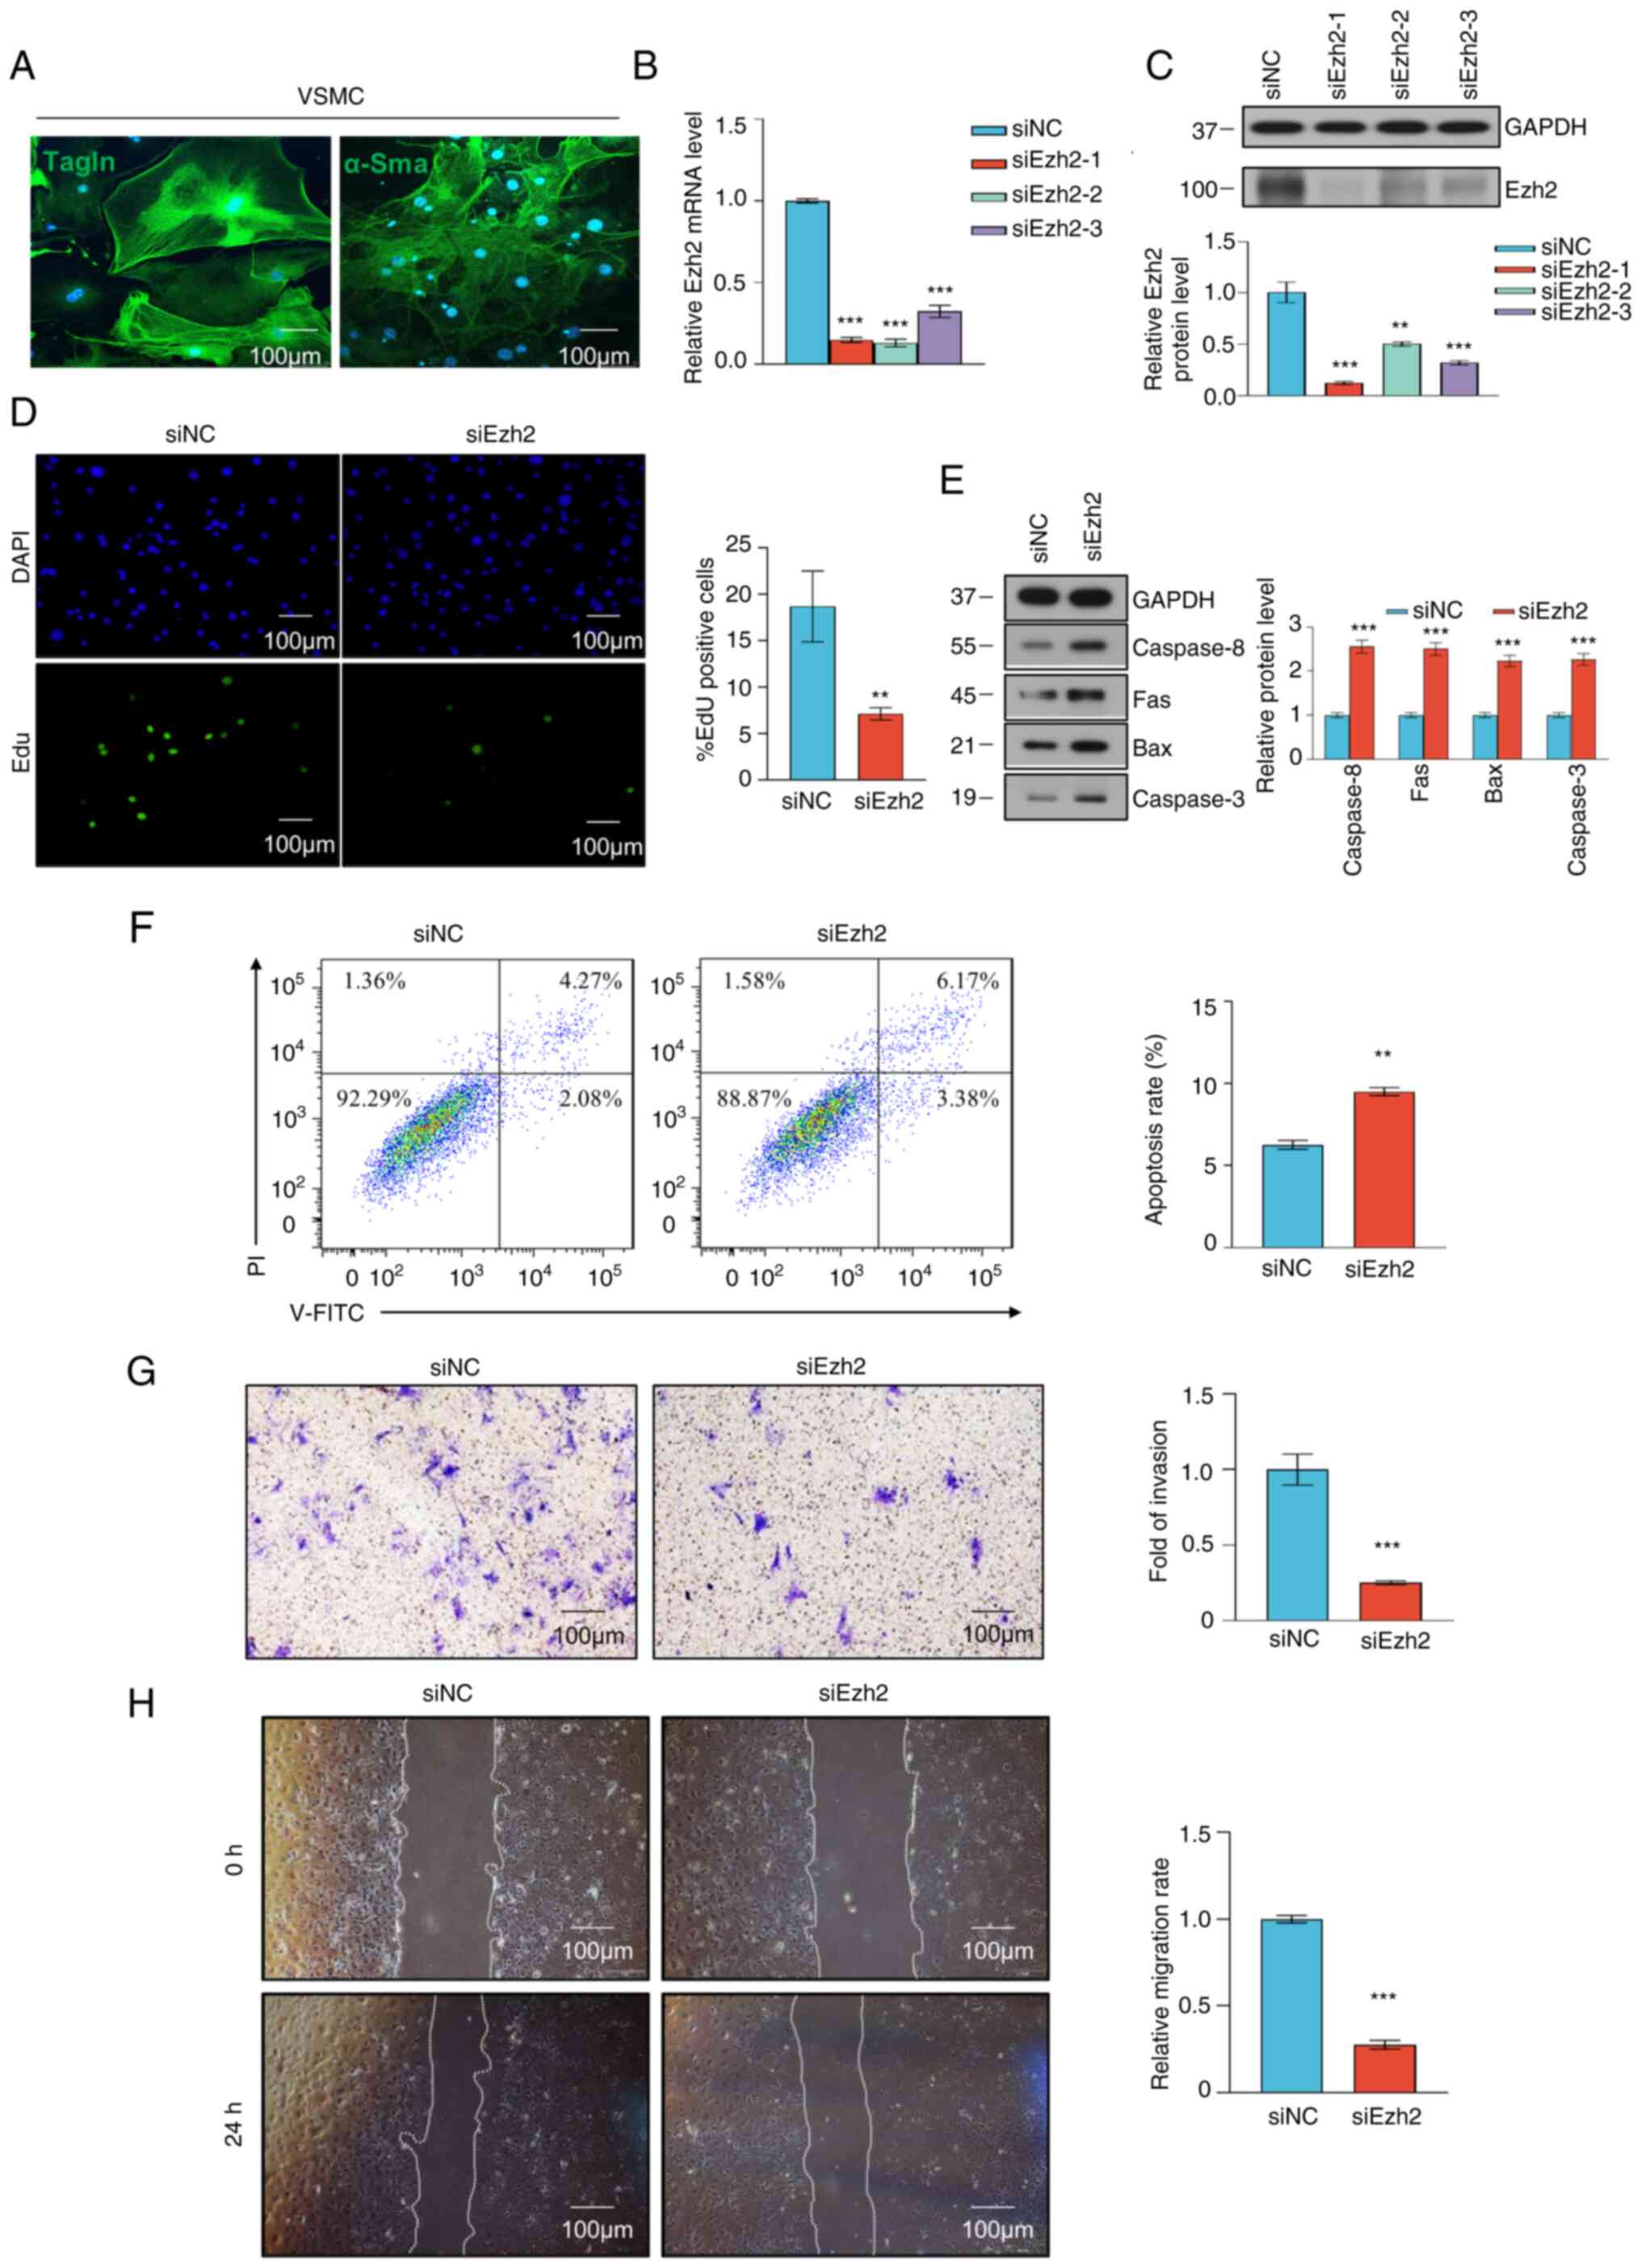
To determine the role of Ezh2 in VSMCs, a siRNA
against Ezh2 was used to target Ezh2 expression. VSMCs were
successfully isolated and cultured, which was confirmed by
immunofluorescence staining for α-SMA and TAGLN (Fig. 3A). Whether Ezh2 regulated VSMC
proliferation and apoptosis was next assessed. The knockdown
efficiency of Ezh2 was verified at the RNA and protein level
(Fig. 3B and C). An EdU incorporation assay was
performed to assess cell proliferation, and fewer EdU-positive
cells were detected in the Ezh2 knockdown group compared with in
the negative control group (Fig.
3D). Furthermore, to explore the effect of Ezh2 on VSMC
apoptosis, western blot analyses were used to detect the expression
levels of apoptosis-related proteins. The knockdown of Ezh2 led to
a significant increase in the expression levels of the
apoptosis-related proteins caspase 8, Fas, Bax and caspase 3
(Fig. 3E). In addition, VSMC
apoptosis was analyzed through flow cytometry. The results showed a
difference in the early and late apoptotic periods between the
control and siRNA-mediated knockdown groups; notably, Ezh2
knockdown increased apoptosis (Fig.
3F). These results suggested that Ezh2 increases the capacity
of VSMCs to proliferate and reduced VSMC apoptosis.
 | Figure 3VSMC proliferation and migration were
inhibited by Ezh2 knockdown. VSMCs were transfected with siNC or
siEzh2. (A) Representative immunofluorescence staining of
differentiation markers, Tagln and α-Sma in VSMCs. (B) Knockdown
efficiency of Ezh2 was verified using reverse
transcription-quantitative PCR. (C) Knockdown efficiency of Ezh2
was verified using western blotting. Gapdh was used as the internal
control. Histogram showing the relative Ezh2 protein expression
levels. (B and C) Data were analyzed using one-way ANOVA. (D) EdU
proliferation assay analysis of the effect of Ezh2 on the
proliferation of VSMCs. Cells exhibiting green fluorescence were in
the S phase of mitosis. EdU proliferation assay was performed 24 h
after transfection with siEzh2 and siNC. Scale bar, 100 µm). (E)
Western blot analysis of apoptosis-related proteins in VSMCs 48 h
post-transfection. Gapdh served as an internal reference. The
histograms show the relative expression levels of apoptosis-related
proteins in VSMCs at 48 h post-transfection. (F) Cells were stained
with Annexin V-FITC and PI. Flow cytometry dot plots showing the
percentage of stained cells. Histogram showing the percentage of
Annexin V+/PI- and Annexin
V+/PI+ of siNC-transfected and
siEzh2-transfected VSMCs. (G) VSMC invasion was assessed using a
Transwell assay of siNC-transfected and siEzh2-transfected VSMCs.
Cells that had invaded were stained with crystal violet. Scale bar,
100 µm. Histogram showing the percentage of invading VSMCs. (H)
Representative images of wound closure obtained 0 and 24 h after
wounding in siNC-transfected and siEzh2-transfected VSMCs. Scale
bar, 100 µm. Histogram showing the percentage of migrating cells in
each group. (D-H) Data were analyzed using two-tailed unpaired
Student's t-test. Data are presented as the mean ± SD of three
independent experiments. **P<0.01,
***P<0.001 versus siNC groups. VSMC, vascular smooth
muscle cell; EZH2, enhancer of zeste homolog 2; si, small
interfering; NC, negative control; α-Sma, α-smooth muscle actin;
Tagln, transgelin. |
As VSMC proliferation is often associated with
migration and phenotypic switching, the effects of Ezh2 on VSMC
migration and phenotype were assessed to determine if Ezh2 was
associated with VSMC phenotypic switching. The Transwell invasion
model was used to assess the impact of Ezh2 on VSMC invasion. The
results indicated that compared with in the control group, Ezh2
knockdown markedly reduced VSMC invasion (Fig. 3G). Furthermore, in the wound
healing assays, the siEzh2 cells exhibited slower wound closure
compared with the control group (P<0.001; Fig. 3H). Therefore, these results
demonstrated that Ezh2 positively regulates VSMC invasion and
migration.
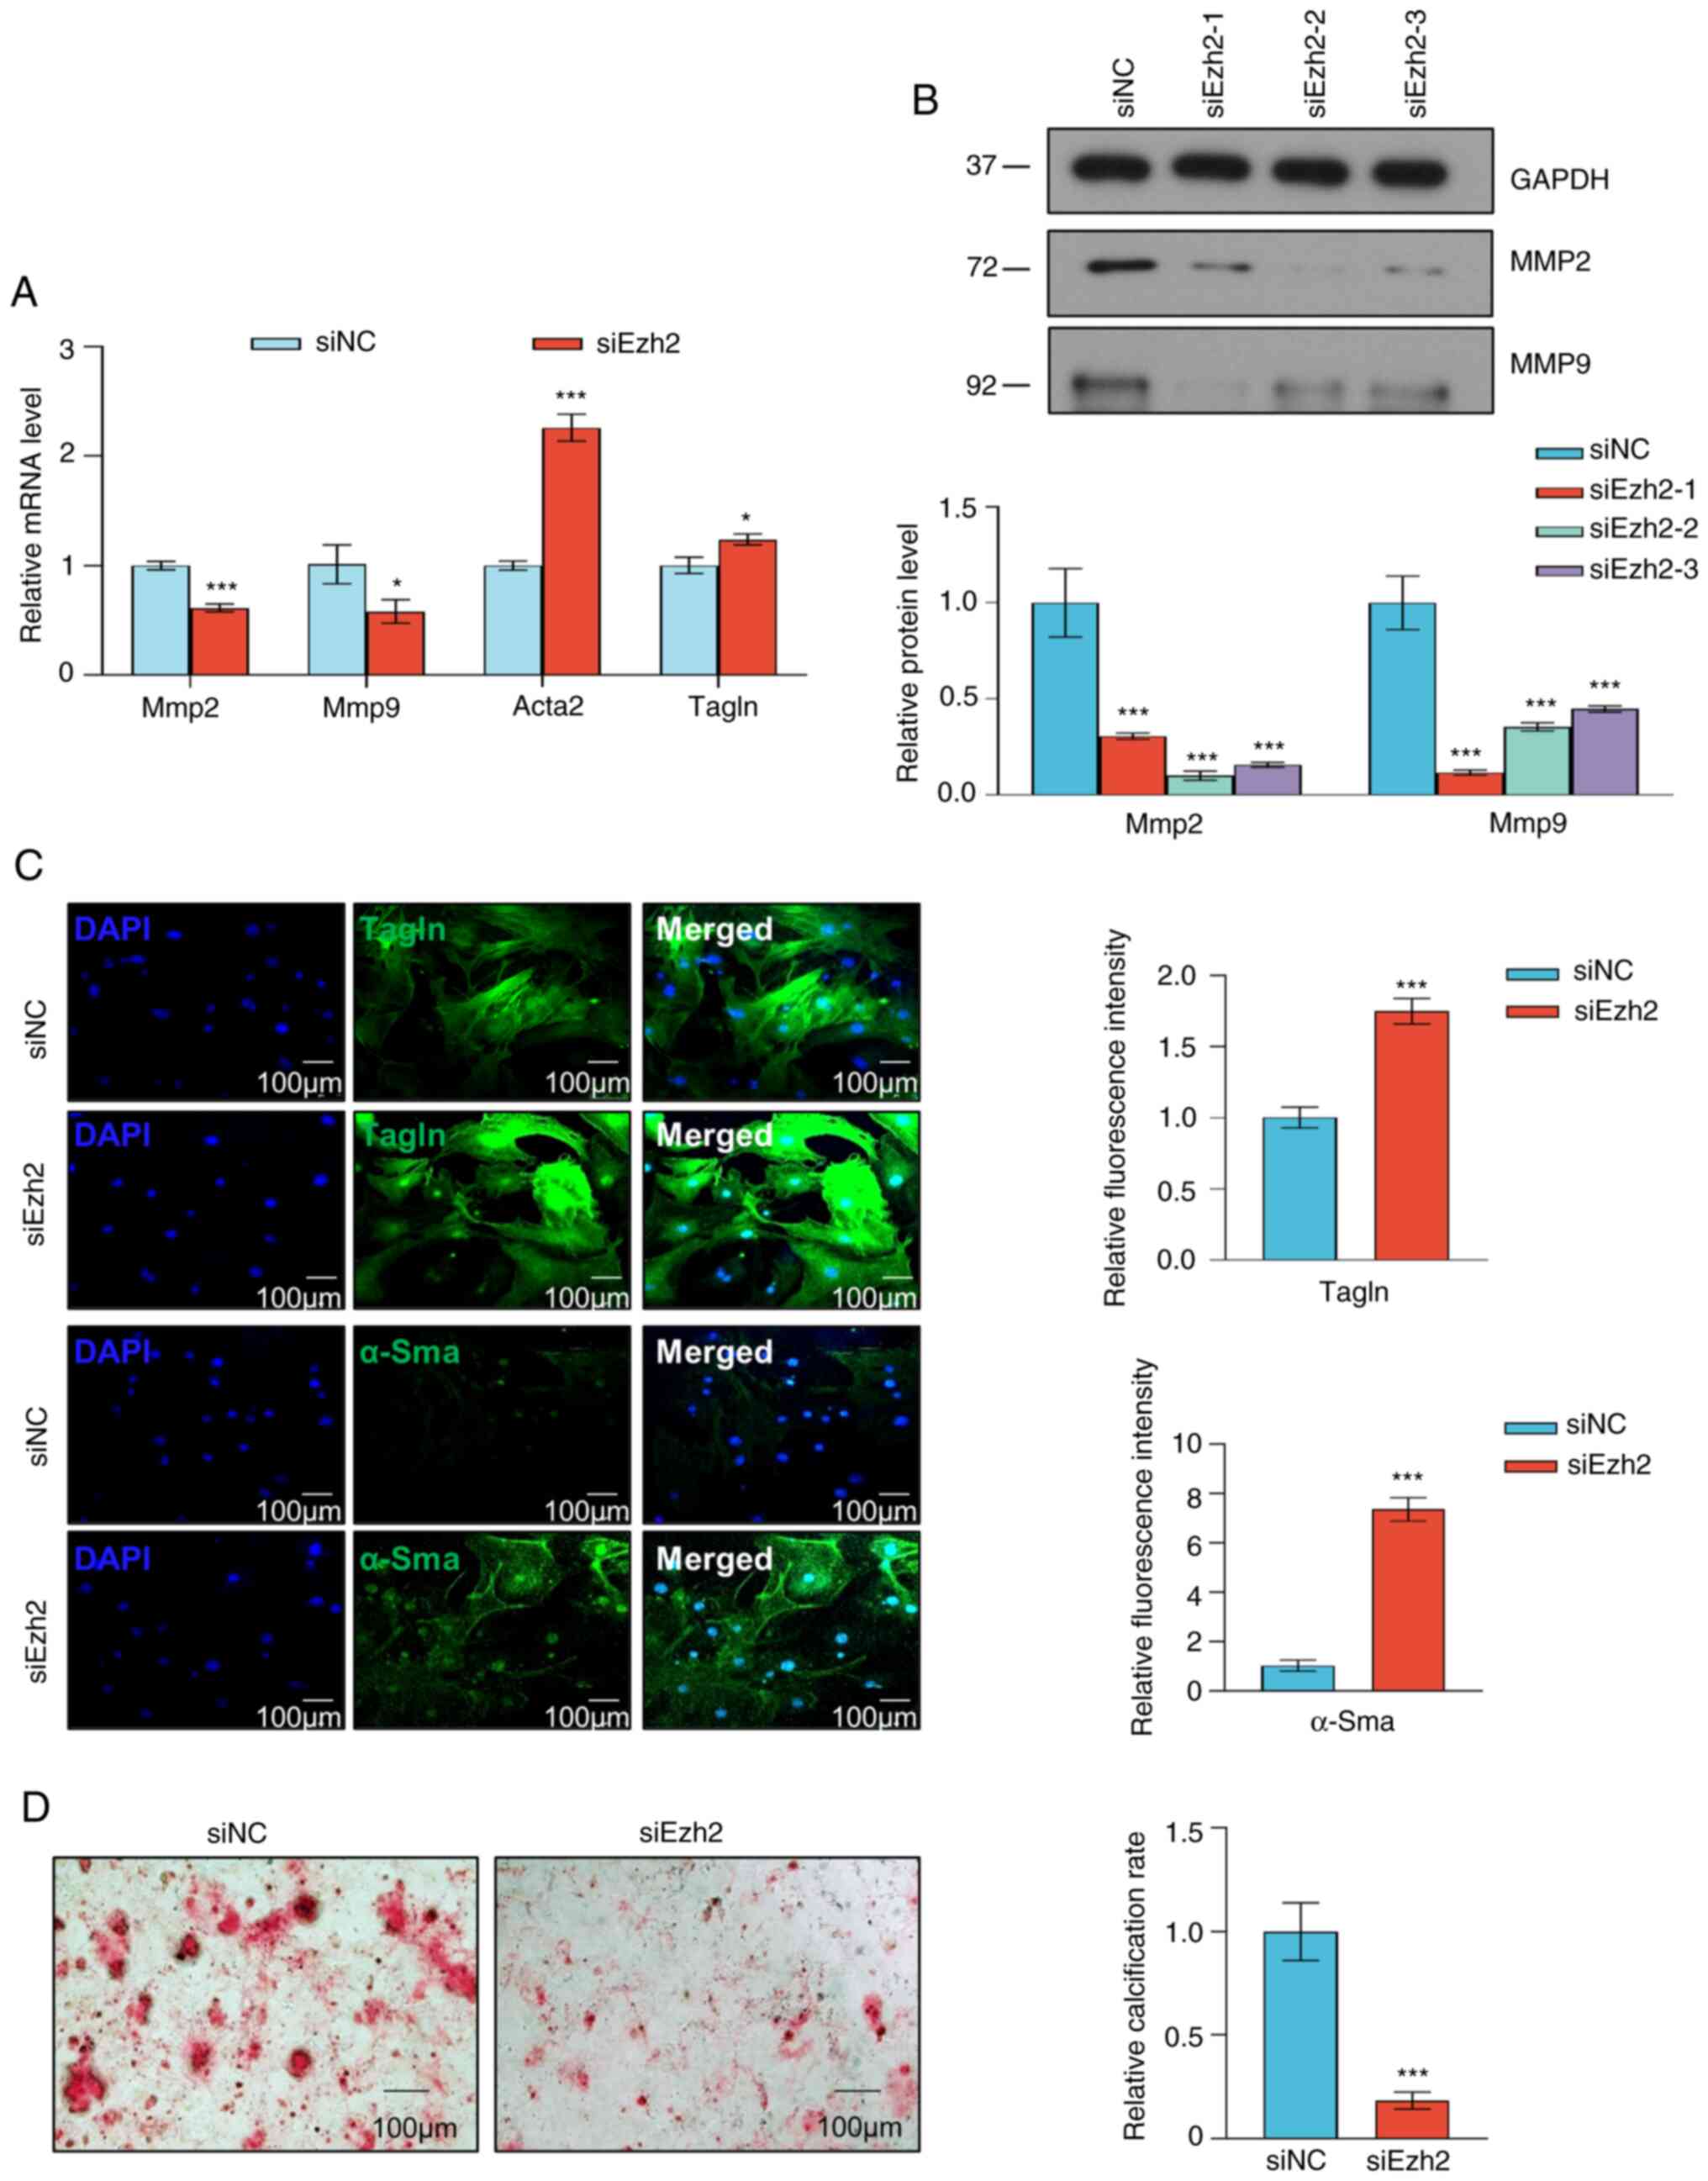
The phenotypic transition of VSMCs is characterized
by decreased expression of contractile markers, a key event
contributing to VSMC proliferation and migration (14). Thus, the effect of Ezh2 on
phenotypic VSMC switching was assessed. Knockdown of Ezh2 resulted
in increased expression of contractile RNA markers, including
Acta2 (gene of α-SMA) and Tagln; however, the
expression of synthetic RNA markers, including Mmp2 and
Mmp9, was decreased (Fig.
4A). Western blot analysis showed that Ezh2 knockdown
decreased the expression of the synthetic proteins MMP2 and MMP9 in
the aortic tissues of TAA mice when compared with the control mice
(Fig. 4B). The immunofluorescence
assay also showed that the expression of both α-SMA and TAGLN was
significantly increased in VSMCs with Ezh2 expression
knockdown (Fig. 4C). Ezh2
knockdown inhibited the calcification of VSMCs treated with the
calcification medium (Fig. 4D).
According to these data, Ezh2 directly promoted a proliferative and
synthetic VSMC phenotype.
Genome-wide identification of EZH2
transcription targets
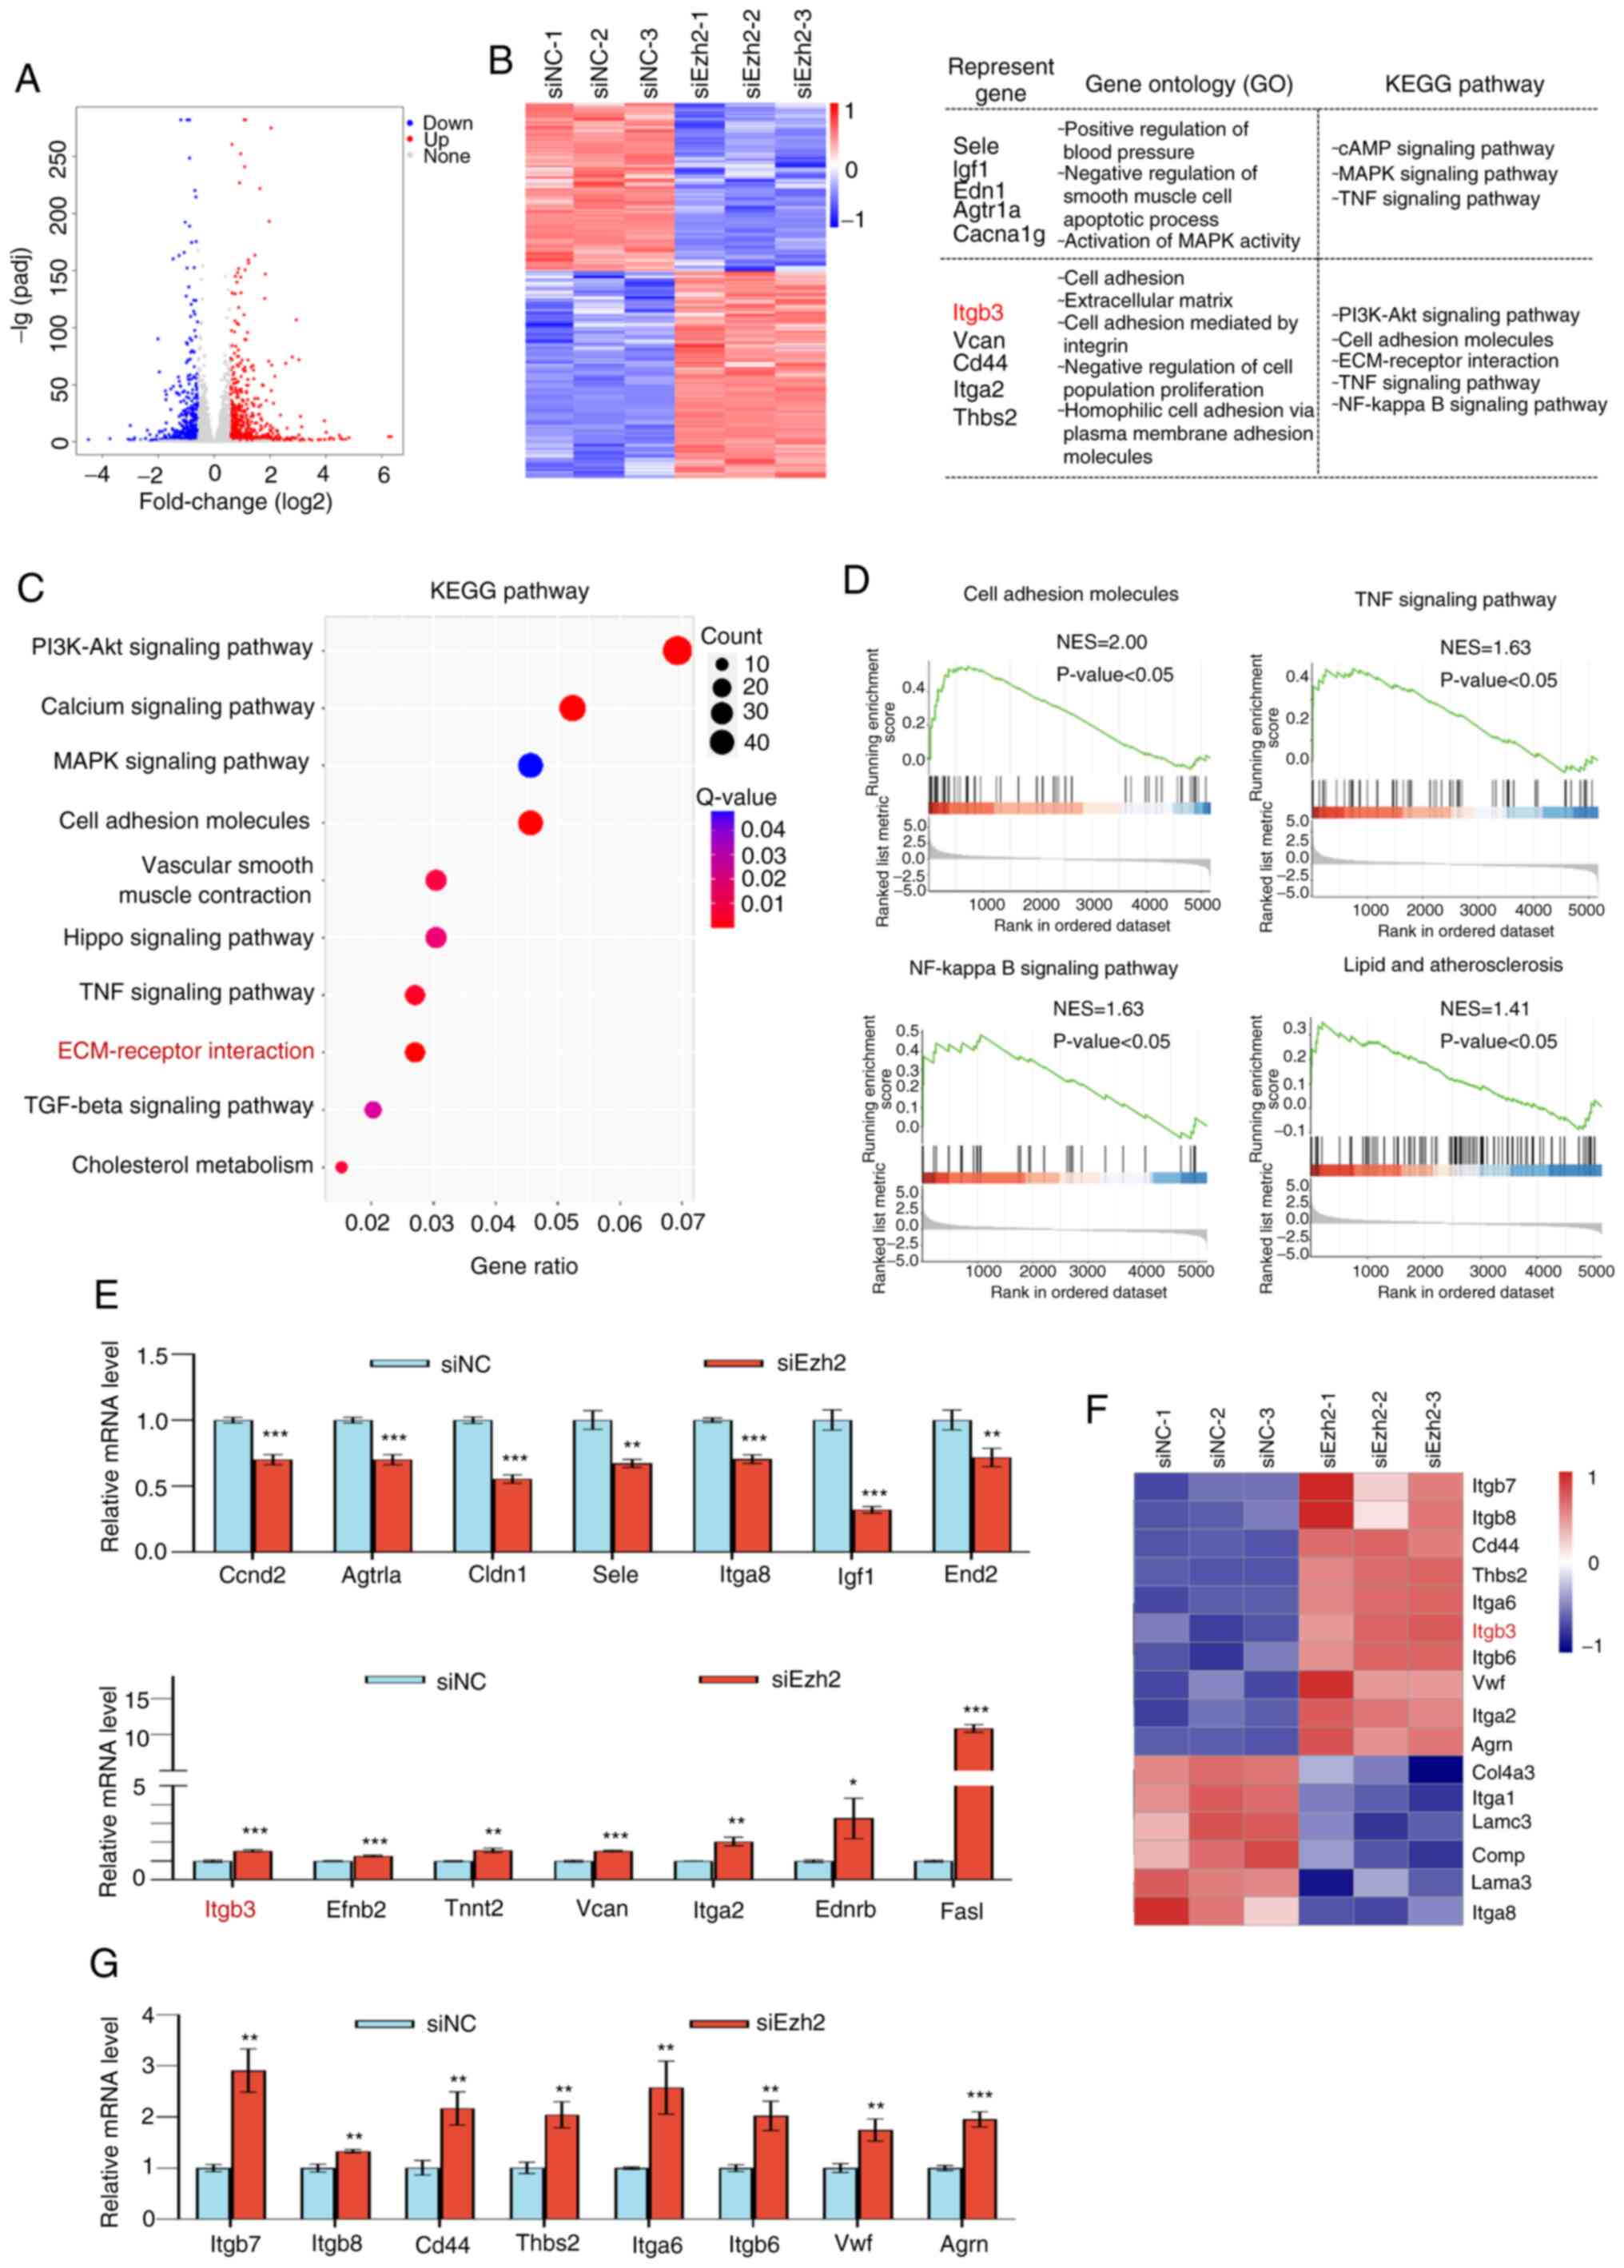
To determine how Ezh2 regulates TAA development,
RNA-seq experiments were performed on mouse aortic SMCs using
siRNAs against Ezh2 and control oligonucleotides. Compared with the
control group, 758 upregulated genes and 614 downregulated genes
were identified in the Ezh2 knockdown cells (Fig. 5A). GO analysis of the DEGs revealed
that the dysregulated genes were involved in vital biological
processes. Downregulated genes were enriched in pathways involving
the ‘PI3K-Akt signaling pathway’, ‘MAPK signaling pathway’ and ‘TNF
signaling pathway’ and included Sele, Igf1,
Edn1, Agtr1a and Gacna1g, whereas upregulated
genes were enriched in pathways that regulate cell adhesion
molecules and ECM-receptor interaction, including Itgb3,
Vcan, Cd44, Itga2 and Thbs2 (Fig. 5B). Based on the KEGG enriched
pathways, the top 10 key biological processes were identified
(Fig. 5C). To further investigate
the biological significance of EZH2, Gene Set Enrichment Analysis
(GSEA) was performed on differentially expressed EZH2 target genes
and found a strong enrichment of the targets of cell adhesion
molecule pathways. EZH2 is a key factor in the regulation of the
ECM in TAD. GSEA results suggested that EZH2 may participate in the
degradation of cell adhesion molecules, TNF and NF-κB signaling
pathways, as well as lipids and atherosclerosis (Fig. 5D). Seven representative down or
upregulated genes were further quantified by RT-qPCR using VSMCs to
validate the RNA-seq results, which were enriched in several signal
pathways related to VSMC functions (Fig. 5E). Considering that ECM is crucial
for the phenotypic switching of VSMCs, it was found, using RNA-seq
analysis, that EZH2 knockdown could indeed upregulate the
expression of several well-known ECM markers, including
Itgb7, Itgb8, Cd44, Thbs2,
Itga6, Itgb3, Itgb6 and Agrn (Fig. 5F). Subsequently, the upregulated
DEGs in the ECM signal pathway were verified by RT-qPCR (Fig. 5G). In conclusion, based on these
results, it was hypothesized that the epigenetic silencing of EZH2
is a key factor involved in ECM-receptor interactions.
 | Figure 5Genome-wide transcriptional target
analysis for Ezh2. (A) Genomic distribution of Ezh2 targets based
on RNA-seq analysis. (B) Heatmap of the differentially expressed
genes (fold change >1.5; P<0.001) in control (siNC) and Ezh2
knockdown (siEzh2-1, siEzh2-2 and siEzh2-3) VSMCs. Red, upregulated
genes; blue, downregulated genes. Results of the GO and KEGG
pathway analyses of the differentially expressed genes. (C) A
bubble chart of the top 10 enriched KEGG pathways. The Rich Factor
represents the ratio of the number of target genes to the total
genes annotated in a pathway. A greater Rich Factor indicates
greater intensity. The q-value represents the corrected P-value,
ranging from 0-1; a lower q-value indicates greater intensity. (D)
Gene Set Enrichment Analysis plot of cell adhesion molecules, TNF
signaling pathway, NF-κB signaling pathway, and lipid and
atherosclerosis. (E) Verification of RNA-seq results using RT-qPCR
analysis of selected genes in VSMCs. Results are expressed as the
fold-change relative to the control. Gapdh was used as the negative
control. (F) Heatmap of the differentially enriched ECM-receptor
interaction pathway genes (fold change >1.5; P<0.001) in the
control and Ezh2 knockdown (siEzh2-1, siEzh2-2 and siEzh2-3) VSMCs.
Red, upregulated genes; blue, downregulated genes. (G) Verification
of differentially expressed genes in the ECM signaling pathway
using RT-qPCR in VSMCs. Results are expressed as the fold-change
relative to Gapdh. Data are presented as the mean ± SD of three
independent experiments and were analyzed using two-tailed unpaired
Student's t-test. *P<0.05, **P<0.01,
***P<0.001 vs. siNC. EZH2, enhancer of zeste homolog
2; si, small interfering: NC, negative control; GO, Gene Ontology;
KEGG, Kyoto Encyclopedia of Genes and Genome; ECM, extracellular
matrix; NES, normalized enrichment score; RT-qPCR, reverse
transcription-quantitative PCR. |
Ezh2 regulates Itgb3 and participates
in VSMC invasion and calcification
To further determine whether the target gene
transcription was directly mediated by Ezh2 or not, the Ezh2
transcriptional targets were determined. qChIP assays using
specific antibodies against Ezh2 showed strong binding to regions
of Itgb3, but not to Itga2, Vcan,
Tnnt2, Efnb2, Fasl and Ednrb (Fig. 6A). To verify this result, ChIP-PCR
was used and it was found that Ezh2 bound to the promoter of the
target gene Itgb3 (Fig.
6B). The knockdown efficiency of Itgb3 was verified at
the RNA and protein levels (Fig.
6C and D). Each of the Ezh2
siRNAs led to a significant increase in the expression of Itgb3 at
both the transcriptional (Fig. 6E)
and protein levels (Fig. 6F). As
previously stated, EZH2 plays an important role in VSMC
calcification and invasion. Next, the role of Itgb3 in VSMCs was
assessed. As determined using Transwell assays, Ezh2
knockdown in VSMCs decreased cell invasion, which was partially
rescued by Itgb3 co-knockdown, indicating that Ezh2 could
promote VSMC invasion through the suppression of Itgb3 (Fig. 6G). In parallel, compared with the
control cells, knockdown of Itgb3 resulted in the partial rescue of
the VSMC calcification ability that was decreased by Ezh2 knockdown
(Fig. 6H). RT-qPCR and western
blotting showed that Itgb3 expression was decreased in the aortic
samples of patients with TAD (P<0.001; Fig. 6K and L) and the aortic tissues of TAA mice
(P<0.001; Fig. 6M and N). These results suggested that Itgb3 may
be a direct target of Ezh2 that plays a role in regulating VSMC
invasion and calcification.
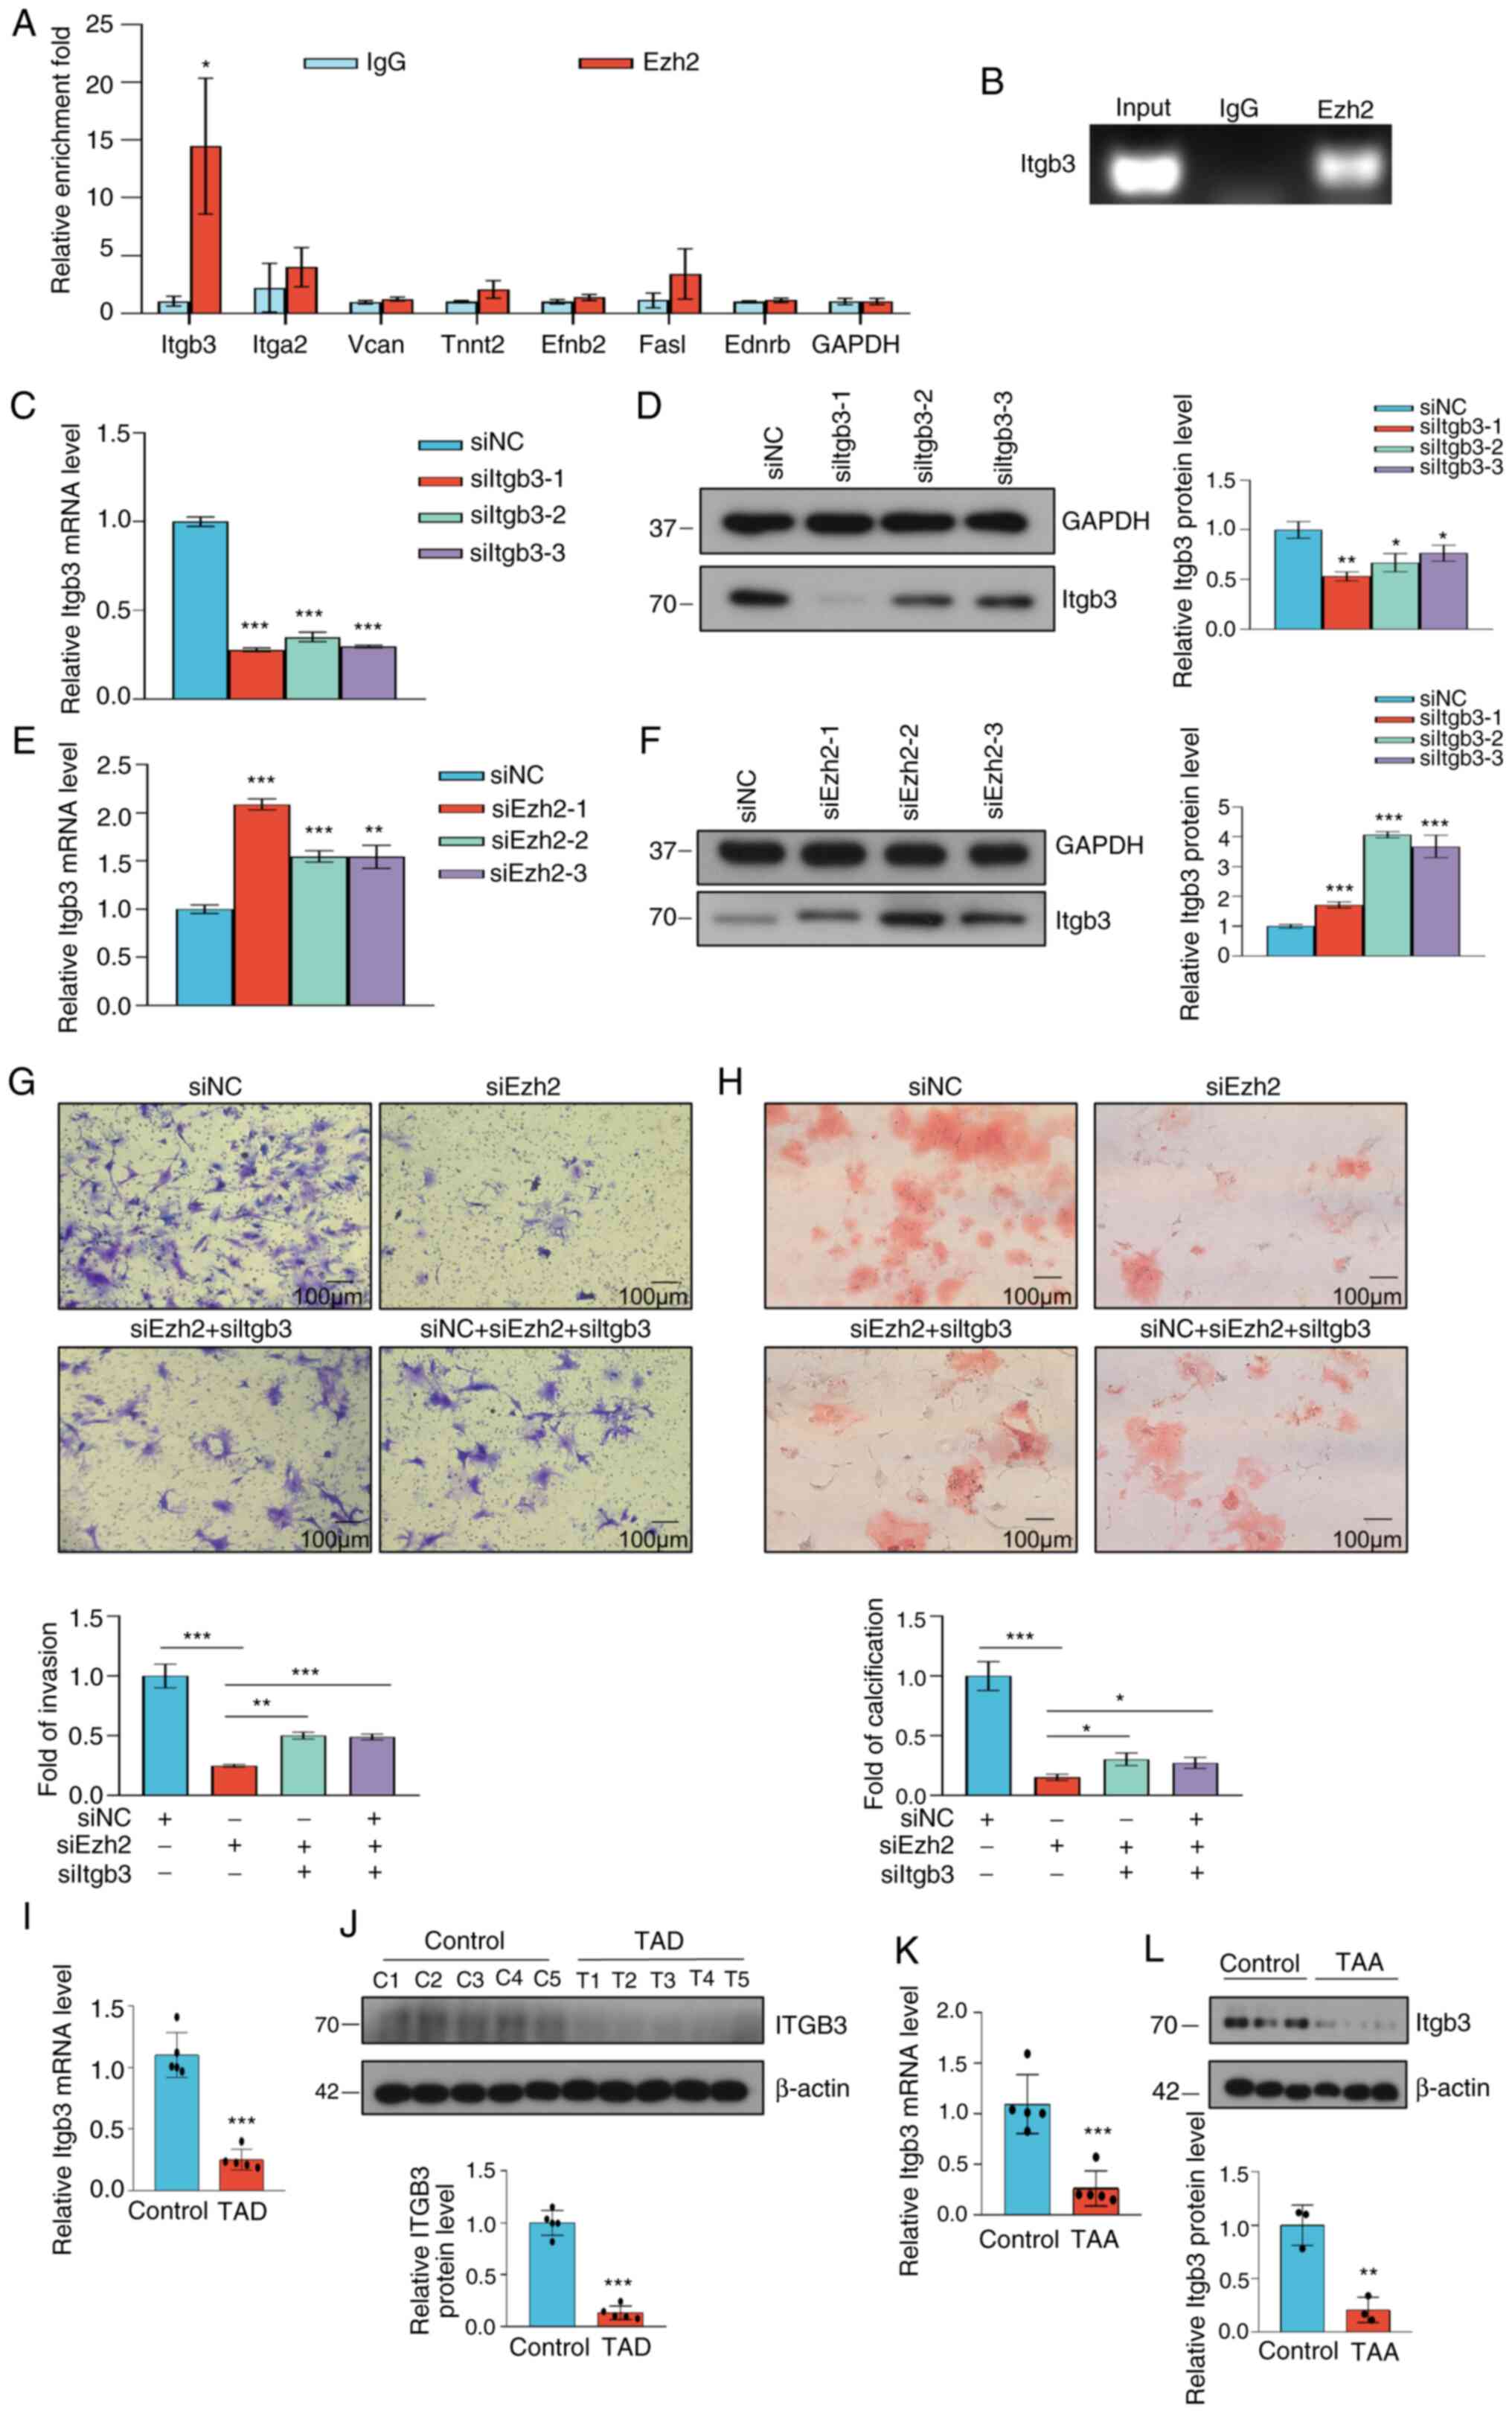 | Figure 6Ezh2 influences VSMC invasion and
calcification by inhibiting Itgb3. (A) qChIP analysis of the
selected genes in VSMCs. Results are presented as the enrichment
fold relative to Gapdh. Data were analyzed using two-tailed
unpaired Student's t-test. (B) ChIP-PCR results show Ezh2 binding
on the promotor sites of Itgb3. (C) Knockdown efficiency of Itgb3
was verified using RT-qPCR. (D) Knockdown efficiency of Itgb3 was
verified using western blotting. Histogram showing the relative
Itgb3 protein level. (E) VSMCs were transfected with siNC or
siEzh2. Itgb3 expression in VSMCs was detected 48 h
post-transfection using RT-qPCR normalized to Gapdh. (F) Western
blot analysis of Itgb3 expression in VSMCs 48 h post-transfection.
β-actin was used as the loading control. Histogram showing the
relative Itgb3 protein levels in VSMCs 48 h post transfection. (G)
VSMC invasion was assessed using a Transwell assay using
siNC-transfected, siEzh2-transfected, siEzh2 + siItgb3-transfected
and siNC + siEzh2 + siItgb3-transfected VSMCs for 48 h. Cells that
had invaded were stained with crystal violet. Scale bar, 100 µm.
Histogram showing the fold of invading VSMCs. (H) Representative
calcification staining of siNC-transfected, siEzh2-transfected,
siEzh2 + siItgb3-transfected and siNC + siEzh2 +
siItgb3-transfected VSMCs. Scale bar, 100 µm. Histogram showing the
fold of calcified VSMCs. (C-H) Data were analyzed using one-way
ANOVA. (I) ITGB3 expression in control aortic tissues or tissues of
patients with TAD was determined using RT-qPCR (n=5 for normal
tissues and n=5 for TAD). (J) Western blot analysis of EZH2 protein
expression in control aortic tissues and tissues from patients with
TAD (n=5 for normal tissues and 5 for TAD). β-actin was used as the
loading control. Semi-quantification of ITGB3 protein expression in
control aortic tissues and tissues from patients with TAD (n=5 for
normal tissues and n=5 for TAD). (K) Itgb3 expression in aortic
tissues of normal and TAA mice was determined using RT-qPCR (n=3
for normal tissues and n=3 for TAD). (L) Western blot analysis of
Itgb3 in aortic tissues of normal and TAA mice (n=3 for normal
tissues and n=3 for TAA). β-actin was used as the loading control.
Semi-quantification of Itgb3 protein expression in the aortic
tissues of normal and TAA mice (n=3 for normal tissues and n=3 for
TAA). (I-L) Data were analyzed using two-tailed unpaired Student's
t-test. Data are presented as the mean ± SD. *P<0.05
**P<0.01, ***P<0.001 versus control
groups. EZH2, enhancer of zeste homolog 2; VSMC, vascular smooth
muscle cell; qChIP, quantitative chromatin immunoprecipitation; si,
small interfering; NC, negative control; RT-qPCR, reverse
transcription-quantitative PCR; TAD, thoracic aortic dissection;
TAA, thoracic aortic aneurysms. |
Discussion
TAA is the leading cause of death and morbidity
worldwide, and it is especially challenging to manage due to the
fragility of vessel walls and the high risk of rupture, resulting
in a high mortality rate in affected individuals (1,2). TAA
involves localized bulges or dilations of the aortic wall, whereas
TAD involves a tear in the aortic lining that creates a false
channel for blood flow. Both conditions require prompt medical
evaluation and management to prevent serious complications.
However, despite their differences, noteworthy similarities in the
pathophysiological mechanisms and clinical presentations exist
(28,29). The study of TAA and TAD may provide
more effective insights into managing and addressing these complex
and interrelated cardiovascular conditions. The etiology of TAA is
heterogeneous as it can be influenced by both genetic and
environmental factors, and environmental risk factors have been
difficult to determine (2). Thus,
epigenetic studies are necessary to overcome this limitation.
Increasing evidence has shown that epigenetics plays a vital role
in the pathological process of aortic media degeneration (30). The histone methyltransferase EZH2
is an enzymatically active subunit of the polycomb repressive
complex, which di- and tri-methylates H3 at lys27 (H3K27me2
andH3K27me3) to suppress gene transcription. It has been implicated
in various types of cancer, including prostate, thyroid, lung and
bladder cancer, in which EZH2 promotes tumor cell proliferation and
motility via epigenetic changes in cancer-associated gene
expression levels (31,32). Furthermore, Mitić et al
(33) showed that inhibition of
EZH2 increases angiogenesis in ischemic tissue. However, whether
EZH2 plays a role in VSMCs during TAA pathology, and whether this
effect of EZH2 is related to the ECM pathway has not yet been
determined. In the present study, when compared with control
groups, EZH2 expression was significantly increased in the aortic
wall of patients with TAD and in the mouse model of TAA. These
findings are consistent with those of previous studies, with
similar upregulated EZH2 expression observed in pulmonary
hypertension and coronary heart disease (19,34).
Ezh2 knockout has been shown to inhibit SMC proliferation and
enhance apoptosis (12). Likewise,
the results of the present study confirmed the regulatory role of
Ezh2 in SMC proliferation (19,35).
Furthermore, Ezh2 occupied the Itgb3 promoter and
inhibited its expression, thereby promoting the invasion of VSMCs.
Therefore, the results of the present study suggested that EZH2
regulates the phenotypic transformation of VSMCs by controlling
ECM-related gene expression.
The aortic wall primarily consists of VSMCs and a
collagen-rich ECM. VSMCs and fibroblasts produce the ECM, which
plays an important role in maintaining the structural integrity of
the aortic wall. It has been suggested that TAA pathogenesis is
closely correlated with the dysfunction of VSMCs (36). It has also been shown that VSMCs in
the aortic wall are a highly dynamic cell population exhibiting
continuous phenotypic modulation (37). VSMCs can transform from a
differentiated and quiescent contractile state to a proliferative
and migratory synthetic phenotype when stimulated, which is
characterized by decreased expression of contractile markers and an
enhanced rate of VSMC proliferation, migration and synthetic
activity (38). In the present
study, it was found that Ezh2 knockdown could upregulate
contractile marker genes, including Acta2 and Tagln,
and downregulate synthetic marker genes, such as Mmp2 and
Mmp9. Thus, the results of the present study are consistent
with a previous study that showed that deficiency of Ezh2
allowed for more efficient expression of contractile markers
(39,40). Inamoto et al (11) reported that the number of
contractile aortic SMCs was significantly lower in thoracic aortic
tissues with TAD than in healthy aortic tissues, confirming that
the transformation of VSMCs from a contractile to a synthetic
phenotype may play an important role in TAA. In addition, Ezh2
deficiency effectively reduced the migration potential of VSMCs
in vitro, which is consistent with the findings previously
reported by Han et al (12). Taken together, these data indicated
that Ezh2 promotes the phenotypic modulation of VSMCs from a
synthetic to contractile phenotype, and accelerates the development
of TAA (36).
To identify Ezh2 target genes, the effects of Ezh2
on gene expression and pathophysiological signaling pathways were
assessed. Several potential candidate genes were identified, as
well as pathophysiological pathways targeted by cell adhesion
molecule activity and ECM-receptor processes. RNA-seq combined with
qChIP experiments revealed that Ezh2 bound directly to the Itgb3
promoter and inhibited Itgb3 expression. This gene is a member of
the integrin family, which consists of transmembrane receptors that
bridge cell-to-cell and cell-to-ECM interactions, transmitting
signals from ECM fibers to the contractile mechanism of VSMCs,
allowing VSMCs to initiate transcription in response to these
stimuli (13). Integrin activation
exerts notable biological roles that regulate ECM assembly, growth
factor signaling and cellular functions, such as adhesion,
proliferation, survival and migration (41,42)
Itgb3, also known as CD61 or GP3A, is one of the most extensively
studied ECM family members. ITGB3 plays a key role in determining
the proper treatment for tumor, and regulates tumor growth and
metastatic spread (41). In
addition, ITGB3 plays a pivotal role in promoting and maintaining
tumor cell stemness (43).
Nevertheless, prior studies have not examined the role of ITGB3 in
VSMC proliferation and migration, to the best of our knowledge. The
present study showed that Ezh2 knockdown increased
Itgb3 expression, and Itgb3 depletion reversed the
decrease in SMC migration and calcification caused by Ezh2
knockdown, suggesting that ITGB3 may be an inhibitor of
EZH2-induced phenotypic transformation of VSMCs in TAA. Taken
together, the findings of the present study suggested that the
EZH2-ECM-receptor-ITGB3 axis regulates the proliferation and
phenotypic switching of VSMCs. Additionally, it was found that Ezh2
transcription inhibited Itgb3 expression; however, further studies
are warranted to determine if this is achieved through simultaneous
or sequential methylation of H3K27, to broadly maintain an
increased level of H3K27me3 at the target promoter, thereby
transcriptionally inactivating ECM-receptor genes, such as
Itgb3.
In summary, the role of the histone
methyltransferase, EZH2, in the phenotypic transformation of SMCs
and its involvement in aortic aneurysms was studied. The results
showed increased EZH2 levels in human aortic dissection samples and
model mice with aortic aneurysms. The enrichment function of EZH2
is focused on ECM processes. RT-qPCR and qChIP experiments
confirmed that Ezh2 inhibited Itgb3 gene expression
by binding to the Itgb3 gene promoter region, suggesting
that the EZH2-ITGB3 regulatory axis is related to smooth muscle
phenotypic transformation and the ECM process. The presented
findings may aid in the search for therapeutic targets for TAA.
EZH2 contributes to the progression of TAA by regulating the
phenotypic transformation of VSMCs and the expression of ITGB3.
Thus, EZH2 may serve as a suitable target for the management of
TAA.
Supplementary Material
Appendix S1
Clinicopathological characteristics of
the cohort.
Acknowledgements
The authors would like to thank Dr Ying Li of the
Research Center of Translational Medicine, Jinan Central Hospital
(Jinan, China) for their assistance in the laboratory.
Funding
Funding: This work was supported by grants from the National
Natural Science Foundation of China (grant no. 82002987), the China
Postdoctoral Science Foundation (grant nos. 2021M691226 and
2022M721334), the Shandong Province Postdoctoral Innovation Talent
Support Plan (grant nos. 202102045 and SDCX-ZG-202203007), and the
Shandong Medical and Health Science and Technology Development Plan
(grant no. 202104020266).
Availability of data and materials
The datasets used and/or analyzed during the
current study are available from the corresponding author on
reasonable request. The RNA-sequencing dataset generated and/or
analyzed during the current study is available in the Gene
Expression Omnibus repository (https://www.ncbi.nlm.nih.gov/geo/query/acc.cgi?acc=GSE227177).
Authors' contributions
WY and SX designed the experiments, plotted the
graphs and created the diagrams. SX performed the in vitro
experiments and was a major contributor in writing the manuscript.
FZ and GS collected tissue samples from patients with TAD from
Jinan Central Hospital. SX and ZD were responsible for the animal
experiments. SX and SL performed the transcriptomics studies. GS
and WY confirmed the authenticity of all the raw data. All authors
read and approved the final manuscript.
Ethics approval and consent to
participate
The studies involving human participants were
conducted according to the guidelines of The Declaration of
Helsinki, and were reviewed and approved by the Ethics Review
Committee of Jinan Central Hospital (approval no. SZR2021-054-01).
Informed written consent was obtained from all subjects involved in
the study. The animal experiments were approved by the Jinan
Central Hospital Experimental Animal Welfare Ethics Review
Committee (approval no. JNCHIACUC2022-52).
Patient consent for publication
The patients provided written informed consent for
the publication of any data and/or accompanying images.
Competing interests
The authors declare that they have no competing
interests.
References
|
1
|
Bossone E and Eagle KA: Epidemiology and
management of aortic disease: Aortic aneurysms and acute aortic
syndromes. Nat Rev Cardiol. 18:331–348. 2021.PubMed/NCBI View Article : Google Scholar
|
|
2
|
Bento JR, Meester J, Luyckx I, Peeters S,
Verstraeten A and Loeys B: The genetics and typical traits of
thoracic aortic aneurysm and dissection. Annu Rev Genomics Hum
Genet. 23:223–253. 2022.PubMed/NCBI View Article : Google Scholar
|
|
3
|
Lu H, Du W, Ren L, Hamblin MH, Becker RC,
Chen YE and Fan Y: Vascular smooth muscle cells in aortic aneurysm:
From genetics to mechanisms. J Am Heart Assoc.
10(e023601)2021.PubMed/NCBI View Article : Google Scholar
|
|
4
|
Bossone E, LaBounty TM and Eagle KA: Acute
aortic syndromes: Diagnosis and management, an update. Eur Heart J.
39:739–749d. 2018.PubMed/NCBI View Article : Google Scholar
|
|
5
|
Heiss C, Pitcher A, Belch JJF, De Carlo M,
Reinecke H, Baumgartner I, Mazzolai L and Aboyans V: The year in
cardiology: Aorta and peripheral circulation. Eur Heart J.
41:501–508b. 2020.PubMed/NCBI View Article : Google Scholar
|
|
6
|
Jana S, Hu M, Shen M and Kassiri Z:
Extracellular matrix, regional heterogeneity of the aorta, and
aortic aneurysm. Exp Mol Med. 51:1–15. 2019.PubMed/NCBI View Article : Google Scholar
|
|
7
|
Li C, Qiu S, Liu X, Guo F, Zhai J, Li Z,
Deng L, Ge L, Qian H, Yang L and Xu B: Extracellular matrix-derived
mechanical force governs breast cancer cell stemness and quiescence
transition through integrin-DDR signaling. Signal Transduct Target
Ther. 8(247)2023.PubMed/NCBI View Article : Google Scholar
|
|
8
|
Cescon M, Rampazzo E, Bresolin S, Da Ros
F, Manfreda L, Cani A, Della Puppa A, Braghetta P, Bonaldo P and
Persano L: Collagen VI sustains cell stemness and chemotherapy
resistance in glioblastoma. Cell Mol Life Sci.
80(233)2023.PubMed/NCBI View Article : Google Scholar
|
|
9
|
Golledge J: Abdominal aortic aneurysm:
Update on pathogenesis and medical treatments. Nat Rev Cardiol.
16:225–242. 2019.PubMed/NCBI View Article : Google Scholar
|
|
10
|
Sorokin V, Vickneson K, Kofidis T, Woo CC,
Lin XY, Foo R and Shanahan CM: Role of vascular smooth muscle cell
plasticity and interactions in vessel wall inflammation. Front
Immunol. 11(599415)2020.PubMed/NCBI View Article : Google Scholar
|
|
11
|
Inamoto S, Kwartler CS, Lafont AL, Liang
YY, Fadulu VT, Duraisamy S, Willing M, Estrera A, Safi H, Hannibal
MC, et al: TGFBR2 mutations alter smooth muscle cell phenotype and
predispose to thoracic aortic aneurysms and dissections. Cardiovasc
Res. 88:520–529. 2010.PubMed/NCBI View Article : Google Scholar
|
|
12
|
Han DG, Ahn CB, Lee JH, Hwang Y, Kim JH,
Park KY, Lee JW and Son KH: Optimization of electrospun
poly(caprolactone) fiber diameter for vascular scaffolds to
maximize smooth muscle cell infiltration and phenotype modulation.
Polymers (Basel). 11(643)2019.PubMed/NCBI View Article : Google Scholar
|
|
13
|
Michel JB, Jondeau G and Milewicz DM: From
genetics to response to injury: Vascular smooth muscle cells in
aneurysms and dissections of the ascending aorta. Cardiovasc Res.
114:578–589. 2018.PubMed/NCBI View Article : Google Scholar
|
|
14
|
Aherrahrou R, Baig F, Theofilatos K, Lue
D, Beele A, Örd T, Kaikkonen MU, Aherrahrou Z, Cheng Q, Ghosh S, et
al: Secreted protein profiling of human aortic smooth muscle cells
identifies vascular disease associations. medRxiv.
10(23298351)2023.PubMed/NCBI View Article : Google Scholar
|
|
15
|
Zhang L, Xia C, Yang Y, Sun F, Zhang Y,
Wang H, Liu R and Yuan M: DNA methylation and histone
post-translational modifications in atherosclerosis and a novel
perspective for epigenetic therapy. Cell Commun Signal.
21(344)2023.PubMed/NCBI View Article : Google Scholar
|
|
16
|
Ibarrola J, Kim SK, Lu Q, DuPont JJ,
Creech A, Sun Z, Hill MA, Jaffe JD and Jaffe IZ: Smooth muscle
mineralocorticoid receptor as an epigenetic regulator of vascular
ageing. Cardiovasc Res. 118:3386–3400. 2023.PubMed/NCBI View Article : Google Scholar
|
|
17
|
Le T, He X, Huang J, Liu S, Bai Y and Wu
K: Knockdown of long noncoding RNA GAS5 reduces vascular smooth
muscle cell apoptosis by inactivating EZH2-mediated RIG-I signaling
pathway in abdominal aortic aneurysm. J Transl Med.
19(466)2021.PubMed/NCBI View Article : Google Scholar
|
|
18
|
Delgado-Olguín P, Dang LT, He D, Thomas S,
Chi L, Sukonnik T, Khyzha N, Dobenecker MW, Fish JE and Bruneau BG:
Ezh2-mediated repression of a transcriptional pathway upstream of
Mmp9 maintains integrity of the developing vasculature.
Development. 141:4610–4617. 2014.PubMed/NCBI View Article : Google Scholar
|
|
19
|
Wang Y, Huang XX, Leng D, Li JF, Liang Y
and Jiang T: Effect of EZH2 on pulmonary artery smooth muscle cell
migration in pulmonary hypertension. Mol Med Rep.
23(129)2021.PubMed/NCBI View Article : Google Scholar
|
|
20
|
Li Y, Guo S, Zhao Y, Li R, Li Y, Qiu C,
Xiao L and Gong K: EZH2 regulates ANXA6 expression via H3K27me3 and
is involved in angiotensin II-induced vascular smooth muscle cell
senescence. Oxid Med Cell Longev. 2022(4838760)2022.PubMed/NCBI View Article : Google Scholar
|
|
21
|
Zhuang T, Liu J, Chen X, Pi J, Kuang Y,
Wang Y, Tomlinson B, Chan P, Zhang Q, Li Y, et al: Cell-specific
effects of GATA (GATA Zinc Finger Transcription Factor Family)-6 in
vascular smooth muscle and endothelial cells on vascular injury
neointimal formation. Arterioscler Thromb Vasc Biol. 39:888–901.
2019.PubMed/NCBI View Article : Google Scholar
|
|
22
|
Livak KJ and Schmittgen TD: Analysis of
relative gene expression data using real-time quantitative PCR and
the 2(-Delta Delta C(T)) method. Methods. 25:402–408.
2001.PubMed/NCBI View Article : Google Scholar
|
|
23
|
Ashburner M, Ball CA, Blake JA, Botstein
D, Butler H, Cherry JM, Davis AP, Dolinski K, Dwight SS, Eppig JT,
et al: Gene ontology: Tool for the unification of biology. The Gene
Ontology Consortium. Nat Genet. 25:25–29. 2000.PubMed/NCBI View Article : Google Scholar
|
|
24
|
The Gene Ontology Consortium. The gene
ontology resource: 20 years and still GOing strong. Nucleic Acids
Res. 47:D330–D338. 2019.PubMed/NCBI View Article : Google Scholar
|
|
25
|
Minoru Kanehisa: Post-genome informatics.
Oxford University Press, 2000.
|
|
26
|
Wu T, Hu E, Xu S, Chen M, Guo P, Dai Z,
Feng T, Zhou L, Tang W, Zhan L, et al: clusterProfiler 4.0: A
universal enrichment tool for interpreting omics data. Innovation
(Camb). 2(100141)2021.PubMed/NCBI View Article : Google Scholar
|
|
27
|
Pan L, Bai P, Weng X, Liu J, Chen Y, Chen
S, Ma X, Hu K, Sun A and Ge J: Legumain is an endogenous modulator
of integrin αvβ3 triggering vascular degeneration, dissection, and
rupture. Circulation. 145:659–674. 2022.PubMed/NCBI View Article : Google Scholar
|
|
28
|
Zhou Y, Wang T, Fan H, Liu S, Teng X, Shao
L and Shen Z: Research progress on the pathogenesis of aortic
aneurysm and dissection in metabolism. Curr Probl Cardiol.
49(102040)2023.PubMed/NCBI View Article : Google Scholar
|
|
29
|
Chakraborty A, Li Y, Zhang C, Li Y,
Rebello KR, Li S, Xu S, Vasquez HG, Zhang L, Luo W, et al:
Epigenetic induction of smooth muscle cell phenotypic alterations
in aortic aneurysms and dissections. Circulation. 148:959–977.
2023.PubMed/NCBI View Article : Google Scholar
|
|
30
|
Pinard A, Jones GT and Milewicz DM:
Genetics of thoracic and abdominal aortic diseases. Circ Res.
124:588–606. 2019.PubMed/NCBI View Article : Google Scholar
|
|
31
|
Chang CJ and Hung MC: The role of EZH2 in
tumour progression. Br J Cancer. 106:243–247. 2012.PubMed/NCBI View Article : Google Scholar
|
|
32
|
Rao ZY, Cai MY, Yang GF, He LR, Mai SJ,
Hua WF, Liao YJ, Deng HX, Chen YC, Guan XY, et al: EZH2 supports
ovarian carcinoma cell invasion and/or metastasis via regulation of
TGF-beta1 and is a predictor of outcome in ovarian carcinoma
patients. Carcinogenesis. 31:1576–1583. 2010.PubMed/NCBI View Article : Google Scholar
|
|
33
|
Mitić T, Caporali A, Floris I, Meloni M,
Marchetti M, Urrutia R, Angelini GD and Emanueli C: EZH2 modulates
angiogenesis in vitro and in a mouse model of limb ischemia. Mol
Ther. 23:32–42. 2015.PubMed/NCBI View Article : Google Scholar
|
|
34
|
Liu Y, Dai C, Lei Y, Wu W and Liu W:
Inhibition of EZH2 attenuates coronary heart disease by interacting
with microRNA-22 to regulate the TXNIP/nuclear factor-κB pathway.
Exp Physiol. 105:2038–2050. 2020.PubMed/NCBI View Article : Google Scholar
|
|
35
|
Aljubran SA, Cox R Jr, Parthasarathy PT,
Ramanathan GK, Rajanbabu V, Bao H, Mohapatra SS, Lockey R and
Kolliputi N: Enhancer of zeste homolog 2 induces pulmonary artery
smooth muscle cell proliferation. PLoS One.
7(e37712)2012.PubMed/NCBI View Article : Google Scholar
|
|
36
|
Yuan Y, Wang C, Xu J, Tao J, Xu Z and
Huang S: BRG1 overexpression in smooth muscle cells promotes the
development of thoracic aortic dissection. BMC Cardiovasc Disord.
14(144)2014.PubMed/NCBI View Article : Google Scholar
|
|
37
|
He D, Mao A, Zheng CB, Kan H, Zhang K,
Zhang Z, Feng L and Ma X: Aortic heterogeneity across segments and
under high fat/salt/glucose conditions at the single-cell level.
Natl Sci Rev. 7:881–896. 2020.PubMed/NCBI View Article : Google Scholar
|
|
38
|
Owens GK, Kumar MS and Wamhoff BR:
Molecular regulation of vascular smooth muscle cell differentiation
in development and disease. Physiol Rev. 84:767–801.
2004.PubMed/NCBI View Article : Google Scholar
|
|
39
|
Cardenas CL, Kessinger CW, MacDonald C,
Jassar AS, Isselbacher EM, Jaffer FA and Lindsay ME: Inhibition of
the methyltranferase EZH2 improves aortic performance in
experimental thoracic aortic aneurysm. JCI insight.
3(e97493)2018.PubMed/NCBI View Article : Google Scholar
|
|
40
|
McDonald RA, Hata A, MacLean MR, Morrell
NW and Baker AH: MicroRNA and vascular remodelling in acute
vascular injury and pulmonary vascular remodelling. Cardiovasc Res.
93:594–604. 2012.PubMed/NCBI View Article : Google Scholar
|
|
41
|
Zhu C, Kong Z, Wang B, Cheng W, Wu A and
Meng X: ITGB3/CD61: A hub modulator and target in the tumor
microenvironment. Am J Transl Res. 11:7195–7208. 2019.PubMed/NCBI
|
|
42
|
Yang X, Xu C, Yao F, Ding Q, Liu H, Luo C,
Wang D, Huang J, Li Z, Shen Y, et al: Targeting endothelial tight
junctions to predict and protect thoracic aortic aneurysm and
dissection. Eur Heart J. 44:1248–1261. 2023.PubMed/NCBI View Article : Google Scholar
|
|
43
|
Desgrosellier JS and Cheresh DA: Integrins
in cancer: Biological implications and therapeutic opportunities.
Nat Rev Cancer. 10:9–22. 2010.PubMed/NCBI View Article : Google Scholar
|