Introduction
Gout is a chronic inflammatory disease caused by
monosodium urate (MSU) crystal deposition. The clinical
manifestations of gout are paroxysmal single joint synovitis,
severe pain, swelling and fever, but these symptoms are
self-limiting (1). Although acute
gout symptoms may subside within a few days, the long-term
deposition of MSU crystals can lead to the formation of tophi,
leading to bone destruction (2).
Epidemiological surveys report that the prevalence
of gout among all age groups in the United States was 3.9% from
2007-2016(3). The prevalence of
gout in Australia in 2015 was 6.8% (4) and 3.8% in Canada in 2012(5). The prevalence of gout in South Korea
increased over 2007-2015 from 0.35-0.76% and is expected to reach
1.66% by 2025(6). In China, the
prevalence of gout is 1.1%, and the prevalence of gout in men
(1.5%) is higher than that in women (0.9%) (7). Measurement of serum urate levels can
be used for the clinical diagnosis of gout in symptomatic
individuals, but this may not be feasible, as certain patients with
hyperuricemia do not have gout, since the increase of blood uric
acid level may not necessarily lead to gout, but hyperuricemia is
the most important biochemical basis of gout, and urate crystal
deposition is the result of hyperuricemia; therefore, more reliable
biomarkers are needed to improve the diagnosis of gout.
Gout is a metabolic disease associated with a
permanent imbalance of certain metabolites (8). Non-targeted metabolomics is the
hypothesis-generating, global unbiased analysis of all
small-molecule metabolites present within a biological system,
under a given set of conditions (9). Liquid chromatography-mass
spectrometry (LC-MS) is the main technical platform used for
metabolic analysis (10).
Metabolomics has been used in disease diagnosis and detection, and
it is important for the early diagnosis and treatment of disease
(11,12). Therefore, there is an urgent need
to use metabolomics to identify novel biomarkers related to the
occurrence and development of gout to prevent acute attacks and
joint destruction in patients with gouty arthritis.
A number of studies have reported metabolic
differences between patients with gout and healthy subjects and
have shown that amino acid metabolism is important for regulating
serum uric acid (UA) levels (13,14).
In the pathogenesis of gout, a large number of amino acids are
consumed, and among 19 amino acids, the levels of 10 amino acids
(alanine, glycine, isoleucine, leucine, methionine, phenylalanine,
proline, serine, tryptophan, valine) differed significantly in one
study, which suggests that amino acids may serve an important role
in gout pathogenesis (14). The
purine metabolic pathway is also closely related to the occurrence
of gout. UA is the final product of purine metabolism. When purine
nucleotide synthesis is disrupted, the serum concentration of UA
increases (15). Furthermore,
urate crystals are formed, causing gouty inflammation (16).
To date, the systematic analysis of nontargeted
metabolomics features to determine potential biomarkers for
predicting or diagnosing gout in human cohorts has not commonly
been performed. The present study objectives were as follows: i) To
explore serum metabolic changes in patients with gout and healthy
subjects and capture metabolic changes associated with gout
progression; ii) to screen potential metabolic biomarker groups in
patients with gout; and iii) to screen potential pathways for the
treatment of gout.
Materials and methods
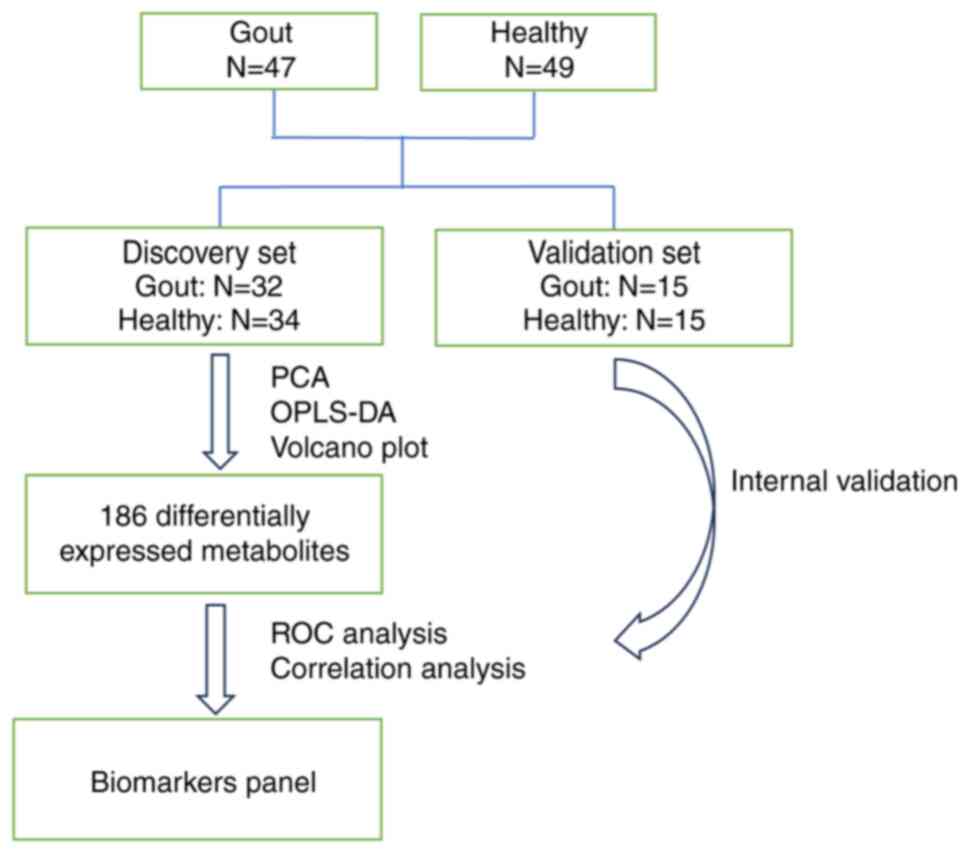
Participants and study design
A total of 47 patients with gout who met the
classification criteria approved by The European League Against
Rheumatism Executive Committee and from the outpatient ward of the
Affiliated Hospital of Nanjing University of Traditional Chinese
Medicine (Nanjing, China) from June 2020 to January 2023(17). A total of 49 healthy volunteers
without rheumatic diseases, were recruited from the Health
Counseling and Physical Examination Center of the Affiliated
Hospital of Nanjing University of Traditional Chinese Medicine at
the same time. The patients with gout and healthy subjects were
randomly assigned to the discovery set (34 healthy individuals and
32 patients with gout) and the validation set (15 healthy
individuals and 15 patients with gout), respectively, at a 7:3
ratio based on previously published literature (18,19).
The present study was approved by the Ethics Committee of the
Affiliated Hospital of Nanjing University of Traditional Chinese
Medicine (approval no. 2019NL-129-02; Nanjing). Written informed
consent was obtained from the participants, who abided by the
principle of privacy protection. The patients with gout and the
healthy individuals were aged 18-70 years, were male or female, did
not suffer from other rheumatic diseases and had not used long-term
drugs or treatments, such as anti-inflammatory drugs, for 3 months.
LC-MS/MS technology was used to analyze the peripheral blood of the
two groups of patients and potential differential markers related
to gout were identified (Fig. 1).
Logistic regression and receiver operating characteristic (ROC)
analyses were used. Kyoto Encyclopedia of Genes and Genomes (KEGG)
and MetaboAnalyst databases (https://www.metaboanalyst.ca/) were used to analyze
the pathways associated with the differentially expressed
metabolites and identify the metabolic pathways of patients with
gout.
Sample preparation and metabolomics
profiling
A Vanquish ultrahigh-performance liquid
chromatograph (Thermo Fisher Scientific, Inc.) was used to separate
the target compounds using a Waters ACQUITY UPLC HSS T3 (2.1x100
mm; 1.8 µm) liquid chromatography column. The Orbitrap Exploris 120
mass spectrometer, which can perform primary and secondary mass
spectrometry data acquisition, was also used (Xcalibur; version
4.4; Thermo Fisher Scientific, Inc.). LC-MS/MS analyses were
performed using an UHPLC system (Vanquish; Thermo Fisher
Scientific, Inc.) with a UPLC HSS T3 column (2.1x100 mm; 1.8 µm)
coupled to an Orbitrap Exploris 120 mass spectrometer (Orbitrap MS;
Thermo Fisher Scientific, Inc.). The mobile phase consisted of 5
mmol/l acetate and 5 mmol/l acetic acid in water (A) and
acetonitrile (B). The auto-sampler temperature was 4˚C, and the
injection volume was 2 µl. The Orbitrap Exploris 120 mass
spectrometer was used for its ability to acquire MS/MS spectra on
information-dependent acquisition mode in the control of the
acquisition software (Xcalibur; Thermo Fisher Scientific, Inc.). In
this mode, the acquisition software continuously evaluates the full
scan MS spectrum. The ESI source conditions were set as following:
Sheath gas flow rate, 50 Arb; Aux gas flow rate, 15 Arb; capillary
temperature, 320˚C; full MS resolution, 60,000; MS/MS resolution,
15,000; collision energy, 10/30/60 in NCE mode; and spray voltage,
3.8 kV (positive) or -3.4 kV (negative).
Data processing and normalization
After the original data were converted into the
mzXML format using ProteoWizard (http://www.proteowizard.org/index.html), the peak
recognition, peak extraction, peak alignment and integrals were
processed using the self-written R package (Kernel XCMS). To reduce
the influence of detection system errors on the results and ensure
that the results better highlighted the biological significance, a
series of data management steps were performed using the original
data. This approach included the following steps: i) Deviation
value filtering where a single peak was filtered to remove the
noise and the deviation values were filtered based on the relative
standard deviation and coefficient of variation; ii) missing value
filtering where a single peak was filtered and only peak area data
with a single set of null values ≤50% or all group null values ≤50%
were retained; iii) missing value filling where the missing values
in the original data were simulated and the numerical simulation
method filled half of the minimum value; and iv) data normalization
where a mixed isotope internal standard [succinic
acid-2,2,3,3-d4,L-leucine-5,5,5-d3,
(RING-2H5)-L-phenylalanine,2-chloro-L-phenylalanine] was used for
normalization.
Statistical analysis
The significance of each metabolite was analyzed
using the Mann-Whitney Wilcoxon test and the false discovery rate
(FDR) was used for data correction. P<0.05 was considered to
indicate a statistically significant difference. Then, the
standardized data were imported into SIMCA-P (version 14.1; Sweden
Umetrics) for principal component analysis (PCA) to observe the
aggregation of samples. Orthogonal partial least squares
discriminant analysis (OPLS-DA) was further used to assess the
difference between the patients with gout and the healthy control
group. The processed data were subjected to MetaboAnalyst (version
5.0; http://www.metaboanalyst.ca/). All data
in this article were analyzed by one-way ANOVA using GraphPad Prism
(version 9.5.1; Dotmatics), followed by ROC and correlation
analysis. Correlation analysis and mapping were performed using
SPSS (version 27.0; IBM Corp.) and Origin (version 2022; OriginLab
Corporation). Endogenous biomarkers were identified using the Human
Metabolomics Database (http://www.hmdb.ca/). KEGG (http://www.genome.jp/) and metabolic analysis were
used to identify related metabolic pathways.
Results
Clinical characteristics of the
enrolled participants
Patient age, C-reactive protein, erythrocyte
sedimentation rate, uric acid, alanine transaminase, aspartate
aminotransferase, creatinine, triglycerides, total cholesterol and
low-density lipoprotein (LDL) cholesterol were significantly
increased in the patients with gout compared with those in the
healthy control group, while high-density lipoprotein cholesterol
was decreased. The changes in total protein, albumin and globulin
were not statistically significant (Table I). Although subjects with other
metabolic diseases were excluded to minimize confounding factors,
the aforementioned differences still existed, indicating that these
indicators may change during the onset of gout.
 | Table IBaseline clinical characteristics of
patients with gout compared with healthy subjects. |
Table I
Baseline clinical characteristics of
patients with gout compared with healthy subjects.
| Clinical
characteristic | Healthy subjects
(n=49) | Patients with gout
(n=23-47) |
|---|
| Age, years | 36.22 (8.73; 24.00,
60.00) | 44.85 (15.49; 18.0,
72.00)a,b |
| C-reactive protein,
mg/l | 2.59 (1.98; 1.00,
11.40) | 20.45 (29.67; 1.80,
138.00)c,d |
| Erythrocyte
sedimentation rate, mm/60 min | 10.43 (9.92; 2,
47) | 25.79 (24.71; 2.00,
103.00)c,e |
| Uric acid,
µmol/l | 296.39 (68.18;
186.00, 438.00) | 549.81 (126.55;
303.00, 812.00)b,c |
| Alanine
aminotransferase, U/l | 15.61 (5.34; 8.00,
29.00) | 36.29 (29.47; 7.00,
144.00)c,f |
| Aspartate
aminotransferase, U/l | 16.47 (2.72; 11.00,
25.00) | 23.47 (13.50; 9.00,
75.00)c,f |
| Total protein,
g/l | 73.44 (3.32; 66.87,
82.52) | 70.75 (10.62;
11.86, 86.62)f |
| Albumin, g/l | 47.18 (2.63; 42.70,
53.40) | 46.38 (4.94; 29.20,
55.00)f |
| Globulin, g/l | 26.40 (2.86; 19.30,
31.80) | 26.61 (5.73; 19.00,
55.40)f |
| Creatinine,
µmol/l | 67.80 (14.37;
48.60, 106.20) | 93.84 (27.56;
60.50, 235.50)c,d |
| Triglyceride,
mmol/l | 1.04 (0.44; 0.48,
2.24) | 1.89 (0.92; 0.94,
4.59)c,g |
| Total cholesterol,
mmol/l | 4.40 (0.44; 3.39,
5.65) | 5.00 (0.90; 3.45,
6.63)c,h |
| High-density
lipoprotein, mmol/l | 1.56 (0.24; 1.02,
2.07) | 1.26 (0.30; 0.72,
1.86)c,i |
| Low-density
lipoprotein, mmol/l | 2.40 (0.33; 1.76,
3.36) | 3.10 (0.68; 2.05,
4.69)c,i |
Nontargeted metabolomics study for
healthy subjects and patients with gout
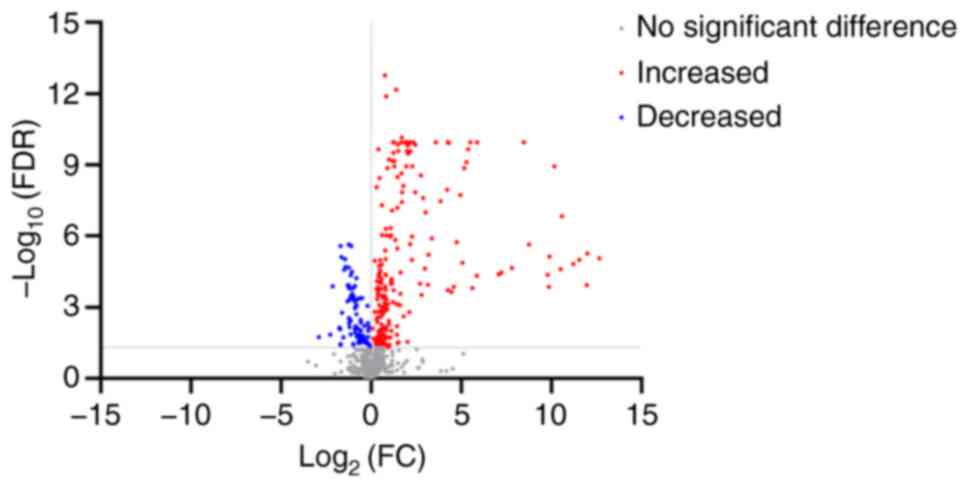
Nontargeted metabolomics analysis was performed
using an LC-MS/MS system quadrupole-electrostatic field orbital
trap Orbitrap mass spectrometer, and 26,854 peaks were detected in
positive and negative ionization modes. After data collation and
standardization, 991 metabolites were identified. Through the
Mann-Whitney Wilcoxon test combined with FDR correlation analysis,
295/991 compounds showed significant differences in metabolic
characteristics. Of these compounds, 207 were significantly more
abundant in patients with gout compared with healthy subjects,
while 88 of these compounds were significantly less abundant
(Fig. 2). Unsupervised PCA was
used to compare the metabolic profiles between patients with gout
and healthy individuals to assess the difference between the two
groups of patients, and then OPLS-DA was used to demonstrate that
there was a significant overall separation between patients with
gout and healthy individuals. The PCA plot indicated that there was
a significant metabolic difference between patients with gout and
healthy subjects at the molecular level (Fig. 3A). The cumulative R2Y and Q2 of the
discovery set were 0.962 and 0.801, respectively (Fig. 3B), which also indicated that there
was a significant metabolic difference, consistent with the results
shown in the PCA plot. The OPLS model was verified using a
permutation test. These results demonstrated that the Y intercept
of R2 was 0.803 and the Y intercept of Q2 was 0.391 (Fig. 3C), which indicated that the model
significantly differed between patients with gout and healthy
subjects, and was reliable. The difference between the group of
patients with gout and the healthy group was also obvious and the
model was more reliable in the validation set than the discovery
set (Fig. 3D-F). These
observations were used to further explore metabolites that could
potentially be used to identify the development of gout.
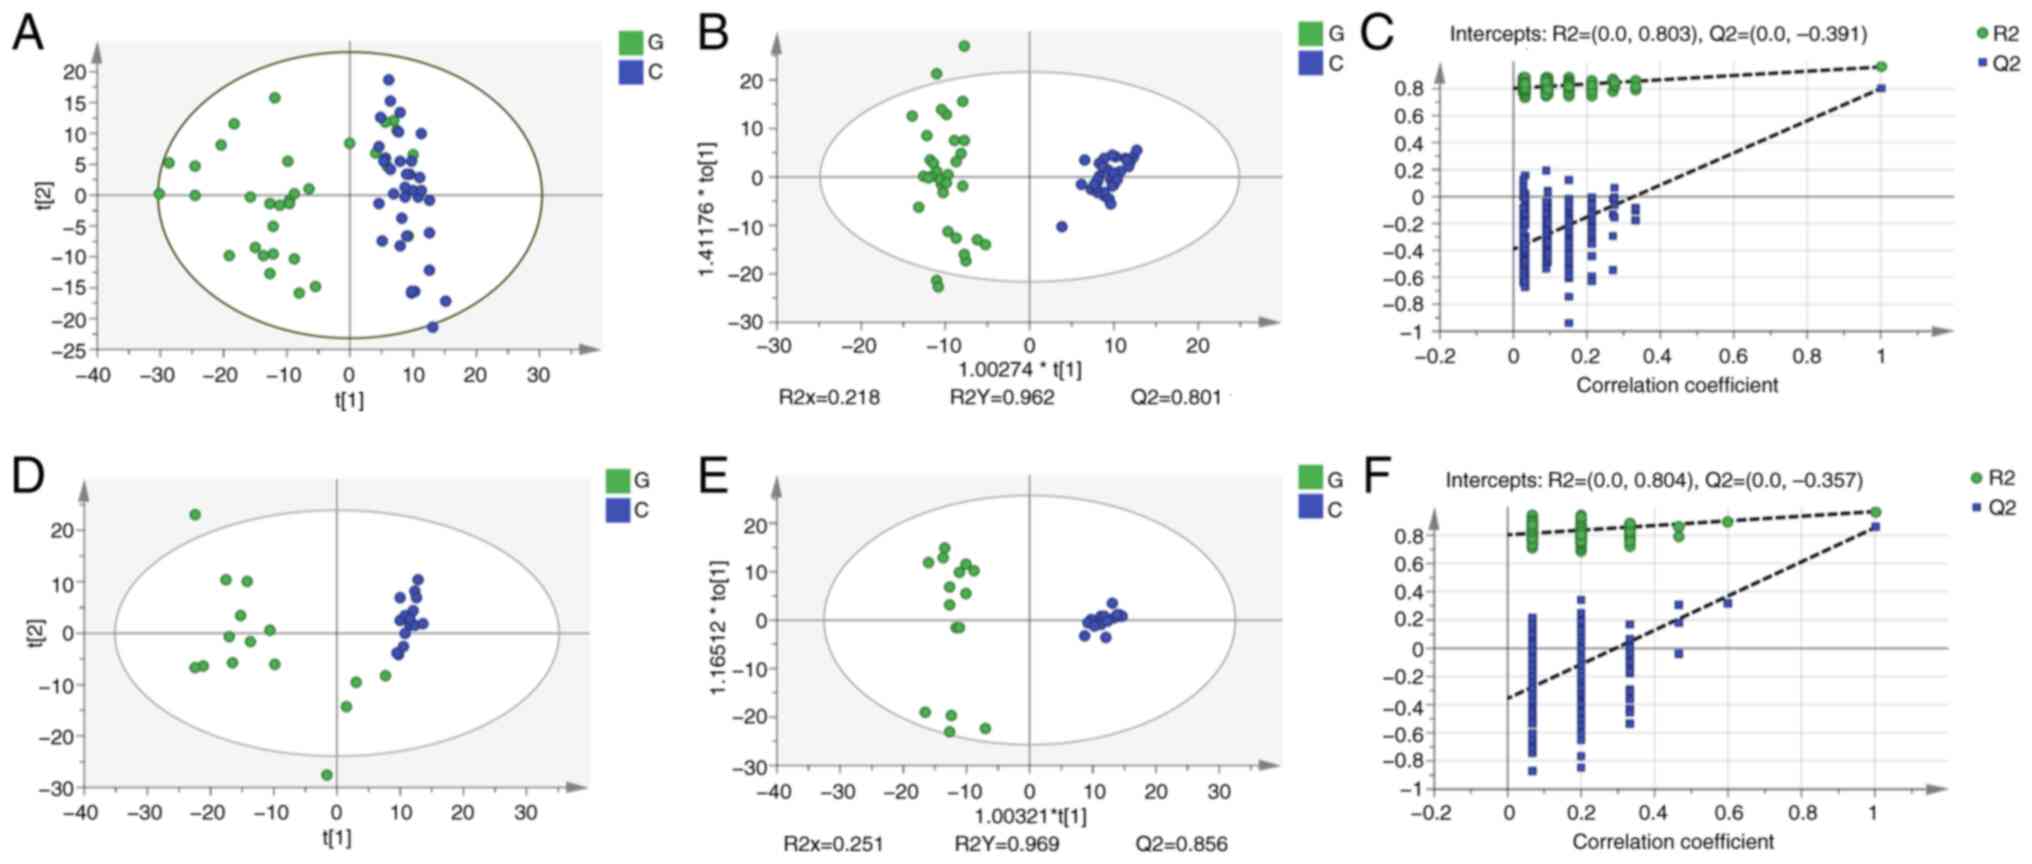 | Figure 3Liquid chromatography-mass
spectrometry-based nontargeted metabolomics for comparison of
healthy subjects with patients with gout in the discovery and
validation datasets. (A) PCA and (B) OPLS-DA score plot of healthy
subjects compared with patients with gout in the discovery set. (C)
A total of 200 permutation tests were performed on the discovery
set. (D) PCA and (E) OPLS-DA score plots of healthy subjects with
patients with gout in the validation set. (F) A total of 200
permutation tests were performed on the validation set. PCA,
principal component analysis; OPLS-DA, discriminative orthogonal
projection to latent structure-discriminant analysis. G, gout
group; C, healthy group; R2X, the cumulative interpretation rate of
the model to the X matrix (the square of the percentage of the
original data information retained in the X-axis direction); R2Y,
the cumulative interpretation rate of the model to the Y matrix
(the square of the percentage of the original data information
retained in the Y-axis direction); Q2, the cumulative prediction
ability of the model; t[1], the first coordinate axis, which
represents the change interval of new variables obtained by some
transformation of multiple variables in the original data; t[2],
the second coordinate axis represents the change interval of the
second new variable obtained by some transformation of multiple
variables in the original data; Cum, the cumulative results of
several principal components. |
According to the parameters of VIP ≥1.0, P<0.05
and adjusted P≤0.05, 186 differentially expressed metabolites were
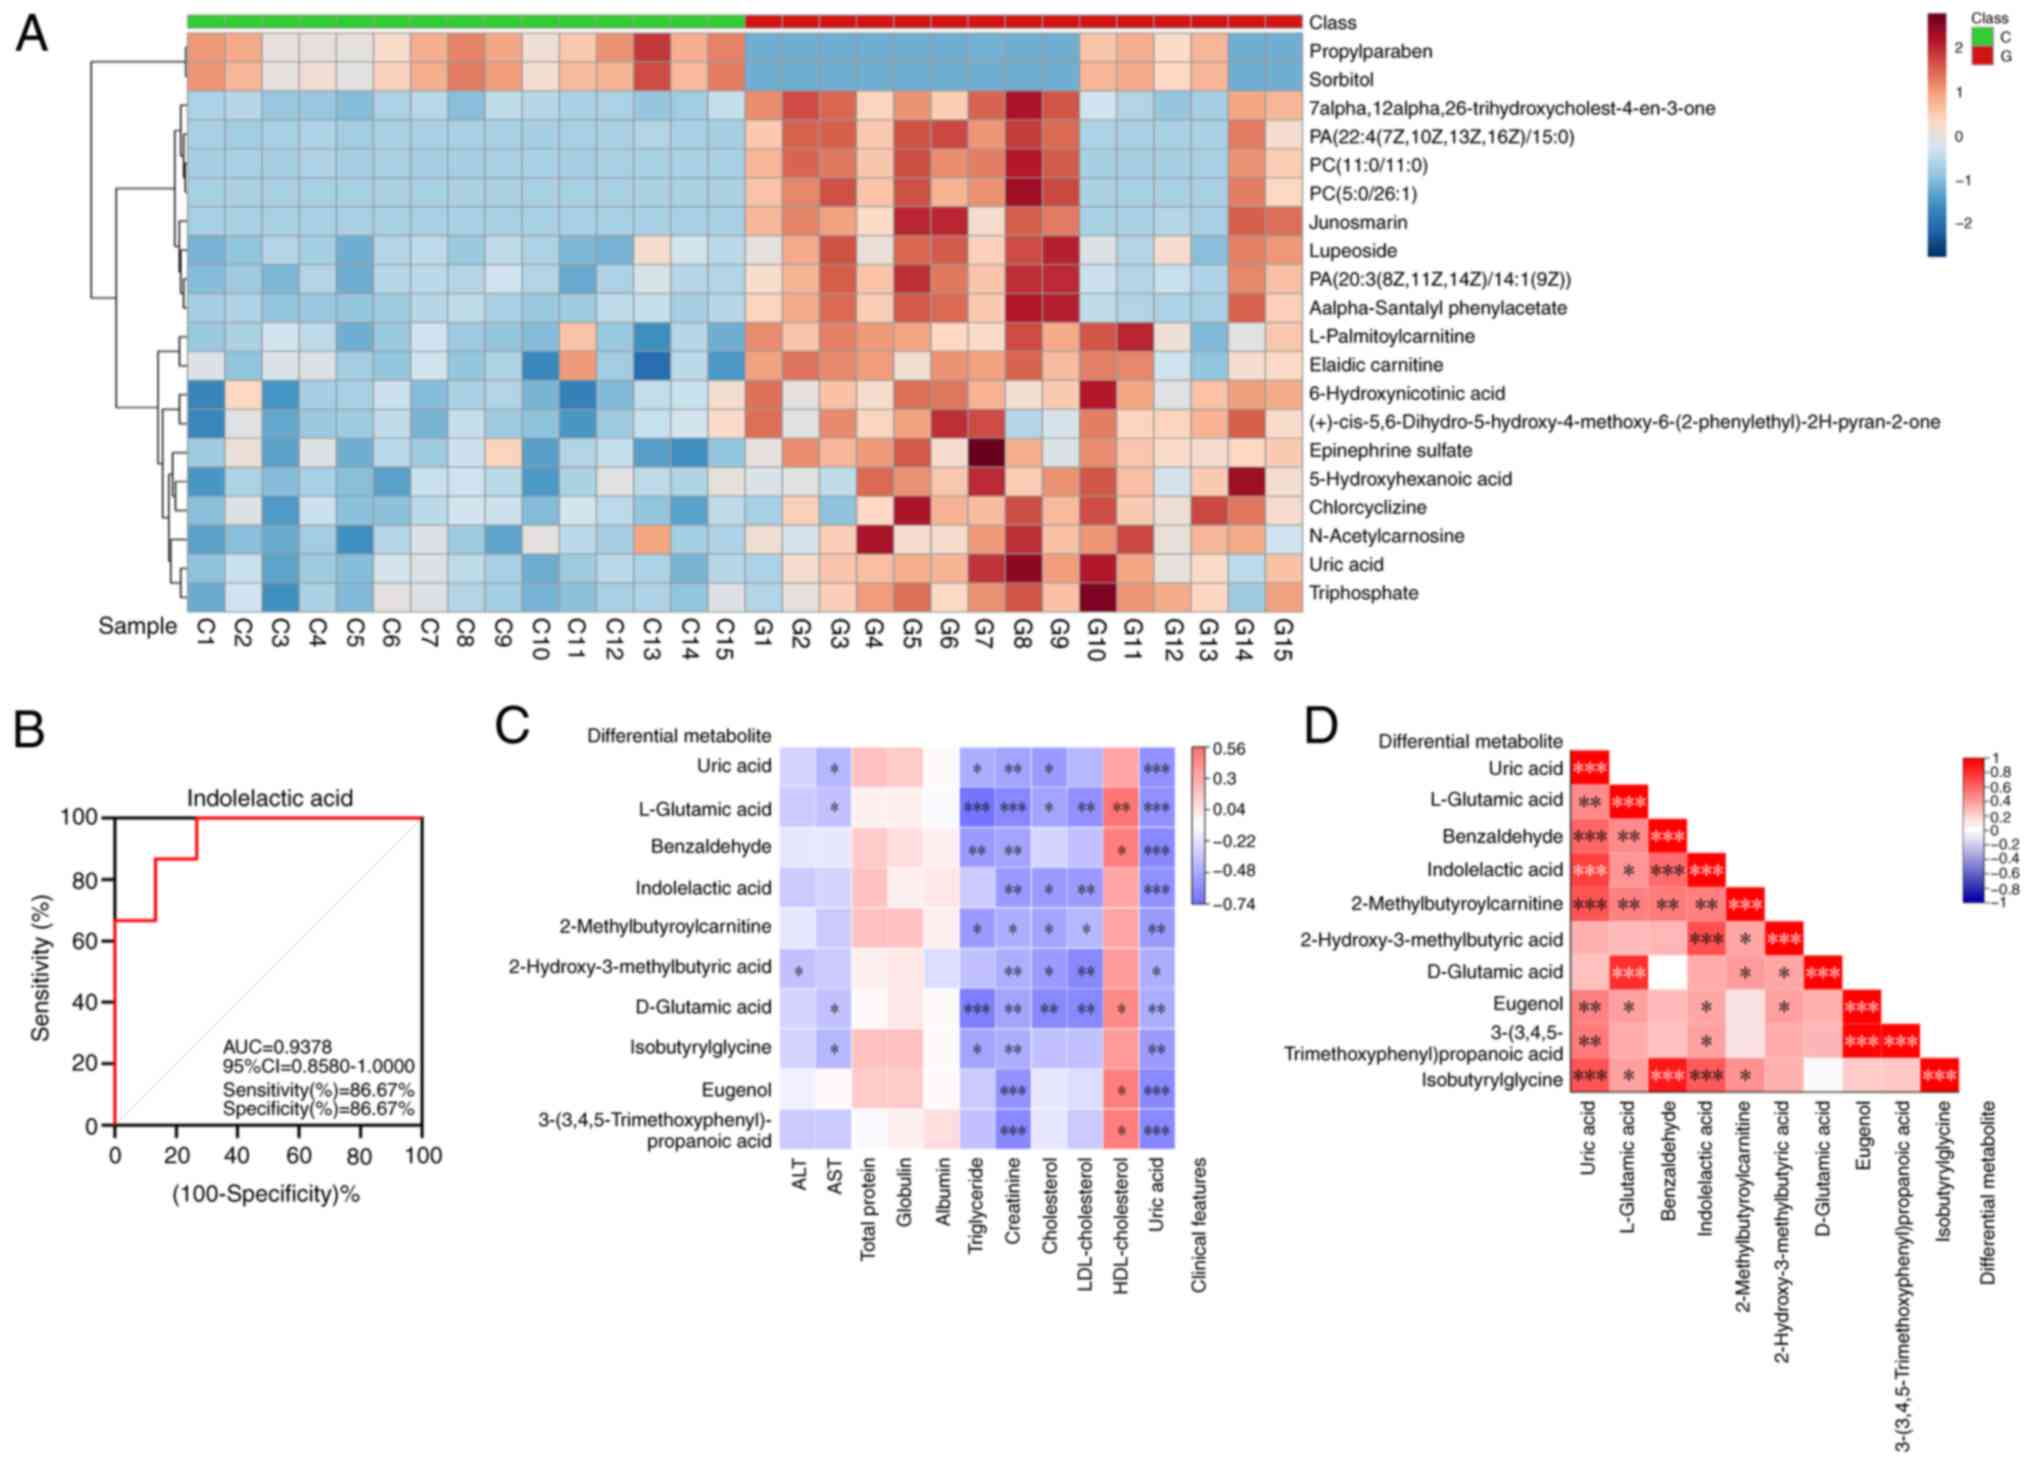
identified (Table SI). A visual
cluster analysis of the 186 differentially expressed metabolites
was performed using a heatmap and the top 20 differentially
expressed metabolites were selected for further analysis. The
metabolites which were significantly different between the group of
patients with gout compared with the healthy control group were
separated according to the heatmap, which provided a visual display
of the overall distribution of metabolic differences between the
groups (Fig. 4A).
Biomarker panel for the diagnosis of
patients with gout compared with healthy. participants
The group of biomarkers for the diagnosis of
patients with gout were screened according to the area under the
ROC curve (AUC). The top 10 endogenous metabolites with the highest
diagnostic rates were UA, L-glutamic acid, benzaldehyde,
indolelactic acid (ILA), 2-methylbutyroylcarnitine and
2-hydroxy-3-methylbutyric acid, D-glutamic acid, isobutyrylglycine,
eugenol and 3-(3,4,5-trimethoxyphenyl)propanoic acid, which had AUC
values of 0.9511, 0.9467, 0.9422, 0.9378, 0.9289, 0.9244, 0.9156,
0.9156, 0.9067 and 0.9022, respectively (Fig. S1). Among these biomarkers, ILA
could be used to successfully distinguish between the patients with
gout and the healthy group when used as a diagnostic marker. The
AUC value in the discovery set reached 0.9378, the sensitivity was
86.67%, the specificity was 86.67% and the 95% CI was 0.8580-1.000
(Fig. 4B).
Biomarker correlation analysis
Spearman correlation analysis was performed between
the top 10 differentially abundant metabolites and clinical
indicators revealed that triglycerides, creatinine, cholesterol,
LDL-cholesterol and UA were significantly correlated with
differentially abundant metabolites. Among the metabolites,
L-glutamic acid and D-glutamic acid were the most related to
clinical indicators. The correlations of UA, ILA,
2-methylbutyroylcarnitine and 2-hydroxy-3-methylbutyric acid were
also positive, followed by benzaldehyde, isobutyrylglycine, eugenol
and 3-(3,4,5-trimethoxyphenyl)propanoic acid (Fig. 4C). A correlation heatmap was
produced to represent the different markers between patients with
gout and healthy individuals (Fig.
4D). Each small square represented the correlation coefficient
between the metabolites and the red color represented a positive
correlation, whereas blue represented a negative correlation. The
darker the color, the more related the compound is to gout. The
correlations between the 10 endogenous compounds demonstrated that
the levels of ILA and the other nine metabolic compounds were
closely related and significant.
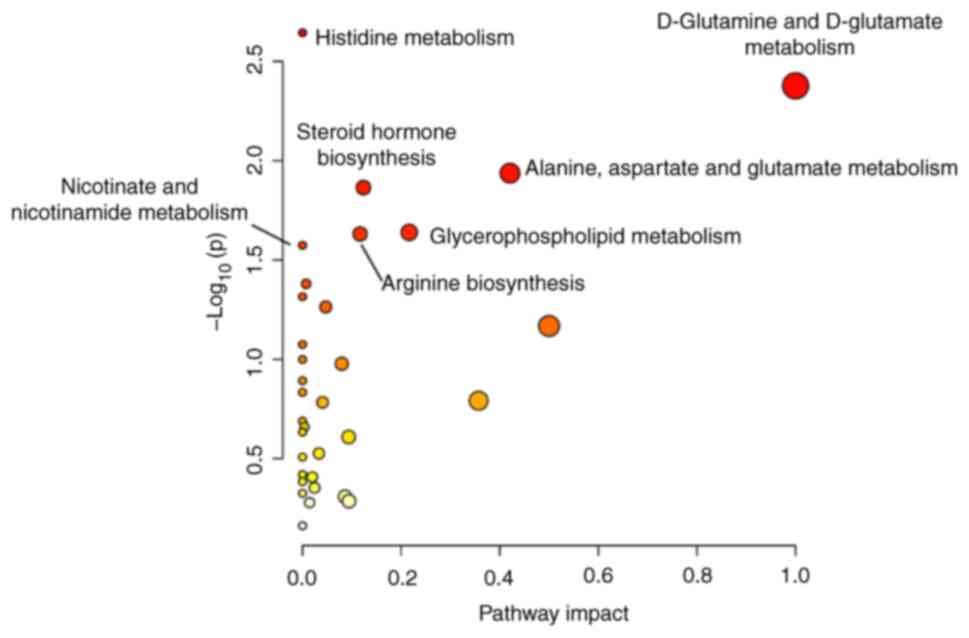
Pathway analysis
Pathway enrichment analysis demonstrated that the
aforementioned metabolites were involved in 29 metabolic pathways.
The identified metabolites were significantly enriched in pathways
such as the malate-aspartate shuttle, beta-alanine metabolism and
aspartate metabolism (Fig. S2).
Pathway bubble diagram analysis demonstrated that six pathways,
namely, histidine metabolism, D-glutamine and D-glutamate
metabolism, alanine, aspartate and glutamate metabolism, steroid
hormone biosynthesis, glycerophospholipid metabolism and arginine
biosynthesis, were significantly differentially expressed between
the patients with gout and the healthy group. Among these pathways,
D-glutamine and D-glutamate metabolism were identified as the key
nodes (Fig. 5).
Discussion
According to the results of the present study, UA
was demonstrated to be the metabolite with the highest AUC, which
suggested that UA may have the potential to distinguish patients
with gout compared with healthy individuals, a finding which has
been previously reported (20).
However, considering the recurrence and irregularity of gout, UA is
not sufficient as a single differential marker for the clinical
diagnosis of gout.
The differentially abundant metabolite with an AUC
second to that of UA was L-glutamic acid. Mahbub et al
(14) reported a positive
correlation between alanine, isoleucine, leucine, phenylalanine,
tryptophan and valine levels with gout, and glycine and serine
levels were negatively correlated with gout. As early as 1969,
Pagliara and Goodman reported that fasting plasma glutamate
concentrations in patients with gout were greater than those
compared with healthy people. The increase in glutamate may be
causally related to the overproduction of purines in gout (21). Glutamate is an essential amino acid
required for the de novo synthesis of purines, therefore,
the content changes in amino acids may affect UA production.
ILA is a metabolite of tryptophan breakdown and it
has been reported that plasma levels of this marker are reduced in
patients with cachexia (22),
which can also be used as a different marker in the cord serum of
newborns with preeclampsia (23).
The association between tryptophan and gout has been previously
reported (24), but the
association between ILA and patients with gout has not yet been
reported.
The differential marker 2-methylbutyroylcarnitine
has been reported to be important in diseases related to metabolic
disorders induced by a high fat diet and childhood obesity-related
traits in Mexican-American children (25,26).
Huang et al (27) reported
that the levels of 2-methylbutyroylcarnitine in the serum of
patients with gout were significantly greater compared with that of
healthy people.
Isobutyrylglycine was reported to be a potential
biomarker for the diagnosis of ulcerative colitis and acquired
pneumonia (28,29). Abnormal increase of
isobutyrylglycine in urine can cause the production of glutaric
aciduria type II (30). Organic
acidemia is an amino acid metabolic disorder that disrupts normal
amino acid metabolism causing a build-up of branched-chain amino
acids, which is consistent with the metabolic pathway of gout
development (31). However, no
studies to date have reported an association of isobutyrylglycine
and 2-hydroxy-3-methylbutyric acid with gout, which requires
further exploration in the future.
Eugenol is biosynthesized from tyrosine and has
antioxidant and antiproliferative effects (32). Anti-inflammatory activities have
potential roles in preventing cancer and inflammatory reactions
(33,34). Eugenol may have a potential role in
the treatment of gouty arthritis.
Another differentially expressed metabolite in the
serum of patients with gout and healthy people was
3-(3,4,5-trimethoxyphenyl)propanoic acid (27,35).
In summary, LC-MS-based nontargeted metabolomics was
used to detect serum changes in healthy people and patients with
gout. These results demonstrated significant metabolomic
differences between healthy subjects and patients with gout. ILA
may potentially serve as a potential biomarker for diagnosing gout
and could be used for the early detection or prediction of gout
progression. The present study has several limitations. First, due
to the demographics of the patients with gout, a large number of
the patients included in the study were younger than the healthy
subjects and the majority of patients with gout were men,
therefore, the two groups were not comparable in age or sex.
Second, the small sample size is a limitation of the present study.
The limitations of the results of the present study are with regard
to age, which was increased due to selection bias. The lack of data
for patient height, weight and BMI were also a limitation of the
present study. Due to the two groups not being randomized or
matched, there was a high risk of selection bias in the present
study. The ratio of 2:1 or 7:3 was used to divide individuals into
groups in previous studies (18,19).
However, when processing the data in the early stage of the present
study, it was found that the samples after 2:1 distribution were
scattered, so the ratio of 7:3 was selected to randomly distribute
the samples. In the future, longitudinal studies should be carried
out in combination with other omics studies, including proteomics
and genomics, or machine learning to identify additional potential
biomarkers and pathways involved in gout (36). In conclusion, the present study
demonstrated that ILA may serve as a potential biomarker for
diagnosing gout and could be used for the early detection or
prediction of gout progression in the future.
Supplementary Material
ROC curves of the top 10
differentially expressed endogenous metabolites in patients with
gout compared with healthy subjects. (A) Uric acid, (B) L-glutamic
acid, (C) benzaldehyde, (D) indolelactic acid, (E)
2-methylbutyroylcarnitine, (F) 2-hydroxy-3-methylbutyric acid, (G)
D-glutamic acid, (H) isobutyrylglycine, (I) eugenol and (J)
3-(3,4,5-trimethoxyphenyl) propanoic acid. AUC, area under the ROC
curve.
Metabolomic pathway enrichment
analysis of healthy subjects compared with patients with gout. CoA,
coenzyme A.
Differentially expressed metabolites
from healthy subjectscompared with patients with gout.
Acknowledgements
Not applicable.
Funding
Funding: This study was financially supported by The Talent
Project established by Chinese Pharmaceutical Association Hospital
Pharmacy Department (grant no. CPA-Z05-ZC-2023-003), The Jiangsu
Provincial Administration of Traditional Chinese Medicine (grant
nos. 2020ZX09 and MS2022014), The Special Fund for Science and
Technology Plan of Jiangsu Province in 2023 (Key Research and
Development Plan Social Development Project) (grant no. BE2023607)
and The Project of Jiangsu Province Hospital of Traditional Chinese
Medicine (grant no. y2021rc36).
Availability of data and materials
The data generated in the present study may be found
in the EMBL-EBI database under accession number MTBLS10032 or at
the following URL: www.ebi.ac.uk/metabolights/MTBLS10032.
Authors' contributions
YL, SL and TZ designed the study. SW and JZ
recruited patients for the study and collected serum samples. YZ,
JS and KZ collected the data, performed the statistical analyses,
interpreted the data and wrote the manuscript. All authors read and
approved the final version of the manuscript. YL and SL confirm the
authenticity of all the raw data.
Ethics approval and consent to
participate
The study was conducted in accordance with the
Declaration of Helsinki and approved by the Ethics Committee of the
Affiliated Hospital of Nanjing University of Traditional Chinese
Medicine (approval no. 2019NL-129-02).
Patient consent for publication
Not applicable.
Competing interests
The authors declare that they have no competing
interests.
References
|
1
|
Dalbeth N, Gosling AL, Gaffo A and
Abhishek A: Gout. Lancet. 397:1843–1855. 2021.PubMed/NCBI View Article : Google Scholar
|
|
2
|
Petty HR, Rathod-Mistry T, Menz HB and
Roddy E: Foot structure, pain and functional ability in people with
gout in primary care: Cross-sectional findings from the clinical
assessment study of the foot. J Foot Ankle Res.
12(8)2019.PubMed/NCBI View Article : Google Scholar
|
|
3
|
Singh G, Lingala B and Mithal A: Gout and
hyperuricaemia in the USA: Prevalence and trends. Rheumatology
(Oxford). 58:2177–2180. 2019.PubMed/NCBI View Article : Google Scholar
|
|
4
|
Pisaniello HL, Lester S, Gonzalez-Chica D,
Stocks N, Longo M, Sharplin GR, Dal Grande E, Gill TK, Whittle SL
and Hill CL: Gout prevalence and predictors of urate-lowering
therapy use: Results from a population-based study. Arthritis Res
Ther. 20(143)2018.PubMed/NCBI View Article : Google Scholar
|
|
5
|
Rai SK, Aviña-Zubieta JA, McCormick N, De
Vera MA, Shojania K, Sayre EC and Choi HK: The rising prevalence
and incidence of gout in British Columbia, Canada: Population-based
trends from 2000 to 2012. Semin Arthritis Rheum. 46:451–456.
2017.PubMed/NCBI View Article : Google Scholar
|
|
6
|
Kim JW, Kwak SG, Lee H, Kim SK, Choe JY
and Park SH: Prevalence and incidence of gout in Korea: Data from
the national health claims database 2007-2015. Rheumatol Int.
37:1499–1506. 2017.PubMed/NCBI View Article : Google Scholar
|
|
7
|
Liu R, Han C, Wu D, Xia X, Gu J, Guan H,
Shan Z and Teng W: Prevalence of hyperuricemia and gout in Mainland
China from 2000 to 2014: A systematic review and meta-analysis.
Biomed Res Int. 2015(762820)2015.PubMed/NCBI View Article : Google Scholar
|
|
8
|
Li X, Gao J and Tao J: Purinergic
signaling in the regulation of gout flare and resolution. Front
Immunol. 12(785425)2021.PubMed/NCBI View Article : Google Scholar
|
|
9
|
Richette P, Doherty M, Pascual E, Barskova
V, Becce F, Castañeda-Sanabria J, Coyfish M, Guillo S, Jansen TL,
Janssens H, et al: 2016 Updated EULAR evidence-based
recommendations for the management of gout. Ann Rheum Dis.
76:29–42. 2017.PubMed/NCBI View Article : Google Scholar
|
|
10
|
Fraga-Corral M, Carpena M, Garcia-Oliveira
P, Pereira AG, Prieto MA and Simal-Gandara J: Analytical
metabolomics and applications in health, environmental and food
science. Crit Rev Anal Chem. 52:712–734. 2022.PubMed/NCBI View Article : Google Scholar
|
|
11
|
Chen J, Li T, Huang D, Gong W, Tian J, Gao
X, Qin X, Du G and Zhou Y: Integrating UHPLC-MS/MS quantitative
analysis and exogenous purine supplementation to elucidate the
antidepressant mechanism of Chaigui granules by regulating purine
metabolism. J Pharm Anal. 13:1562–1576. 2023.PubMed/NCBI View Article : Google Scholar
|
|
12
|
Liu Y, Zhang X, Lin W, Kehriman N, Kuang W
and Ling X: Multi-factor combined biomarker screening strategy to
rapidly diagnose Alzheimer's disease and evaluate drug effect based
on a rat model. J Pharm Anal. 12:627–636. 2022.PubMed/NCBI View Article : Google Scholar
|
|
13
|
Yü TF, Adler M, Bobrow E and Gutman AB:
Plasma and urinary amino acids in primary gout, with special
reference to glutamine. J Clin Invest. 48:885–894. 1969.PubMed/NCBI View Article : Google Scholar
|
|
14
|
Mahbub MH, Yamaguchi N, Takahashi H, Hase
R, Amano H, Kobayashi-Miura M, Kanda H, Fujita Y, Yamamoto H,
Yamamoto M, et al: Alteration in plasma free amino acid levels and
its association with gout. Environ Health Prev Med.
22(7)2017.PubMed/NCBI View Article : Google Scholar
|
|
15
|
Dalbeth N, Choi HK, Joosten LAB, Khanna
PP, Matsuo H, Perez-Ruiz F and Stamp LK: Gout. Nat Rev Dis Primers.
5(69)2019.PubMed/NCBI View Article : Google Scholar
|
|
16
|
Li Q, Wei S, Wu D, Wen C and Zhou J:
Urinary metabolomics study of patients with gout using gas
chromatography-mass spectrometry. Biomed Res Int.
2018(3461572)2018.PubMed/NCBI View Article : Google Scholar
|
|
17
|
Neogi T, Jansen TLTA, Dalbeth N, Fransen
J, Schumacher HR, Berendsen D, Brown M, Choi H, Edwards NL,
Janssens HJEM, et al: 2015 Gout classification criteria: An
American college of rheumatology/European league against rheumatism
collaborative initiative. Ann Rheum Dis. 74:1789–1798.
2015.PubMed/NCBI View Article : Google Scholar
|
|
18
|
Liu H, Xu M, He Q, Wei P, Ke M and Liu S:
Untargeted serum metabolomics reveals specific metabolite
abnormalities in patients with Crohn's disease. Front Med
(Lausanne). 9(814839)2022.PubMed/NCBI View Article : Google Scholar
|
|
19
|
Luan H, Gu W, Li H, Wang Z, Lu L, Ke M, Lu
J, Chen W, Lan Z, Xiao Y, et al: Serum metabolomic and lipidomic
profiling identifies diagnostic biomarkers for seropositive and
seronegative rheumatoid arthritis patients. J Transl Med.
19(500)2021.PubMed/NCBI View Article : Google Scholar
|
|
20
|
Kuo CF, Grainge MJ, Mallen C, Zhang W and
Doherty M: Comorbidities in patients with gout prior to and
following diagnosis: Case-control study. Ann Rheum Dis. 75:210–217.
2016.PubMed/NCBI View Article : Google Scholar
|
|
21
|
Pagliara AS and Goodman AD: Elevation of
plasma glutamate in gout. Its possible role in the pathogenesis of
hyperuricemia. N Engl J Med. 281:767–770. 1969.PubMed/NCBI View Article : Google Scholar
|
|
22
|
Servià L, Jové M, Sol J, Pamplona R, Badia
M, Montserrat N, Portero-Otin M and Trujillano J: A prospective
pilot study using metabolomics discloses specific fatty acid,
catecholamine and tryptophan metabolic pathways as possible
predictors for a negative outcome after severe trauma. Scand J
Trauma Resusc Emerg Med. 27(56)2019.PubMed/NCBI View Article : Google Scholar
|
|
23
|
Wang X, Liu J, Hui X and Song Y:
Metabolomics applied to cord serum in preeclampsia newborns:
Implications for neonatal outcomes. Front Pediatr.
10(869381)2022.PubMed/NCBI View Article : Google Scholar
|
|
24
|
Liu Z, Jin L, Ma Z, Nizhamuding X, Zeng J,
Zhang T, Zhang J, Zhou W and Zhang C: Abnormal kynurenine-pathway
metabolites in gout: Biomarkers exploration based on orthogonal
partial least squares-discriminant analysis. Clin Chim Acta.
549(117531)2023.PubMed/NCBI View Article : Google Scholar
|
|
25
|
Suo H, Shishir MRI, Wang Q, Wang M, Chen F
and Cheng KW: Red wine high-molecular-weight polyphenolic complex
ameliorates high-fat diet-induced metabolic dysregulation and
perturbation in gut microbiota in mice. J Agric Food Chem.
71:6882–6893. 2023.PubMed/NCBI View Article : Google Scholar
|
|
26
|
Farook VS, Reddivari L, Chittoor G,
Puppala S, Arya R, Fowler SP, Hunt KJ, Curran JE, Comuzzie AG,
Lehman DM, et al: Metabolites as novel biomarkers for childhood
obesity-related traits in Mexican-American children. Pediatr Obes.
10:320–327. 2015.PubMed/NCBI View
Article : Google Scholar
|
|
27
|
Huang Y, Xiao M, Ou J, Lv Q, Wei Q, Chen
Z, Wu J, Tu L, Jiang Y, Zhang X, et al: Identification of the urine
and serum metabolomics signature of gout. Rheumatology (Oxford).
59:2960–2969. 2020.PubMed/NCBI View Article : Google Scholar
|
|
28
|
Liu K, Jia B, Zhou L, Xing L, Wu L, Li Y,
Lu J, Zhang L and Guan S: Ultraperformance liquid chromatography
coupled with quadrupole time-of-flight mass spectrometry-based
metabolomics and lipidomics identify biomarkers for efficacy
evaluation of mesalazine in a dextran sulfate sodium-induced
ulcerative colitis mouse model. J Proteome Res. 20:1371–1381.
2021.PubMed/NCBI View Article : Google Scholar
|
|
29
|
Zhou B, Lou B, Liu J and She J: Serum
metabolite profiles as potential biochemical markers in young
adults with community-acquired pneumonia cured by moxifloxacin
therapy. Sci Rep. 10(4436)2020.PubMed/NCBI View Article : Google Scholar
|
|
30
|
Popek M, Walter M, Fernando M, Lindner M,
Schwab KO and Sass JO: Two inborn errors of metabolism in a
newborn: Glutaric aciduria type I combined with
isobutyrylglycinuria. Clin Chim Acta. 411:2087–2091.
2010.PubMed/NCBI View Article : Google Scholar
|
|
31
|
Reddy N, Calloni SF, Vernon HJ,
Boltshauser E, Huisman TAGM and Soares BP: Neuroimaging findings of
organic acidemias and aminoacidopathies. Radiographics. 38:912–931.
2018.PubMed/NCBI View Article : Google Scholar
|
|
32
|
Jaganathan SK and Supriyanto E:
Antiproliferative and molecular mechanism of eugenol-induced
apoptosis in cancer cells. Molecules. 17:6290–3304. 2012.PubMed/NCBI View Article : Google Scholar
|
|
33
|
Fujisawa S and Murakami Y: Eugenol and its
role in chronic diseases. Adv Exp Med Biol. 929:45–66.
2016.PubMed/NCBI View Article : Google Scholar
|
|
34
|
Taleuzzaman M, Jain P, Verma R, Iqbal Z
and Mirza MA: Eugenol as a potential drug candidate: A review. Curr
Top Med Chem. 21:1804–1815. 2021.PubMed/NCBI View Article : Google Scholar
|
|
35
|
Zhong Z, Huang Y, Huang Q, Zheng S, Huang
Z, Deng W and Li T: Serum metabolic profiling analysis of gout
patients based on UPLC-Q-TOF/MS. Clin Chim Acta. 515:52–60.
2021.PubMed/NCBI View Article : Google Scholar
|
|
36
|
Chen Z, Huang X, Gao Y, Zeng S and Mao W:
Plasma-metabolite-based machine learning is a promising diagnostic
approach for esophageal squamous cell carcinoma investigation. J
Pharm Anal. 11:505–514. 2021.PubMed/NCBI View Article : Google Scholar
|