Introduction
Esophageal cancer (EC) is a lethal illness with high
incidence globally and significant numbers of new cases in the USA
(1–3). If it is diagnosed as localized
cancer, it is often treated with chemoradiation therapy plus minus
surgery (depending on the extent of the cancer and whether patient
can withstand surgery) (4,5), however, finding residual cancer in
the surgical specimen (6,7) or high rate of relapse or persistence
of cancer is common (8). This
suggests that EC is an inherently resistant cancer. We have
previously reported that hedgehog (Hh) pathway is often upregulated
in EC and mediates therapy resistance (9,10).
We also reported that mTOR pathways is often activated and can be
the source of secondary resistance to Hh inhibition (11,12).
Intriguingly, the mTOR pathways along with Hh (and other) pathways
have been implicated in the maintenance of cancer stem cells (CSCs)
(13–17).
There has been considerable interest in the
anti-diabetic agent metformin that induces AMPK-dependent
inhibition of IGF-1 ultimately leading to inhibition of mTORC1.
Metformin also silences mTORC1 through LKB1 and eventually it is
able to shut down ERK1/2 (18).
Loss of LKB1 is known to confer aggressive phenotype to some
esophageal cancer cells (19). We
previously reported a retrospective analysis of esophageal
adenocarcinoma (EAC) patients who were on metformin for diabetes
and compared their outcome with those EAC patients who were not
taking metformin (20). In this
small cohort comparison, patients who were taking metformin had
better response to chemoradiation therapy.
Taking the literature and our clinical experience
with metformin in EAC together, we have carried out a number of
non-clinical experiments to document metformin’s role in EC CSCs
and the mTOR pathway and demonstrated that metformin can complement
other traditional therapies to effectively treat EC patients.
Materials and methods
Cells and reagents
The human EAC cell lines FLO-1, BE3, SKGT-4, OE33,
JHESO and OACP were kindly provided by Dr Uma Raja and Dr Mien-Chie
Hung [University of Texas (UT) M.D. Anderson Cancer Center,
Houston, TX, USA] and have been previously described (21,22).
The human esophageal squamous carcinoma (SCC) cell lines-YES-6 and
KATO-TN were kindly provided by Dr Health Skinner (UT M.D. Anderson
Cancer Center). These cell lines were authorized and
re-characterized in the characterized cell line core facility of UT
M.D. Anderson Cancer Center every 6 months. Metformin was obtained
from Calbiochem (San Diego, CA, USA). 5-FU was obtained from Sigma
(St. Louis, MO, USA). Antibodies phospho-AKT, phospho-S6 (235),
phospho-70S6, Jagged1 and MCL were purchased from Cell Signaling
(Beverly, MA, USA). The antibodies Shh and ALDH1 were from Abcam
(Cambridge, MA, USA). YAP1 was purchased from Santa Cruz
Biotechnology (Santa Cruz, CA, USA); SOX9 was purchased from
Chemicon (Billerica, MA, USA).
Cell proliferation assay
Cell proliferation assays were performed using the
Cell Titer 96 aqueous non-radioactive cell proliferation assay
(MTS) according to the instructions of the manufacturer (Promega
Co., Madison, WI, USA). All assays were performed in triplicate and
repeated at least three times.
Flow cytometric labeling and
fluorescence-activated cell sorting
ALDH1 activity was assessed by
fluorescence-activated cell sorting in EAC cell line JHESO
according to the ALDEFLUOR based cell detection kit (Stemcell
Technologies Inc, Vancouver, BC, Canada) following the protocol and
Diethylaminobenzaldehyde (DEAB) was used to inhibit ALDH-1 activity
to show the specificity of the detection. ALDH1 positive or
negative cells were sorted from JHESO EAC cells by
fluorescence-activated cell sorting according to the ALDEFLUOR
detection kit. ALDEFLUOR/DEAB treated cells were used to define
negative gates. FACS was performed with >1×10⁶ cells
using the BD FACSCanto II (Becton-Dickinson, Franklin Lakes, NJ,
USA) or FACSAria (Becton-Dickinson).
Tumorsphere formation assay
Sphere culture was performed as previously described
(24). Briefly, Single EAC cells
or FACS-isolated ALDH1+ or ALDH1− cell populations (1,000/well)
were seeded in triplicate onto a 6-well ultra-low attachment plate.
After 10–14 days of culture, the number of tumorspheres formed
(diameter >100 μm) was counted under microscope.
Protein extraction and western blot
analysis
Protein isolation and western blot analyses were
performed as previously described (25).
Reverse-phase protein arrays (RPPA)
RPPA analysis was performed in cell lysate from
JHESO cells control and treated with 10 mM metformin for 48 h in
RPPA core facility, the UT M.D. Anderson Cancer Center. Samples
were serially diluted 2-fold for 5 dilutions and probed with 175
antibodies and arrayed on nitrocellulose-coated slides. Relative
protein levels were normalized for protein loading and determined
by interpolation of each dilution curve from the standard curve as
previously described (28).
Transient transfection and luciferase
reporter assays
Jagged1 luciferase promoter construct was provided
by Dr Randy Johnson and has been previously described (23). SOX9 luciferase promoter construct
has been previously described (24). Transient co-transfection with
luciferase reporters and Renilla vector were performed as
previously described (24).
Indirect immunofluorescence and flow
cytometry
Indirect immunofluorescence staining was performed
as described (25). Putative
cancer stem cells was labeled by indirect anti-OCT4 antibody and
anti-ALDH1 at 1:100 and analyzed by flow cytometry using BD
FACSCalibur (BD Biosciences, Franklin Lakes, NJ, USA).
Flow cytometric and apoptotic
analysis
Flow cytometric analysis was performed as described
(24). In briefly, SKGT-4 and
Yes-6 cells were seeded onto 6-well plates (1×10⁵ per
well) in DMEM and cultured for 24 h to allow cell attachment. The
cells were then treated with 0.1% DMSO or metformin at 10 mM, 5-FU
at 10 μM or in combination of both for 48 h. The cells were then
harvested, fixed with methanol, washed, treated with RNase A, and
stained for DNA with propidium iodide (Sigma) and then were
analyzed for DNA histograms and cell cycle phase distribution by
flow cytometry using a FACSCalibur instrument (Becton-Dickinson).
To determine whether the cells treated with metformin underwent
apoptosis, cells treated with up to 10 mM metformin for 48 h and
washed in PBS, resuspended in 100 μl of binding buffer containing
FITC-conjugated Annexin V, and analyzed by flow cytometry to
determine the apoptosis index.
Xenograft mouse model
JHESO EAC cells were subcutaneously injected with
2×10⁶ cells in nude mice. When tumors reached a size of
approximately 50 mm2, mice were divided by four groups:
buffer alone (control), metformin (200 μg/ml) in drinking water
daily, 5-FU at 20 mg/kg/mouse was treated by i.p. injections and
the combination of metformin and 5-FU. n=5 for each group. The
tumor size was measured by using a digital caliper (VWR
International, Radnor, PA, USA), and the tumor volume was
determined with the formula: tumor volume [mm3] =
(length [mm])*(width [mm])2*0.52. All the
measurements were compared using unpaired Student’s t-test.
Statistical analysis
Data were analyzed using the Student’s t-test. A
P-value of <0.05 was required for statistical significance, and
all tests were two-sided. All tests were done with SPSS 10.1
software (SPSS, Inc., Chicago, IL, USA).
Results
Metformin inhibits tumor cell growth and
sensitizes chemotherapy in human esophageal cancer cells
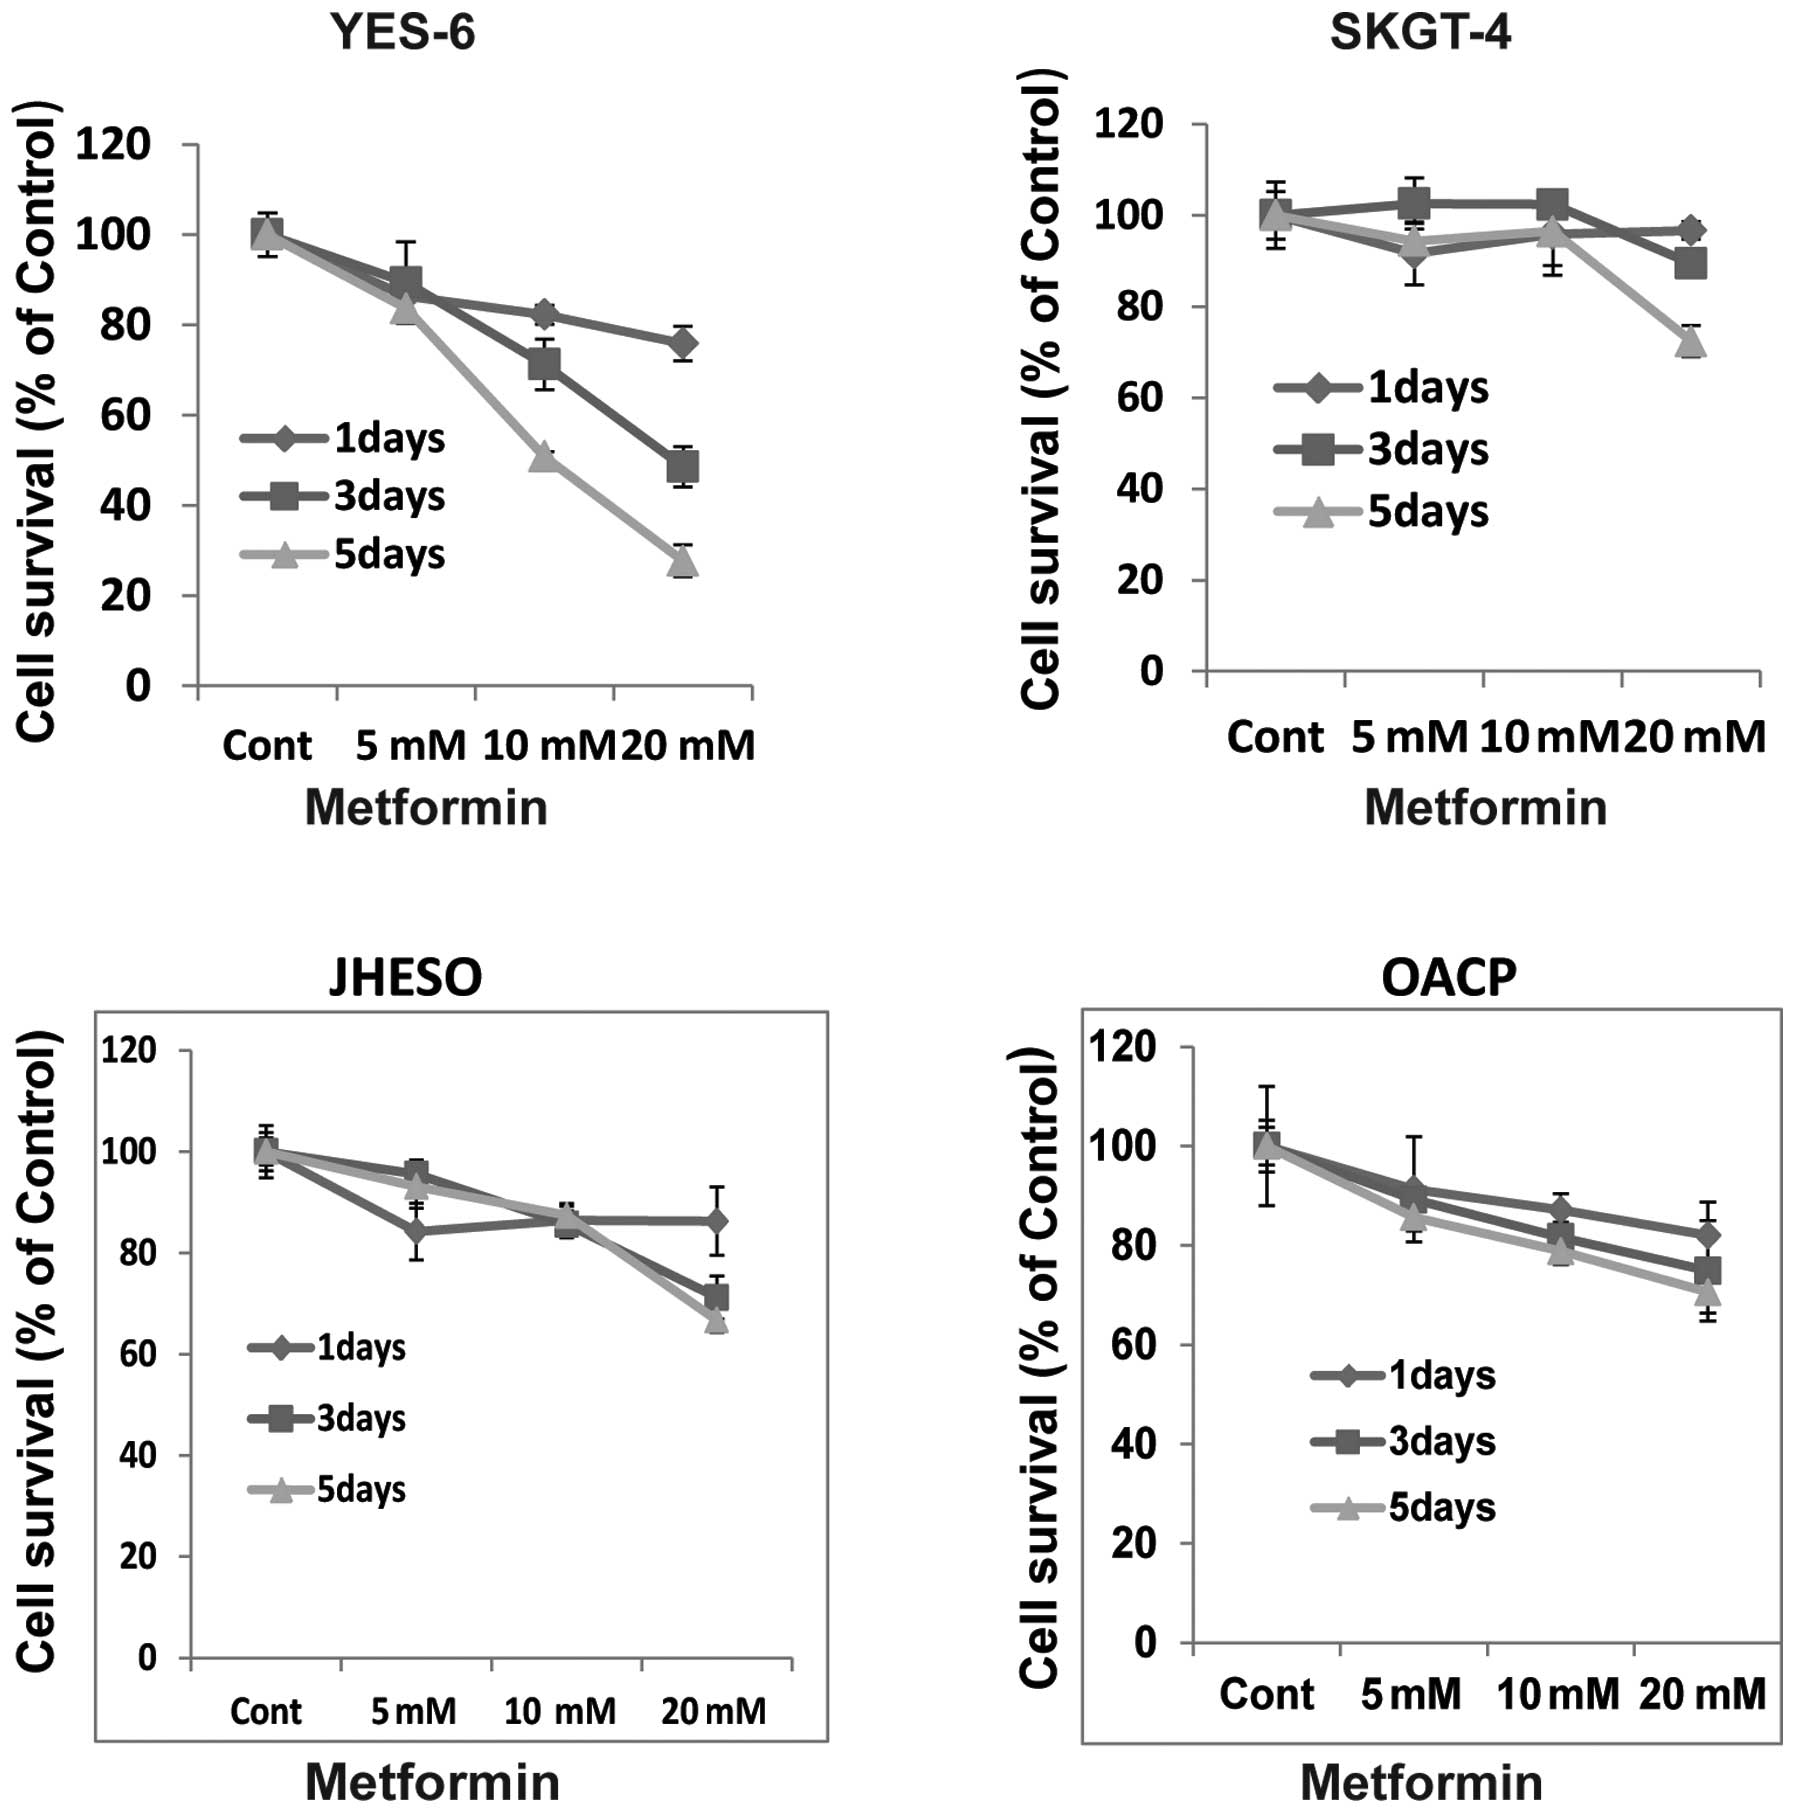
To evaluate the effects of the growth activity of
metformin on human esophageal cancer cells in vitro, we
examined the effects of metformin on four EC cell lines, YES-6,
SKGT-4, JHESO and OACP. A dose- and time-dependent inhibition of
cell proliferation was observed in YES-6, OACP cells and JHESO
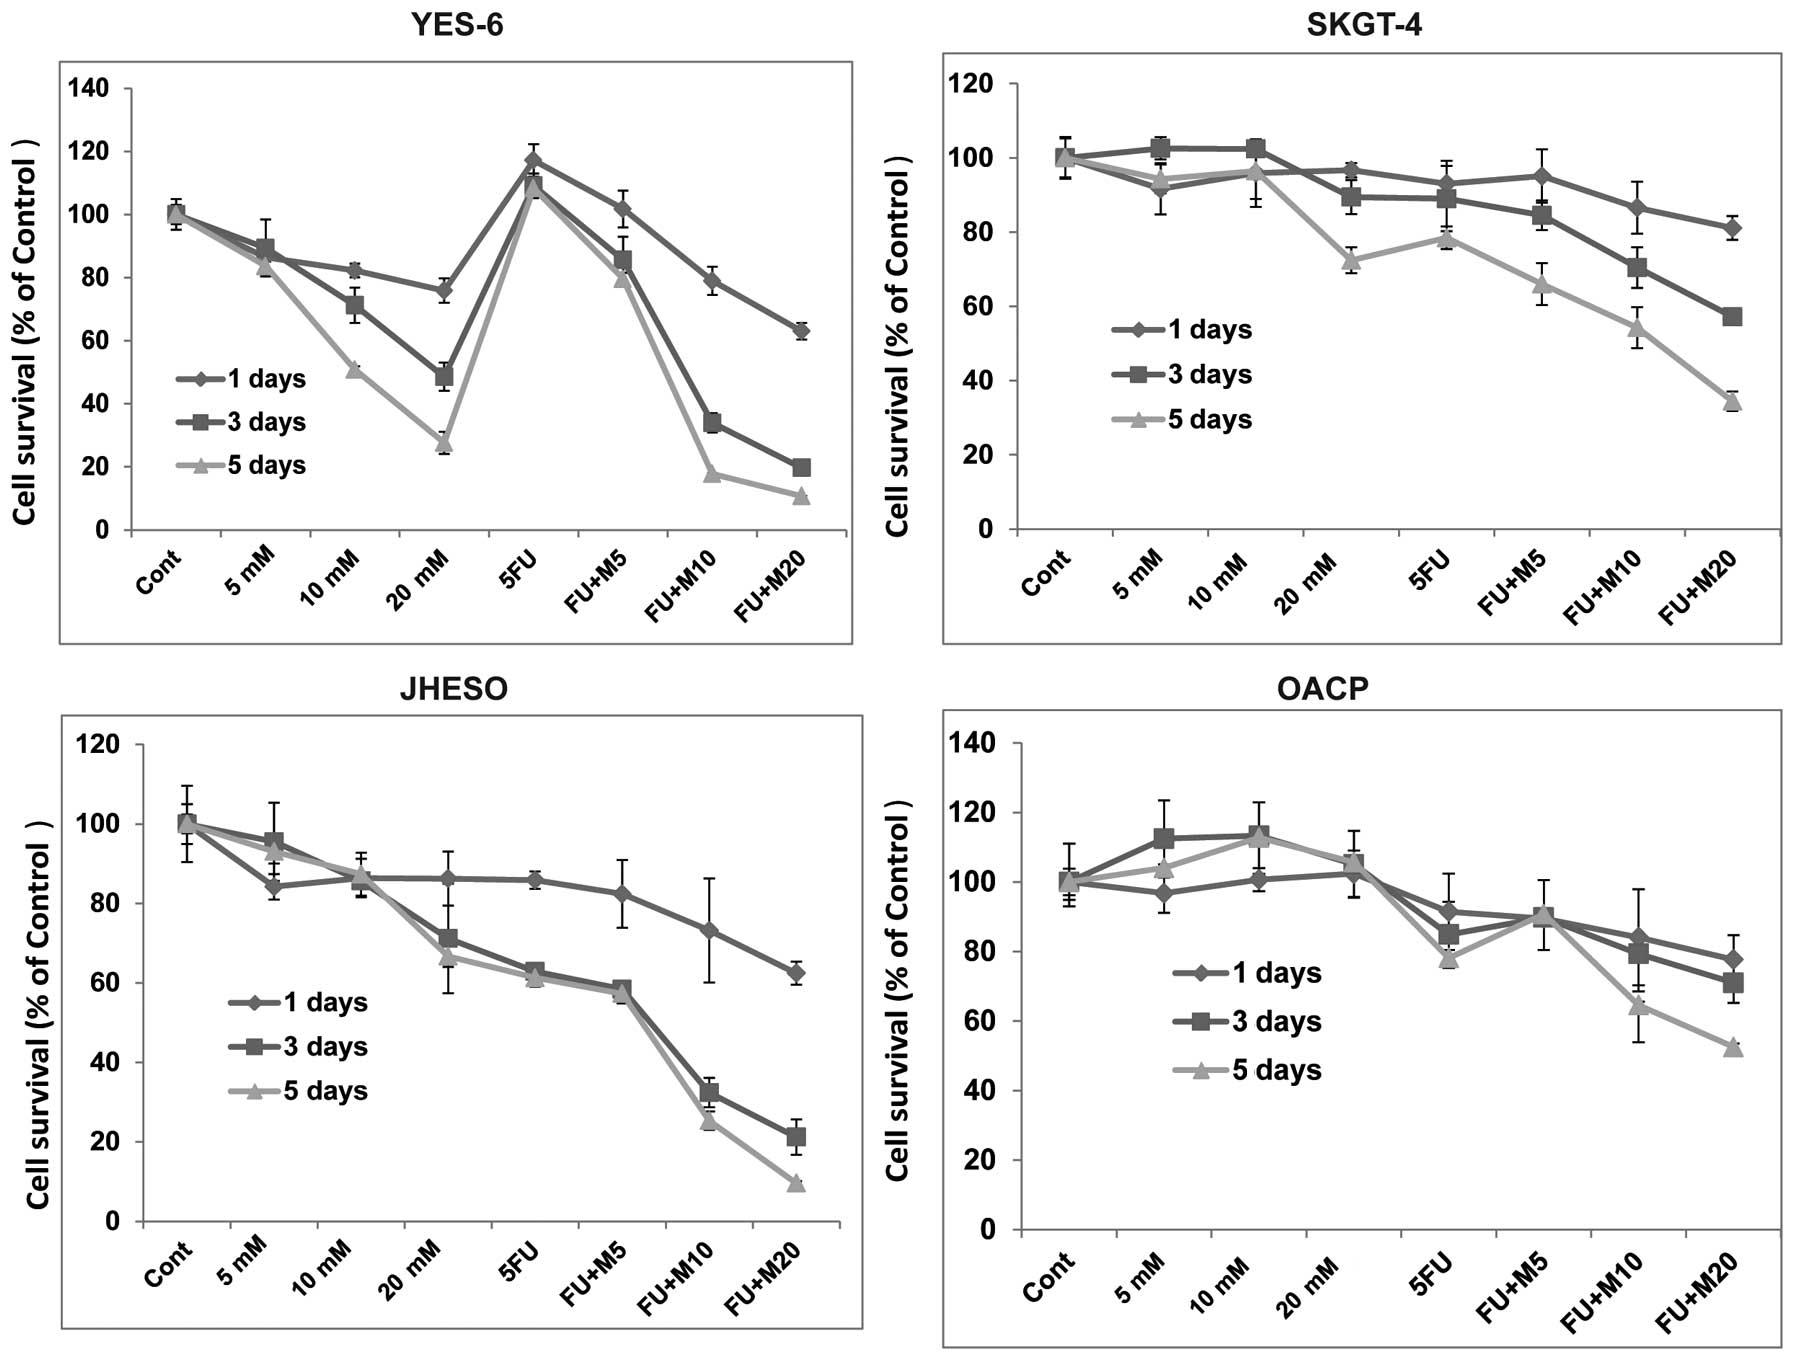
cells but less effective in SKGT-4 (Fig. 1). However, synergistic inhibition
of cell proliferation was noted in all these cell lines when
metformin in combination with 5-FU indicating metformin sensitize
5-FU on inhibition of EC cell growth (Fig. 2).
Metformin induces apoptosis in EC
cells
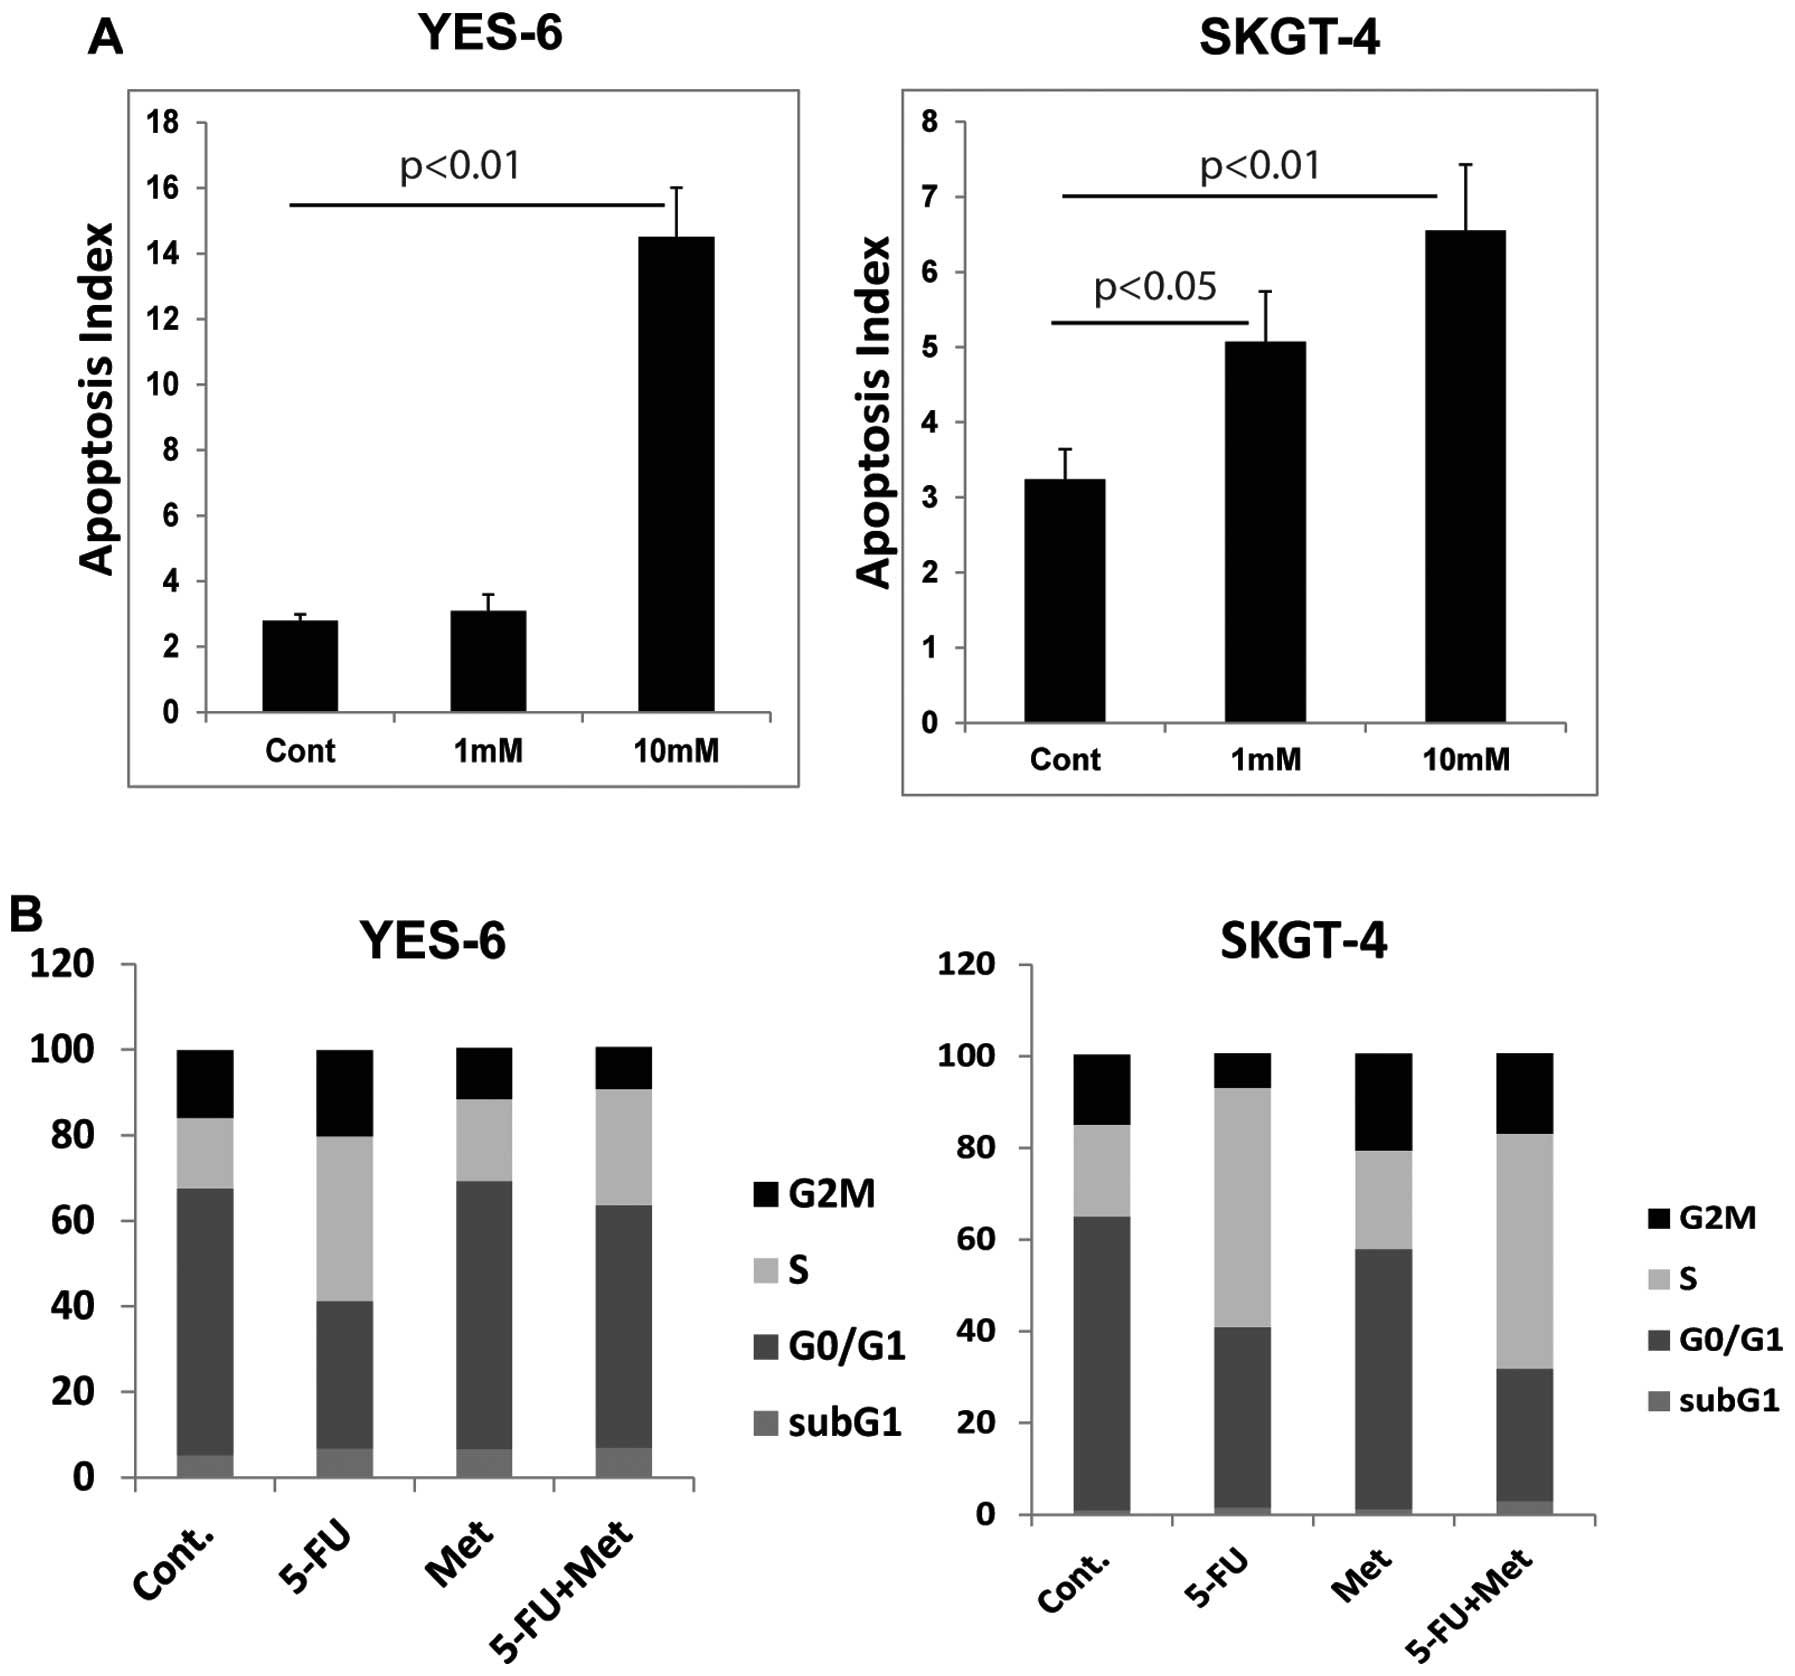
Metformin increase the number of cells with
apoptosis in a dose-dependent manner in YES-6 cells and SKGT-4
cells (Fig. 3A). 5-FU alone
dramatically increased S phase arrest in these EC cells (Fig. 3B), while the combination of
metformin and 5-FU reduced the proportion of S phase cells and
increase the apoptotic cell population.
Metformin suppresses CSC-related gene
expression in EC cells
Metformin as a CSC targeting agent in breast cancer
and ovarian cancer has been previously reported (17,26).
We sought to determine whether metformin acts on CSCs population
and CSC-related genes in EC cell lines. We therefore first assessed
whether CSC-related genes are elevated in EC cell lines. Eight
cancer cell lines and two Barrett’s esophagus (BE) cell lines were
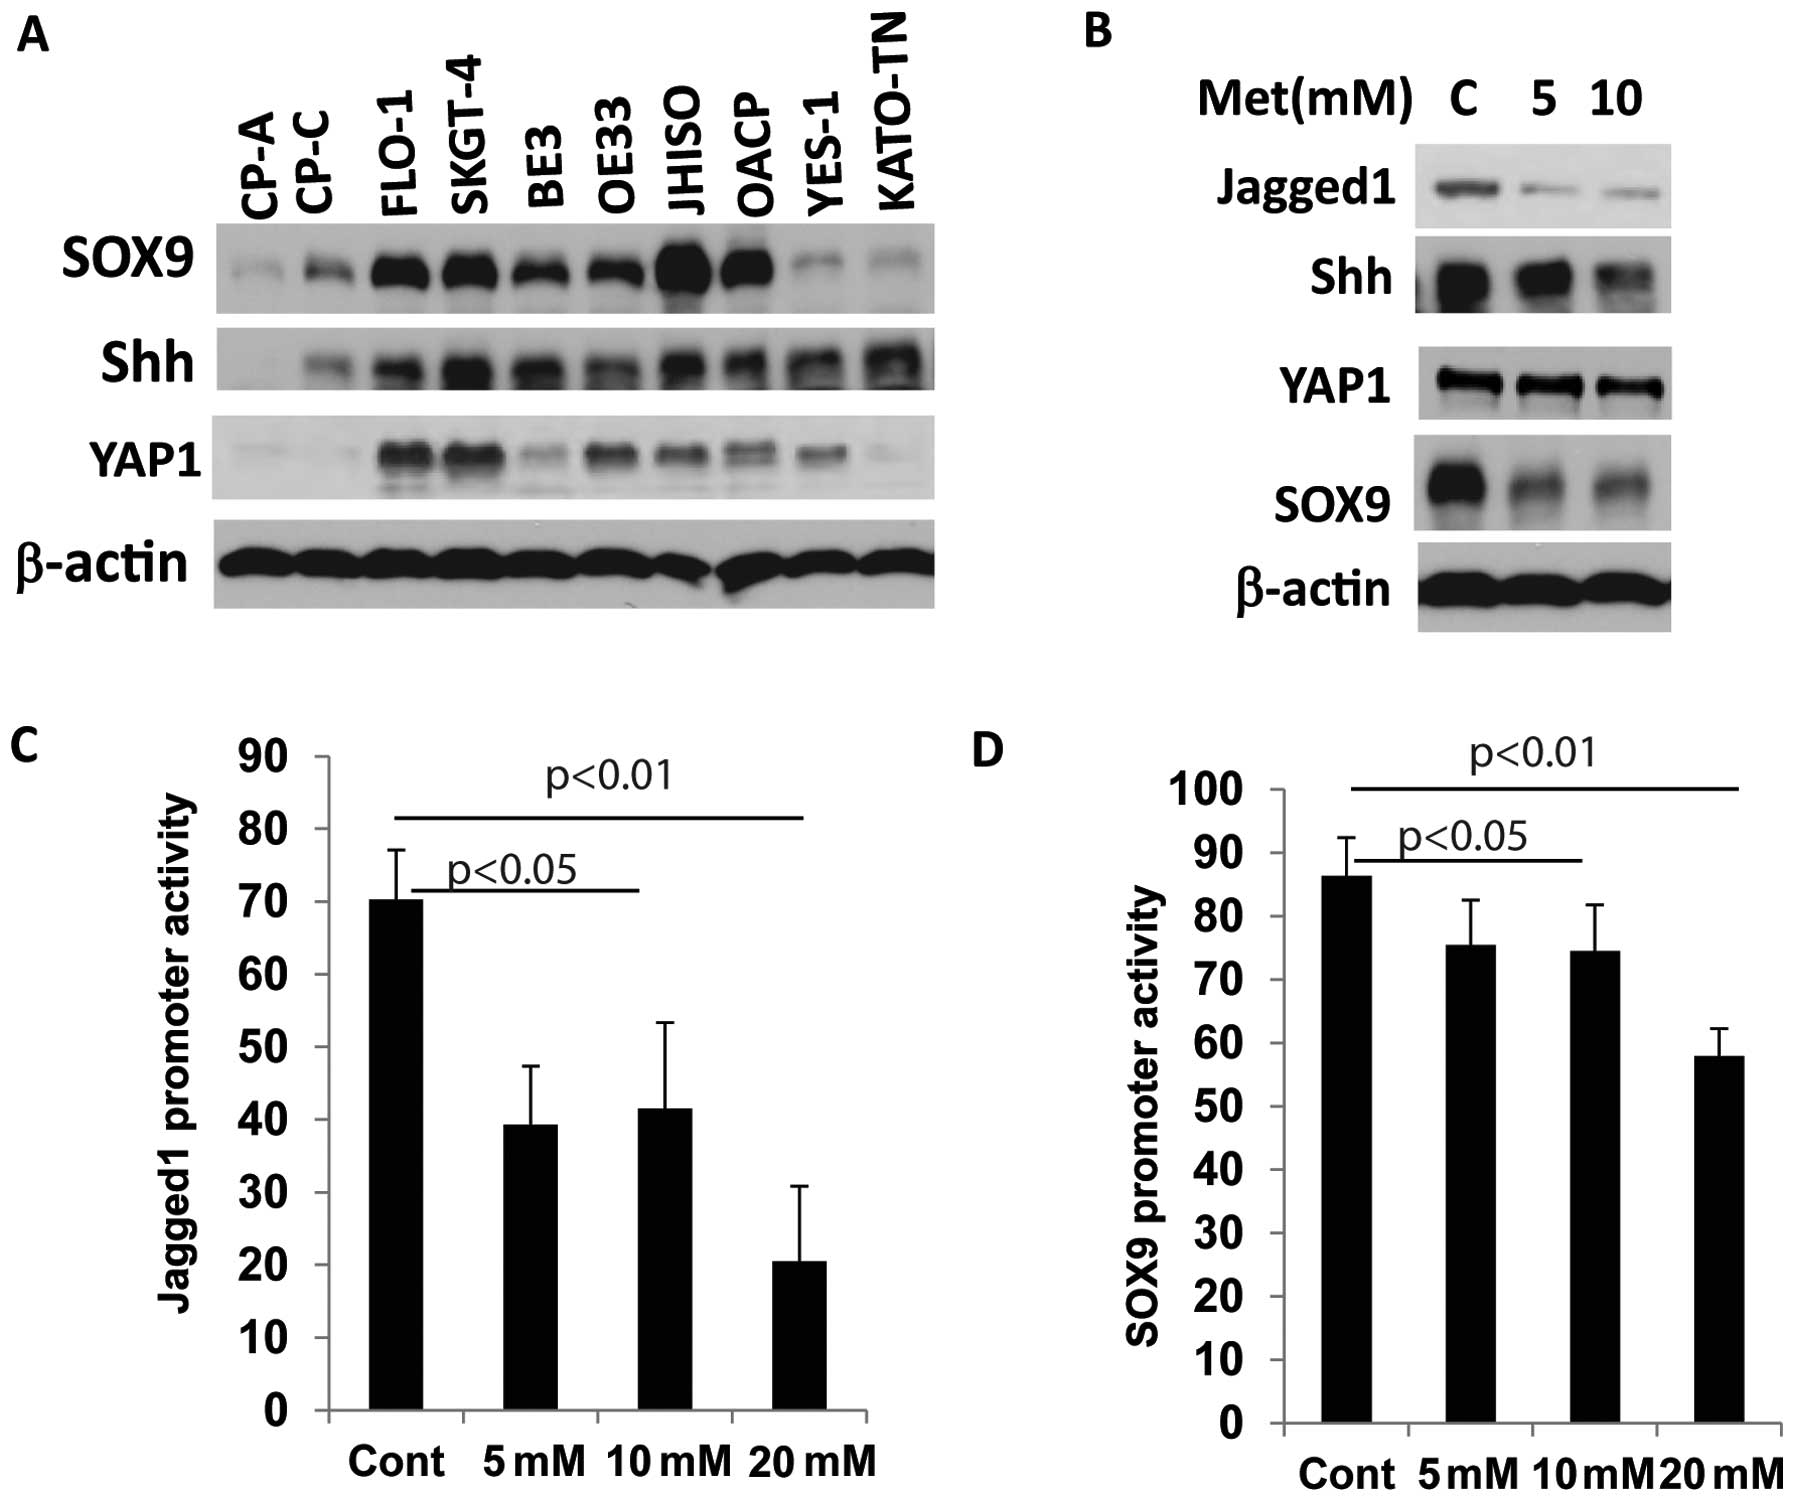
immunoblotted for the expression of CSC- related genes SOX9, YAP1
and Shh (Fig. 4A). SOX9, Shh and
YAP1 were overexpressed in many cancer cell lines compared to BE
cell lines (CP-A and CP-C) indicating the activation of stem cell
signaling in EC cells. When metformin was exposed at increasing
concentrations, expression of the CSC-related genes SOX9, Jagged1
and Shh were greatly reduced (Fig.
4B).
We then explored whether metformin affects
transcription of CSC-related genes by affecting their promoter
activity. In YES-6 and JHESO cells, co-transfected with Jagged1 or
SOX9 luciferase reporter and pCH110 as an internal control vector
were exposed to various concentration of metformin. Luciferase
reporter activity was measured after 24 h and demonstrated a
dose-dependent reduction in both of Jagged1 and SOX9 promoter
activities in EC cells in concert with their reduction in
expression levels (Fig. 4C and
D).
Metformin targets EC cancer stem cells
(CSCs)
Given metformin as an effect agent targeting
CSC-related genes, we investigated the impact of metformin on EC
CSCs. We have experienced that ALDH1 is a reliable CSC marker in EC
tumor cells and CSCs are characterized by their ability to form
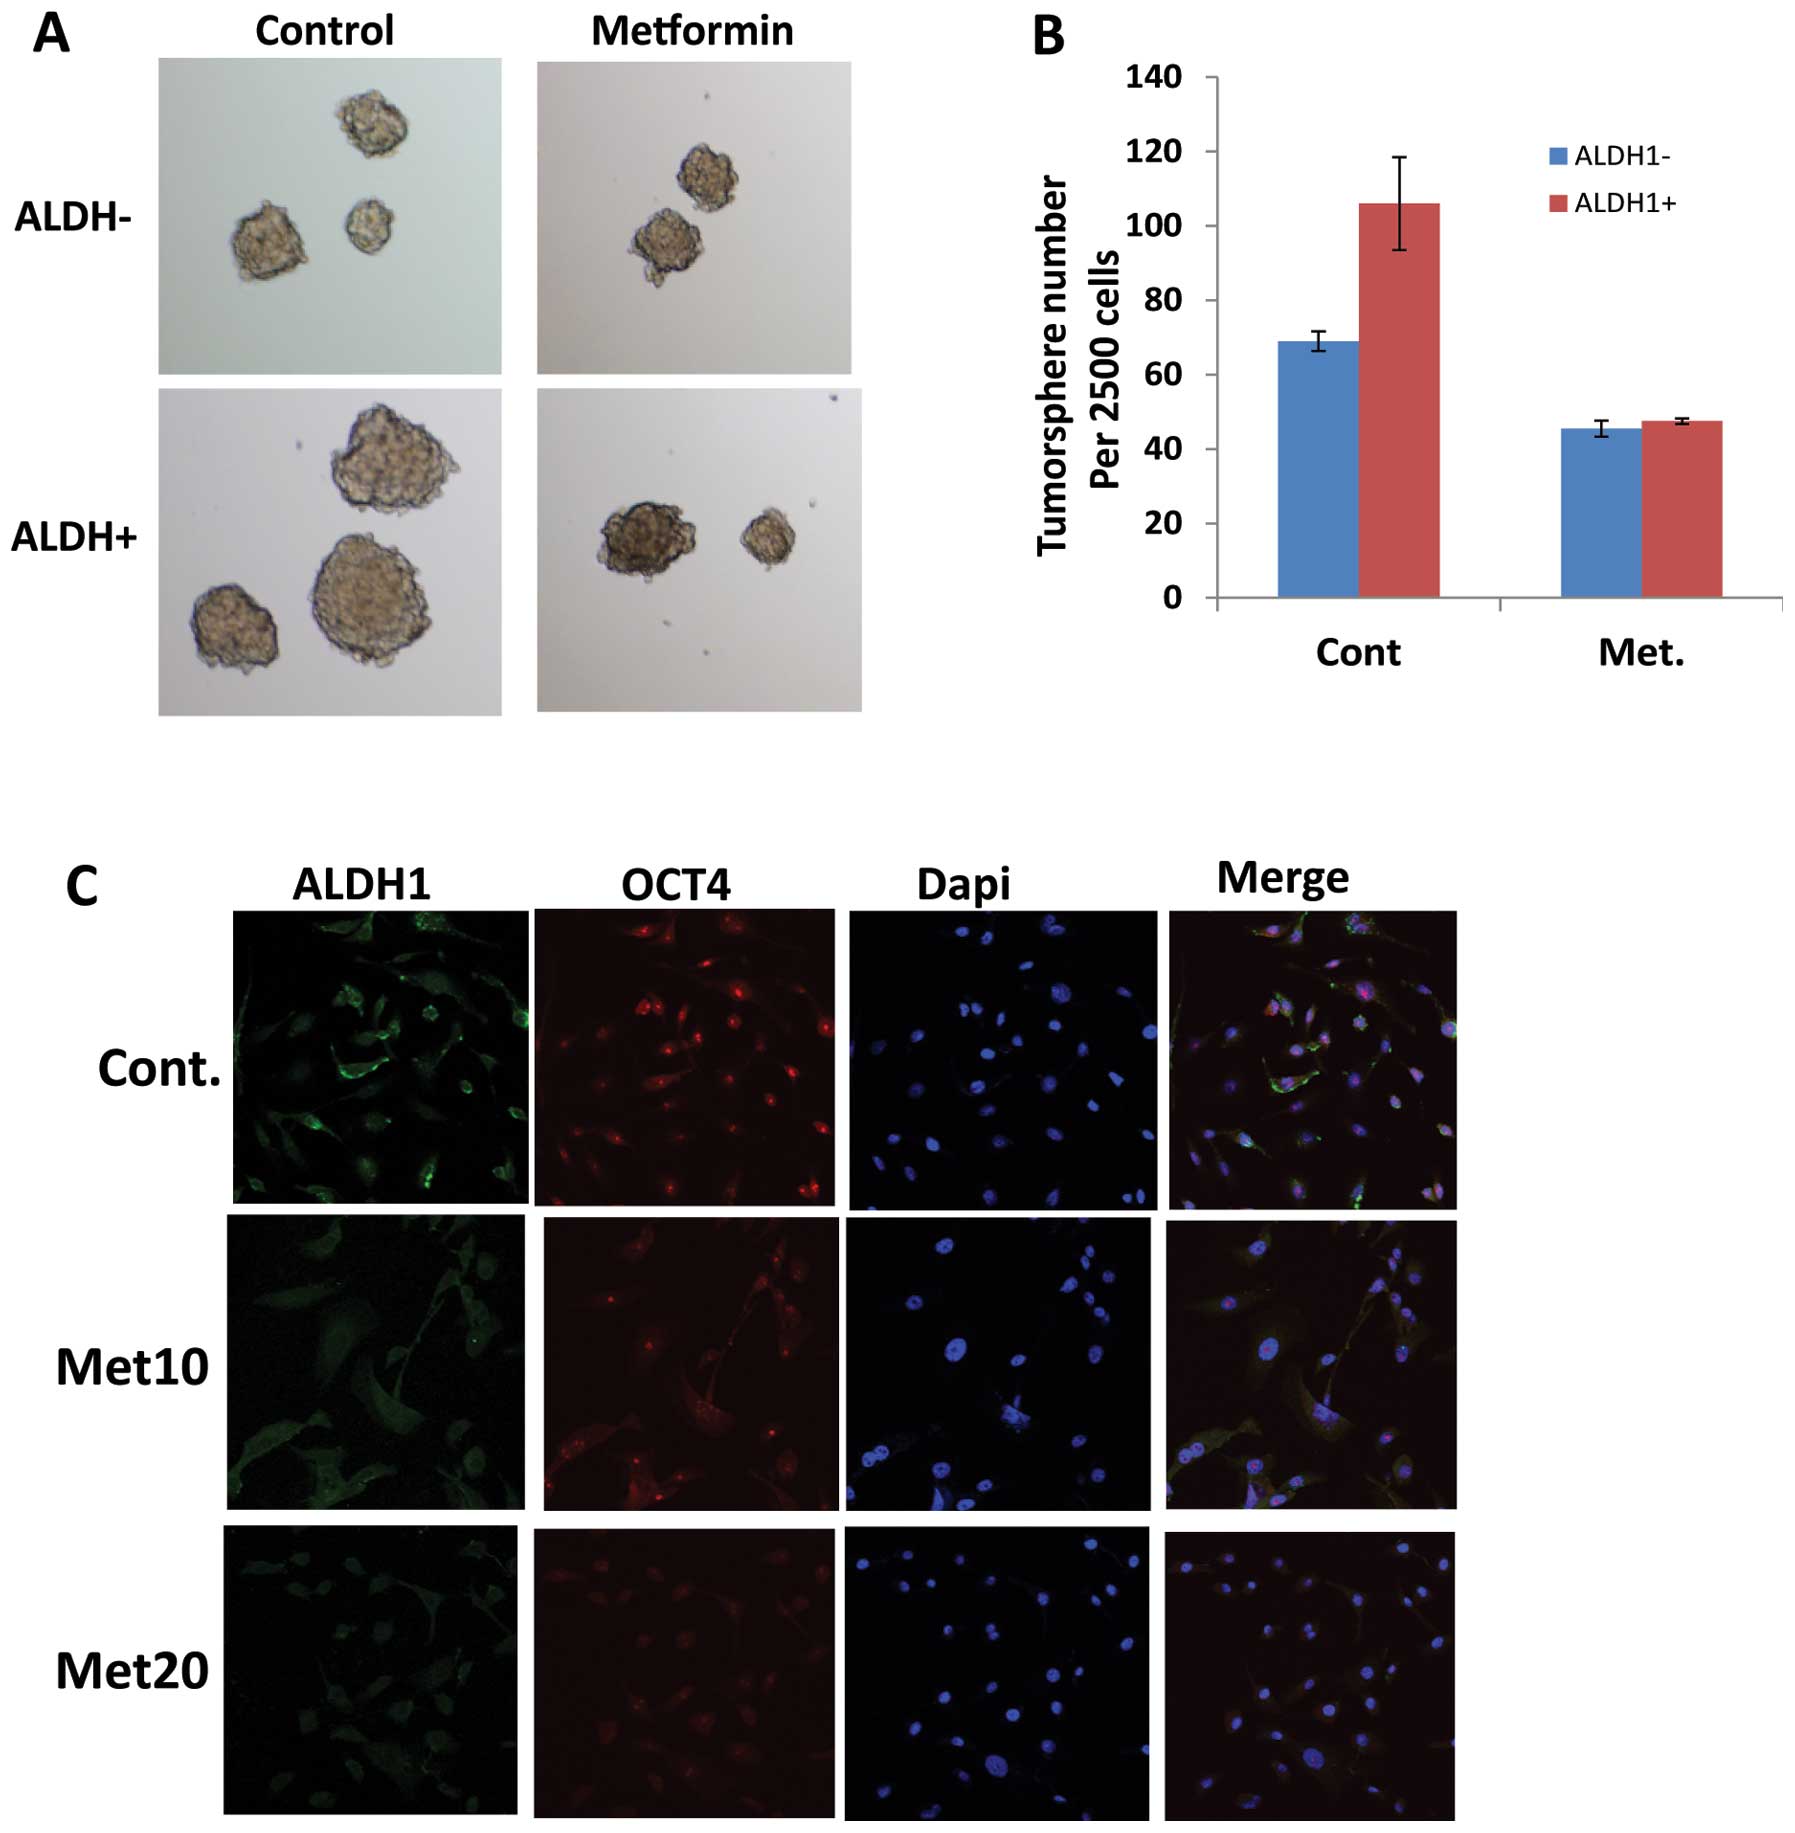
tumor spheres in suspension in serum-free medium. Therefore, JHESO
cells were first sorted to separate ALDH1+ and ALDH1− cells. Tumor
sphere forming capability was studied in the JHESO ALDH1+ and
ALDH1− cells. Results in Fig. 5A
demonstrate that ALDH1+ cells formed larger tumorspheres but this
capability was significantly reduced by metformin (Fig. 5A and B). Metformin also reduced the
fraction of ALDH1+ cells in the JHESO cells (data not shown). In
addition, metformin suppressed the CSC markers ALDH-1 and OCT4 in a
dose-dependent manner by immunofluorescence (Fig. 5C). These data indicate that
metformin targets EC CSCs.
RPPA proteomic analysis on metformin
treated JHESO cells and in combination of 5-FU and metformin on
CSC-related genes and mTOR components
We next sought to define the mechanisms by which
metformin decreased cell growth and sensitize EC cells to 5-FU.
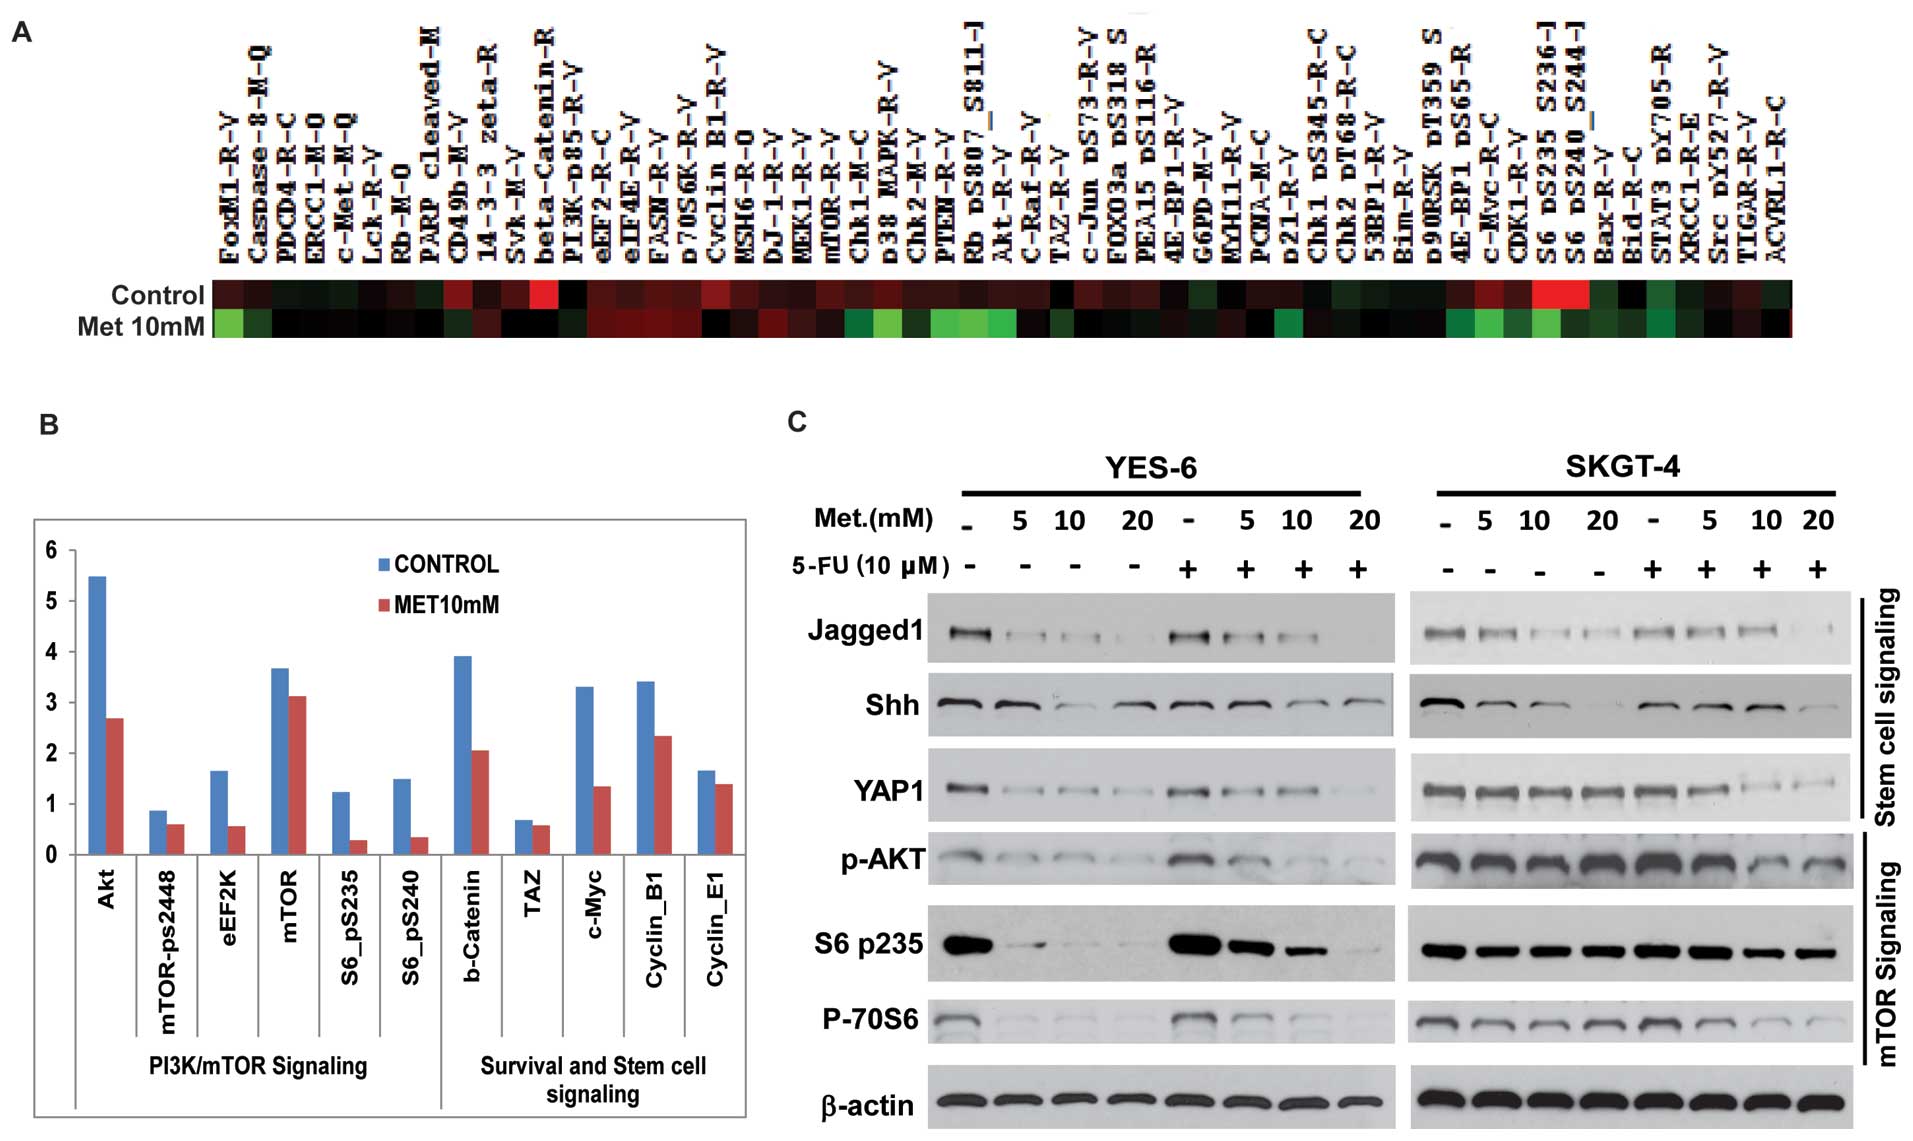
Cell lysate from JHESO cells treated with metformin at 10 mM for 48
h and its control was performed RPPA proteomic array assays. As
demonstrated in Fig. 6A, many
oncogenic genes were downregulated by treatment of metformin. As
shown in Fig. 6B, the most reduced
ones are proteins in the PI3K/mTOR signaling including
phospho-S6-p-235 and phospho-S6p-240 and AKT and genes (β-catenin
and C-MYC) in stem cell signaling.
To further confirm whether these genes were
downregulated by metformin and in combination of chemo-agent 5-FU
in EC cell lines, western blot analyses were performed in YES-6 and
SKGT-4 cells. As shown in Fig. 6C,
metformin alone strongly decreased the expression of stem cell
signaling markers (Jagged1, Shh, YAP1) and mTOR pathway
components-phospho-AKT, phosphor-S6, phosphor-70S6 in a
dose-dependent manner. The addition of 5-FU to different dosage of
metformin further reduced expression of various CSC related genes
(Jagged1, Shh, YAP1) and mTOR (p-AKT, p-70S6 and pS6) components in
both EC cell lines indicating metformin inhibits EC cell
proliferation and sensitize cells to 5-FU by targeting both CSCs
and mTOR pathways.
Metformin inhibits tumor growth
especially when in combination with 5-FU in vivo
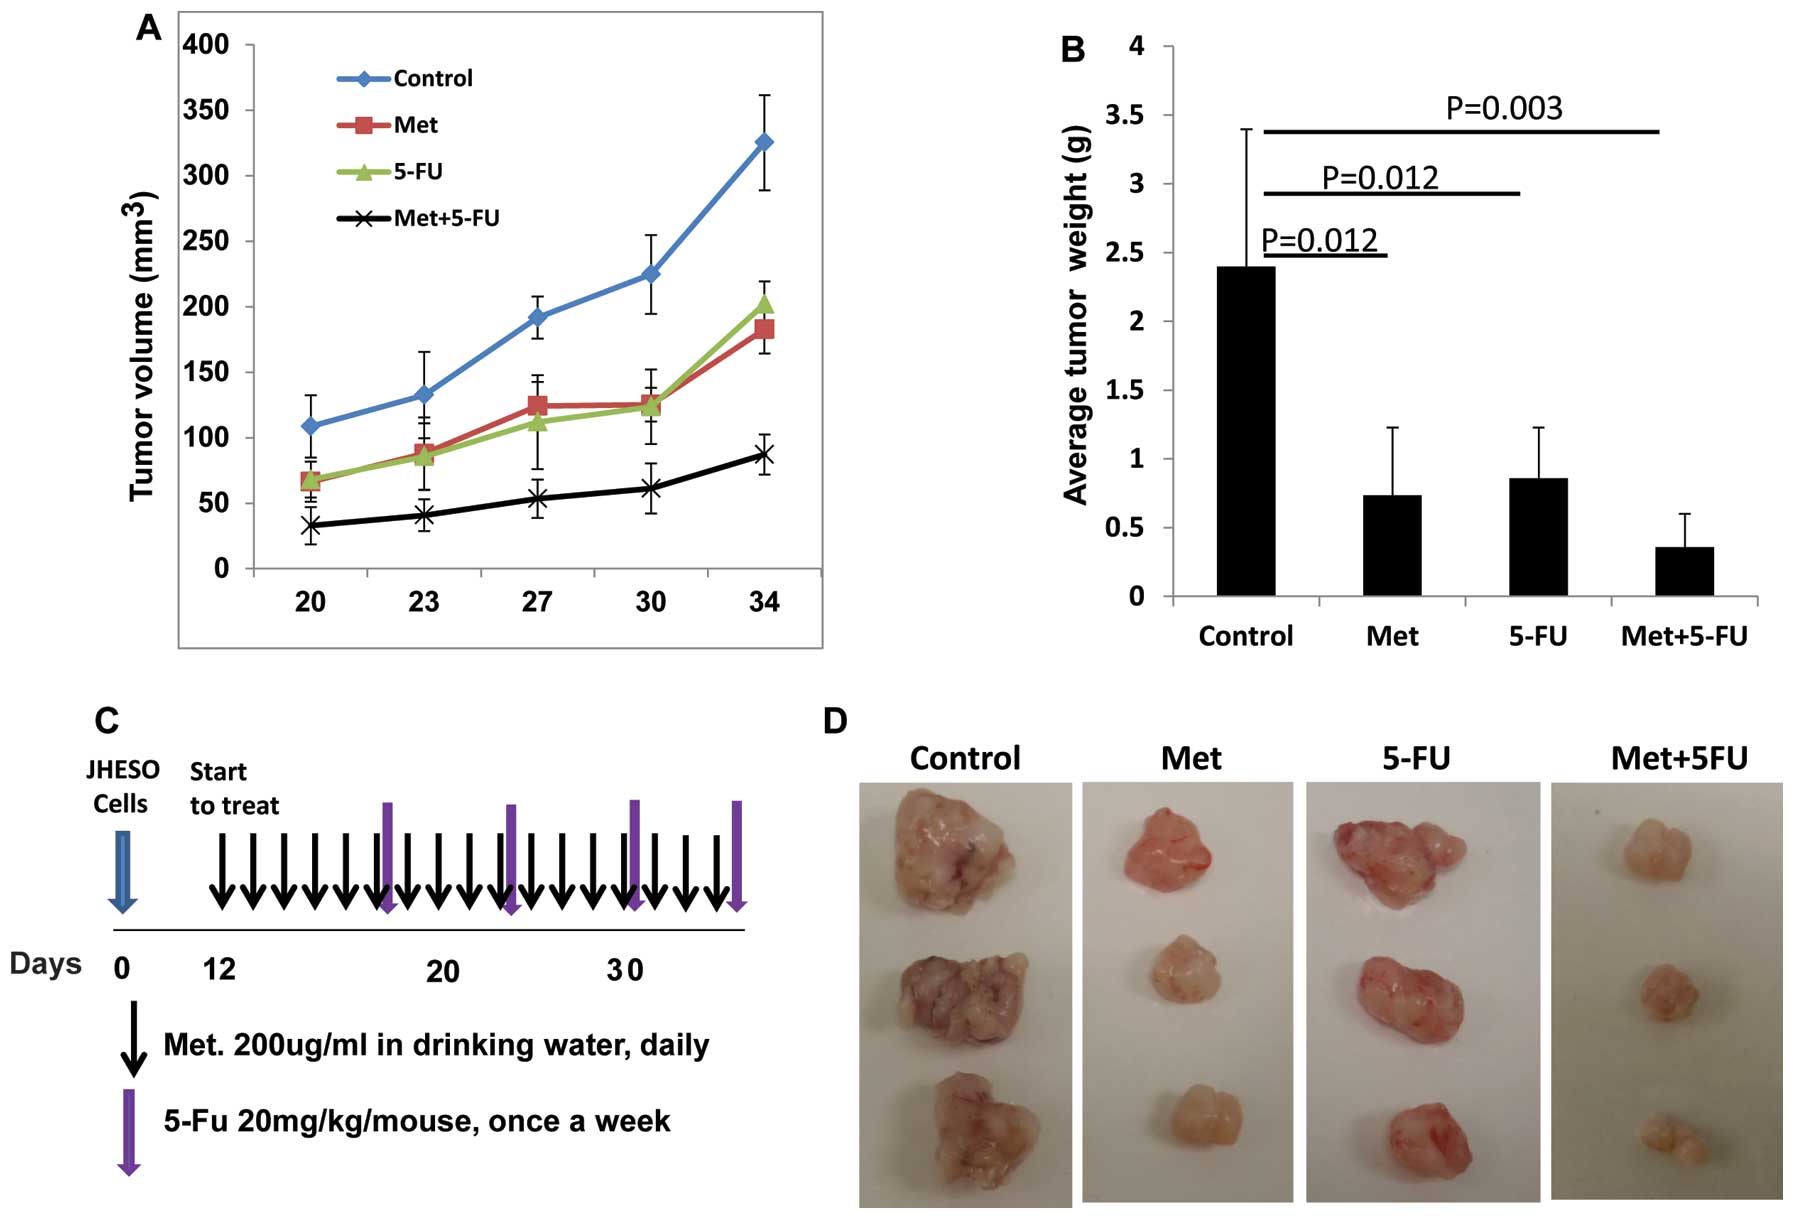
JHESO cells were inoculated into the nude mice at
2×10⁶ cells per mouse subcutaneously and treated with
metformin or 5-FU alone and metformin plus 5-FU (schema of therapy
shown in Fig. 7C). Results from
in vivo xenograft model further confirmed that metformin or
5-FU alone reduced tumor volume and weight (Fig. 7A and B). The combination of
metformin and FU resulted in synergistic reduction in the tumor
volume and tumor weight (Fig.
7).
Discussion
It has been implicated that metformin, commonly used
as an oral anti-hyperglycemic agent, may reduce cancer risk and
have antitumor effects in many types of cancer. Our previous study
demonstrated that metformin treatment improved the response to
neoadjuvant chemoradiation in esophageal adenocarcinoma patients
(1). However, the effects of
metformin and in combination of chemotoxic agents on both ESCC and
EAC and their mechanisms of action remain unclear. In this study,
we demonstrated that metformin inhibit cell growth in both ESCC and
EAC cells and sensitize 5-FU cytotoxic effects by targeting CSCs
and mTOR signal pathways.
Our results are consistent with the study of
Kobayashi et al (32)
regarding the antitumor effects of metformin on ESCC cell lines
in vitro. However, our study demonstrated that metformin
acts effectively not only on ESCC cells but is also effective on
EAC cells by using both ESCC and EAC cell lines, indicating a
therapeutic view, metformin has equal effects on both ESCC and EAC.
Most importantly metformin sensitizes the cytotoxic agent (5-FU) on
both types of EC cells and inhibits the growth of EC cells in
vitro and in a xenograft nude mouse model. This suggests that
metformin can act as an important auxiliary drug to improve the EC
patients’ survival.
EC is a difficult cancer to treat because it is
often resistant to the current standard therapies. The reason for
this inherent resistance is likely the genetic make-up of EC. ECs
have one of the highest genetic alterations (insertion, deletion,
mutation, amplification and or recombination) rates and each EC can
have as many as 50 or higher non-synonymous alterations (27). It is also suggested that CSCs may
play a central role in imparting resistance to therapy and that the
density of CSCs has a role as well (28). Our previous data are supportive of
the concept that CSCs are animated upon chemotherapy or radiation
injury to EAC in a xenograft model and the ‘first responders’ are
cells with CSC markers such as Gli-1 and Shh (9). Our current data suggest that the
proportion of ALDH-1+ cell fraction varies among the EAC cell lines
and cells with higher proportion of ALDH-1+ cells have more
potential to form tumor spheres and tend to be resistant to
therapy. Much of our findings are consistent with those
demonstrated in other tumor types, however (13,14,16,17),
the novelty of our findings include demonstration that
CSC-associated group of genes are upregulated in EC tumor cells and
metformin suppresses these genes and effectively decrease ALDH1+
CSCs tumor sphere formation, indicating a metformin targeting CSC
population in EC cells.
Amplification or mutations in the RTK-PI3K-mTOR
pathway have been identified by whole genomic sequencing, whole
exome sequencing and high-density genomic profiling arrays
(29,30) in EC tumors. Mutations were
discovered in 23% of EC tumor, with PIK3CA/mTOR being the most
frequently mutated (30). In
addition, there is upregulation of mTOR components in EC tumors
especially the resistant population and overexpression of mTOR
associated with poor survival in EAC (31). Therefore, mTOR might be an
important therapeutic target and should be considered a priority in
the therapeutic strategies in EC patients. Our study demonstrated
that metformin effectively downregulates mTOR components including
phospho-AKT, phospho-S6, phospho-70S6 which are important factors
maintain tumor cell growth. Taken together, metformin suppresses EC
cell growth in vitro and in vivo due to its ability
to reduce the CSCs population as well as causing inhibition of the
mTOR pathway in bulk tumor cells. Further, the synergy between
metformin and 5-FU is particularly of interest because it would
potentially afford an opportunity to treat the CSCs and
proliferating component simultaneously to increase the sensitivity
of chemoradiation in EAC patients.
In conclusion, our non-clinical results are
supportive of our prior retrospective observations in the clinic
that patients who were taking metformin (for diabetes) had better
therapy outcome than those who were not taking metformin, and we
find metformin inhibited the EAC cell growth and increased the
sensitivity to 5-FU cytotoxic effects by targeting the genes of
CSCs and mTOR signal pathways. Considerably more work is necessary
to control the CSC population in EAC that can prevent repopulation
of the tumor bed after therapy.
Acknowledgements
This study was supported in part by the grants
CA129906 and CA172741 (J.A.A.) by the National Cancer Institute,
USA, and donations received from the Caporella, Dallas, Sultan,
Park, Smith, Frazier, Oaks, Sultan, Vansteklenburg, and Cantu
Families, the Schecter Private Foundation, Rivercreek Foundation,
Kevin Fund, Myer Fund, Dio Fund, Milrod Fund, and the
Multidisciplinary Research Grants provided by the University of
Texas M.D. Anderson Cancer Center, Houston, USA; Public Health
Service Grant DF56338 which supports the Texas Medical Center
Digestive Diseases Center (S.S.); UTMDACC IRG (3-0026317,
S.S.).
References
|
1
|
Siegel R, Naishadham D and Jemal A: Cancer
statistics, 2012. CA Cancer J Clin. 62:10–29. 2012. View Article : Google Scholar
|
|
2
|
Siegel R, Naishadham D and Jemal A: Cancer
statistics, 2013. CA Cancer J Clin. 63:11–30. 2013. View Article : Google Scholar
|
|
3
|
Parkin DM, Bray F, Ferlay J, et al: Global
cancer statistics, 2002. CA Cancer J Clin. 55:74–108. 2005.
View Article : Google Scholar
|
|
4
|
Van Hagen P, Hulshof MC, van Lanschot JJ,
et al: Preoperative chemoradiotherapy for esophageal or junctional
cancer. N Engl J Med. 366:2074–2084. 2012.
|
|
5
|
Ajani JA, Barthel JS, Bentrem DJ, et al:
Esophageal and esophagogastric junction cancers. J Natl Compr Canc
Netw. 9:830–887. 2011.PubMed/NCBI
|
|
6
|
Ajani JA, Correa AM, Hofstetter WL, et al:
Clinical parameters model for predicting pathologic complete
response following preoperative chemoradiation in patients with
esophageal cancer. Ann Oncol. 23:2638–2642. 2012. View Article : Google Scholar
|
|
7
|
Cheedella NK, Suzuki A, Xiao L, et al:
Association between clinical complete response and pathological
complete response after preoperative chemoradiation in patients
with gastroesophageal cancer: analysis in a large cohort. Ann
Oncol. 24:2854–2859. 2012.
|
|
8
|
Welsh J, Settle SH, Amini A, et al:
Failure patterns in patients with esophageal cancer treated with
definitive chemoradiation. Cancer. 118:2632–2640. 2012. View Article : Google Scholar : PubMed/NCBI
|
|
9
|
Sims-Mourtada J, Izzo JG, Apisarnthanarax
S, et al: Hedgehog: an attribute to tumor regrowth after
chemoradiotherapy and a target to improve radiation response. Clin
Cancer Res. 12:6565–6572. 2006. View Article : Google Scholar : PubMed/NCBI
|
|
10
|
Sims-Mourtada J, Izzo JG, Ajani J, et al:
Sonic Hedgehog promotes multiple drug resistance by regulation of
drug transport. Oncogene. 26:5674–5679. 2007. View Article : Google Scholar : PubMed/NCBI
|
|
11
|
Wang Y, Ding Q, Yen CJ, et al: The
crosstalk of mTOR/S6K1 and Hedgehog pathways. Cancer Cell.
21:374–387. 2012. View Article : Google Scholar : PubMed/NCBI
|
|
12
|
Yen CJ, Izzo JG, Lee DF, et al: Bile acid
exposure up-regulates tuberous sclerosis complex 1/mammalian target
of rapamycin pathway in Barrett’s-associated esophageal
adenocarcinoma. Cancer Res. 68:2632–2640. 2008.PubMed/NCBI
|
|
13
|
Bao B, Wang Z, Ali S, et al: Metformin
inhibits cell proliferation, migration and invasion by attenuating
CSC function mediated by deregulating miRNAs in pancreatic cancer
cells. Cancer Prev Res (Phila). 5:355–364. 2012. View Article : Google Scholar : PubMed/NCBI
|
|
14
|
Hirsch HA, Iliopoulos D, Tsichlis PN, et
al: Metformin selectively targets cancer stem cells, and acts
together with chemotherapy to block tumor growth and prolong
remission. Cancer Res. 69:7507–7511. 2009. View Article : Google Scholar : PubMed/NCBI
|
|
15
|
Hirsch HA, Iliopoulos D and Struhl K:
Metformin inhibits the inflammatory response associated with
cellular transformation and cancer stem cell growth. Proc Natl Acad
Sci USA. 110:972–977. 2013. View Article : Google Scholar : PubMed/NCBI
|
|
16
|
Bednar F and Simeone DM: Metformin and
cancer stem cells: old drug, new targets. Cancer Prev Res (Phila).
5:351–354. 2012. View Article : Google Scholar : PubMed/NCBI
|
|
17
|
Vazquez-Martin A, Oliveras-Ferraros C,
Cufi S, et al: Metformin regulates breast cancer stem cell ontogeny
by transcriptional regulation of the epithelial-mesenchymal
transition (EMT) status. Cell Cycle. 9:3807–3814. 2010. View Article : Google Scholar : PubMed/NCBI
|
|
18
|
Pierotti MA, Berrino F, Gariboldi M, et
al: Targeting metabolism for cancer treatment and prevention:
metformin, an old drug with multi-faceted effects. Oncogene.
32:1475–1487. 2013. View Article : Google Scholar : PubMed/NCBI
|
|
19
|
Gu Y, Lin S, Li JL, et al: Altered
LKB1/CREB-regulated transcription co-activator (CRTC) signaling
axis promotes esophageal cancer cell migration and invasion.
Oncogene. 31:469–479. 2012. View Article : Google Scholar : PubMed/NCBI
|
|
20
|
Skinner HD, McCurdy MR, Echeverria AE, et
al: Metformin use and improved response to therapy in esophageal
adenocarcinoma. Acta Oncol. 52:1002–1009. 2012. View Article : Google Scholar : PubMed/NCBI
|
|
21
|
Raju U, Ariga H, Koto M, et al:
Improvement of esophageal adenocarcinoma cell and xenograft
responses to radiation by targeting cyclin-dependent kinases.
Radiother Oncol. 80:185–191. 2006. View Article : Google Scholar : PubMed/NCBI
|
|
22
|
Soldes OS, Kuick RD, Thompson IA II, et
al: Differential expression of Hsp27 in normal oesophagus,
Barrett’s metaplasia and oesophageal adenocarcinomas. Br J Cancer.
79:595–603. 1999.PubMed/NCBI
|
|
23
|
Zhang P, Yang Y, Nolo R, et al: Regulation
of NOTCH signaling by reciprocal inhibition of HES1 and Deltex 1
and its role in osteosarcoma invasiveness. Oncogene. 29:2916–2926.
2010. View Article : Google Scholar : PubMed/NCBI
|
|
24
|
Song S, Maru DM, Ajani JA, et al: Loss of
TGF-beta adaptor beta2SP activates notch signaling and SOX9
expression in esophageal adenocarcinoma. Cancer Res. 73:2159–2169.
2013. View Article : Google Scholar : PubMed/NCBI
|
|
25
|
Song S, Mazurek N, Liu C, et al:
Galectin-3 mediates nuclear beta-catenin accumulation and Wnt
signaling in human colon cancer cells by regulation of glycogen
synthase kinase-3beta activity. Cancer Res. 69:1343–139. 2009.
View Article : Google Scholar : PubMed/NCBI
|
|
26
|
Shank JJ, Yang K, Ghannam J, et al:
Metformin targets ovarian cancer stem cells in vitro and
in vivo. Gynecol Oncol. 127:390–397. 2012. View Article : Google Scholar : PubMed/NCBI
|
|
27
|
Vogelstein B, Papadopoulos N, Velculescu
VE, et al: Cancer genome landscapes. Science. 339:1546–1558. 2013.
View Article : Google Scholar : PubMed/NCBI
|
|
28
|
Rosen JM and Jordan CT: The increasing
complexity of the cancer stem cell paradigm. Science.
324:1670–1673. 2009. View Article : Google Scholar : PubMed/NCBI
|
|
29
|
Dulak AM, Schumacher SE, van Lieshout J,
et al: Gastrointestinal adenocarcinomas of the esophagus, stomach,
and colon exhibit distinct patterns of genome instability and
oncogenesis. Cancer Res. 72:4383–4393. 2012. View Article : Google Scholar : PubMed/NCBI
|
|
30
|
Dulak AM, Stojanov P, Peng S, et al: Exome
and whole-genome sequencing of esophageal adenocarcinoma identifies
recurrent driver events and mutational complexity. Nat Genet.
45:478–486. 2013. View
Article : Google Scholar
|
|
31
|
Prins MJ, Verhage RJ, Ruurda JP, et al:
Over-expression of phosphorylated mammalian target of rapamycin is
associated with poor survival in oesophageal adenocarcinoma: a
tissue microarray study. J Clin Pathol. 66:224–228. 2013.
View Article : Google Scholar : PubMed/NCBI
|
|
32
|
Kobayashi M, Kato K, Iwama H, et al:
Antitumor effect of metformin in esophageal cancer: in vitro study.
Int J Oncol. 42:517–524. 2013.PubMed/NCBI
|


