Introduction
As one of the most common cancers, gastric cancer
(GC) has the third highest lethality and fourth highest morbidity
of all cancers worldwide (1).
According to the GloboCan statistics, GC was responsible for
~951,600 new cancer cases and more than 723,000 deaths in 2012
(2). However, over half of these
cases and deaths were estimated to occur in China. It is predicted
that there will be ~498,000 cancer mortalities in 2015, ranking as
the second most frequent cause of cancer death in China (3). The high mortality is caused by tumor
recurrence, metastasis and lack of effective therapeutic response.
Therefore, increasing efforts have been devoted to investigating
the mechanisms of GC progression, especially the mechanisms of GC
metastasis (4).
Cell surface glycans play important roles in
intercellular and intracellular processes, including cell adhesion
and development, cell recognition, and cancer development and
metastasis (5). Mounting evidence
suggests that glycans can affect tumor cell invasiveness, including
the ability to disseminate through the circulation and metastasise
into distant organs (6). The roles
of glycans in cancer have been highlighted by the fact that
alterations in glycosylation could promote invasive behaviour of
tumor cells that ultimately lead to the progression of cancer
(7). For example, metastatic
progression of prostate cancer was mediated by aberrant
O-glycosylation of cancer cell surface receptors (8). N-glycans with bisecting GlcNAc shed
light on the detection of ovarian cancer in early peritoneal
metastasis stage (9). We therefore
wished to discover novel glycans associated with the metastasis of
GC.
Researchers have attempted to identify abnormal
glycans involved in the malignancy of GC. For example, a global
decrease in core-fucosylation of N-linked glycans was found to be
correlated with the malignancy of GC patients (10,11).
However, the fluctuation and variation of glycans in GC are still
largely unknown. High level of α2,3-linked sialic acids (α2-3Sia)
was associated with metastatic potential of GC cells (12). Nevertheless, the role of α2-3Sia
and its potential mechanisms in GC has not been as clearly defined.
Recently, we utilized a microarray with 91 lectins to compare the
differential glycans between the two GC cell lines with different
metastatic ability. Importantly, we discovered significant
connections between altered α2-3Sia and the tumorigenesis,
progression and metastasis of GC. Our results provide evidence that
α2-3Sia could be an important molecular marker to determine
malignant properties and a target for molecular therapy in patients
with GC.
Materials and methods
Cell culture
Human GC cell lines, SGC-7901, BGC-823 and MGC-803
were purchased from the cell library of the Chinese Academy of
Sciences (Shanghai, China). Both were cultured in RPMI-1640 medium
with 10% FBS (Gibco-BRL, Grand Island, NY, USA) at 37°C and 5%
CO2.
All procedures performed in this study involving
human participants were in accordance with the ethical standards of
Hubei University of Medicine and with the 1964 Helsinki declaration
and its later amendments or comparable ethical standards.
Lectin microarray screening for cell
surface glycans
The lectin microarray with 91 lectins was obtained
from BC Biotechnology (Guangdong, China). The cells were harvested
by trypsin digestion and fluorescently labeled with CFDA-SE (Life
Technologies, Carlsbad, CA, USA). Then cells were resuspended in
incubation solution (PBS with 1% BSA, 0.5 mM CaCl2 and
0.1 mM MnCl2). After blocked with 1% BSA, the lectin
microarray was incubated with cells for 1 h at dark. Unbound cells
were removed by washing buffer (PBS with 0.5% Tween). The signals
were detected by a GenePix 4200A scanner and the fluorescence
intensity of each spot was measured with GenePix Pro 6.0 software
(Molecular Devices, Sunnyvale, CA, USA). The signal intensities are
the averages of duplicate samples from three separate
experiments.
Plasmid construction and
transfection
Human β-galactoside α2,3-sialyltransferase IV
(ST3Gal-IV) genetic fragment was amplified and introduced into the
pEGFP-C1 eukaryotic expression vector (Clontech, Heidelberg,
Germany). Primers 5′ and 3′ for PCR were
5′-CGGATCCatggtcagcaagtcccgctgg-3′ and
5′-TCGCTCGAGtgttgtaggcgtctgggt-3′. The plasmid was synthesized by
GenePharma (Shanghai, China). After being confirmed by XhoI
and BamHI digestion analyses and DNA sequencing, the
recombinant pEGFP-C1-ST3Gal-IV plasmid was transfected into cells.
Transfection was carried out using Lipofectamine 3000 (Invitrogen,
Carlsbad, CA, USA), according to the manufac turer's instructions.
As a control, cells were transduced with a construct lacking
ST3Gal-IV. Transfection efficiency was detected by fluorescence
microscopy (Zeiss, Gottingen, Germany).
siRNA transfection
Human ST3Gal-IV and negative siRNA (control) were
synthesized by GenePharma. The siRNA sequences targeting ST3Gal-IV
were as follows: sence, 5′-GACCCAGAAAUAAUCCUCAdTdT-3′ and
antisence, 5′-UGAGGAUUAUUUCUGGGUCdTdT-3′. The negative siRNA
sequences were as follows: sense, 5′-uucuccGaacGuGucac GudTdT-3′
and antisense, 5′-acGuGacacGuucGGaGaadTdT-3′. Cells were
transfected with ST3Gal-IV siRNA or negative siRNA using
Lipofectamine 3000 as suggested by the manufacturer.
RT-PCR and western blot analysis
Methods of RNA extraction and real-time RT-PCR
analysis were conducted as previously described (13). Primer pairs for PCR are listed in
Table I. Each sample was detected
three times and expression of target genes was analyzed using the
comparative threshold cycle (Ct) method using GADPH as the
reference gene. The total protein was gathered and the ST3Gal-IV
and GAPDH antibodies (Santa Cruz Biotechnology, Inc., Santa Cruz,
CA, USA) were used in the western blotting. The band intensity was
developed using the ECL detection systems (Thermo Fisher
Scientific, Waltham, MA, USA).
 | Table ISequences of the primers used for
quantitative RT-PCR. |
Table I
Sequences of the primers used for
quantitative RT-PCR.
| Primer name | Sequences
(5′–3′) |
|---|
| ST3Gal-I | F:
ACCACCGACCTGCAGTGGGT |
| R:
GGGGGCACGGGGACATAGGT |
| ST3Gal-II | F:
TCCGATTCACCTATGCCCCAGT |
| R:
TGCTCGGTCCACCTGTCGTGA |
| ST3Gal-III | F:
CCGCTGGACAAACCCTAGGCAC |
| R:
GGCTAGCTCGGCAGGCAGTTT |
| ST3Gal-IV | F:
ACCTATGAGCTGCCCTTTGGGACT |
| R:
GACACTCGAGGCTCTTTATGCTCTC |
| ST3Gal-V | F:
TCAGTCAAGGTTCTGGGGCCGA |
| R:
CCCGCCAAACTGACTTCATCGCA |
| ST3Gal-VI | F:
GACCTTCGAGACATATTTCAGCTCG |
| R:
TCCATTACCAACCACCACACACCT |
| GADPH | F:
CCAACCGCGAGAAGATGA |
| R:
CCAGAGGCGTACAGGGATAG |
Wound healing assay for cell
migration
Cells were seeded in a 6-well plate at a density of
5×10⁵ cells/well and grown to confluence overnight.
After transfected with ST3Gal-IV siRNA or pEGFP-C1-ST3Gal-IV
plasmid for 24 h, cells were incubated with serum-free medium. A
micro-pipette tip was used to scratch a line in the cell monolayer.
Following incubation for 24 h, cell migration was observed and
photographs were taken under a light microscope (Olympus BX41;
Olympus Corporation, Tokyo, Japan).
Transwell assay for cell invasion
Cell invasion assay was performed using Transwell
chamber (8.0 µm pore size; Costar, Cambridge, MA, USA).
Cells were transfected with ST3Gal-IV siRNA or pEGFP-C1-ST3Gal-IV
plasmid for 24 h. Then cells were resuspended and added to the
upper chamber of Matrigel-coated inserts. The lower chamber was
filled with medium containing 10% FBS. After 24 h incubation, cells
on the upper surface were removed by gently scrubbing with a cotton
swab. Cells that had migrated below the membrane were stained with
eosin staining solution (Beyotime, Jiangsu, China).
Lectin blot
SDS-PAGE and electrophoretic transferring were
performed in the same manner as described for western blot
analysis. After blocking with carbo-free blocking solution the
membrane was incubated with 1:1,000 dilution of biotin-labeled
Maackia amurensis lectin I (MAL-I) (both from Vector
Laboratories, Burlingame, CA, USA) for 2 h at room temperature. The
blots were developed using ECL detection system.
Analysis of lectin labeling by flow
cytometry
Cells were collected and stained with 10
µg/ml FITC-MAL-I (Vector Laboratories) at 25°C for 1 h, then
washed three times with PBS. Fluorescent analyses were performed
using a FACScan flow cytometer (Becton-Dickinson, Mountain View,
CA, USA).
Lectin histochemistry
From 2008 to 2014, 80 GC tissues were obtained from
patients who underwent surgery at Taihe Hospital, Hubei University
of Medicine. No patients received neoadjuvant chemotherapy or
radiotherapy. The main clinical and pathologic variables are
summarized in Table III.
Paraffin-embedded tissue sections were first deparaffinized,
followed by blocking with 30% normal donkey serum. Biotinylated
lectin was then added onto the slide (50 µg/ml) and
incubated for 1 h, followed by incubation with horseradish
peroxidase (HRP)-conjugated streptavidin (Sigma, St. Louis, MO,
USA). The following experimental procedure was according to the
manufacturer's instructions of the DAB staining kit (Maixin Bio,
Fuzhou, China). MAL-I staining intensities were analyzed by two
observers independently using the semiquantitative immunoreactivity
scoring (IRS) system as previously described (14). The IRS value >4 was defined as
high expression and IRS value ≤4 as low expression.
| Table IIIRelationship between α2-3Sia
expression and clinicopathological features of GC patients. |
Table III
Relationship between α2-3Sia
expression and clinicopathological features of GC patients.
| Clinicopathological
features | No. of
patients | α2-3Sia expression
| P-value |
|---|
Low
(n=36) | High
(n=44) |
|---|
| Age (years) |
| <60 | 32 | 13 | 19 | 0.521 |
| ≥60 | 48 | 23 | 25 |
| Gender |
| Male | 57 | 28 | 29 | 0.243 |
| Female | 23 | 8 | 15 |
| Tumor size |
| <5 cm | 34 | 19 | 15 | 0.093 |
| ≥5 cm | 46 | 17 | 29 |
| Lauren
classification |
| Intestinal | 50 | 24 | 26 | 0.087 |
| Diffuse | 30 | 12 | 18 |
|
Differentiation |
| Moderate-High | 54 | 26 | 28 | 0.153 |
| Low | 26 | 10 | 16 |
| Invasion depth |
| T1+T2 | 15 | 12 | 3 | 0.003a |
| T3+T4 | 65 | 24 | 41 |
| Lymph node
metastasis |
| Positive | 20 | 16 | 4 | 0.000a |
| Negative | 60 | 20 | 40 |
| TNM stage |
| I+II | 32 | 26 | 6 | 0.000a |
| III+IV | 48 | 10 | 38 |
Statistical analysis
All data are expressed as mean ± SD. Statistical
analysis was carried out using SPSS 16.0 (SPSS, Inc., Chicago, IL,
USA). Student's t-test was performed for comparisons between two
groups. Correlations between MAL-I staining and clinicopathological
parameters were evaluated by Chi-square test or Fisher's exact
tests. Kaplan-Meier method was applied to compare overall survival
(OS) for groups of low and high expression. A value of P<0.05
was considered significant.
Results
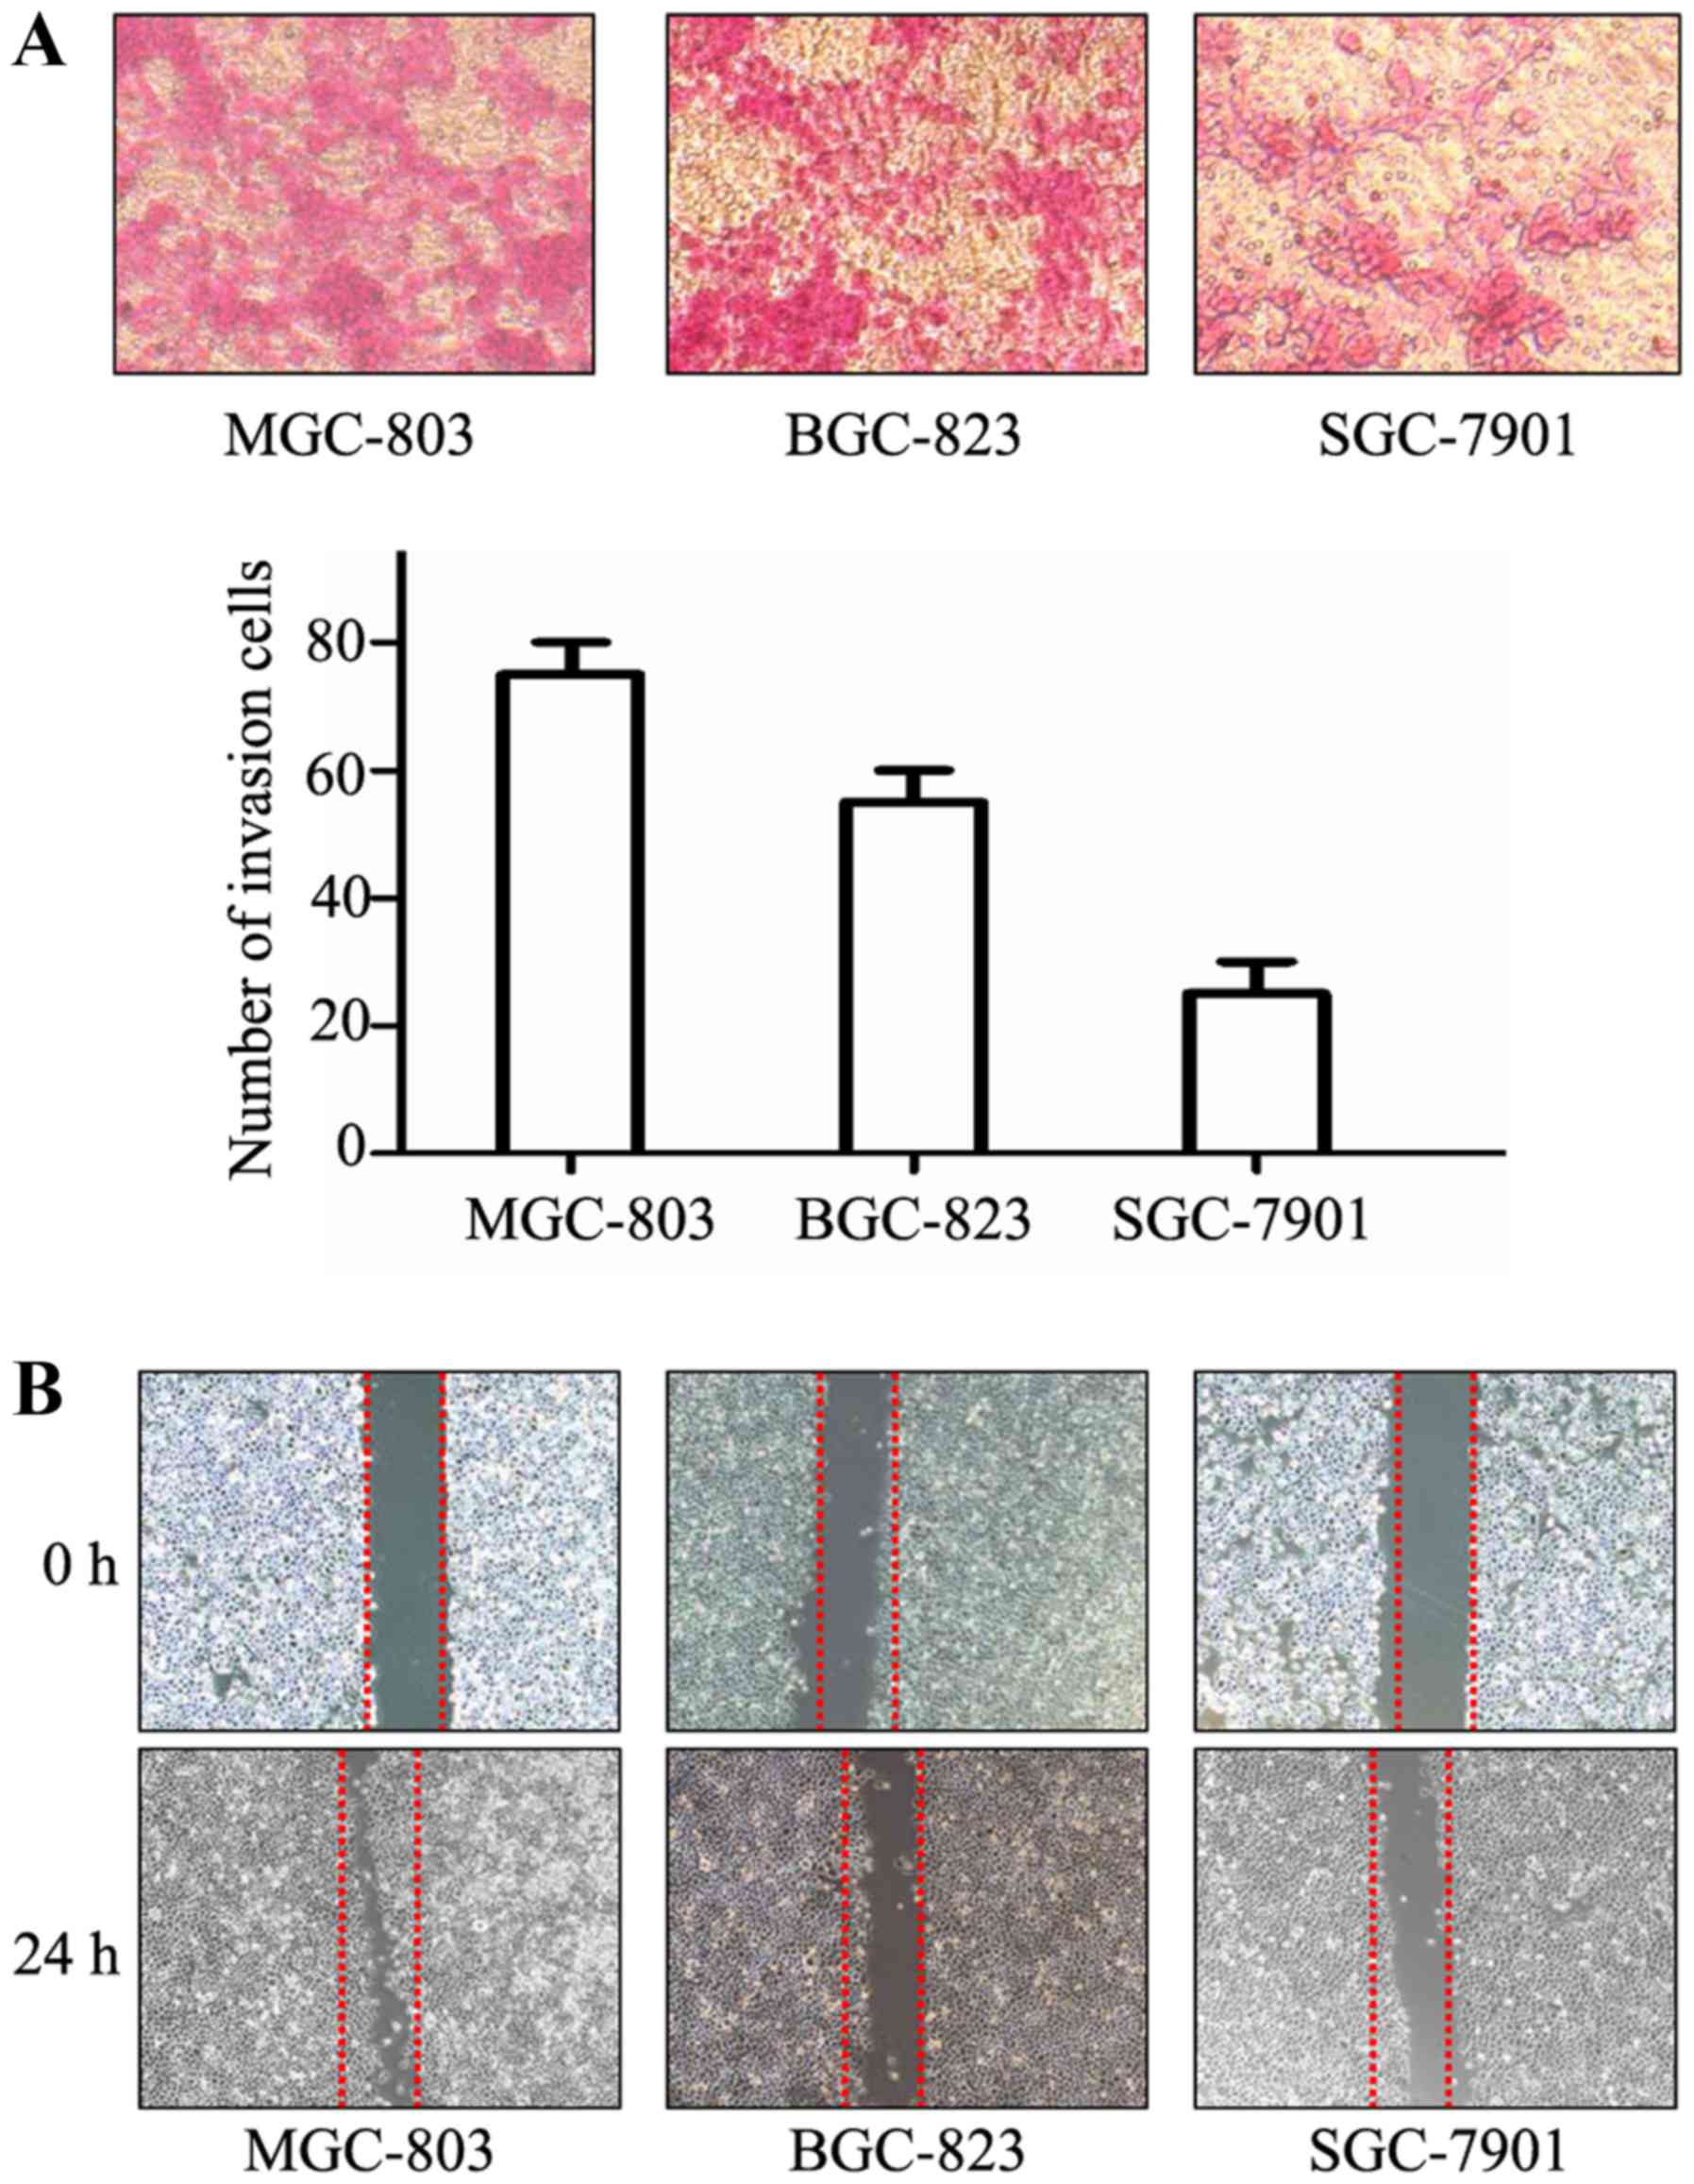
Comparison of the metastatic ability of
GC cells
Wound healing and Transwell assays were performed to
compare the metastatic abilities of cultured GC cells. As shown in
Fig. 1A, the number of MGC-803
cells that migrated into the lower chamber was much higher than the
number of SGC-7901 cells. The distance between wound edges of
MGC-803 cells was markedly shorter than that of SGC-7901 cells
(Fig. 1B). MGC-803 cells had the
highest invasive and migratory capabilities, SGC-7901 cells had the
lowest, while BGC-823 cells had moderate capability.
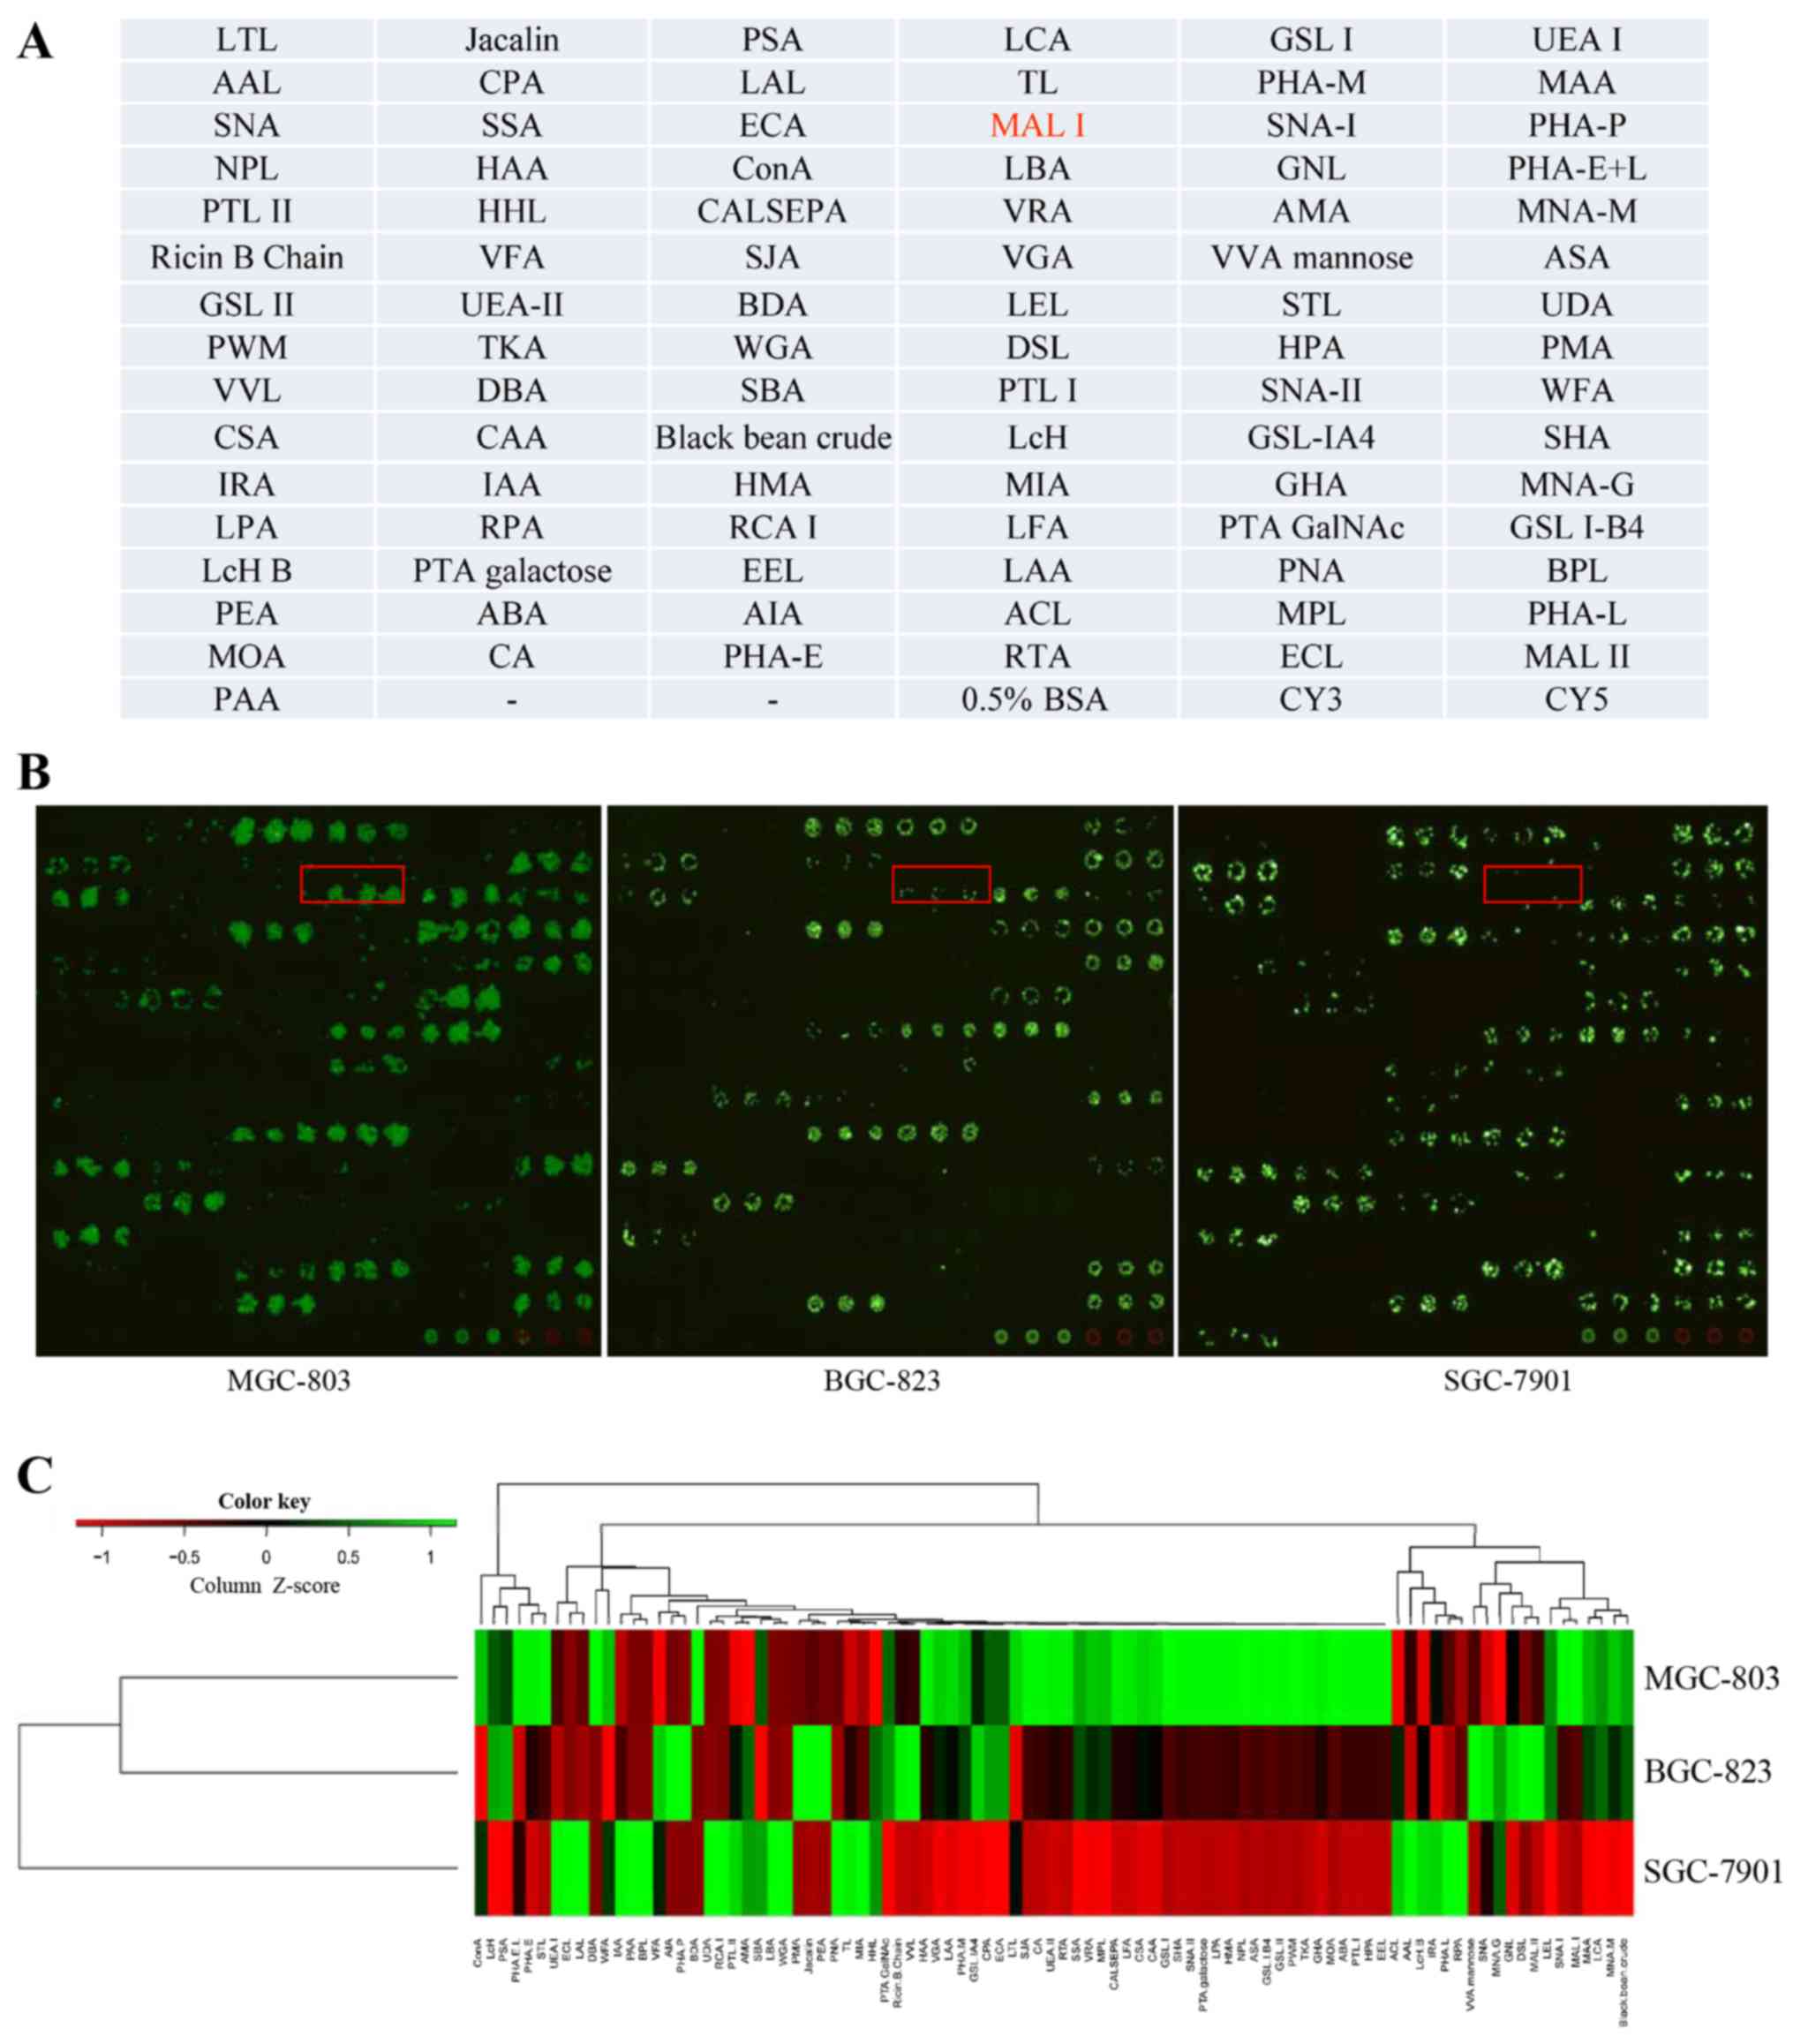
Metastasis-specific lectin binding
identified on GC cells
To identify the cell surface glycan profiles,
freshly harvested cells were incubated on a lectin microarray
containing 91 lectins, in which each lectin was present in
triplicate. The lectin micro-array format used in this study is
shown in Fig. 2A. For live cell
labeling, CFDA-SE reagents were used, which were converted to
fluorescent derivatives once inside the cells. Using this analysis,
a cell binding map was generated (Fig.
2B). For those lectins that showed no binding activity to the
tested cells, it is possible that they either have relatively low
affinity or are of low quality. We found that all cell lines
expressed common sugar structures, such as mannose, galactose, and
fucose, which are generally found on all mammalian cell surfaces.
For example, the binding of all cell lines to the lectins HHL,
specific for mannose, and PNA, specific for terminal galactose was
observed. To better compare the overall glycan profiles, a heat map
was generated and clustered according to the lectin-binding pattern
and intensity (Fig. 2C). Despite
the similarities, there were still significant differences in
lectin binding patterns among cultured GC cells. Overall, 8 lectins
showed a strong binding capacity in MGC-803 cells, while 2 lectins
strongly bound to SGC-7901 cells (Table II). It suggests that the cell
lines with different metastatic potential still possess variations
in their cell surface glycan signatures and can be captured by the
lectin microarray. In addition, three metastasis-specific lectins
LEL (Lycopersicon esculentum), Jacalin (Artocarpus
integrifolia), and MAL-I showed the largest differences in
fluorescent intensities. Each of these lectins effectively captured
MGC-803 cells but weakly captured SGC-7901 cells. The most
significant difference was seen for MAL-I. MAL-I is highly specific
for α2-3Sia (15). It means that
MGC-803 cells predominantly express α2-3Sia. Collectively, the
above findings indicate that the overexpression of α2-3Sia may play
an important role in GC metastasis.
| Table IIThe differences in lectin-binding
patterns in SGC-7901, BGC-823 and MGC-803 cells. |
Table II
The differences in lectin-binding
patterns in SGC-7901, BGC-823 and MGC-803 cells.
| ID | Lectin | SGC-7901 | BGC-823 | MGC-803 |
|---|
| 1 | ConAa | 10000 | 10000 | 10000 |
| 2 | LCA | 3440 | 6131 | 8317 |
| 3 | MAL-I | 347 | 1411 | 6100 |
| 4 | LEL | 1297 | 2696 | 5634 |
| 5 | Black bean
crude | 3212 | 6916 | 8838 |
| 6 | LcH | 5089 | 8099 | 12834 |
| 7 | MAL-II | 3694 | 5937 | 7441 |
| 8 | Jacalin | 571 | 1159 | 2469 |
| 9 | PSA | 7047 | 7898 | 12174 |
| 10 | UEA-I | 6455 | 1545 | 241 |
| 11 | AAL | 8147 | 3991 | 3415 |
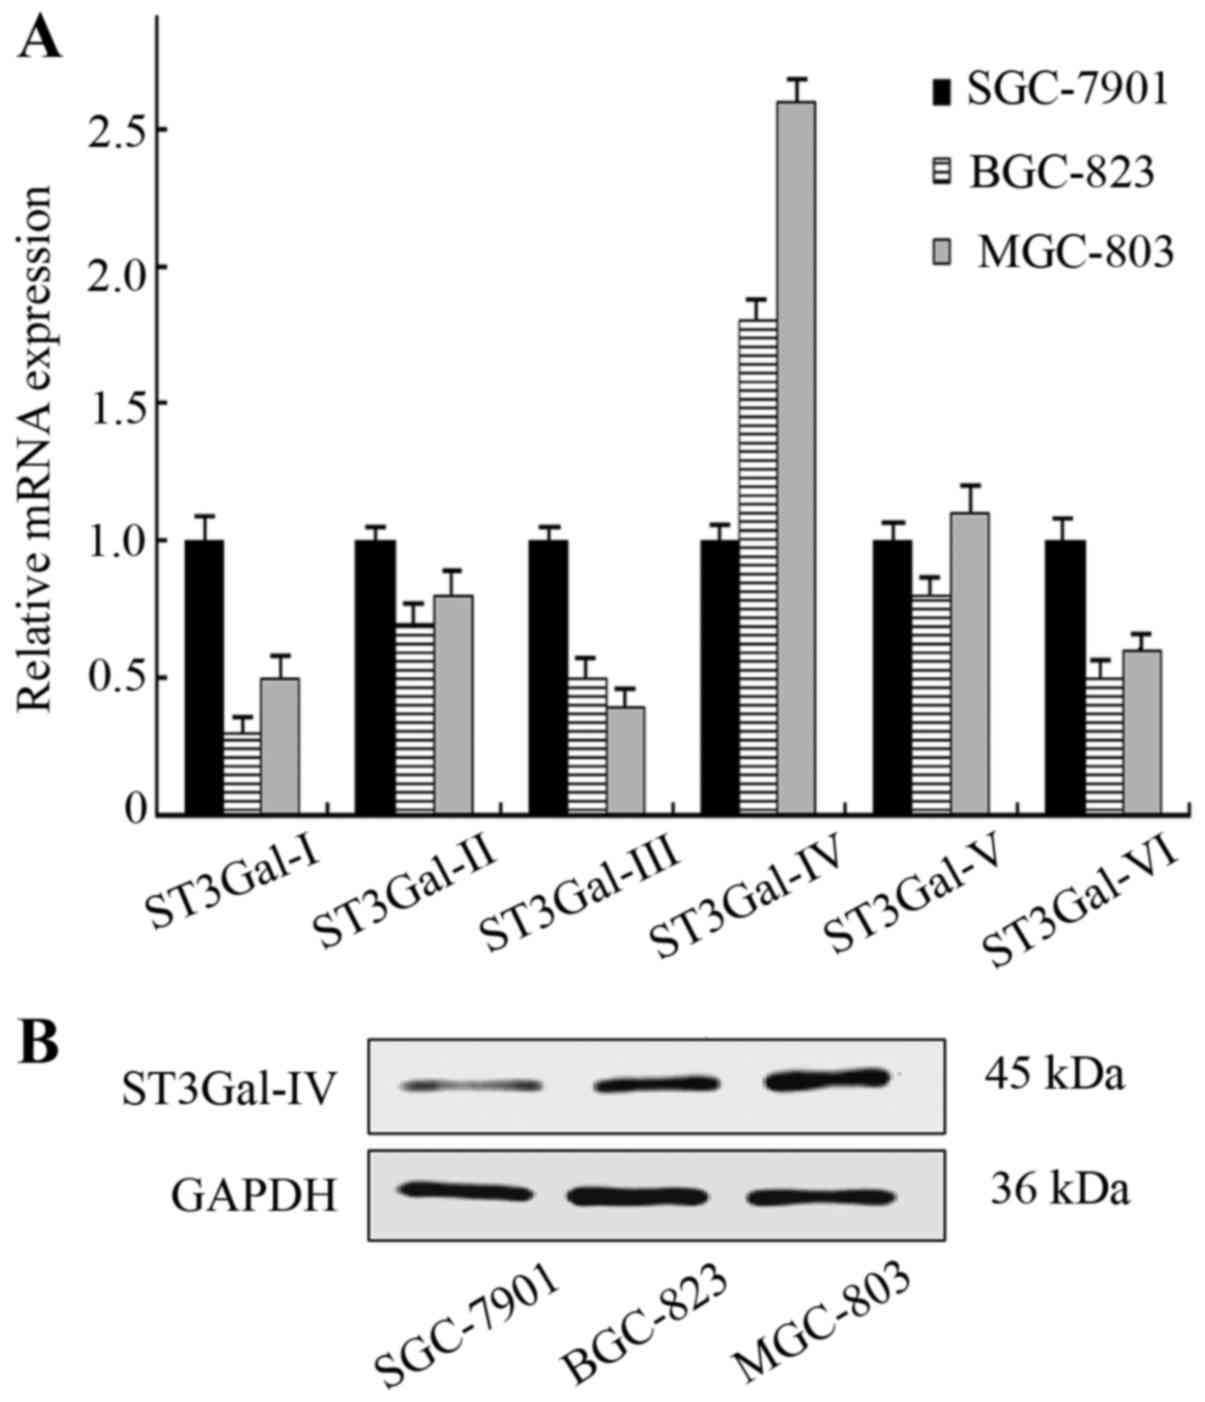
Differential α2,3-sialyltransferases
expression in GC cells
The α2,3-sialyltransferases mediate the transfer of
sialic acid with α2,3-linkage to terminal Gal residues. An
examination of mRNA expression for α2,3-sialyltransferases in GC
cell lines was carried out by real-time RT-PCR. The level of
ST3Gal-IV mRNA in MGC-803 cells was significantly increased
compared with that in SGC-7901 cells (P<0.05), whereas the mRNA
levels of other sialyltransferases were not increased (Fig. 3A). Furthermore, the protein
expression of ST3Gal-IV was also considerably enhanced in MGC-803
cells (Fig. 3B). These results
suggest that the overexpression of α2-3Sia may result from the
upregulation of ST3Gal-IV in GC cells.
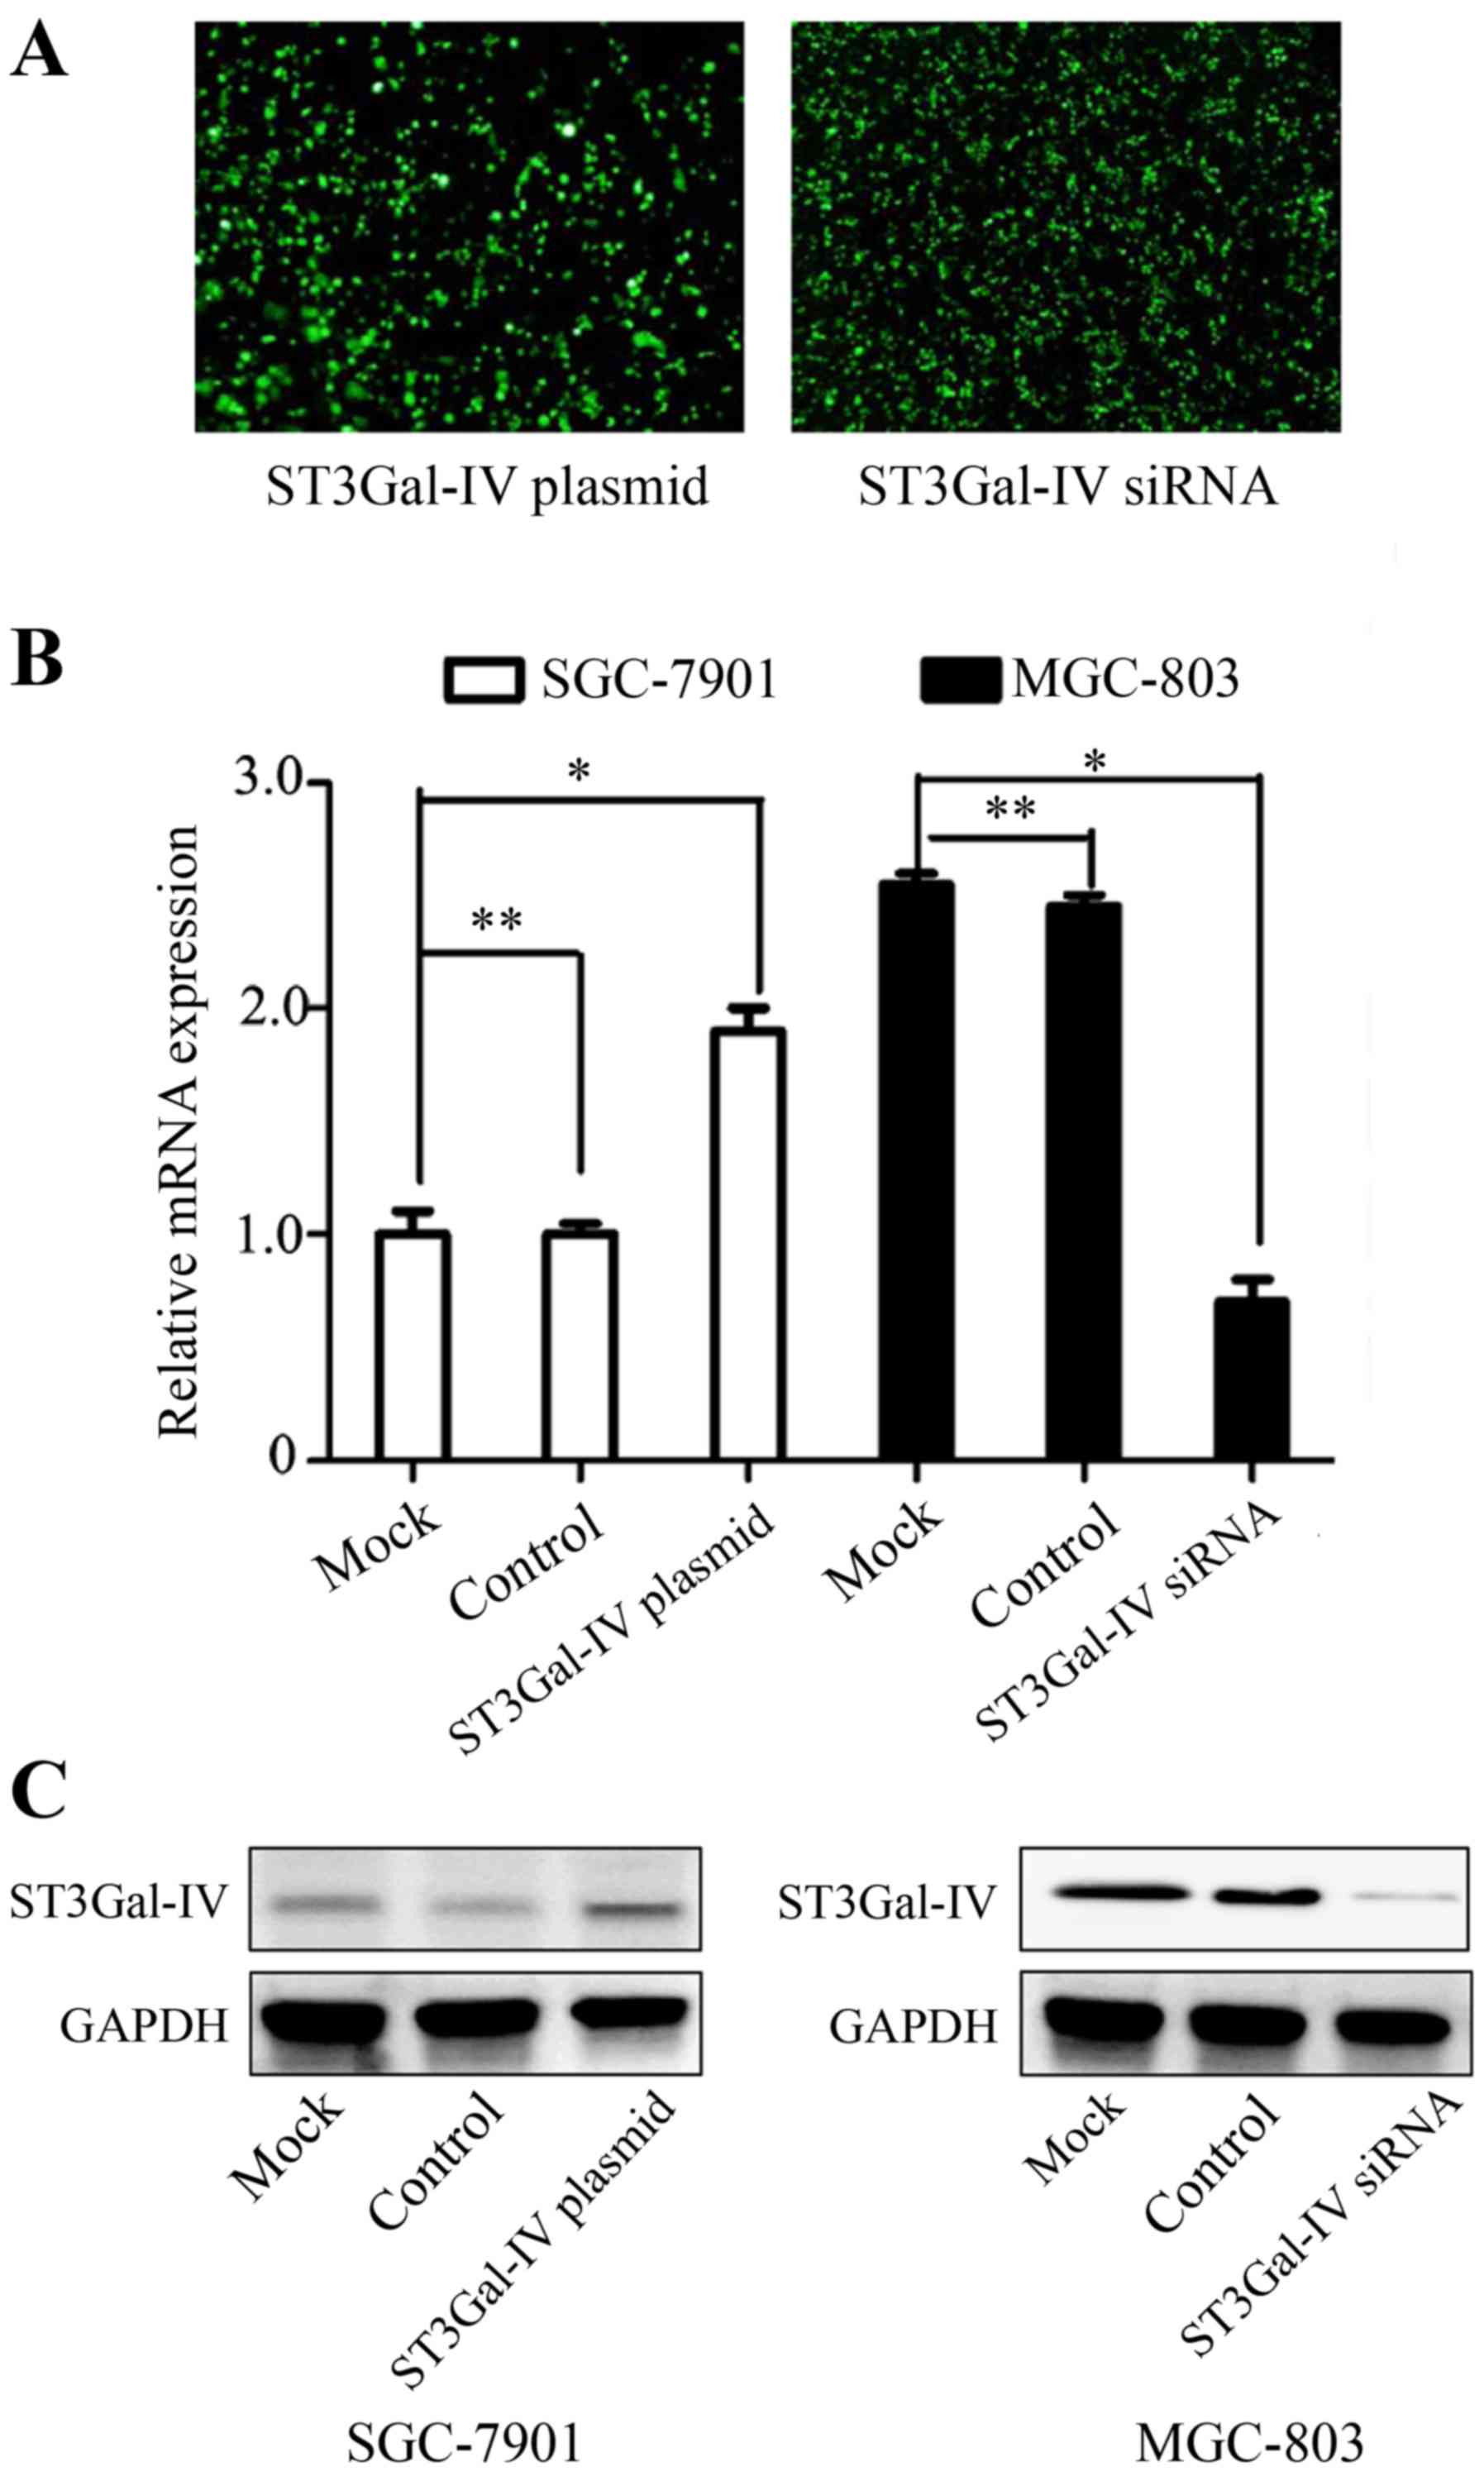
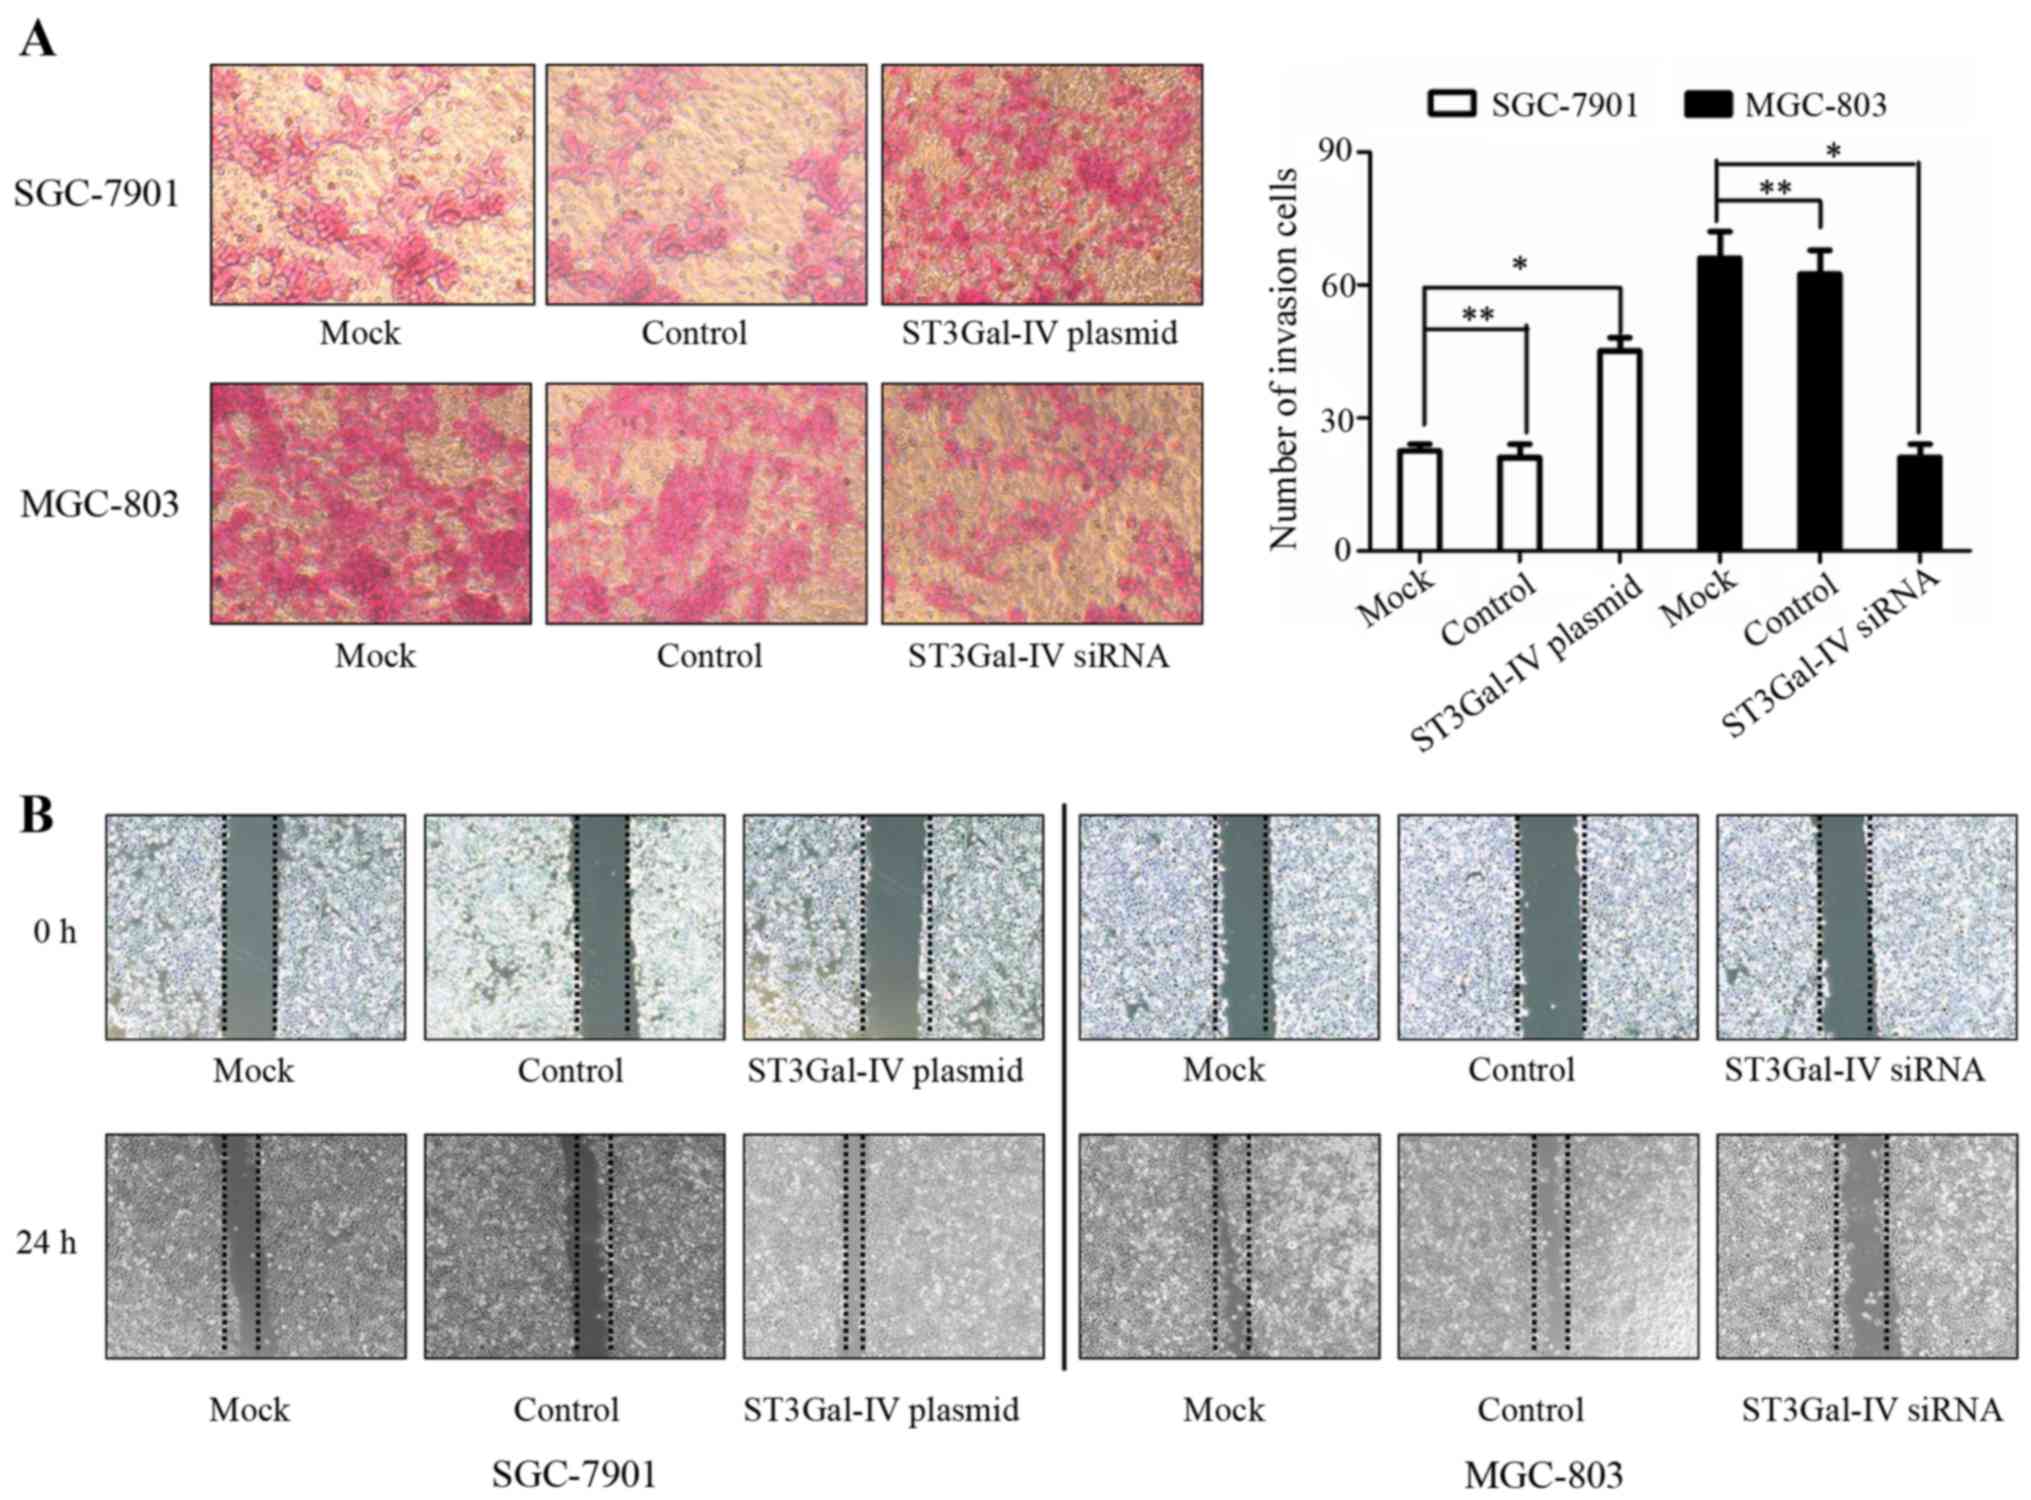
ST3Gal-IV mediates the migration and
invasion of GC cells by regulation the formation of α2-3Sia
To determine whether ST3Gal-IV promotes the
migration and invasion potential of GC cells, we carried out the
experiments in two parts: i) SGC-7901 cells were transfected with
ST3Gal-IV overexpressing or control plasmid, and ii) MGC-803 cells
were transfected with ST3Gal-IV or negative siRNA. Transfection
efficiency was assessed using fluorescence microscopy (Fig. 4A). We observed that the mRNA and
protein levels of ST3Gal-IV were markedly increased in SGC-7901
cells transiently transfected with ST3Gal-IV overexpressing
plasmids. Inversely, real-time RT-PCR and western blot assays
demonstrated that ST3Gal-IV expression was markedly decreased in
MGC-803 cells after targeted siRNA treatment (Fig. 4B and C). Then the invasion and
migration abilities of the cells were analyzed. As expected, the
results showed that ectopic expression of ST3Gal-IV significantly
enhanced the migration and invasion of SGC-7901 cells (P<0.05),
whereas knockdown of ST3Gal-IVs markedly suppressed the migration
and invasion of MGC-803 cells (P<0.05) (Fig. 5).
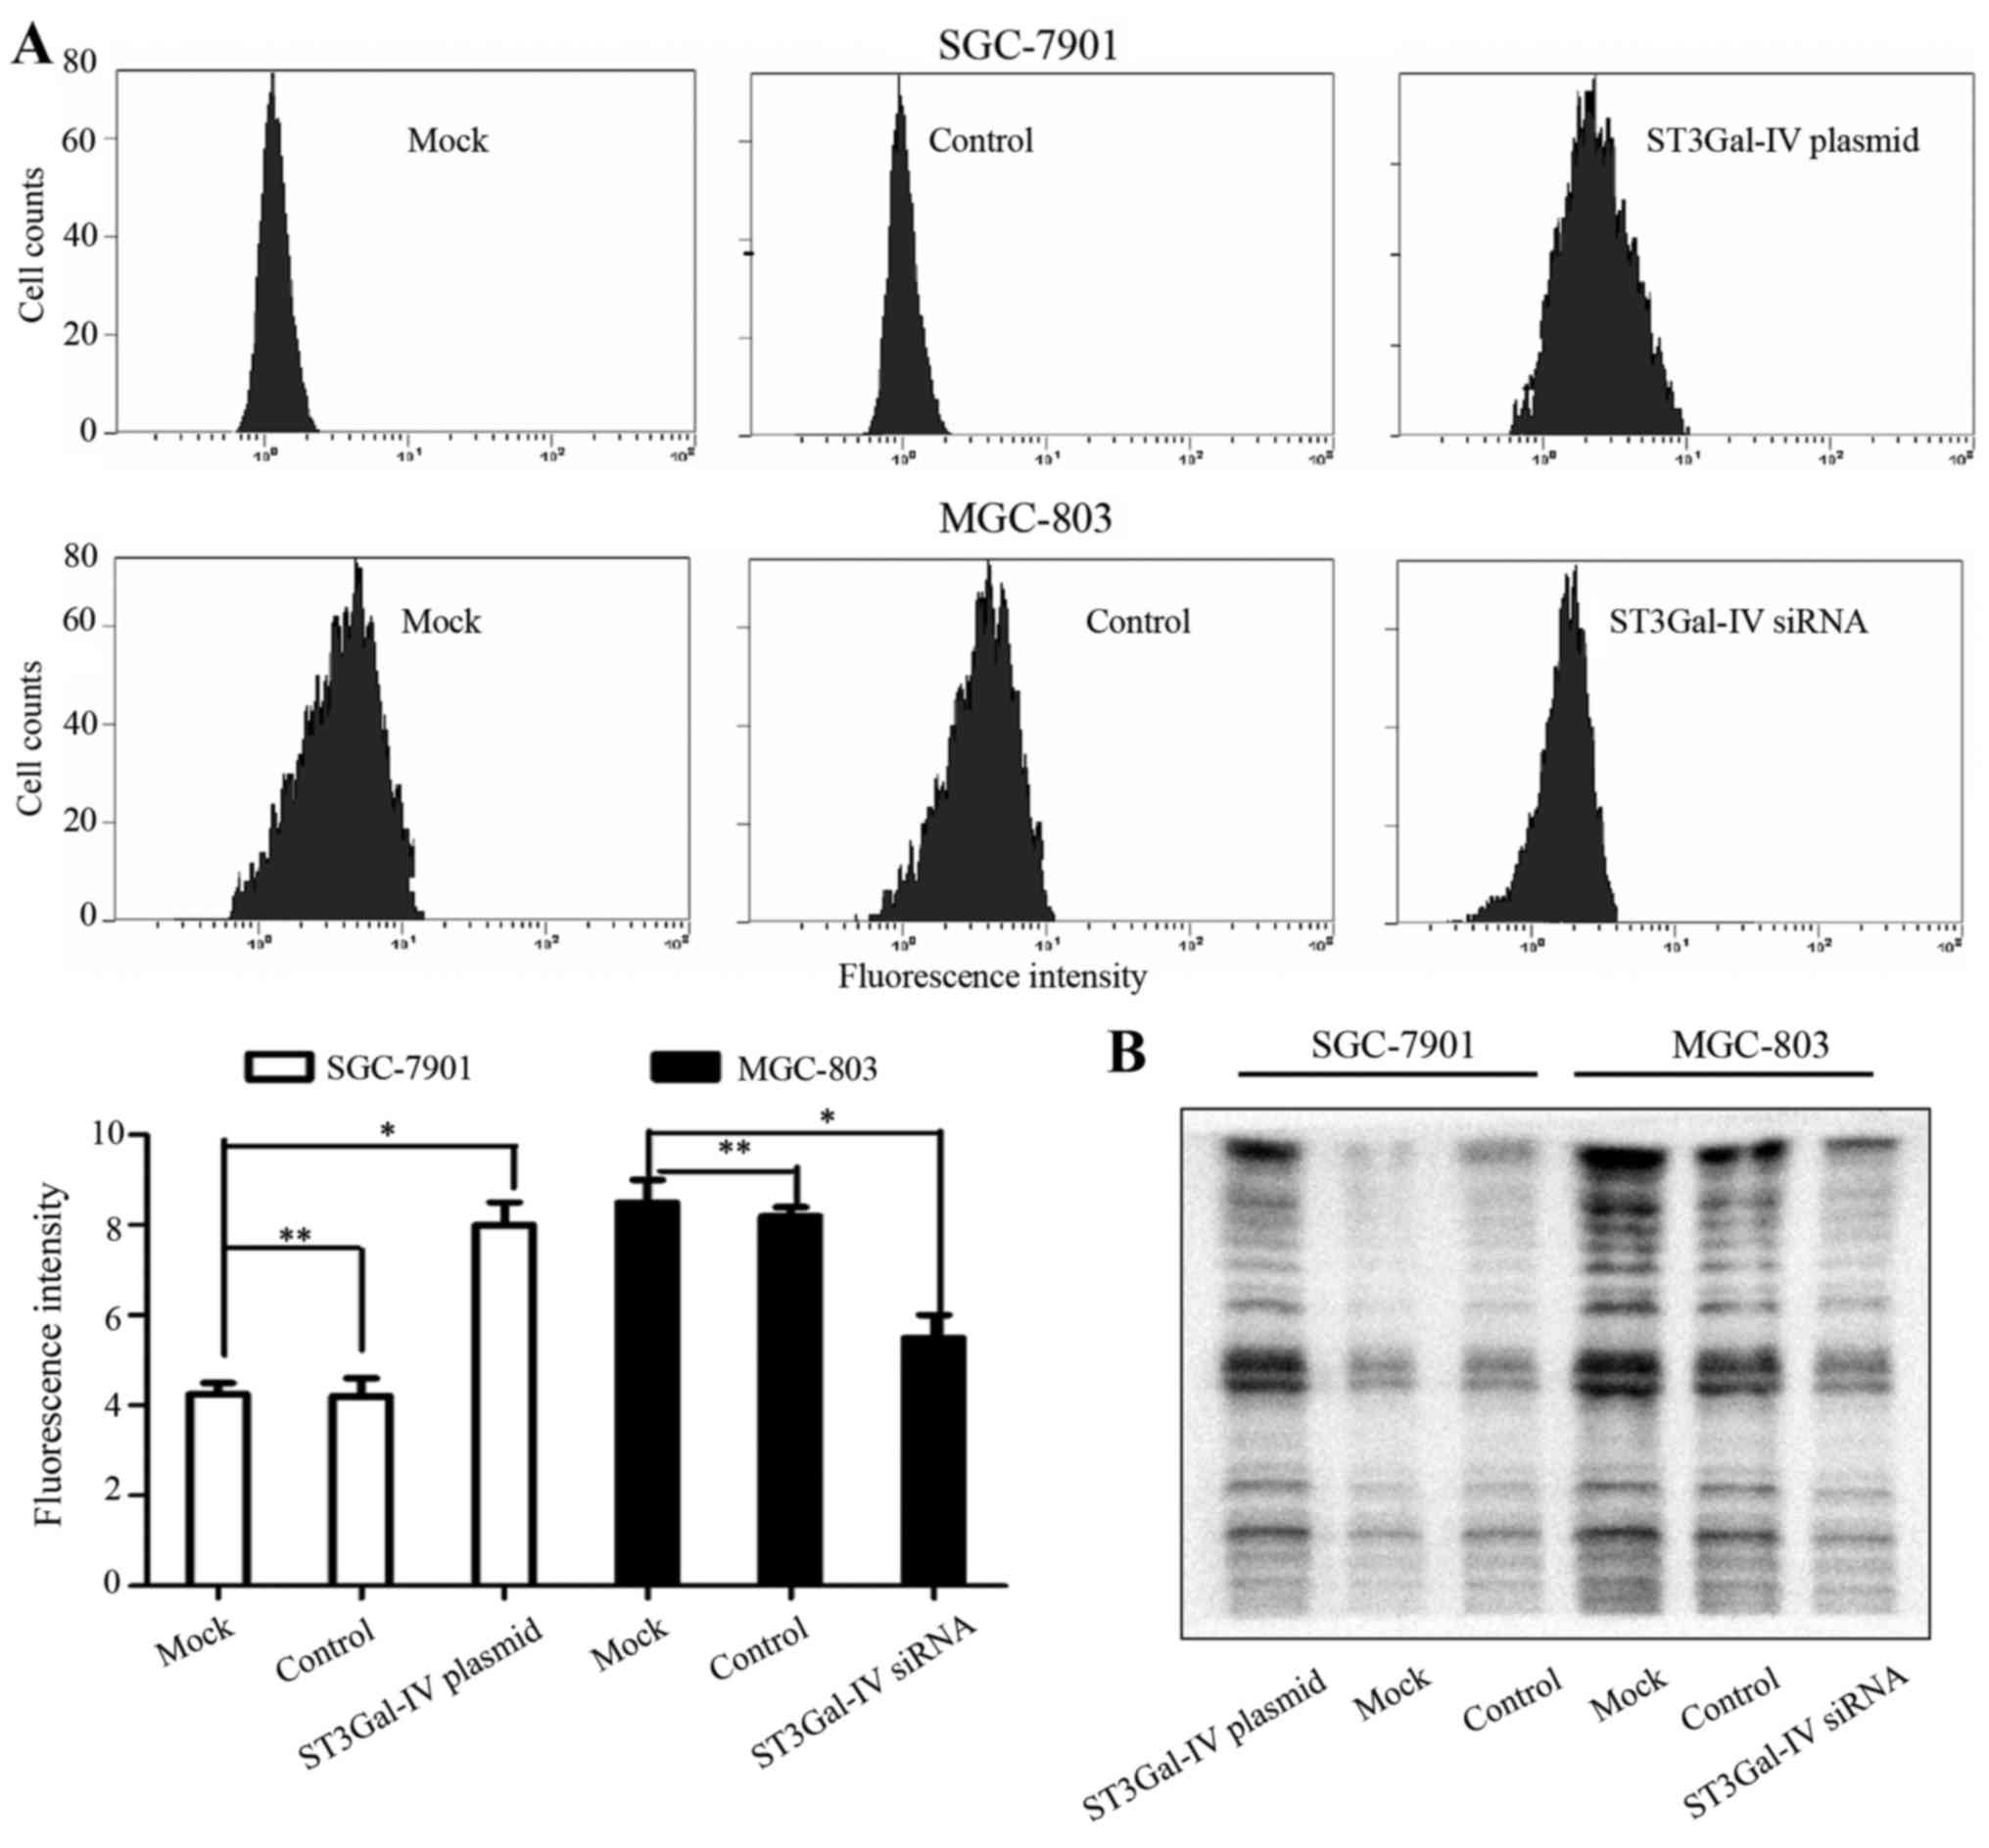
To confirm whether the expression of ST3Gal-IV was
directly involved in the formation of α2-3Sia, lectin blot and flow
cytometry assays were performed. We observed that the content of
α2-3Sia was increased by overexpression of ST3Gal-IV in SGC-7901
cells (Fig. 6). The opposite
results were obtained after ST3Gal-IV was knocked down in MGC-803
cells. The expression levels of ST3Gal-IV were positively
associated with α2-3Sia expression. Thus, we concluded that
ST3Gal-IV significantly promoted the invasion and metastasis of GC
cells via regulating the glycosylation profile in terms of α2-3Sia
chains.
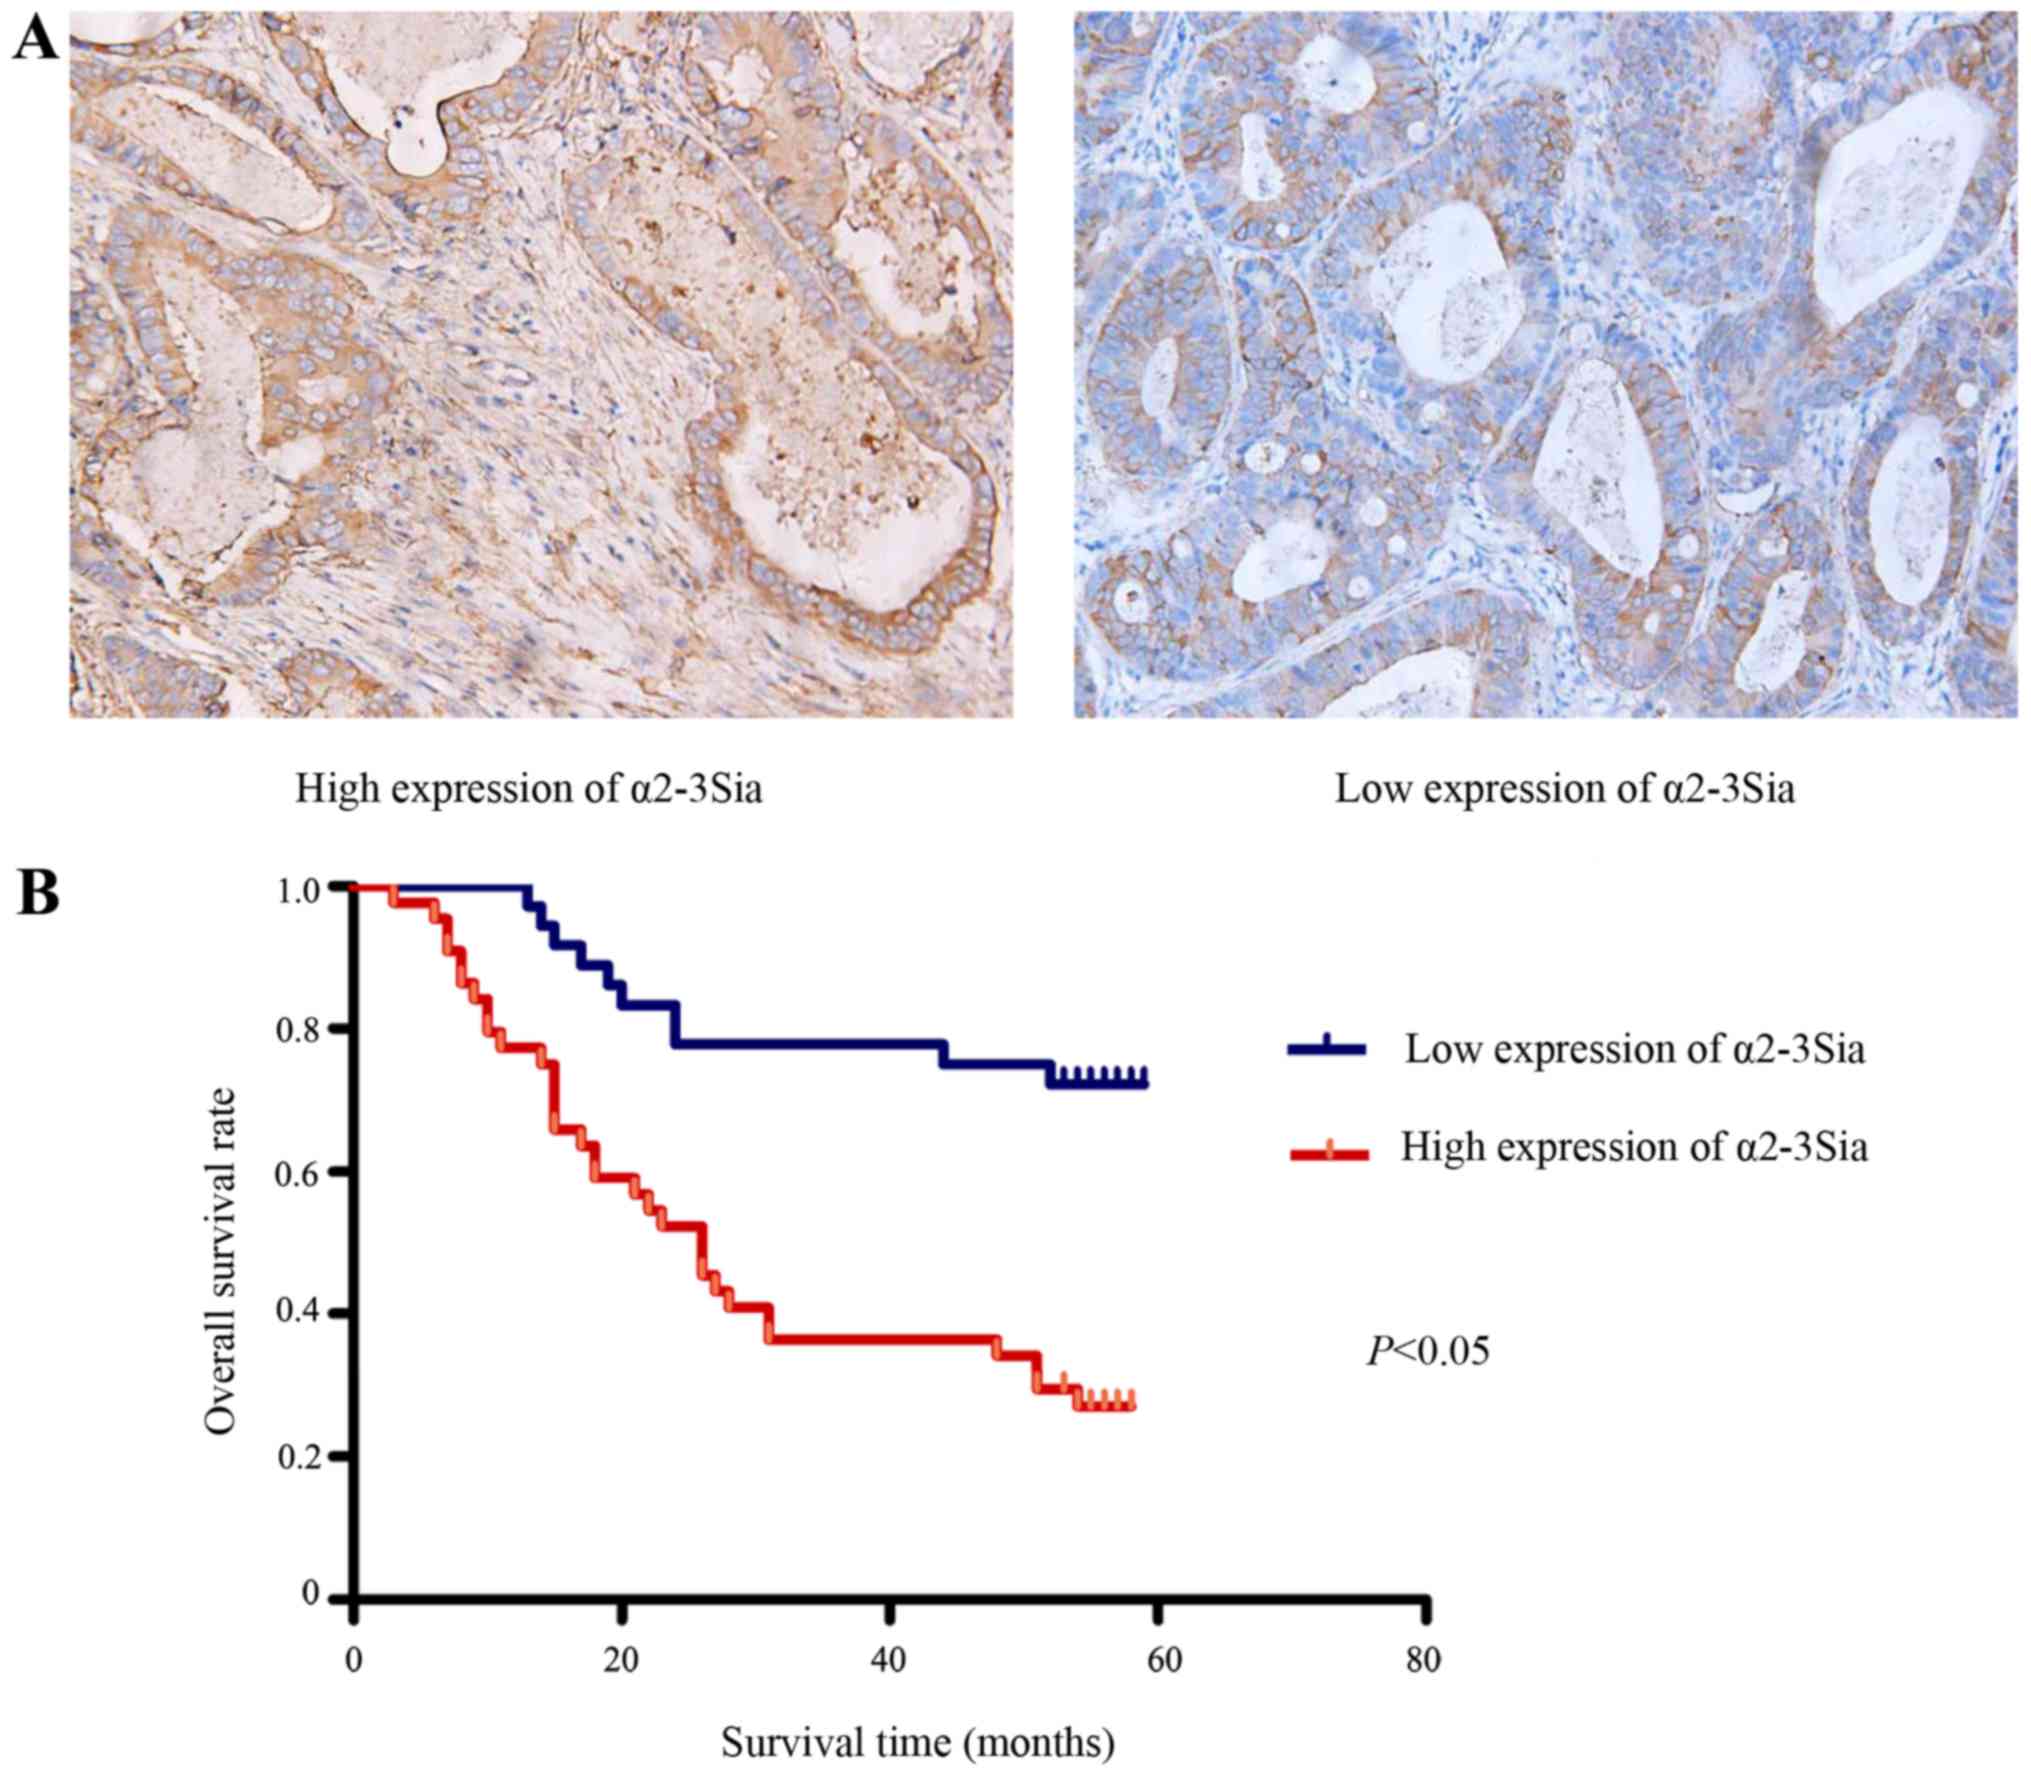
Overexpression of α2-3Sia is associated
with adverse clinical characteristics and poor GC patient
survival
We investigated the expression of α2-3Sia in 80
paraffin-embedded GC tissues using lectin histochemistry. As shown
in Fig. 7A, α2-3Sia was mainly
located in the membrane and cytoplasm of tumor cells. Thirty-six
patients possessed low α2-3Sia expression while the other 44 had
high α2-3Sia expression based on the IRS scores. The associations
between α2-3Sia expression and clinicopathological parameters are
summarized in Table III. High
α2-3Sia expression was positively correlated with lymph node
metastasis (P<0.001), TNM stage (P<0.001) and depth of tumor
invasion (P=0.003). The results also showed that no significant
correlation was observed between the α2-3Sia expression and age,
gender, tumor size, Lauren classification or differentiation.
The relationship between α2-3Sia expression and the
survival time of GC patients was analyzed with Kaplan-Meier sur
vival analysis. We found that the overall survival time of high
α2-3Sia expression group was significantly shorter than that of low
α2-3Sia expression group (P<0.05) (Fig. 7B). Moreover, univariate analysis in
GC tissues showed that lymph node metastasis (P=0.004), TNM stage
(P=0.008), depth of tumor invasion (P=0.034), and α2-3Sia
expression (P=0.002) were prognostic factors of overall survival
(Table IV). Multivariate analysis
using the Cox's proportional hazards model identified that
overexpression of α2-3Sia was an independent factor influencing OS
(hazard ratio, 2.054; 95% CI, 1.302–3.239; P=0.001) of patients
receiving curative resection for GC.
| Table IVUnivariate and multivariate Cox
regression analyses of overall survival in GC patients. |
Table IV
Univariate and multivariate Cox
regression analyses of overall survival in GC patients.
| Variable | Univariate analysis
| Multivariate
analysis
|
|---|
| HR (95% CI) | P-value | HR (95% CI) | P-value |
|---|
| Gender | 1.003
(0.744–1.351) | 0.985 | | |
| Age (years) | 1.218
(0.887–1.671) | 0.223 | | |
| Tumor size | 1.489
(1.074–2.064) | 0.169 | | |
| Lauren
classification | 1.237
(0.974–1.688) | 0.145 | | |
|
Differentiation | 1.096
(0.785–1.952) | 0.753 | | |
| Invasion depth | 1.549
(1.033–2.322) | 0.034a | 1.336
(0.971–1.839) | 0.026a |
| Lymph node
metastasis | 1.943
(1.239–3.047) | 0.004a | 1.378
(0.959–1.979) | 0.002a |
| TNM stage | 1.590
(1.132–2.233) | 0.008a | 0.942
(0.893–1.497) | 0.005a |
| Expression | 1.974
(1.381–2.822) | 0.002a | 2.054
(1.302–3.239) | 0.001a |
Discussion
GC is a common malignancy worldwide, with a poor
prognosis and low survival rates. Metastasis is a crucial factor in
determining the prognosis of GC patients (4). Therefore, it is urgent to identify
metastatic factors and elucidate the underlying molecular
mechanisms. Recent studies revealed that abnormal changes of
glycans in both structures and amounts are closely associated with
tumor-cell migration, adhesion and metastasis (16,17).
In addition, altered glycosylation is a common feature of many
types of cancers, including GC. Based on our data, we speculate
that increased α2-3Sia expression could be very important as
indicator and functional contributor of GC metastasis and poor
prognosis.
Lectin microarray has been proved as a useful
high-throughput tool to analyze cell-surface glycans (18). For specific recognition, lectins
reversibly bind to glycans and do not modify the structure of
glycans. This technique has been successfully applied for screening
cell-specific and functionally significant glycan markers. With
nearly 100 different arrayed lectins, such highly multiplexed
characterization enabled the possibility for the detection of
differences between cells and the identification of glycans
responsible for these differences (19). Using the lectin microarray, Zhou
et al confirmed that glycans containing a single terminal
galactose in triple-negative breast cancer cells were proportional
to their metastatic capacity (20). Nakajima et al reported that
core 1 O-glycans exhibited strikingly intense signals in the
cytoplasm and apical surfaces of colorectal cancer cells (21). Fry et al showed that the
application of this technology was able to discover of specific
glycan signatures associated with metastatic breast cancer
(22). With a unique
high-throughput lectin microarray, we identified clear differences
in glycan composition between GC cells that differed in metastatic
capacity. Three lectins, LEL, Jacalin and MAL-I displayed
significant increases in binding in high-metastatic compared with
low-metastatic GC cells. LEL specifically recognizes the
polylactosamine-type N-glycans (23). Jacalin strongly binds with T
antigen (24). This is consistent
with previous study which suggested that highly metastatic cancer
cells expressed more polylactosamine chains (25) and T antigen expression was related
to the depth of invasion and lymph node metastasis in GC patients
(26). MAL-I is used widely in the
detection and characterization of α2-3Sia in human cancer cells
(15). While the functional
implications of these changes remains to be further investigated,
the present study revealed the important role of α2-3Sia signal in
regulating GC cell migration and invasion.
Sialic acids, as terminal monosaccharide were added
to glycoproteins or glycolipids, could link to Galβ1,3(4)GlcNAc/Glc via α2,3 or α2,6 and mediated
a variety of pathological process (27). The altered sialic acid residues
were reported to be closely associated with cellular adhesion,
migration and metastasis in tumor cells (28–30).
Up to now, an increasing number of studies suggested that an
increased sialic acid content in cancer cells is caused by
upregulating of sialyltransferase and depended on the mRNA levels
of sialyltransferase gene. ST3Gal-I is responsible for
α2,3-sialylation of Galα1, 3GalNAc on O-linked glycans. Transfer of
α2-3Sia to Galα1, (3)4GlcNAc on
N-linked glycans is catalyzed by ST3Gal-III or ST3Gal-IV (31). Increased expression, relative to
normal tissue, of ST3Gal-IV is observed in many carcinomas,
especially GC (32). In agreement
with these studies, we found a significantly increased expression
of ST3Gal-IV in highly metastatic GC cells. Moreover, we have shown
that there is a significant correlation between ST3Gal-IV
expression and α2-3Sia expression in GC cells. Further functional
study will be conducted to explore the correlation between α2-3Sia
and ST3Gal-III in other GC cells. More types of GC cells will be
used and the role of ST3Gal-III will be investigated in our future
study.
The molecular mechanisms underlying the effect of
α2-3Sia on the invasion and metastasis of human GC were largely
unknown. In this study, we first examined whether ST3Gal-IV could
affect cells migration and invasion ability by wound-healing assay
and Transwell assays. The results showed that suppression of
ST3Gal-IV in MGC-803 cells led to significant decreases in cell
migration and invasion, while its upregulation in SGC-7901 cells
resulted in the converse. In addition, the levels of α2-3Sia
residues were subsequently changed by the alteration of ST3Gal-IV.
These observations clearly indicate that the changes in ST3Gal-IV
expression levels may have impact in the remodeling of cell surface
sialylation, which may consequently affect the biological functions
of tumor cells such as invasion and metastasis.
ST3Gal-IV was reported to be important in invasion
and metastasis of tumor cells. For example, Soyasaponin-1 inhibited
ST3Gal-IV activity and decreased α2-3Sia in MCF-7 breast cancer
cells (33). ST3Gal-IV was also
overexpressed in human hepatic carcinoma cell lines, compared with
normal hepatic cell line (34).
ST3Gal-IV was involved in key steps of pancreatic tumor progression
processes and was highly expressed in most pancreatic
adenocarcinoma tissues (35).
Moreover, overexpression of ST3Gal-IV could induce activation of
cell signaling pathways and alteration in GC cell line phenotype
(36). TNF-induced upregulation of
the ST3Gal-IV transcript was mediated by MSK1/2 through the ERK and
p38 MAPK pathways (37). These
data may offer important clues for future studies into the
mechanism of α2-3Sia related to the progression and metastasis of
GC.
The results of the present study also showed that
α2-3Sia expression was positively correlated with lymph node
metastasis, TNM stage and depth of tumor invasion. Similar results
were also observed by Wang et al (12). Interestingly, Kaplan-Meier analysis
revealed that α2-3Sia expression predicted poor overall survival.
Multivariate analysis using the Cox's proportional hazards model
suggested α2-3Sia expression was an independent prognostic
indicator of patients' overall survival. To our knowledge, our
results for the first time provide the above new evidence of
α2-3Sia in the prognosis of GC patients.
In conclusion, we found several lectins that
exhibited altered bindings to GC cells with different metastatic
abilities using a high-density lectin microarray. In particular,
the levels of α2-3Sia, which can be regulated by ST3Gal-IV, showed
a positive correlation with the metastatic capacity of GC cells.
Overexpression of α2-3Sia could be an independent factor predicting
poor survival and an attractive therapeutic target for GC, but
further studies are required.
Acknowledgments
The present study was supported by the Natural
Science Foundation of Hubei Provincial Department of Education (no.
Q20162115), Innovative Research Team of Hubei University of
Medicine (no. 2014CXG02), and the Scientific and Technological
Project of Shiyan City of Hubei Province (no. 15K65).
References
|
1
|
Wang C, Zhang J, Cai M, Zhu Z, Gu W, Yu Y
and Zhang X: DBGC: A Database of Human Gastric Cancer. PLoS One.
10:e01425912015. View Article : Google Scholar : PubMed/NCBI
|
|
2
|
Torre LA, Bray F, Siegel RL, Ferlay J,
Lortet-Tieulent J and Jemal A: Global cancer statistics, 2012. CA
Cancer J Clin. 65:87–108. 2015. View Article : Google Scholar : PubMed/NCBI
|
|
3
|
Chen W, Zheng R, Baade PD, Zhang S, Zeng
H, Bray F, Jemal A, Yu XQ and He J: Cancer statistics in China,
2015. CA Cancer J Clin. 66:115–132. 2016. View Article : Google Scholar : PubMed/NCBI
|
|
4
|
Liu X, Ge X, Zhang Z, Zhang X, Chang J, Wu
Z, Tang W, Gan L, Sun M and Li J: MicroRNA-940 promotes tumor cell
invasion and metastasis by downregulating ZNF24 in gastric cancer.
Oncotarget. 6:25418–25428. 2015. View Article : Google Scholar : PubMed/NCBI
|
|
5
|
Hart GW and Copeland RJ: Glycomics hits
the big time. Cell. 143:672–676. 2010. View Article : Google Scholar : PubMed/NCBI
|
|
6
|
Munkley J and Elliott DJ: Hallmarks of
glycosylation in cancer. Oncotarget. 7:35478–35489. 2016.PubMed/NCBI
|
|
7
|
Pinho SS and Reis CA: Glycosylation in
cancer: Mechanisms and clinical implications. Nat Rev Cancer.
15:540–555. 2015. View
Article : Google Scholar : PubMed/NCBI
|
|
8
|
Tsai CH, Tzeng SF, Chao TK, Tsai CY, Yang
YC, Lee MT, Hwang JJ, Chou YC, Tsai MH, Cha TL, et al: Metastatic
progression of prostate cancer is mediated by autonomous binding of
galectin-4-O-glycan to cancer cells. Cancer Res. 76:5756–5767.
2016. View Article : Google Scholar : PubMed/NCBI
|
|
9
|
Zhang X, Wang Y, Qian Y, Wu X, Zhang Z,
Liu X, Zhao R, Zhou L, Ruan Y, Xu J, et al: Discovery of specific
metastasis-related N-glycan alterations in epithelial ovarian
cancer based on quantitative glycomics. PLoS One. 9:e879782014.
View Article : Google Scholar : PubMed/NCBI
|
|
10
|
Liu L, Yan B, Huang J, Gu Q, Wang L, Fang
M, Jiao J and Yue X: The identification and characterization of
novel N-glycan-based biomarkers in gastric cancer. PLoS One.
8:e778212013. View Article : Google Scholar : PubMed/NCBI
|
|
11
|
Zhao YP, Xu XY, Fang M, Wang H, You Q, Yi
CH, Ji J, Gu X, Zhou PT, Cheng C, et al: Decreased
core-fucosylation contributes to malignancy in gastric cancer. PLoS
One. 9:e945362014. View Article : Google Scholar : PubMed/NCBI
|
|
12
|
Wang FL, Cui SX, Sun LP, Qu XJ, Xie YY,
Zhou L, Mu YL, Tang W and Wang YS: High expression of alpha
2,3-linked sialic acid residues is associated with the metastatic
potential of human gastric cancer. Cancer Detect Prev. 32:437–443.
2009. View Article : Google Scholar
|
|
13
|
Shen L, Yu M, Xu X, Gao L, Ni J, Luo Z and
Wu S: Knockdown of β3GnT8 reverses 5-fluorouracil resistance in
human colorectal cancer cells via inhibition the biosynthesis of
polylactosamine-type N-glycans. Int J Oncol. 45:2560–2568.
2014.PubMed/NCBI
|
|
14
|
Wang X, He H, Zhang H, Chen W, Ji Y, Tang
Z, Fang Y, Wang C, Liu F, Shen Z, et al: Clinical and prognostic
implications of β1, 6-N-acetylglucosaminyltransferase V in patients
with gastric cancer. Cancer Sci. 104:185–193. 2013. View Article : Google Scholar
|
|
15
|
Badr HA, Elsayed AI, Ahmed H, Dwek MV, Li
CZ and Djansugurova LB: Preferential lectin binding of cancer cells
upon sialic acid treatment under nutrient deprivation. Appl Biochem
Biotechnol. 171:963–974. 2013. View Article : Google Scholar : PubMed/NCBI
|
|
16
|
Nie H, Liu X, Zhang Y, Li T, Zhan C, Huo
W, He A, Yao Y, Jin Y, Qu Y, et al: Specific N-glycans of
hepatocellular carcinoma cell surface and the abnormal increase of
core-α-1,6-fucosylated triantennary glycan via
N-acetylglucosaminyltransferases-IVa regulation. Sci Rep.
5:160072015. View Article : Google Scholar
|
|
17
|
Häuselmann I and Borsig L: Altered
tumor-cell glycosylation promotes metastasis. Front Oncol.
4:282014. View Article : Google Scholar : PubMed/NCBI
|
|
18
|
Hirabayashi J, Kuno A and Tateno H:
Development and applications of the lectin microarray. Top Curr
Chem. 367:105–124. 2015. View Article : Google Scholar : PubMed/NCBI
|
|
19
|
Tao SC, Li Y, Zhou J, Qian J, Schnaar RL,
Zhang Y, Goldstein IJ, Zhu H and Schneck JP: Lectin microarrays
identify cell-specific and functionally significant cell surface
glycan markers. Glycobiology. 18:761–769. 2008. View Article : Google Scholar : PubMed/NCBI
|
|
20
|
Zhou SM, Cheng L, Guo SJ, Wang Y,
Czajkowsky DM, Gao H, Hu XF and Tao SC: Lectin RCA-I specifically
binds to metastasis-associated cell surface glycans in
triple-negative breast cancer. Breast Cancer Res. 17:362015.
View Article : Google Scholar : PubMed/NCBI
|
|
21
|
Nakajima K, Inomata M, Iha H, Hiratsuka T,
Etoh T, Shiraishi N, Kashima K and Kitano S: Establishment of new
predictive markers for distant recurrence of colorectal cancer
using lectin microarray analysis. Cancer Med. 4:293–302. 2015.
View Article : Google Scholar :
|
|
22
|
Fry SA, Afrough B, Lomax-Browne HJ, Timms
JF, Velentzis LS and Leathem AJ: Lectin microarray profiling of
metastatic breast cancers. Glycobiology. 21:1060–1070. 2011.
View Article : Google Scholar : PubMed/NCBI
|
|
23
|
Mitsui Y, Yamada K, Hara S, Kinoshita M,
Hayakawa T and Kakehi K: Comparative studies on glycoproteins
expressing polylactosamine-type N-glycans in cancer cells. J Pharm
Biomed Anal. 70:718–726. 2012. View Article : Google Scholar : PubMed/NCBI
|
|
24
|
Ayaz Ahmed KB, Mohammed AS and Veerappan
A: Interaction of sugar stabilized silver nanoparticles with the
T-antigen specific lectin, jacalin from Artocarpus integrifolia.
Spectrochim Acta A Mol Biomol Spectrosc. 145:110–116. 2015.
View Article : Google Scholar : PubMed/NCBI
|
|
25
|
Kinoshita M, Mitsui Y, Kakoi N, Yamada K,
Hayakawa T and Kakehi K: Common glycoproteins expressing
polylactosamine-type glycans on matched patient primary and
metastatic melanoma cells show different glycan profiles. J
Proteome Res. 13:1021–1033. 2014. View Article : Google Scholar
|
|
26
|
Carneiro F, David L and Sobrinho-Simões M:
Prognostic significance of T antigen expression in patients with
gastric carcinoma. Cancer. 78:2448–2450. 1996. View Article : Google Scholar : PubMed/NCBI
|
|
27
|
Cui H, Lin Y, Yue L, Zhao X and Liu J:
Differential expression of the α2,3-sialic acid residues in breast
cancer is associated with metastatic potential. Oncol Rep.
25:1365–1371. 2011.PubMed/NCBI
|
|
28
|
Schultz MJ, Swindall AF and Bellis SL:
Regulation of the metastatic cell phenotype by sialylated glycans.
Cancer Metastasis Rev. 31:501–518. 2012. View Article : Google Scholar : PubMed/NCBI
|
|
29
|
Liu YC, Yen HY, Chen CY, Chen CH, Cheng
PF, Juan YH, Chen CH, Khoo KH, Yu CJ, Yang PC, et al: Sialylation
and fucosylation of epidermal growth factor receptor suppress its
dimerization and activation in lung cancer cells. Proc Natl Acad
Sci USA. 108:11332–11337. 2011. View Article : Google Scholar : PubMed/NCBI
|
|
30
|
Wang S, Chen X, Wei A, Yu X, Niang B and
Zhang J: α2,6-linked sialic acids on N-glycans modulate the
adhesion of hepatocarcinoma cells to lymph nodes. Tumour Biol.
36:885–892. 2015. View Article : Google Scholar
|
|
31
|
Petretti T, Kemmner W, Schulze B and
Schlag PM: Altered mRNA expression of glycosyltransferases in human
colorectal carcinomas and liver metastases. Gut. 46:359–366. 2000.
View Article : Google Scholar : PubMed/NCBI
|
|
32
|
Petretti T, Schulze B, Schlag PM and
Kemmner W: Altered mRNA expression of glycosyltransferases in human
gastric carcinomas. Biochim Biophys Acta. 1428:209–218. 1999.
View Article : Google Scholar : PubMed/NCBI
|
|
33
|
Higai K, Miyazaki N, Azuma Y and Matsumoto
K: Interleukin-1beta induces sialyl Lewis X on hepatocellular
carcinoma HuH-7 cells via enhanced expression of ST3Gal IV and FUT
VI gene. FEBS Lett. 580:6069–6075. 2006. View Article : Google Scholar : PubMed/NCBI
|
|
34
|
Zhang Y, Zhao W, Zhao Y and He Q:
Expression of ST3Gal, ST6Gal, ST6GalNAc and ST8Sia in human hepatic
carcinoma cell lines, HepG-2 and SMMC-7721 and normal hepatic cell
line, L-02. Glycoconj J. 32:39–47. 2015. View Article : Google Scholar : PubMed/NCBI
|
|
35
|
Pérez-Garay M, Arteta B, Llop E, Cobler L,
Pagès L, Ortiz R, Ferri MJ, de Bolós C, Figueras J, de Llorens R,
et al: α2,3-Sialyltransferase ST3Gal IV promotes migration and
metastasis in pancreatic adenocarcinoma cells and tends to be
highly expressed in pancreatic adenocarcinoma tissues. Int J
Biochem Cell Biol. 45:1748–1757. 2013. View Article : Google Scholar
|
|
36
|
Gomes C, Osorio H, Pinto MT and Celso A:
Overexpression of ST3Gal-IV induces activation of cell signaling
pathways and alteration in gastric cancer cell line phenotype.
Glycobiology. 22:1645–1646. 2012.
|
|
37
|
Colomb F, Vidal O, Bobowski M,
Krzewinski-Recchi MA, Harduin-Lepers A, Mensier E, Jaillard S,
Lafitte JJ, Delannoy P and Groux-Degroote S: TNF induces the
expression of the sialyltransferase ST3Gal IV in human bronchial
mucosa via MSK1/2 protein kinases and increases
FliD/sialyl-Lewis(x)-mediated adhesion of Pseudomonas aeruginosa.
Biochem J. 457:79–87. 2014. View Article : Google Scholar
|