Introduction
Hypertension is a medical condition in which the
pressure of blood in the arteries is consistently elevated. Of
note, 15-20% of adults worldwide are affected by hypertension,
which is defined as having a systolic blood pressure of at least
140 mmHg and/or a diastolic blood pressure of at least 90 mmHg
(1). Although high blood pressure
typically does not exhibit any symptoms, it can lead to severe
health issues, such as peripheral arterial disease, atrial
fibrillation, stroke, heart failure, chronic kidney disease, vision
loss and dementia (2). Hypertension
is a leading cause of premature mortality globally. High blood
pressure is divided into primary or essential hypertension and
secondary hypertension. Of note, 90-95% of cases are primary,
characterized by high blood pressure caused by non-specific
lifestyle and genetic factors (3).
Risk factors for primary hypertension include excessive salt
consumption, obesity, smoking, a lack of physical activity and
alcohol consumption. The remainder 5-10% of cases fall under
secondary hypertension, which is high blood pressure caused by a
specific identifiable factor, such as chronic kidney disease,
kidney artery narrowing, an endocrine disorder, or the use of birth
control pills (4).
Electrolytes are compounds that play a crucial role
in various bodily functions. They help maintain the balance of
fluids inside and outside cells, as well as contribute to muscle
contraction and heart function. The evaluation of electrolyte
levels has been a focus of research worldwide for a number of
years. Any imbalance in electrolytes can disrupt normal bodily
functions, leading to abnormal increases or decreases in levels
(5). Electrolyte imbalances are
often the primary indicator of numerous diseases and are prevalent
in both the general population and hospitalized patients. Previous
research has indicated that electrolyte disorders are linked to
higher rates of morbidity and mortality (6). Imbalances in electrolyte levels can
also contribute to the development of severe cardiovascular
conditions, such as hypertension. It is crucial to investigate
whether electrolyte imbalances are connected to specific risk
factors for chronic diseases that can be life-threatening (7). Understanding this association can help
in the management of these risk factors by regulating serum
electrolyte levels. This proactive approach may aid in the
prevention or delay in the onset of these diseases and their
associated complications, particularly in cases of
hypertension.
Clinical investigations of renal function, including
uric acid, urea and creatinine levels, are essential for
identifying renal dysfunction, diagnosing renal disease, monitoring
disease progression, and assessing response to treatment. The
relative risk of severe renal damage in patients with uncomplicated
essential hypertension is low compared to other cardiovascular
complications (8). However, due to
the high prevalence of hypertension in the general population, it
remains the second leading cause of end-stage renal disease, with
the risk being significantly higher in individuals of African
origin. Renal dysfunction is recognized as an independent risk
factor for morbidity and mortality in congestive heart failure. The
well-established association between heart failure and chronic
kidney disease is known as the cardiorenal syndrome (9). It has been shown that renal dysfunction
is independently associated with the development of heart failure
in hypertensive patients. Hypertension and renal impairment have a
bidirectional cause-and-effect association, with each being a
common cause of the other. Therefore, the early diagnosis of kidney
disease is crucial for effectively managing patients with
hypertension (10).
Vitamin D is a prohormone that is converted
metabolically to its active form, 1,25-dihydroxyvitamin D
[1,25(OH)2D]. This hormone activates the vitamin D receptor, which
then regulates the transcription of genes responsible for various
biological responses (11). Vitamin
D is obtained through the diet and exposure to sunlight, and plays
a crucial role in regulating calcium levels in the body. It
influences the absorption and metabolism of calcium by influencing
voltage-dependent calcium channels and the
renin-angiotensin-aldosterone system (RAAS). This system controls
renin production, which in turn affects the secretion of
parathyroid hormone (12). Research
conducted in recent years has revealed a number of other biological
functions of vitamin D, including cell differentiation, cell growth
inhibition, immunomodulation and the regulation of hormonal systems
(7). Additionally, vitamin D has
been shown to improve endothelial function by increasing nitric
oxide production, preventing calcification, maintaining vascular
tone and reducing inflammation. Furthermore, the lack of vitamin D
has been linked to the development of non-skeletal conditions, such
as hypertension, kidney disease, and insulin resistance (13). Therefore, the present study was
performed to determine the mechanisms through which electrolyte
disturbances in hypertensive patients are associated with renal
function and vitamin D levels in a Nigerian hypertensive
population.
Subjects and methods
Study area
The present study was conducted at the Federal
Teaching Hospital Ido (FETHI), Ido-Ekiti, Ekiti State. Ekiti State
is primarily a highland area located ~50 m above sea level, with
coordinates of 7˚40'N 5˚15'E. It is bordered to the north by Kwara
State for 61 km, to the northeast by Kogi State for 92 km, to the
south and southeast by Ondo State, and to the west by Osun State
for 84 km. Ekiti is the 31st largest state in terms of area and the
30th most populous, with an estimated population of almost 3.3
million as of 2016 in Nigeria (14).
Study design
The present study was a case-control study conducted
on hypertensive patients attending the clinic at the Federal
Teaching Hospital Ido (FETHI), Ido-Ekiti, Ekiti State, Nigeria from
February, 2023 to August, 2023. Data collection was performed using
a semi-structured questionnaire that included items on demographic
characteristics such as age, sex, etc., and anthropometric
parameters, such as weight and height. Sample size was calculated
using the following formula: N=Z2pq/d2. The
study population consisted of 155 subjects, comprising 83
hypertensive subjects and 72 sex- and age-matched healthy
normotensive subjects as controls. Hypertensive subjects aged 18-60
years, with or without anti-hypertensive treatment, who provided
consent were included in the study. Pregnant women, nursing
mothers, individuals with other health conditions, those taking
vitamins or mineral supplements, and those who did not provide
consent were excluded from the study. The control subjects
(normotensive) were apparently healthy individuals who had no
history of high blood pressure and had no underlying health
condition.
Ethical approval
Ethical approval for sample collection was obtained
from the Health Research Ethics Committee at the Federal Teaching
Hospital Ido (FETHI), Ido-Ekiti, Ekiti State. Informed consent was
obtained from each subject who participated in the study prior to
sample collection. Additionally, the study was conducted in
accordance with the Declaration of Helsinki.
Sample collection and analysis
A total of 5 ml of blood samples were collected from
each subject via venipuncture and dispensed into a plain bottle.
The sample was allowed to clot for 1 h, after which the serum was
separated by centrifugation at 16,087 x g for 5 min at room
temperature. The serum was then carefully withdrawn into a
pre-labeled tube and stored at -20˚C until analysis.
Blood pressure measurements
Blood pressure was measured using a mercury
sphygmomanometer (KENZ Model 605P, Suzuken Co., Ltd.). Participants
were allowed to sit and rest in a quiet area for at least 15 min
before the measurements were taken. Blood pressure was measured on
the right arm with the arm relaxed and supported on a table at a
45˚ angle to the trunk. A total of three measurements taken at
5-min intervals were averaged for diastolic blood pressure (DBP)
and systolic blood pressure (SBP). Variations of <5 mmHg were
permitted. Based on their average SBP and DBP values, the study
participants were divided into two groups (the hypertensive and
non-hypertensive groups).
Body mass index (BMI)
Weight measurements were performed using a weighing
scale, height was measured using a meter rule, and BMI was
calculated using the formula: Weight (kg)/height
(m2).
Biochemical parameters
Sodium and potassium levels were estimated using an
ion selective electrolyte (ISE) analyzer branded Biolyte 2000
(BioCare Corporation) (15).
Calcium, magnesium and phosphorus levels were estimated using
spectrophotometry (722G VIS Spectrophotometer, Shanghai Drawell
Scientific Instrument Co., Ltd.) (16). Uric acid, creatinine and urea levels
were measured using a semi-auto chemistry analyzer (Mindray BA-88;
serial no. BH7AB2710, Shenzhen Mindray Bio-Medical Electronics Co.,
Ltd.) based on the enzyme colorimetry (Uricase TBHBA), Jaffe and
Berthelot methods, respectively (9).
Vitamin D was estimated using enzyme-linked immunosorbent assay
(ELISA) techniques (Elabscience Biotechnology Inc.) according to
the manufacturer's instructions and as previously described
(17).
Statistical analysis
The results are presented using tables and charts as
the mean ± standard deviation. Data analysis was conducted using
SPSS software (version 23.0; IBM Corp.). Statistical significance
was determined between groups using the Student's t-test, while
Pearson's correlation analysis was used to determine the
correlation between variables. A P-value <0.05 considered to
indicate a statistically significant difference.
Results
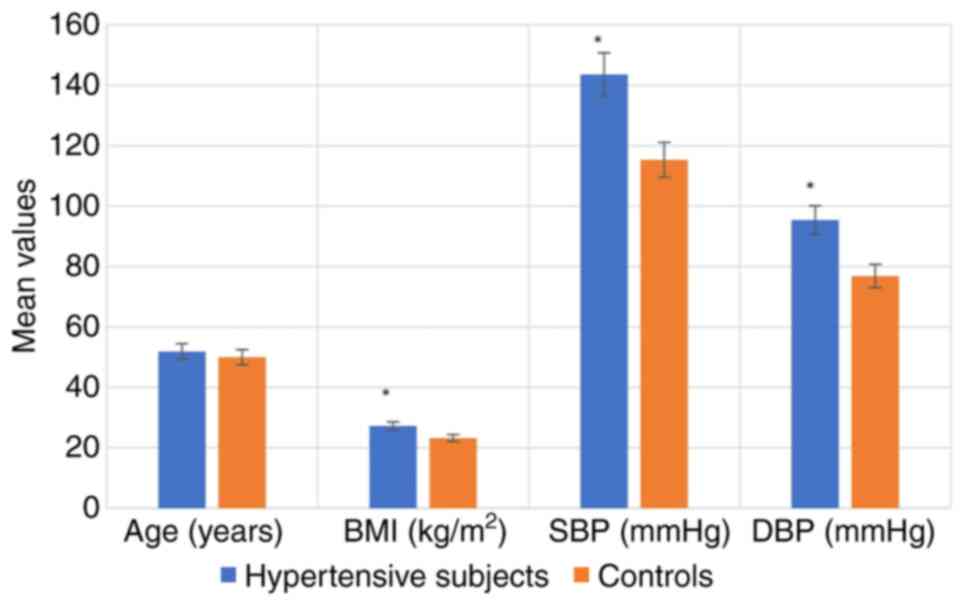
The anthropometric characteristics of the
hypertensive subjects and controls are illustrated in Fig. 1. The results indicated that BMI, SBP
and DBP were significantly higher in the hypertensive subjects
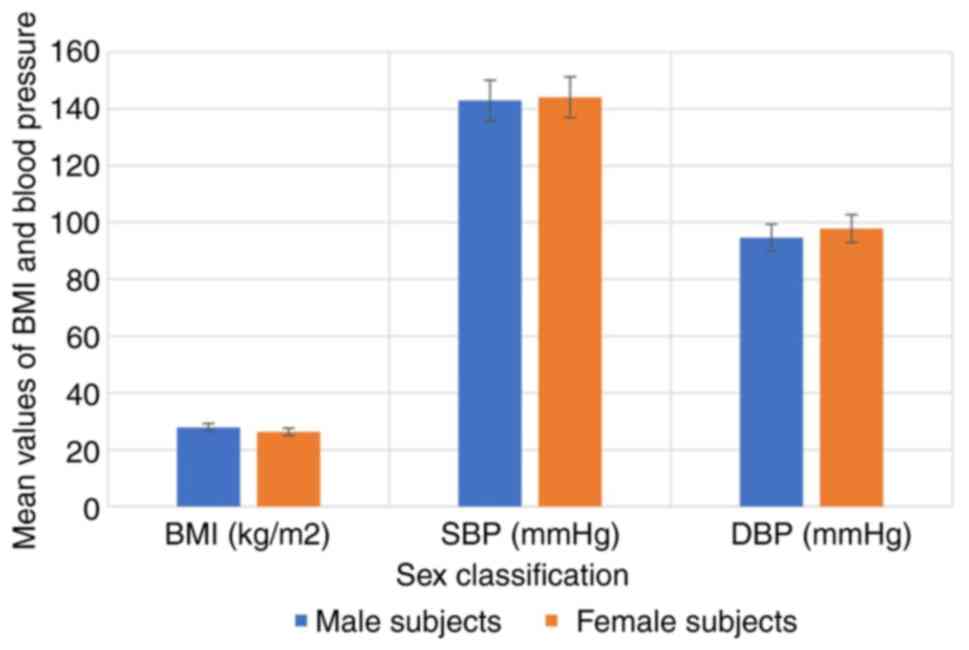
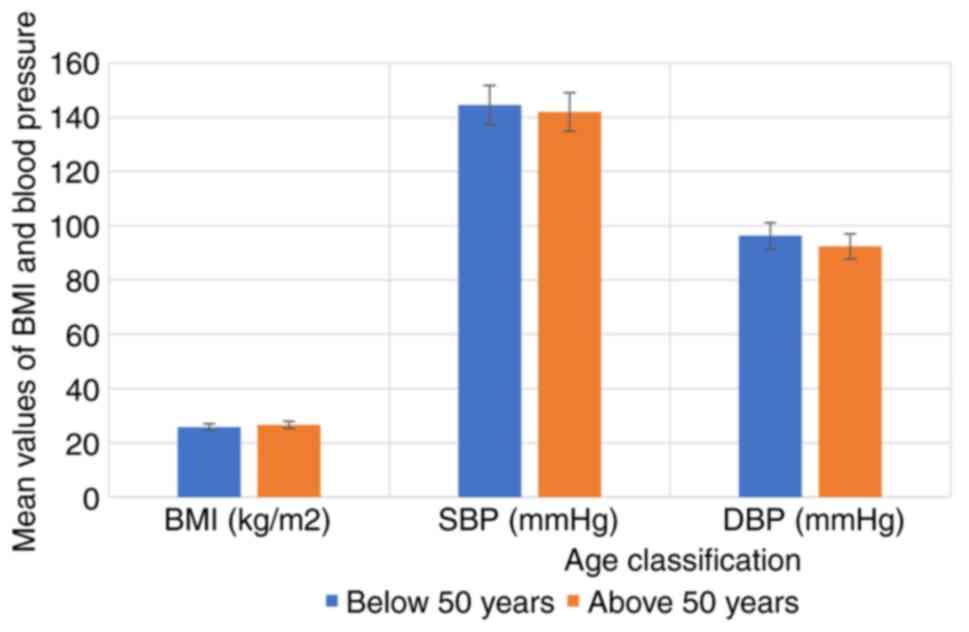
compared with the controls (P<0.05). The anthropometric
characteristics of the hypertensive subjects by sex are depicted in
Fig. 2, while the anthropometric
characteristics of the hypertensive subjects by age are depicted in
Fig. 3. The results revealed that
there were no significant differences in the BMI, SBP and DBP of
the hypertensive subjects as regards age and sex (P>0.05).
The renal function parameters, electrolyte and
vitamin D levels of the hypertensive subjects and the controls are
presented in Table I. The findings
revealed that the creatinine, urea, uric acid, magnesium, sodium,
sodium/potassium ratio and sodium/calcium levels were significantly
higher in the hypertensive subjects compared with the healthy
controls (P<0.05). The vitamin D, calcium, potassium and
phosphate levels were significantly lower in the hypertensive
subjects compared with the healthy controls (P<0.05). There was
no significant difference in the potassium/calcium ratio between
the two groups (P>0.05). The renal function parameters,
electrolyte and vitamin D levels of the hypertensive subjects based
on sex are presented in Table II.
The results revealed that there were no significant differences in
all parameters studied based on sex (P>0.05). The renal function
parameters, electrolyte and vitamin D levels of the hypertensive
subjects according to age are demonstrated in Table III. The results indicated that
there were no significant differences in all parameters studied
based on age (P>0.05), apart from the phosphate levels, which
were significantly higher in the subjects <50 years of age
compared to those >50 years of age. The results of the
correlation analysis between renal function parameters, electrolyte
and vitamin D levels in the hypertensive subjects are presented in
Table IV and Fig. S1, Fig.
S2, Fig. S3, Fig. S4, Fig.
S5 and Fig. S6. The results
obtained revealed a significant correlation between the parameters
examined and blood pressure. Creatinine (r=0.211, P=0.142), urea
(r=0.088, P=0.543), uric acid (r=0.442, P=0.033), vitamin D
(r=0.281, P=0.048), sodium (r=0.176, P=0.221) and potassium
(r=0.342, P=0.020) exhibited positive correlations with SBP.
 | Table IRenal function parameters,
electrolytes and vitamin D levels of the hypertensive subjects and
controls. |
Table I
Renal function parameters,
electrolytes and vitamin D levels of the hypertensive subjects and
controls.
| Parameter | Hypertensive
subjects (n=83) | Controls
(n=72) | P-value |
|---|
| Creatinine
(µmol/l) | 129.91±8.74 | 96.04±8.44 | 0.001a |
| Urea (mmol/l) | 6.87±1.06 | 4.81±0.89 | 0.006a |
| Uric acid
(µmol/l) | 329.84±64.42 | 294.30±55.74 | 0.039a |
| Magnesium
(mg/dl) | 1.19±0.29 | 0.97±0.28 | 0.044a |
| Phosphate
(mmol/l) | 1.12±0.51 | 1.66±0.62 | 0.001a |
| Sodium
(mmol/l) | 141.36±3.79 | 135.74±3.55 | 0.001a |
| Potassium
(mmoll) | 4.01±0.67 | 4.26±0.51 | 0.017a |
| Calcium
(mmol/l) | 2.12±0.31 | 2.47±0.33 | 0.012a |
| Vitamin D
(ng/ml) | 29.54±2.59 | 42.35±6.09 | 0.001a |
| Sodium/potassium
ratio | 35.25±2.26 | 31.86±2.35 | 0.001a |
| Sodium/calcium
ratio | 66.68±2.89 | 54.96±2.67 | 0.001a |
| Potassium/calcium
ratio | 1.89±0.16 | 1.72±0.34 | 0.179 |
| Table IIRenal function parameters,
electrolytes and vitamin D levels of the hypertensive subjects as
regards sex. |
Table II
Renal function parameters,
electrolytes and vitamin D levels of the hypertensive subjects as
regards sex.
| Parameter | Male subjects
(n=39) | Female subjects
(n=44) | P-value |
|---|
| Creatinine
(µmol/l) | 134.34±11.20 | 126.10±7.01 | 0.252 |
| Urea (mmol/l) | 5.25±1.52 | 5.83±1.67 | 0.213 |
| Uric acid
(µmol/l) | 301.25±70.66 | 284.50±72.50 | 0.514 |
| Magnesium
(mg/dl) | 1.02±0.24 | 1.15±0.31 | 0.215 |
| Phosphate
(mmol/l) | 0.98±0.49 | 1.26±0.49 | 0.069 |
| Sodium
(mmol/l) | 136.75±3.86 | 135.92±3.70 | 0.468 |
| Potassium
(mmol/l) | 4.13±0.79 | 4.07±0.53 | 0.802 |
| Calcium
(mmol/l) | 2.54±0.31 | 2.24±0.30 | 0.177 |
| Vitamin D
(ng/ml) | 30.04±15.26 | 27.70±15.05 | 0.111 |
| Sodium/potassium
ratio | 33.11±2.16 | 33.39±2.41 | 0.672 |
| Sodium/calcium
ratio | 53.84±3.91 | 60.68±3.84 | 0.098 |
| Potassium/calcium
ratio | 1.63±0.12 | 1.82±0.21 | 0.321 |
| Table IIIRenal function parameters,
electrolytes and vitamin D levels of the hypertensive subjects as
regards age. |
Table III
Renal function parameters,
electrolytes and vitamin D levels of the hypertensive subjects as
regards age.
| Parameter | <50 years of age
(n=40) | >50 years of age
(n=43) | P-value |
|---|
| Creatinine
(µmol/l) | 134.49±15.03 | 124.02±11.24 | 0.053 |
| Urea (mmol/l) | 5.73±1.59 | 5.07±1.53 | 0.104 |
| Uric acid
(µmol/l) | 313.04±54.57 | 289.37±53.30 | 0.345 |
| Magnesium
(mg/dl) | 1.09±0.23 | 1.08±0.31 | 0.884 |
| Phosphate
(mmol/l) | 1.33±0.50 | 0.92±0.39 | 0.007a |
| Sodium
(mmol/l) | 136.52±3.58 | 136.35±3.85 | 0.886 |
| Potassium
(mmol/l) | 4.10±0.45 | 4.17±0.82 | 0.709 |
| Calcium
(mmol/l) | 2.39±0.33 | 2.53±0.24 | 0.167 |
| Vitamin D
(ng/ml) | 41.05±5.16 | 44.97±7.06 | 0.396 |
| Sodium/potassium
ratio | 33.29±3.01 | 32.69±2.97 | 0.459 |
| Sodium/calcium
ratio | 57.12±3.78 | 53.89±4.02 | 0.212 |
| Potassium/calcium
ratio | 1.72±0.15 | 1.65±0.16 | 0.623 |
| Table IVCorrelation between renal function
parameters, electrolytes and vitamin D levels in hypertensive
subjects. |
Table IV
Correlation between renal function
parameters, electrolytes and vitamin D levels in hypertensive
subjects.
| | | SBP | DBP | CRT | Urea | UA | Mg | Ca | Na | K | VitD |
|---|
| SBP | Pearson's
correlation | | 0.608b | 0.211 | 0.088 | 0.442 | -0.001 | -0.065 | 0.176 | 0.342 | 0.281a |
| | Sig.
(2-tailed) | | 0.000 | 0.142 | 0.543 | 0.033a | 0.996 | 0.655 | 0.221 | 0.020 | 0.048 |
| DBP | Pearson's
correlation | 0.608b | | 0.085 | 0.134 | 0.442 | 0.004 | -0.083 | -0.083 | 0.248 | -0.115 |
| | Sig.
(2-tailed) | 0.001 | | 0.558 | 0.353 | 0.033a | 0.981 | 0.568 | 0.566 | 0.082 | 0.425 |
| CRT | Pearson's
correlation | 0.211 | 0.085 | | 0.281a | 0.248 | -0.039 | -0.268 | -0.024 | 0.038 | -0.116 |
| | Sig.
(2-tailed) | 0.142 | 0.558 | | 0.048 | 0.082 | 0.787 | 0.060 | 0.870 | 0.791 | 0.421 |
| Urea | Pearson's
correlation | 0.088 | 0.134 | 0.281a | | 0.064 | -0.049 | -0.004 | -0.023 | 0.193 | -0.012 |
| | Sig.
(2-tailed) | 0.543 | 0.353 | 0.048 | | 0.661 | 0.734 | 0.980 | 0.873 | 0.179 | 0.936 |
| UA | Pearson's
correlation | 0.442 | 0.129 | 0.248 | 0.064 | | 0.038 | 0.108 | -0.023 | 0.306a | 0.122 |
| | Sig.
(2-tailed) | 0.033a | 0.371 | 0.082 | 0.661 | | 0.793 | 0.457 | 0.875 | 0.031 | 0.398 |
| Mg | Pearson's
correlation | -0.001 | 0.004 | -0.039 | -0.049 | 0.038 | | 0.292a | 0.269 | 0.095 | -0.108 |
| | Sig.
(2-tailed) | 0.996 | 0.981 | 0.787 | 0.734 | 0.793 | | 0.040 | 0.059 | 0.510 | 0.455 |
| Ca | Pearson's
correlation | -0.065 | -0.083 | -0.268 | -0.004 | 0.108 | 0.292a | | 0.116 | 0.330a | 0.124 |
| | Sig.
(2-tailed) | 0.655 | 0.568 | 0.060 | 0.980 | 0.457 | 0.040 | | 0.421 | 0.019 | 0.392 |
| Na | Pearson's
correlation | 0.176 | -0.083 | -0.024 | -0.023 | -0.023 | 0.269 | 0.116 | | 0.192 | -0.156 |
| | Sig.
(2-tailed) | 0.221 | 0.566 | 0.870 | 0.873 | 0.875 | 0.059 | 0.421 | | 0.182 | 0.279 |
| K | Pearson's
correlation | 0.342 | 0.248 | 0.038 | 0.193 | 0.306a | 0.095 | 0.330a | 0.192 | | 0.001 |
| | Sig.
(2-tailed) | 0.020 | 0.082 | 0.791 | 0.179 | 0.031 | 0.510 | 0.019 | 0.182 | | 0.995 |
| Vit.D | Pearson's
correlation | 0.281a | 0.115 | -0.116 | -0.012 | 0.122 | -0.108 | 0.124 | -0.156 | 0.001 | |
| | Sig.
(2-tailed) | 0.048 | 0.425 | 0.421 | 0.936 | 0.398 | 0.455 | 0.392 | 0.279 | 0.995 | |
Discussion
Obesity is a well-known significant risk factor for
non-communicable diseases, such as hypertension. In the present
study, BMI was found to be slightly higher in the hypertensive
subjects compared to the control group. Previous systematic reviews
and retrospective studies have consistently indicated that higher
BMI values are associated with elevated blood pressure in adults
(18-19). The underlying mechanisms are
intricate and often interconnected. It has been reported that a BMI
≥23 serves as a risk factor for insulin resistance (20). Insulin resistance caused by the
accumulation of excessive lipids, leads to lipid deposition in
various tissues, such as blood vessels, triggering inflammation in
the area. At the same time, excess fat triggers the secretion of
pro-inflammatory cytokines, contributing to atherogenesis.
Ultimately, these factors disrupt blood pressure regulation,
potentially leading to elevated blood pressure or hypertension
(21). In the present study, SBP and
DBP were significantly higher in the hypertensive subjects compared
with the control group. These findings are consistent with the
findings of previous studies (22,23) that
also found elevated SBP and DBP in hypertensive individuals. The
increased pressure from hypertension can cause damage to blood
vessels and impair organ function, increasing the risk of heart
disease, stroke, chronic heart failure, kidney disease and other
related conditions (24).
Clinical investigations of renal function using
parameters such as uric acid, urea and creatinine are crucial for
identifying renal dysfunction, diagnosing renal disease, monitoring
disease progression and evaluating response to treatment. In the
present study, urea, creatinine and uric acid levels were
significantly higher in the hypertensive subjects compared with the
control group. This finding aligns with the findings of previous
studies (22,25-28).
The increase in the serum creatinine concentration may be
attributed to a decrease in creatinine clearance resulting from a
decline in the glomerular filtration rate (GFR). This impairment
may be a consequence of prolonged hypertension or a contributing
factor to its development and progression (25). Furthermore, a reduction in renal
blood flow leads to a decrease in GFR, subsequently reducing the
distal tubular flow rate. This leads to increased urea reabsorption
and decreased secretion, potentially explaining the elevated serum
urea concentration (26). The
elevated serum uric acid levels observed in the present study
highlight its potential role in the pathophysiology of
hypertension. This aligns with recent literature suggesting that
hyperuricemia may contribute to hypertension through mechanisms
such as renal vasoconstriction and endothelial dysfunction
(27). Hyperuricemia can negatively
affect cardiovascular and renal function by reducing endothelial
nitric oxide levels and neuronal nitric oxide synthase in the
macula densa of the kidney, thereby stimulating the RAAS (28). It may also trigger an inflammatory
response, potentially causing glomerular damage, tubular ischemia,
endothelial dysfunction, and the development of renal microvascular
disease by stimulating vascular smooth muscle cell proliferation,
ultimately leading to renal and systemic hypertension.
Hyperuricemia is also linked to the presence of target organ damage
in hypertensive patients (29).
In the present study, a significantly higher plasma
sodium level was found in the hypertensive subjects compared to the
controls. The reason for this difference may be attributed to
variances in the cell membrane, an increase in a sodium transport
inhibitor, a decreased sodium efflux rate constant and a reduction
in the activity of the ouabain-sensitive component of the
Na+-K+-ATPase pump (30). This finding supports the findings of
previous studies that have reported an association between
hypertension and elevated plasma sodium levels (30-32).
There are several mechanistic explanations for the link between
high sodium intake and blood pressure. These include enhanced
reabsorption and retention of filtered sodium through the renal
tubules, as well as activation of the brain RAAS. This system is
suggested to increase blood pressure through angiotensin II and
aldosterone, which promote local oxidative stress and activate the
sympathetic nervous system (31).
Furthermore, according to the ‘vasodysfunction theory’ of
salt-induced hypertension, salt loading leads to inadequate
decreases in systemic vascular resistance, resulting in increased
blood pressure (33). Salt
sensitivity, which varies among individuals, is considered to be a
key factor in this process. Therefore, treatments for essential
hypertension should focus on reducing plasma sodium levels by
decreasing dietary salt intake, increasing sodium excretion, or
inhibiting the RAAS (34).
The results of the present study revealed a
significant decrease in plasma potassium levels among hypertensive
subjects compared with the control group. This finding aligns with
the findings of previous studies that have reported lower plasma
potassium levels in both treated and untreated hypertensive
individuals compared to controls (5,35,36). The
most common cause of hypokalemia in hypertensive patients is the
use of diuretic drugs. Both thiazide and loop diuretics increase
urinary flow and sodium delivery through the collecting tubule,
leading to renal potassium secretion (36). This secretion is further increased in
the presence of diuretic-induced intravascular volume depletion and
secondary aldosterone stimulation (37). Since potassium is essential for
maintaining cardiac and vascular health, it is recommended to
provide hypertensive patients on diuretic medications with an
appropriate potassium supplement. This approach can improve
outcomes and help prevent the development of vascular
complications.
Magnesium plays a crucial role in regulating blood
pressure by controlling vascular tone and reactivity. It acts as a
calcium channel antagonist, which helps in the production of
vasodilator prostacyclins and nitric oxide. Furthermore, magnesium
helps maintain healthy endothelial function, regulates RAAS,
relaxes blood vessels and influences how blood vessels respond to
vasoactive agonists (38). In the
present study, magnesium levels were significantly higher in
hypertensive individuals compared to the controls. In vascular
smooth muscle cells, magnesium functions by inhibiting
transmembrane calcium transport and entry, thereby counteracting
the effects of calcium. When magnesium levels are low, there is an
increase in the intracellular free calcium concentration, leading
to vascular contraction. Magnesium deficiency can also lead to
endothelial dysfunction and increase in blood pressure, as the
ability of the body to relax blood vessels and regulates the RAAS
is impaired (39). On the other
hand, elevated plasma magnesium levels have been observed in cases
of both chronic and acute renal failure (40,41). The
slightly higher mean serum magnesium level in hypertensive patients
suggests a possible subclinical renal issue related to magnesium
excretion (42). It is important to
note that even though the mean magnesium level in these patients
was elevated, it still fell within the normal reference range. This
could explain why there were no obvious signs of renal dysfunction
in these patients.
In addition to the interdependent effect of sodium
and potassium, calcium and magnesium have also been implicated in
the regulation of blood pressure. In the present study, calcium
levels were found to be lower in the hypertensive subjects compared
with the controls; however, the difference was not statistically
significant. This finding is in agreement with the findings of
previous studies (43,44). Low calcium levels lead to an
increased activity of the parathyroid gland, which results in the
release of parathyroid hormone (PTH). This hormone can then lead to
the synthesis of calcitriol, either directly or mediated by PTH.
Calcitriol, in turn, increases intracellular calcium in vascular
smooth muscle cells causing vasoconstriction (43). The release of renin is stimulated by
low extracellular calcium and PTH, activating the RAAS. PTH also
enhances the synthesis of angiotensin II and aldosterone, further
promoting vasoconstriction, increasing renal water reabsorption,
and ultimately raising blood pressure (45). Therefore, increasing plasma calcium
levels through vitamin D supplements can reduce blood pressure in
hypertensive patients.
Vitamin D deficiency is an independent risk factor
for high blood pressure and is also associated with an increased
risk of cardiovascular mortality. The present study found that
vitamin D levels were significantly lower in hypertensive subjects
compared with the control group. Studies have suggested that
individuals with lower levels of 1,25(OH)2D3 may be more likely to
develop hypertension. This is due to the fact that a deficiency in
1,25(OH)2D3 can lead to the increased activity of the RAAS, both in
the body as a whole and specifically in the kidneys (46). In a low 1,25(OH)2D3 setting, there is
often an increase in the plasma renin concentration, which can
raise sympathetic activity and increase intra-glomerular pressure.
This can predispose individuals to hypertension, a decrease in the
glomerular filtration rate, and eventual cardiovascular damage
(47). Aside from the RAAS, vitamin
D can also influence hypertension through several other mechanisms.
Vitamin D plays a role in calcium homeostasis by promoting the
production of calcium transporters, increasing calcium reabsorption
in the kidneys, and stimulating the release of calcium from bones
by osteoclasts (48). Consequently,
a deficiency in vitamin D can lead to a decrease in plasma
Ca2+ levels, triggering the secretion of PTH from the
chief cells in the parathyroid gland to counteract this imbalance.
Numerous epidemiological studies have demonstrated that elevated
PTH levels are linked to a higher SBP and DBP, as well as an
increased prevalence of hypertension in general (47). Several studies have reported a direct
association between low plasma 25(OH)D concentrations and the risk
of developing hypertension and related complications (47,49,50).
Therefore, supplementation with vitamin D appears to be a promising
therapeutic option for these patients.
The results of the present study revealed a
significant correlation between renal function parameters,
electrolyte and vitamin D levels in hypertensive subjects.
Creatinine, urea, uric acid, vitamin D, sodium and potassium were
all found to be positively correlated with SBP. Previous research
has also shown a positive correlation between electrolytes,
particularly sodium and potassium, and SBP in hypertensive subjects
(18). Vitamin D deficiency has been
shown to be associated with an increased risk of developing
hypertension and cardiovascular diseases. Low serum vitamin D
levels have been identified as a risk factor for cardiovascular
disease and are linked to a higher incidence of hypertension,
insulin resistance, obesity, metabolic syndrome, impaired fasting
blood glucose levels, and dyslipidemia (51,52).
Renal blood flow autoregulation may not completely protect the
kidneys from the effects of moderately elevated systolic blood
pressure. Early active management of moderate systolic hypertension
in all adults could potentially reduce the risk of developing
chronic kidney disease later in life. Maintaining healthy blood
pressure levels is essential for preserving kidney function.
One limitation of the present study was the
selection of participants from a specific region or hospital, which
may not be representative of the entire hypertensive Nigerian
population. Furthermore, the present study was a ‘snapshot’ of a
single point in time, and may not capture changes in electrolytes,
renal biomarkers and vitamin D levels over time during the course
of treatment. Despite these limitations, the present study has key
implications for clinical practice, such as identifying new targets
for treatment or improving existing treatments, as well as setting
a template for future research.
In conclusion, in the present study, electrolyte
imbalance, renal dysfunction and vitamin D deficiency were observed
in hypertensive subjects. The present study also revealed
significant correlations between parameters that may affect renal
function or be influenced by renal impairment. These findings
emphasize the importance of assessing and monitoring these
biochemical markers as they could improve prognosis, aid in early
diagnosis of kidney damage, and assist in determining the optimal
level of therapeutic interventions. Furthermore, the findings of
the present study support the use of vitamin D supplementation as
adjunctive therapy to manage hypertension, particularly in patients
with vitamin D deficiency. Understanding the association between
renal biomarkers, electrolytes imbalance and vitamin D levels may
contribute to reducing the risk of developing cardiovascular
disease and kidney damage, and may aid in the development of more
effective treatment strategies to improve blood pressure control.
However, further studies are required to focus on the analysis of
additional biomarkers and to investigate hypertensive groups with
different demographic characteristics. Furthermore, interventional
design studies are warranted to evaluate the effects of vitamin D
supplementation, electrolyte imbalance correction, and renal
biomarkers-guided therapy on blood pressure control and
cardiovascular health.
Supplementary Material
Scatter plot illustrating a
significant positive correlation between vitamin D and systolic
blood pressure.
Scatter plot illustrating a
significant positive correlation between uric acid concentration
and diastolic blood pressure.
Scatter plot illustrating a
significant positive correlation between the urea and creatinine
concentration.
Scatter plot illustrating a
significant positive correlation between the calcium and potassium
concentration.
Scatter plot illustrating a
significant positive correlation between the magnesium and calcium
concentration.
Scatter plot illustrating a
significant positive correlation between the potassium and uric
acid concentration.
Acknowledgements
Not applicable.
Funding
Funding: No funding was received.
Availability of data and materials
The data generated in the present study may be
requested from the corresponding author.
Authors' contributions
AOO and BOO conceptualized the study. The
methodology was developed by AOO, EAO and OOO. Formal analyses and
visualization were conducted by OOO and OOE. Resources were
contributed by AOO, EAO, BOO, OOO and OOE. EAO wrote the original
draft of the manuscript, while review and editing were performed by
all the authors. Supervision was provided by AOO and BOO. EAO was
responsible for coordination with the co-authors and the submission
of the article. OOO and EAO confirm the authenticity of all the raw
data. All authors have read and approved the final manuscript.
Ethics approval and consent to
participate
Ethical approval for the collection of samples was
obtained from the Health Research Ethics Committee, Federal
Teaching Hospital Ido (FETHI), Ido-Ekiti, Ekiti State
(ERC/2023/02//28/911B). Informed consent was obtained from each
subject who participated in the study before the collection of
samples. Furthermore, the study was performed in accordance with
the Declaration of Helsinki.
Patient consent for publication
Not applicable.
Competing interests
The authors declare that they have no competing
interests.
References
|
1
|
Mills KT, Stefanescu A and He J: The
global epidemiology of hypertension. Nat Rev Nephrol. 16:223–237.
2020.PubMed/NCBI View Article : Google Scholar
|
|
2
|
Princewel F, Cumber SN, Kimbi JA, Nkfusai
CN, Keka EI, Viyoff VZ, Beteck TE, Bede F, Tsoka-Gwegweni JM and
Akum EA: Prevalence and risk factors associated with hypertension
among adults in a rural setting: The case of Ombe, Cameroon. Pan
Afr Med J. 34(147)2019.PubMed/NCBI View Article : Google Scholar
|
|
3
|
Zhou B, Perel P, Mensah GA and Ezzati M:
Global epidemiology, health burden and effective interventions for
elevated blood pressure and hypertension. Nat Rev Cardiol.
18:785–802. 2021.PubMed/NCBI View Article : Google Scholar
|
|
4
|
Humphrey JD: Mechanisms of vascular
remodeling in hypertension. Am J Hypertens. 34:432–441.
2021.PubMed/NCBI View Article : Google Scholar
|
|
5
|
Wu D, Chen Y, Guan H and Sun Y:
Association of abnormal serum electrolyte levels with hypertension
in a population with high salt intake. Public Health Nutr.
22:1635–1645. 2019.PubMed/NCBI View Article : Google Scholar
|
|
6
|
Iqbal S, Klammer N and Ekmekcioglu C: The
effect of electrolytes on blood pressure: A brief summary of
meta-analyses. Nutrients. 11(1362)2019.PubMed/NCBI View Article : Google Scholar
|
|
7
|
Chiu HF, Venkatakrishnan K, Golovinskaia O
and Wang CK: Impact of micronutrients on hypertension: Evidence
from clinical trials with a special focus on meta-analysis.
Nutrients. 13(588)2021.PubMed/NCBI View Article : Google Scholar
|
|
8
|
Ekun OA, Daniel F, Adebola P, Ajibare A,
Ekun OO, Omogoroye OO, Ilori OS, Oluwasayo BJ, Oshundun MF and
Oyegbami SR: Assessment of plasma sodium to potassium ratio, renal
function, markers of oxidative stress, inflammation, and
endothelial dysfunction in nigerian hypertensive patients. Int J
Hypertens. 7(6365947)2020.PubMed/NCBI View Article : Google Scholar
|
|
9
|
Tamanji MT, Ngwakum DA and Mbouemboue OP:
A profile of renal function in Northern Cameroonians with essential
hypertension. Cardiorenal Med. 7:324–333. 2017.PubMed/NCBI View Article : Google Scholar
|
|
10
|
AbdAllah AA, Abdelrahman SF, Ahmed SA,
Abdalla AM, Dafalla AM and Modawe A: Assessment of serum urea,
creatinine and uric acid in sudanese hypertensive patients. Iraqi
Natl J Med. 3:33–42. 2021.
|
|
11
|
Zmijewski MA: Vitamin D and human health.
Int J Mol Sci. 20(145)2019.PubMed/NCBI View Article : Google Scholar
|
|
12
|
Morvaridzadeh M, Sepidarkish M, Fazelian
S, Rahimlou M, Omidi A, Ardehali SH, Sanoobar M and Heshmati J:
Effect of calcium and vitamin D Co-supplementation on blood
pressure: A systematic review and meta-analysis. Clin Ther.
42:e45–e63. 2020.PubMed/NCBI View Article : Google Scholar
|
|
13
|
Khanolkar S, Hirani S, Mishra A, Vardhan
S, Hirani S, Prasad R and Wanjari M: Exploring the role of vitamin
D in atherosclerosis and its impact on cardiovascular events: A
comprehensive review. Cureus. 15(e42470)2023.PubMed/NCBI View Article : Google Scholar
|
|
14
|
World Gazetteer. Largest cities and towns
statistics populations. Available at: https://citypopulation.de/en/nigeria/admin/NGA013_ekiti/,
2023.
|
|
15
|
Iyalomhe GB, Omogbai EK, Ozolua RI, Dada
FL and Iyalomhe OB: Electrolyte profiles in Nigerian patients with
essential hypertension. Afr J Biotechnol. 7:1404–1408. 2008.
|
|
16
|
Lindsay AL, Bazydlo MN and Neil SH:
Calcium, magnesium, and phosphate. Lab Med. 45:44–50. 2014.
|
|
17
|
He CS, Gleeson M and Fraser WD:
Measurement of circulating 25-Hydroxy vitamin D using three
commercial enzyme-linked immunosorbent assay kits with comparison
to liquid chromatography: Tandem mass spectrometry method. ISRN
Nutr. 13(723139)2013.PubMed/NCBI View Article : Google Scholar
|
|
18
|
Zhang YX and Wang SR: High blood pressure
in Chinese youth across categories of BMI and waist circumference.
Blood Press Monit. 26:124–128. 2021.PubMed/NCBI View Article : Google Scholar
|
|
19
|
Song L, Li J, Yu S, Cai Y, He H, Lun J,
Zheng L and Ye J: Body mass index is associated with blood pressure
and vital capacity in medical students. Lipids Health Dis.
22(174)2023.PubMed/NCBI View Article : Google Scholar
|
|
20
|
Okura T, Nakamura R, Fujioka Y,
Kawamoto-Kitao S, Ito Y, Matsumoto K, Shoji K, Sumi K, Matsuzawa K,
Izawa S, et al: Body mass index ≥ 23 is a risk factor for insulin
resistance and diabetes in Japanese people: A brief report. PLoS
One. 13(e0201052)2018.PubMed/NCBI View Article : Google Scholar
|
|
21
|
Nikbakht HR, Najafi F, Shakiba E, Darbandi
M, Navabi J and Pasdar Y: Triglyceride glucose-body mass index and
hypertension risk in Iranian adults: A population-based study. BMC
Endocr Disord. 23(156)2023.PubMed/NCBI View Article : Google Scholar
|
|
22
|
Oluboyo AO: Evaluation of selected renal
markers in hypertensive subjects in Ekiti State, Nigeria. Int J Med
Lab Res. 5:13–19. 2020.
|
|
23
|
Odewusi OO, Adigun HT, Omon EA, Obadire SO
and Egbebi HA: Assessment of oxidative stress and protein
modification in essential hypertensive subjects. Sokoto J Med Lab
Sci. 8:36–45. 2023.
|
|
24
|
Masenga SK and Kirabo A: Hypertensive
heart disease: Risk factors, complications and mechanisms. Front
Cardiovasc Med. 10(1205475)2023.PubMed/NCBI View Article : Google Scholar
|
|
25
|
Gupta A and Khosla A: The impact of serum
biomarkers on the prognosis of hypertensive patients. J Hypertens.
39:1574–1582. 2021.
|
|
26
|
Emokpae AM and Abdu A: Serum uric acid
levels among Nigerians with essential hypertension. Niger J Physiol
Sci. 28:41–44. 2013.PubMed/NCBI
|
|
27
|
Morris ST, McMurray JJ, Rodger RS and
Farmer R: Creatinine and urea clearance in hypertensive patients
with renal insufficiency. Kidney Int. 97:1032–1040. 2020.
|
|
28
|
Kumari R, Lal L, Jha B and Gadiya NK:
Evaluation of serum uric acid, urea, creatinine in hypertensive
patients. Int J Pharm Clin Res. 16:2304–2307. 2024.
|
|
29
|
Akpotaire PA and Seriki SA: Assessment and
correlation of serum urea and creatinine levels in normal,
hypertensive, and diabetic persons in Auchi, Nigeria. Arch Pathol
Clin Res. 7:7–16. 2023.
|
|
30
|
Grillo A, Salvi L, Coruzzi P, Salvi P and
Parati G: Sodium intake and hypertension. Nutrients.
11(1970)2019.PubMed/NCBI View Article : Google Scholar
|
|
31
|
Graudal N, Hubeck-Graudal T and Jurgens G:
A low dietary sodium dose is associated with a more pronounced
aldosterone response in normotensive than in hypertensive
individuals. Sci Rep. 13(19027)2023.PubMed/NCBI View Article : Google Scholar
|
|
32
|
Uchejeso OM, Lucy NL, Etukudoh NS, Etim II
and Dorathy SK: Sodium and potassium electrolytes levels among
hypertensive patients in Jos Metropolis. J Curr Emerg Med Rep.
1:1–5. 2021.
|
|
33
|
Morris RC, Schmidlin O, Sebastian A,
Tanaka M and Kurtz TW: Vasodysfunction that involves renal
vasodysfunction, not abnormally increased renal retention of
sodium, accounts for the initiation of salt-induced hypertension.
Circulation. 133:881–893. 2016.PubMed/NCBI View Article : Google Scholar
|
|
34
|
Rust P and Ekmekcioglu C: Impact of salt
intake on the pathogenesis and treatment of hypertension. Adv Exp
Med Biol. 956:61–84. 2017.PubMed/NCBI View Article : Google Scholar
|
|
35
|
Burnier M, Bakris G and Williams B:
Redefining diuretics use in hypertension: Why select a
thiazide-like diuretic? J Hypertens. 37:1574–1586. 2019.PubMed/NCBI View Article : Google Scholar
|
|
36
|
Krogager ML, Søgaard P, Torp-Pedersen C,
Bøggild H, Gislason G and Kragholm K: Impact of plasma potassium
normalization on short-term mortality in patients with hypertension
and hyperkalemia. J Am Heart Assoc. 9(017087)2020.PubMed/NCBI View Article : Google Scholar
|
|
37
|
Do C, Vasquez PC and Soleimani M:
Metabolic alkalosis pathogenesis, diagnosis, and treatment: Core
curriculum. Am J Kidney Dis. 80:536–551. 2022.PubMed/NCBI View Article : Google Scholar
|
|
38
|
Sontia B and Touyz RM: Role of magnesium
in hypertension. Arch Biochem Biophys. 458:33–39. 2007.PubMed/NCBI View Article : Google Scholar
|
|
39
|
Dominguez L, Veronese N and Barbagallo M:
Magnesium and hypertension in old age. Nutrients.
13(139)2020.PubMed/NCBI View Article : Google Scholar
|
|
40
|
Ruiz MDC, Bermejo LC, Veronese N,
Fernández-Villalba E, Cuello AM, Kublickiene K, Raparelli V, Norris
CM, Kautzky-Willer A, Pilote L, et al: Magnesium in kidney function
and disease-implications for aging and sex-a narrative review.
Nutrients. 15(1710)2023.PubMed/NCBI View Article : Google Scholar
|
|
41
|
Azem R, Daou R, Bassil E, Anvari EM,
Taliercio JJ, Arrigain S, Schold JD, Vachharajani T, Nally J and Na
Khoul GN: Serum magnesium, mortality and disease progression in
chronic kidney disease. BMC Nephrol. 21(49)2020.PubMed/NCBI View Article : Google Scholar
|
|
42
|
Sakaguchi Y: The emerging role of
magnesium in CKD. Clin Exp Nephrol. 26:379–384. 2022.PubMed/NCBI View Article : Google Scholar
|
|
43
|
Villa-Etchegoyen C, Lombarte M, Matamoros
N, Belizán JM and Cormick G: Mechanisms involved in the
relationship between low calcium intake and high blood pressure.
Nutrients. 11(1112)2019.PubMed/NCBI View Article : Google Scholar
|
|
44
|
Hua Y, Liu H, Sun JY, Kong XQ, Sun W and
Xiong YQ: Association between serum calcium and the prevalence of
hypertension among US Adults. Front Cardiovasc Med.
8(719165)2021.PubMed/NCBI View Article : Google Scholar
|
|
45
|
Zheng MH, Li FX, Xu F, Lin X, Wang Y, Xu
QS, Guo B and Yuan LQ: The interplay between the
renin-angiotensin-aldosterone system and parathyroid hormone. Front
Endocrinol (Lausanne). 11(539)2020.PubMed/NCBI View Article : Google Scholar
|
|
46
|
McMullan CJ, Borgi L, Curhan GC, Fisher N
and Forman JP: The effect of vitamin D on renin-angiotensin system
activation and blood pressure: A randomized control trial. J
Hypertens. 35:822–829. 2017.PubMed/NCBI View Article : Google Scholar
|
|
47
|
Jensen NS, Wehland M, Wise PM and Grimm D:
Latest knowledge on the role of vitamin D in hypertension. Int J
Mol Sci. 24(4679)2023.PubMed/NCBI View Article : Google Scholar
|
|
48
|
Rai V and Agrawal DK: Role of vitamin D in
cardiovascular diseases. Endocrinol Metab Clin North Am.
46:1039–1059. 2017.PubMed/NCBI View Article : Google Scholar
|
|
49
|
Sheehy S, Palmer JR, Cozier Y, Bertrand KA
and Rosenberg L: Vitamin D and risk of hypertension among Black
women. J Clin Hypertens (Greenwich). 25:168–174. 2023.PubMed/NCBI View Article : Google Scholar
|
|
50
|
Mokhtari E, Hajhashemy Z and Saneei P:
Serum vitamin D levels in relation to hypertension and
pre-hypertension in adults: A systematic review and dose-response
meta-analysis of epidemiologic studies. Front Nutr.
9(829307)2022.PubMed/NCBI View Article : Google Scholar
|
|
51
|
Li YM, Guo LL, Zhou BJ and Cao RJ: Effect
of vitamin D level on vascular endothelial function and plasma
renin activity in patients with hypertension. J Chin Physician.
20:1665–1669. 2018.
|
|
52
|
Anagnostis P, Athyros VG, Adamidou F,
Florentin M and Karagiannis A: Vitamin D and cardiovascular
disease: A novel agent for reducing cardiovascular risk? Curr Vasc
Pharmacol. 8:720–730. 2010.PubMed/NCBI View Article : Google Scholar
|