Introduction
Tumor cells do not exist as pure homogeneous
populations in vivo. Instead, they are embedded in cancer
cell nests, which are surrounded by stromal cells and extracellular
matrix components, and these are important in the growth, invasion
and metastasis of tumor cells. Consequently, endothelial cells and
lactic acid affect almost every aspect of cancer progress,
including the ability of tumor cells to grow and metastasize
(1,2).
Therefore, it is a disadvantage to only investigate tumor cells
in vitro. Glucose is the major energy-yielding nutrient and
there are two primary ways for glycometabolism in cells: Glycolysis
and oxidative phosphorylation (3).
The majority of cells rely on oxidative phosphorylation to provide
energy during well-oxygenated conditions; however, tumor cells
depend on the glycolytic pathway for ATP generation even in an
aerobic environment (4). Previously,
in depth research concerning tumor metabolism has revealed that an
increasing number of studies consider that the intermediate matrix
produced by glycolysis during stromal cell metabolism may be used
for synthesizing proteins, nucleic acids and lipids, which provide
essential substrates for growth and metastasis of tumor cells
(1,2).
The traditional Warburg Effect cannot explain all phenomenons that
have been identified in recent studies; however the ‘Reverse
Warburg Effect’ may be capable of doing this (5). Currently, studies concerning the Reverse
Warburg Effect primarily focus on fibroblasts and macrophages;
however, there is little study concerning tumor-associated
endothelial cells in the tumor environment, which regulate growth,
invasion and metastasis of tumor cells by producing various
extracellular matrix and cytokines (6).
The effect of tumor-associated endothelial cells on
the ability of tumor cells to grow and metastasize is not
completely clear. Numerous studies hypothesize that in vivo
tumor-associated endothelial cells receive biological signals from
tumor cells and other tumor-associated stromal cells by absorbing
paracrine factors, and subsequently induce tumor angiogenesis,
which is essential for tumor growth and metastasis (7). In accordance with this hypothesis, the
present study established a bionic 3D co-culture system using
microfluidic chip technology in order to simulate the tumor
microenvironment in vivo. The present study investigated the
metabolic characteristics of tumor cells and tumor-endothelial
metabolic coupling in the tumor microenvironment by measuring
protein expression, which was determined by qualitative and
quantitative analysis.
Materials and methods
Materials
Cells
Human bladder cancer T24 cells and human umbilical
vein endothelial cells (HUVECs) were obtained from Central
Laboratory, Affiliated Hospital of Qingdao University (Qingdao,
China).
Antibodies and reagents
Mouse monoclonal anti-mitochondria antibody was
purchased from Merck Millipore (Darmstadt, Germany; catalog no.,
MAB1273). The following antibodies were purchased from Abcam
(Cambridge, UK): Rabbit polyclonal anti-translocase (outer
mitochondrial membrane 20; catalog no., ab78547); rabbit polyclonal
anti-mitofilin (mitochondiral inner membrane protein; catalog no.,
ab93323); rabbit polyclonal anti-cyclophilin (intercristal space
protein; catalog no., ab3562); rabbit monoclonal anti-cytochrome c
(intermembrane space protein; catalog no., ab133504); rabbit
polyclonal anti-NADH dehydrogenase subunit 6 (anti-oxidative
phosphyorylation I; catalog no., ab81212); mouse monoclonal
anti-mitochondrially encoded cytochrome c oxidase I (anti-oxidative
phosphyorylation IV; catalog no., ab14705); rabbit polyclonal
anti-ATP synthase (anti-oxidative phosphyorylation V; catalog no.,
ab96655); and mouse monoclonal anti-pyruvate dehydrogenase E1-α
subunit (catalog no., ab110334). Rabbit monoclonal anti-β-actin
(catalog no., 8457) and mouse monclonal anti-β-actin (catalog no.,
3700) were purchased from Cell Signaling Technology, Inc. (Danvers,
MA, USA). A goat polyclonal anti-rabbit secondary antibody
conjugated to fluorescein isothiocyanate (FITC) (catalog no.,
BA1101) was purchased from Boster Biological Technology, Ltd.
(Wuhan, China).
Dulbecco's modified Eagle's medium (DMEM), RPMI-1640
media, fetal bovine serum (FBS) and phosphate-buffered saline (PBS)
were purchased from HyClone™ (GE Healthcare Life Sciences, Logan
City, UT, USA). MitoTracker® Red CMXRos was purchased
from Gibco® (Thermo Fisher Scientific, Inc., Waltham,
MA, USA; catalog no., M7512). 4′,6-diamidino-2-phenylindole (DAPI;
catalog no., AR1177) and BCA Protein Assay kit (catalog no.,
AR0146) were purchased from Boster Biological Technology, Ltd. An
L-Lactic Acid Assay kit was purchased from Seebio Biotech, Inc.
(Shanghai, China; catalog no., K-DLATE). A Simon™ (12–180 kDa)
Master kit was purchased from ProteinSimple (San Jose, CA, USA),
which included a biotinylated molecular weight ladder,
streptavidin-horseradish peroxidase (HRP), fluorescent standards,
luminol-S, hydrogen peroxide, sample buffer, DTT, stacking matrix,
separation matrix, running, buffer and matrix removal buffers,
antibody diluent, goat anti-rabbit and anti-mouse secondary
antibodies, and capillary clips.
Analytical instruments
An automatic microplate reader (Bio-Tek Instruments,
Inc., Winooski, VT, USA), a fluorescence microscope (Nikon
Corporation, Tokyo, Japan) and Simple Westerns System
(ProteinSimple) were used in the present study.
Methods
Microfluidic chip technology
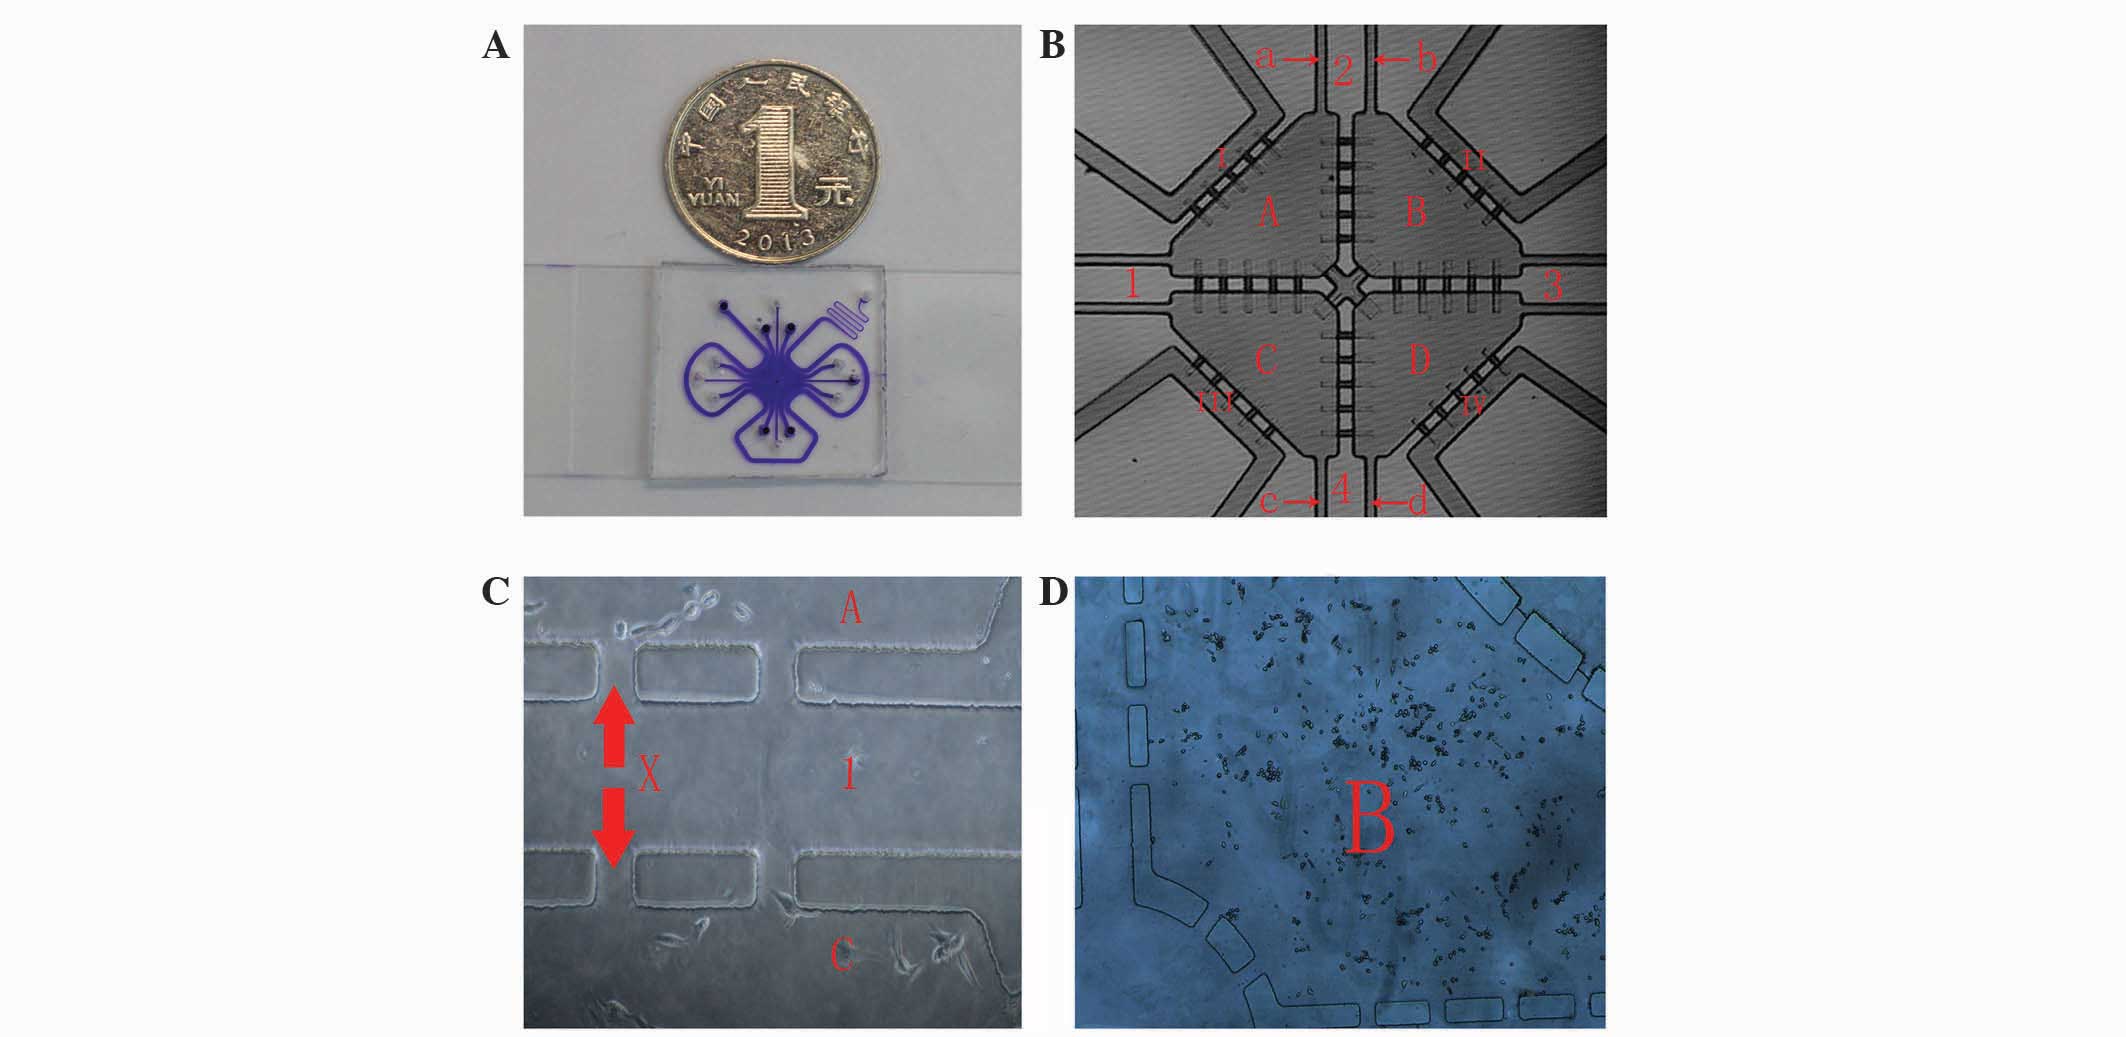
Designing and producing a microfluidic chip with
a multi-channel connection and a multi-unit integrated
high-throughput system
The chip consisted of the following components: Cell
culture pools, microchannels connected to the pools and peripheral
perfusion channels. In detail, each chip had four cell culture
pools: Two pools were inoculated with HUVECs and the other two
pools were inoculated with T24 cells. Each culture pool had two
channels connected to the outside. One pool was the in-channel for
cell seeding, and one was the out-channel. The four culture pools
were connected by two cross microchannels impregnated with
Matrigel, which separated the cells in each pool; however, lactic
acid and other small molecules produced by the cells could be
exchanged via the Matrigel. A perfusion channel was located around
the entire periphery of the chip. Cell culture medium was injected
through the perfusion channel, whereas cells were seeded into the
pools (8) (Fig. 1).
Experimental groups (
Fig. 1)
Experimental co-culture group: Co-culture of T24
cells and HUVECs in a microfluidic chip. T24 cells were perfused
into chamber A and D, and HUVECs were perfused into chamber B and
C. Control group 1: Monoculture of T24 cells in a microfluidic
chip. T24 cells were perfused into chamber A-D. Control group 2:
Monoculture of HUVECs in a microfluidic chip. HUVECs were perfused
into chamber A-D.
Matrigel preparation and perfusion
To ensure that the prepolymer matrix solution was
able to dissolve, the solution was maintained in a 4°C refrigerator
overnight. The microfluidic chip and pipette were pre-cooled during
this time. Subsequently, serum-free culture medium and pre-cooled
melted Matrigel were mixed at a ratio of 1:1 (v/v) and 10 µl was
pipetted into the microfluidic chips via the cross microchannel.
The microfluidic chip was then placed in a sterile petri dish in a
37°C incubator for ≥8 h (9).
Cell line culturing
T24 cells were cultured in RPMI-1640 medium with 10%
FBS, and HUVECs were cultured in DMEM with 10% FBS. T24 cells and
HUVECs that grew well and possessed ideal cell morphology were
selected for experiments, in order to prepare a high-density cell
suspension (105 cells/ml). The cell suspension was
precooled on ice prior to mixing with RPMI-1640 and DMEM media with
10% FBS at a ratio of 3:1 (v/v). Each cell culture pool was
injected with 5 µl of the cell suspension. T24 cells and HUVECs
were seeded in the pools using a diagonal-cross method in the
experimental groups, whereas a single cell type was seeded in all
the pools in the control groups. RPMI-1640 or DMEM media were
injected into the perfusion channel, completing the microfluidic
chip laboratories. The chips were placed in a 37°C incubator with
5% CO2 for 48 h.
Determination of the lactic acid content of the
culture broth
After culturing the microfluidic chips for 48 h at
37°C, the medium was removed from each pool using a micropipette
and centrifuged for 5 min at 1,119 × g. Subsequently, a L-Lactic
Acid Assay kit was used, according to the manufacturer's protocol.
Briefly, 3 µl lactic acid concentration calibrator was added with
240 µl reagent 1 (Tris-buffer and lactic acid oxidase). The
resulting solution was incubated for 5 min at 37°C, and the first
photometric value (A1) was analyzed. Subsequently, 60 µl reagent 2
(peroxidase, 4-aminoantipyrine and TBHBA) was added. After a 5 min
incubation at 37°C, the second photometric value (A2) was analyzed.
The change in photometric value for each tube was calculated as
follows: ΔA = A2 - A1. The following equation
was used to calculate the lactic acid content: C = ΔAU × CS / ΔAS,
where CS represents the concentration of the calibration solution,
U is the medium (ml) and S is the lactic acid concentration
calibrator.
Qualitative analysis of mitochondria-associated
proteins using immunofluorescence
A total of 5 µl MitoTracker Red (200 nmol/l) was
added to each cell pool, and the pools were incubated for 45 min in
a 37°C incubator. Subsequently, fixation and permeabilization was
performed according to the immunofluorescence protocol (10). The primary antibody used was a mouse
monoclonal anti-mitochondria antibody, and the secondary antibody
was conjugated to FITC. After washing the pools with PBS, 5 µl DAPI
was added to each pool for 30 min and then each pool was washed.
All of the above steps were performed in the dark. Fluorescence
intensity was observed using immunofluorescence microscopy.
MitoTracker Red is excited by green light, anti-mitochondria
antibody by blue light, and DAPI by ultraviolet light.
Quantitative analysis of mitochondria-associated
proteins in using western blotting
Mitochondrial proteins were assessed using Simple
Westerns™ System from ProteinSimple, which is more advanced and
accurate compared with normal western blotting. Compared with
western blotting, Simple Westerns has a shorter operation time,
fewer sample proteins and a higher protein flux (run 12 proteins at
a time), so that accurate results are obtained, which have less
errors and a better comparison. The reagents used were as follows:
Antibody diluent plus, sample buffer 10X, separation Matrix 1,
stacking matrix 1, streptavidin-HRP, goat-anti-rabbit
HRP-conjugated secondary antibody, matrix removal buffer, wash
buffer, running buffer and DTT (DTT is used to reduce samples
during denaturation). Samples were prepared by extracting
mitochondrial proteins using a modified RIPA buffer [50 mM Tris (pH
7.4), 150 mM NaCl, 0.1% SDS, 0.25% sodium deoxycholate, 2%
Triton-X100, 1 mM PMSF, 2 µM leupeptin], subsequent to the 48 h
incubation of the experimental co-culture and control microfluidic
chips. Protein concentrations were >2 µg/µl, as assessed using
the BCA Protein Assay kit. The protein extraction and the sample
diluent were mixed to reduce protein concentrations to 1.5 µg/µl.
Subsequently, a total of 1.25 µl Fluorescent Standard/4X Master Mix
was combined with 3.75 µl protein extract in a fresh microfuge tube
for each preparation. This was vortexed and denatured by heating to
95°C for 5 min using a heat block. The sample was vortexed again,
microcentrifuged (1,119 × g) and stored on ice until ready to
use.
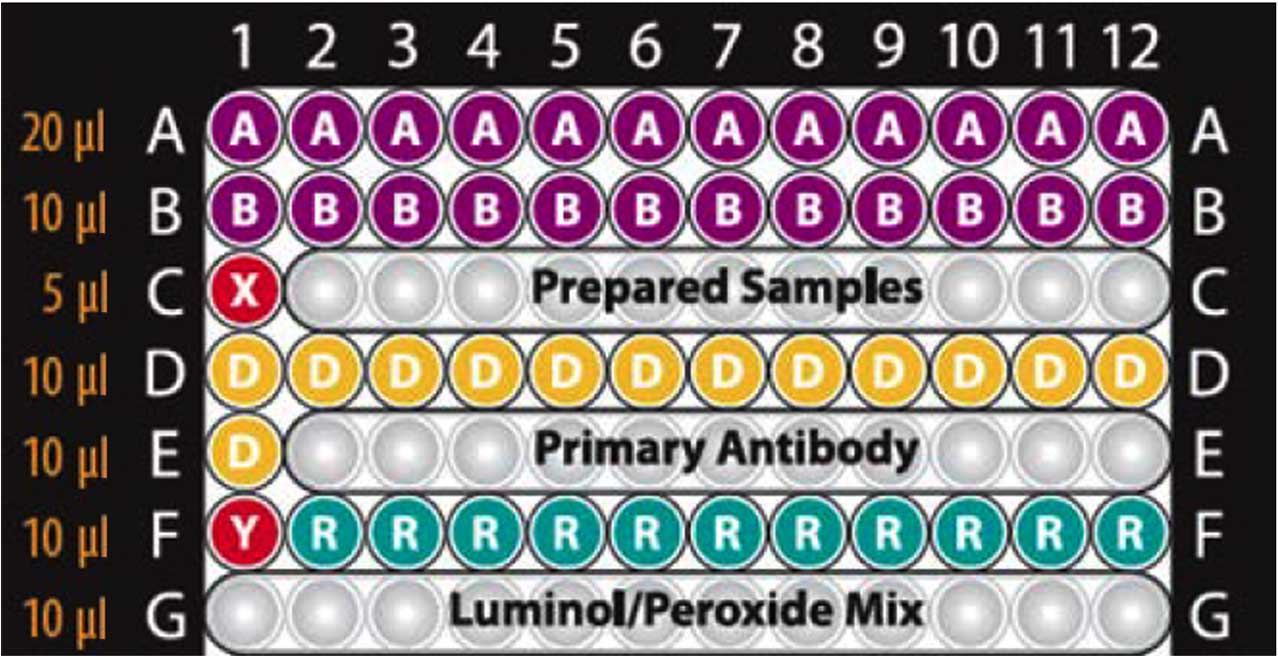
Sample plates were prepared as follows: The reagent
and sample were placed on a 384-well microplate; the reagents were
added to the assay plate using the volume guidelines listed in
Fig. 2; the assay plate was covered
with a lid and centrifuged at 6,994 × g for 5 min at room
temperature to remove any air bubbles in the plate wells. Following
this the plate was run in the Simon™ System. Removal, wash and
running buffers were added to the system tray, and a capillary clip
was inserted into the clip holder. Subsequently, the lid covering
the assay plate was removed and Compass version 1.7 software
(ProteinSimple) was run. Antibodies were diluted to 1:200. The
samples were divided into two groups: Group 1 consisted of the
mitochondrial outer membrane protein (channel protein subtype),
mitochondrial inner membrane protein (Core 1), intracristal space
protein (cyclophilin D) and intermembrane space protein (cytochrome
C); group 2 consisted of anti-oxidative phosphorylation I (NADH
dehydrogenase), anti-oxidative phosphorylation IV (cytochrome
c oxidase), anti-oxidative phosphorylation V (ATP synthase)
and pyruvate dehydrogenase. Data analysis was performed using
Compass software.
Statistical analysis
Statistical analysis was performed using SPSS
version 17.0 software (SPSS, Inc., Chicago, IL, USA). Student's
t-test was used to evaluate potential associations in tumor cells,
HUVECs and cells in the co-culture group. P<0.05 was considered
to indicate a statistically significant difference.
Results
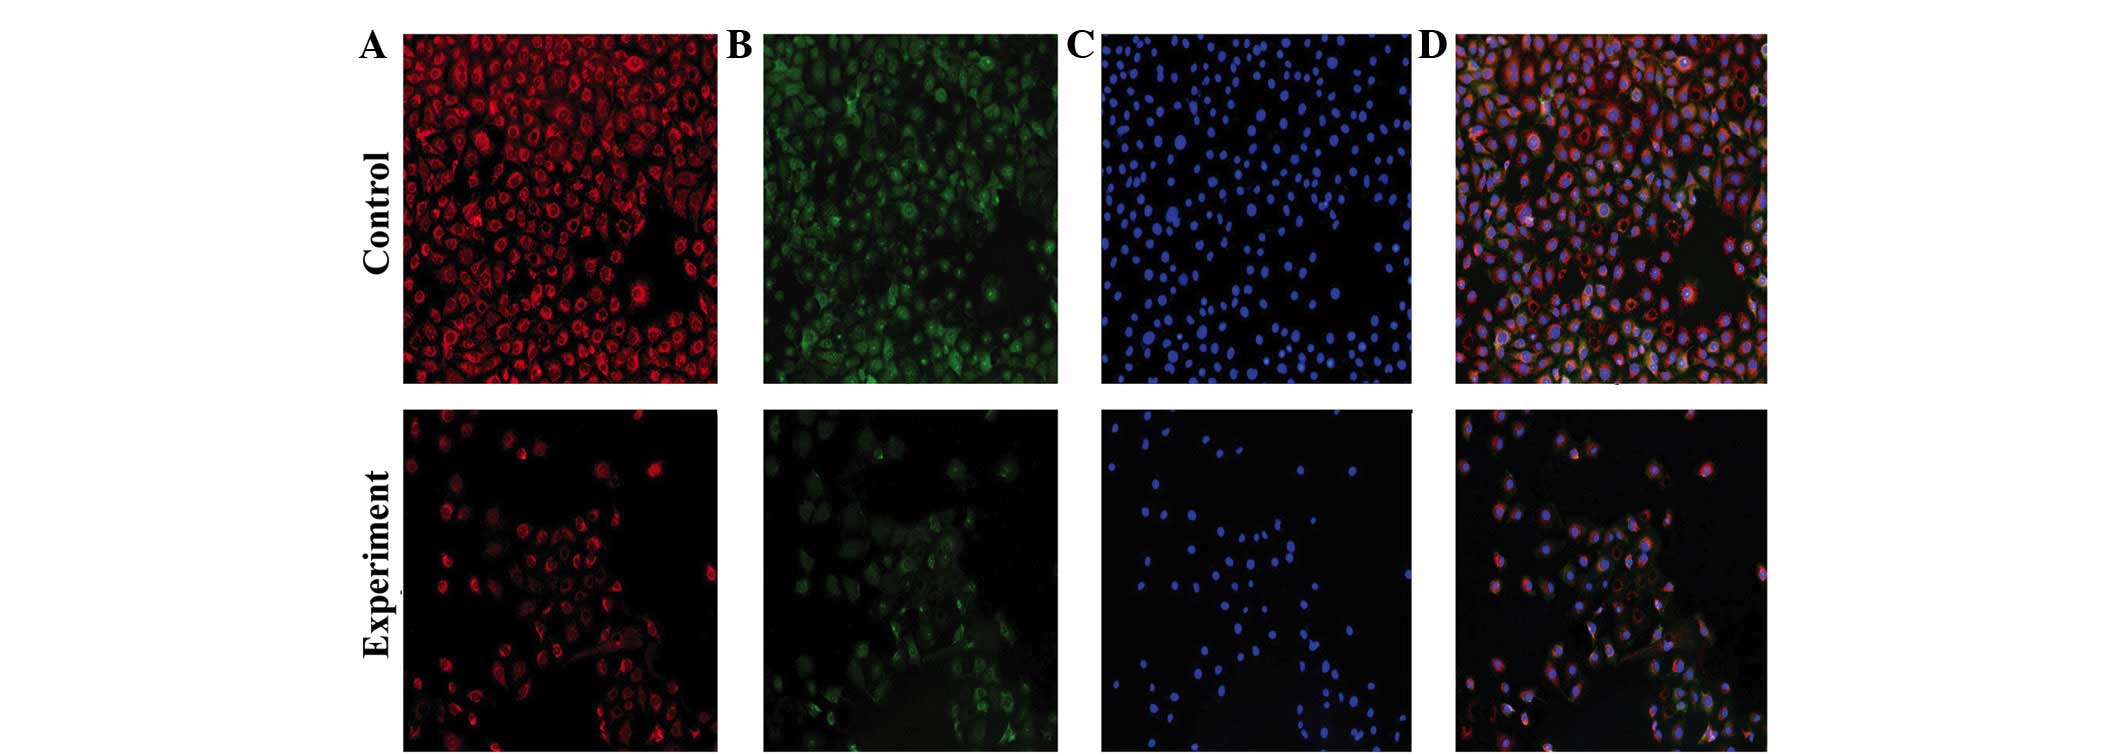
Qualitative analysis
MitoTracker Red and anti-mitochondria antibody were
used to observe mitochondria. The former stains living cells and
the latter stain cells following fixation and permeabilization.
With different fluorescence excitation, fluorescence images are
obtained that have the same exposure time, contrast and enlargement
factor. Fluorescence intensity reflects the amount of mitochondrial
proteins, and the amount of fluorescent cells reflect cell
proliferation and survival capability. Fig. 3 shows that the fluorescence intensity
of HUVECs in control group is increased compared with the HUVECs in
the experimental co-culture group. Similarly, the amount of
fluorescent HUVECs in the control group is increased compared with
HUVECs in the experimental group. This suggests that when T24 cells
are cultured with HUVECs, the mitochondrial aerobic capacity, and
cell proliferation and survival capability of HUVECs are decreased.
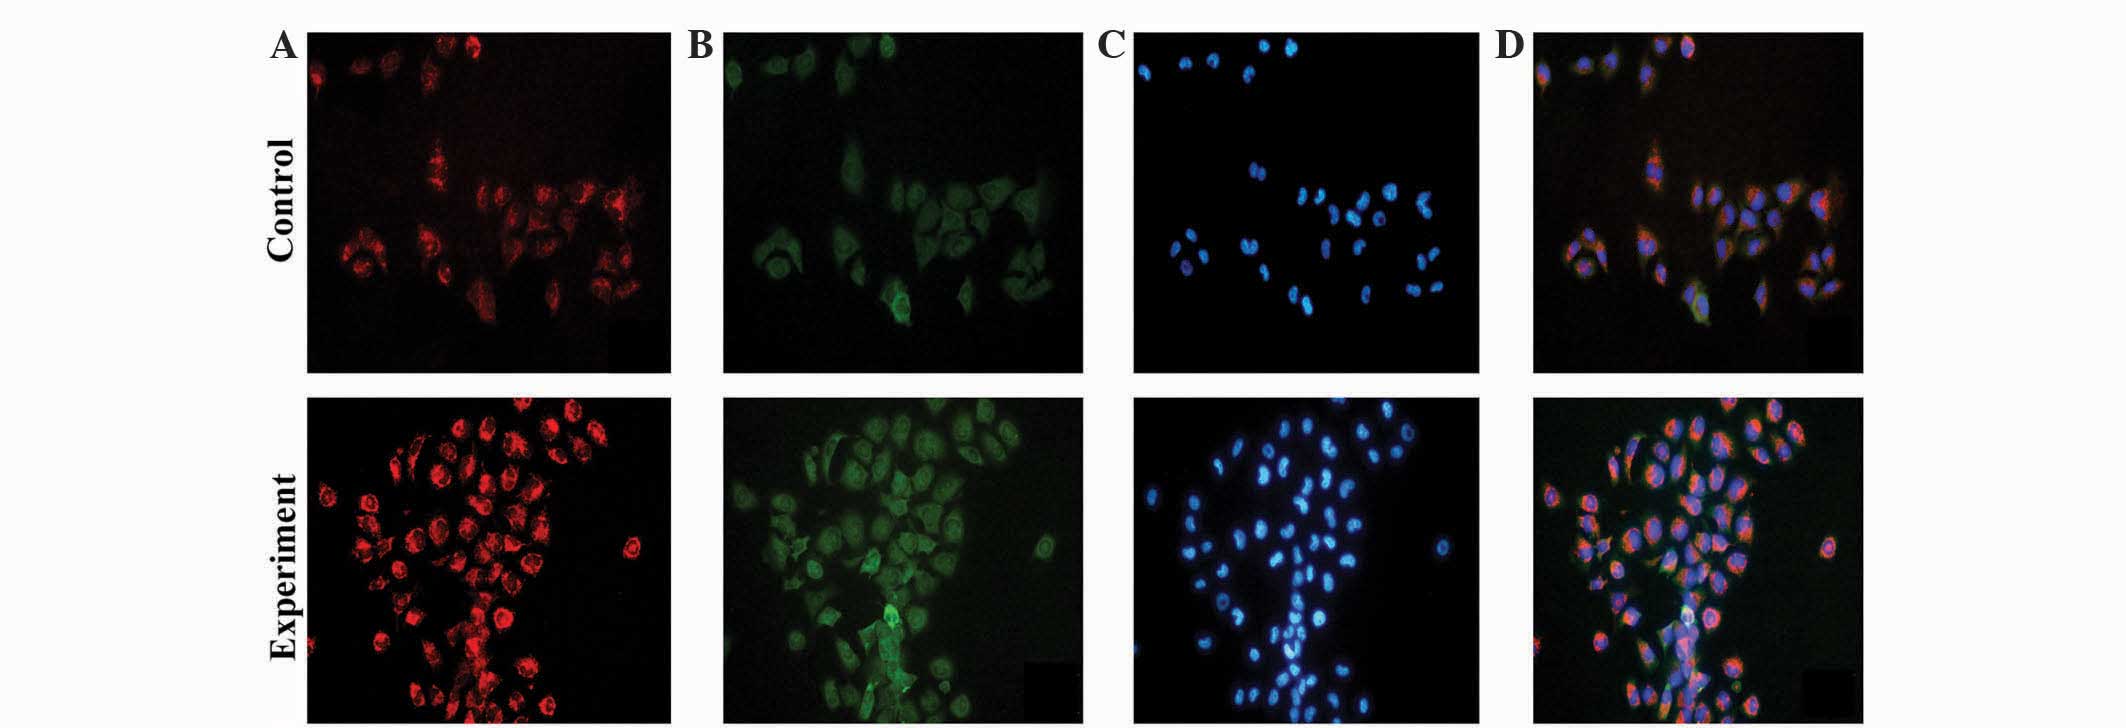
Fig. 4 shows the fluorescence
intensity of T24 cells in the experimental co-culture group is
increased compared with the T24 cells in the control group. In
addition, the amount of fluorescent T24 cells in the experimental
co-culture group is increased compared with T24 cells in the
control group. This suggests that when T24 cells are cultured with
HUVECs, the mitochondrial aerobic capacity, and cell proliferation
and survival capability of the T24 cells are increased.
Quantitative analysis
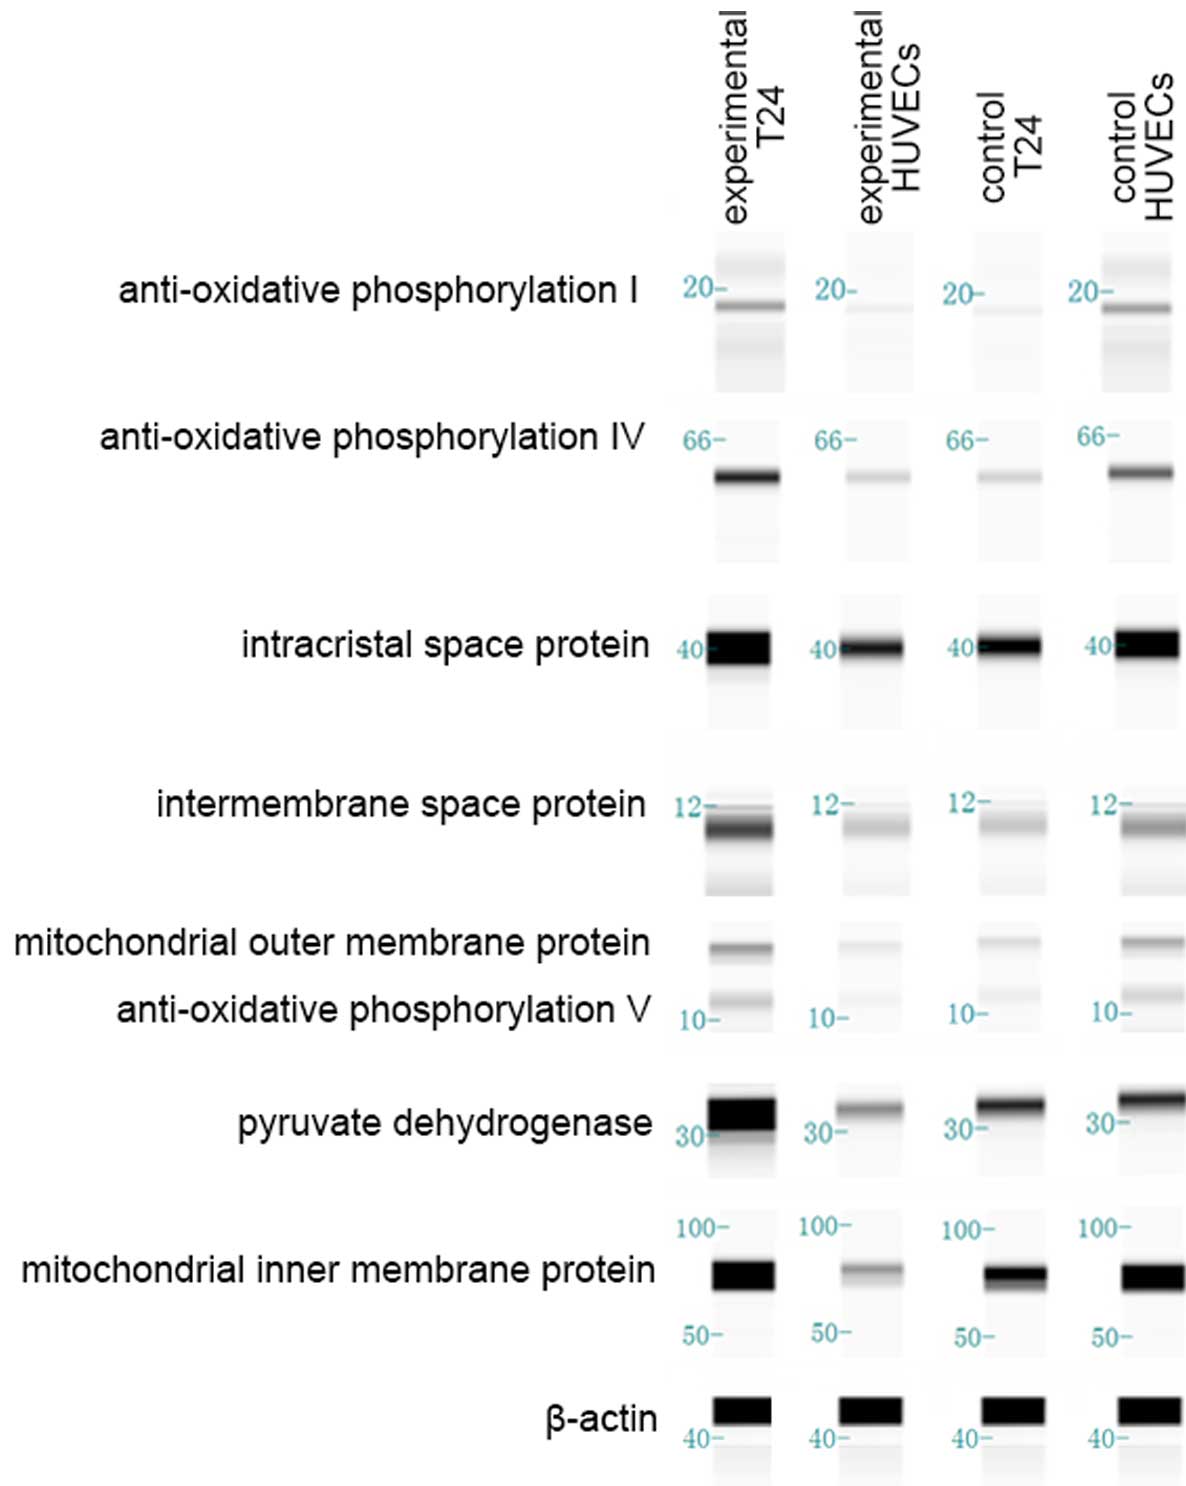
Western blot images (Fig.
5) were obtained subsequent to running a Simple Western. In
order to enhance the accuracy of the results, every western blot
was repeated 3 times. Outcomes are shown in Fig. 5. In the control groups, total protein
expression of T24 cells is clearly decreased compared with HUVECs
(P=0.038). In the experimental co-culture group, total protein
expression in T24 cells is increased compared with HUVECs
(P=0.020). Total protein expression in T24 cells was clearly
increased in the experimental group compared with the T24 cell
control group (P=0.002). By contrast, total protein expression in
the HUVECs in the experimental group was decreased compared with
the HUVEC control group (P=0.029).
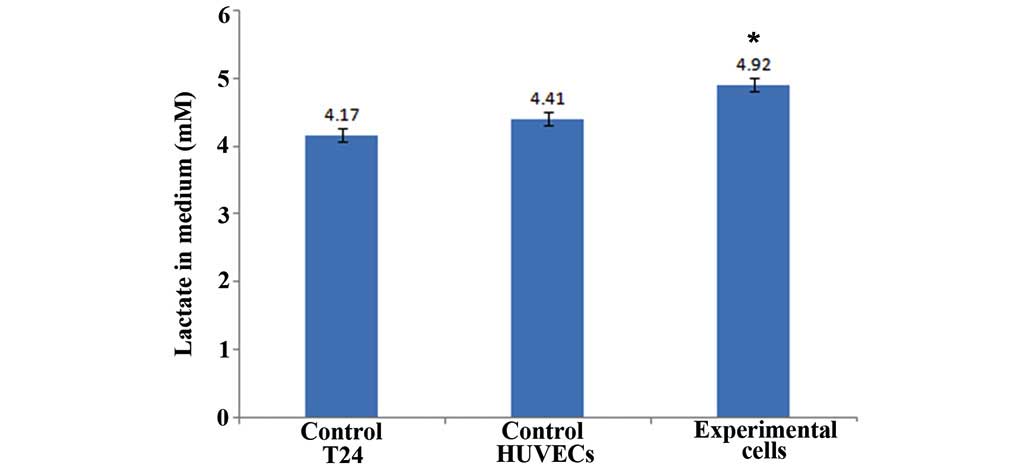
Lactic acid concentrations
Fig. 6 shows that in
the control group lactic acid concentration of the T24 cell lysis
solution was 4.17 mol/ml, and the lactic acid concentration of the
HUVEC lysis solution was 4.41 mol/ml. In the experimental group,
lactic acid concentration of the total cell lysis solution was 4.92
mol/ml. These results are the mean value of three independent
experiments. This result suggests that cells in the co-culture
experimental group have a higher level of aerobic glycolysis
compared with the control group.
Discussion
Under conditions of adequate oxygen supply, normal
cells undergo efficient oxidative phosphorylation. Glucose-derived
pyruvate is transported into the mitochondria, where it undergoes
oxidative decarboxylation to produce acetyl coenzyme A via pyruvate
dehydrogenase. Acetyl coenzyme A enters the tricarboxylic acid
cycle, which consists of numerous steps, including oxidation, that
ultimately generate water, carbon dioxide and significant amounts
of ATP. In conditions of hypoxia or a reduced oxygen supply,
cellular energy metabolism is chiefly dependent on the glycolytic
pathway, which is predominantly performed in the cytoplasm
(11). To a considerable extent,
research into mitochondria metabolism is similar to research into
cellular energy metabolism, in that alterations in protein
expression are equal to alterations in cellular energy metabolism.
According to the present experimental results, there is accurate
metabolic coupling between tumor and tumor-associated endothelial
cells in the tumor microenvironment. Protein expression in the
experimental T24 cells was significantly increased compared with
T24 cells in the control group. In addition, protein expression in
HUVECs in the experimental group was decreased compared with HUVECs
in the control group (Fig. 5). These
results suggest that tumor-associated endothelial cells promote the
oxidative phosphorylation of tumor cells. By contrast, tumor cells
restrain the oxidative phosphorylation of endothelial cells.
Additionally, fluorescence intensity and the amount of fluorescent
cells in the experimental co-culture group was increased compared
with the control group in tumor cells; however, this was reversed
in HUVECs (Figs. 3 and 4). This supports the conclusion that
tumor-associated endothelial cells promote the oxidative
phosphorylation of tumor cells, while tumor cells restrain the
oxidative phosphorylation of endothelial cells. The present
conclusion differs from traditional tumor energy metabolism, which
considers that tumor cells primarily rely on the aerobic glycolytic
pathway for ATP generation.
MitoTracker Red is a living cell fluorochrome, and
results observed with this staining technique may directly reflect
cell reproductive activity. In the present study, the cells grew
well in the microfluidic chips (Figs.
3 and 4). Tumor cells in the
experimental group exhibited the highest cell viability, with
HUVECs in the experimental group exhibiting the second highest
viability. This result demonstrates that in the co-culture system,
these two types of cell interact and aid each other. In the present
quantitative analysis, mitochondrial outer membrane protein,
mitochondrial inner membrane protein, intracristal space protein
and intermembrane space protein were all expressed by the cells.
This revealed that co-culture in the microfluidic chip did not
affect the integrity of mitochondrial structure. Anti-oxidative
phosphorylation I, IV and V proteins were also expressed by the
cells, which demonstrated that co-culture in the microfluidic chip
did not affect the integrity of mitochondrial function. Tumor cells
in the experimental group exhibited the highest protein expression,
and HUVECs in the experimental group exhibited the lowest protein
expression (Fig. 5). These results
suggest that in the co-culture system the majority of the energy
for tumor cells is obtained from oxidative phosphorylation;
however, for HUVECs the majority of energy is obtained from aerobic
glycolysis. This creates a strong positive feedback loop: Oxidative
phosphorylation of tumor cells and aerobic glycolysis of HUVECs aid
each other. This positive feedback may be a reason by which tumor
growth and metastasis is continuously promoted.
The primary mechanism of tumor cell growth in the
tumor microenvironment may be as follows: i) During tumor growth
and metastasis, tumor-associated endothelial cells produce certain
cell factors, and these factors promote oxidative phosphorylation
of tumor cells, thus providing essential energy for cell growth. In
addition, these factors restrain glycometabolism of stromal cells.
ii) Primarily, HUVECs obtain energy from aerobic glycolysis, even
under well-oxygenated conditions (12); therefore, lactic acid produced by
aerobic glycolysis enters tumor cells as metabolic matter by the
energy transfer pathway, which increases the substrate
concentration of oxidative phosphorylation, leading to the
promotion of oxidative phosphorylation of tumor cells.
Consequently, the present study hypothesizes that tumor-associated
endothelial cells grow out of tumor tissues first. However, this is
without a blood supply, and endothelial cells gain energy from
glycolysis. The production of glycolysis enters into tumor cells
for aerobic glycolysis, thus providing steady energy for growth of
tumor cells. As endothelial cells grow out of tumor issues,
vascularization supplies oxygen, which is required for oxidative
phosphorylation. Glycolysis is a fast way to produce energy, which
leads to a rapid growth of endothelial cells. Consequently,
endothelial cell growth leads to tumor cell growth, and tumor cells
promote the glycolysis of endothelial cells. This interactive
mechanism may explain why the growth rate of certain tumor tissues
is faster than other types. iii) Certain studies have revealed that
tumor cells induce oxidative stress in stromal cells, thus
activating the nuclear factor-κB pathway, hypoxia-inducible
factor-1 and reactive oxygen species, which induce each other and
cause endothelial cell autophagy and mitochondrial autophagy
(13–16). This produces numerous substrates for
oxidative phosphorylation, therefore providing a large amount of
continuous energy for tumor cell growth and metastasis. There is a
certain amount of positive feedback regulation between tumor cells
and tumor-associated endothelial cells. Oxidative stress caused by
tumor cells is the trigger of this positive feedback. Once the
trigger is induced, tumor cells continuously obtain substrates for
oxidative phosphorylation from stromal cells, thus gaining energy
from oxidative phosphorylation. To a certain extent, this mechanism
may explain unlimited tumor growth, and this mechanism, which is
known as oxidative stress energy theory (17), may also explain why when tumors
metastasize, tumor cells maintain rapid growth, even without a
substantial blood supply.
Clinically, autophagy inducers and inhibitors are
effective anti-cancer therapies, which is known as the autophagy
paradox. Inducers of autophagy, including temsirolimus and
everolimus, have been demonstrated to be effective therapies for
renal cell carcinoma (18,19) and glioma (20). Chloroquine, an autophagy inhibitor has
prolonged the survival of patients with glioblastoma multiforme
(21), and is currently being studied
in clinical trials for other malignancies. The novel theory
presented in the current study may explain this paradox; the
systemic induction of autophagy prevents tumor cells from using
recycled nutrients, while the systemic inhibition of autophagy
prevents stromal cells from producing recycled nutrients, leading
to tumor cell starvation. Therefore, energy transfer from the tumor
stroma to tumor cells may be used to explain the autophagy paradox.
The present study revealed that lactic acid concentrations in the
tumor cells experimental co-culture system were significantly
increased compared with the control group. Clearly, the reason for
a high lactic acid concentration is that tumor cells promote
aerobic glycolysis of endothelial cells and trigger endothelial
cell autophagy. Therefore, lactic acid enters tumor cells as a
substrate of oxidative phosphorylation and allows the growth of
tumor cells.
In conclusion, the present study investigated
tumor-endothelial metabolic coupling in the tumor microenvironment
and revealed that lactic acid is the primary link. Even though a
high lactic acid concentration was demonstrated to be the factor
for oxidative phosphorylation in tumor cells, the present study did
not verify whether lactic acid is the only factor. Therefore, in
future studies small interfering RNA may be used to block certain
glycolysis pathways to identify the factor for oxidative
phosphorylation of tumor cells. Clinically, through competitive
inhibition and blocking of this pathway, the source of energy to
tumor cells may be reduced and inhibited, thus inhibiting the
growth of tumors from a metabolic perspective.
Acknowledgments
The present study was supported by the National
Natural Science Foundation of China (Beijing, China; grant nos.
30901481, 81372752 and 81472411), Wu JiePing Medical Foundation
(Beijing, China; grant no. 320.6750.13261) and Natural Science
Foundation of Shandong Province (Jinan, China; grant no.
ZR2014HM088).
References
|
1
|
Gonda TA, Tu S and Wang TC: Chronic
inflammation, the tumor microenvironment and carcinogenesis. Cell
Cycle. 8:2005–2013. 2009. View Article : Google Scholar : PubMed/NCBI
|
|
2
|
Boelens MC, Wu TJ, Nabet BY, Xu B, Qiu Y,
Yoon T, Azzam DJ, Twyman-Saint Victor C, Wiemann BZ, Ishwaran H, et
al: Exosome transfer from stromal to breast cancer cells regulates
therapy resistance pathways. Cell. 159:499–513. 2014. View Article : Google Scholar : PubMed/NCBI
|
|
3
|
Zala D, Hinckelmann MV, Yu H, da Cunha MM
Lyra, Liot G, Cordelières FP, Marco S and Saudou F: Vesicular
glycolysis provides on-board energy for fast axonal transport.
Cell. 152:479–491. 2013. View Article : Google Scholar : PubMed/NCBI
|
|
4
|
Heiden MG Vander, Cantley LC and Thompson
CB: Understanding the Warburg effect: The metabolic requirements of
cell proliferation. Science. 324:1029–1033. 2009. View Article : Google Scholar : PubMed/NCBI
|
|
5
|
Martinez-Outschoorn UE, Whitaker-Menezes
D, Valsecchi M, Martinez-Cantarin MP, Dulau-Florea A, Gong J,
Howell A, Flomenberg N, Pestell RG, Wagner J, et al: Reverse
Warburg effect in a patient with aggressive B-cell lymphoma: Is
lactic acidosis a paraneoplastic syndrome? Semin Oncol. 40:403–418.
2013. View Article : Google Scholar : PubMed/NCBI
|
|
6
|
Carmona-Fontaine C, Bucci V, Akkari L,
Deforet M, Joyce JA and Xavier JB: Emergence of spatial structure
in the tumor microenvironment due to the Warburg effect. Proc Natl
Acad Sci USA. 110:19402–19407. 2013. View Article : Google Scholar : PubMed/NCBI
|
|
7
|
Jean C, Chen XL, Nam JO, Tancioni I, Uryu
S, Lawson C, Ward KK, Walsh CT, Miller NL, Ghassemian M, et al:
Inhibition of endothelial FAK activity prevents tumor metastasis by
enhancing barrier function. J Cell Biol. 204:247–263. 2014.
View Article : Google Scholar : PubMed/NCBI
|
|
8
|
Tang J, Cui J, Chen R, Guo K, Kang X, Li
Y, Gao D, Sun L, Xu C, Chen J, et al: A three-dimensional cell
biology model of human hepatocellular carcinoma in vitro. Tumor
Biol. 32:469–479. 2011. View Article : Google Scholar
|
|
9
|
Shiraki N, Yamazoe T, Qin Z, Ohgomori K,
Mochitate K, Kume K and Kume S: Efficient differentiation of
embryonic stem cells into hepatic cells in vitro using a
feeder-free basement membrane substratum. PLoS One. 6:e242282011.
View Article : Google Scholar : PubMed/NCBI
|
|
10
|
Huh D, Matthews BD, Mammoto A,
Montoya-Zavala M, Hsin HY and Ingber DE: Reconstituting organ-level
lung functions on a chip. Science. 328:1662–1668. 2010. View Article : Google Scholar : PubMed/NCBI
|
|
11
|
Schulz TJ, Thierbach R, Voigt A, Drewes G,
Mietzner B, Steinberg P, Pfeiffer AF and Ristow M: Induction of
oxidative metabolism by mitochondrial frataxin inhibits cancer
growth: Otto Warburg revisited. J Biol Chem. 281:977–981. 2006.
View Article : Google Scholar : PubMed/NCBI
|
|
12
|
De Bock K, Georgiadou M, Schoors S,
Kuchnio A, Wong BW, Cantelmo AR, Quaegebeur A, Ghesquière B,
Cauwenberghs S, Eelen G, et al: Role of PFKFB3-driven glycolysis in
vessel sprouting. Cell. 154:651–663. 2013. View Article : Google Scholar : PubMed/NCBI
|
|
13
|
Martinez-Outschoorn UE, Pavlides S, Howell
A, Pestell RG, Tanowitz HB, Sotgia F and Lisanti MP:
Stromal-epithelial metabolic coupling in cancer: Integrating
autophagy and metabolism in the tumor microenvironment. Int J
Biochem Cell Biol. 43:1045–1051. 2011. View Article : Google Scholar : PubMed/NCBI
|
|
14
|
Ghosh S, Mukherjee S, Choudhury S, Gupta
P, Adhikary A, Baral R and Chattopadhyay S: Reactive oxygen species
in the tumor niche triggers altered activation of macrophages and
immunosuppression: Role of fluoxetine. Cell Signal. 27:1398–1412.
2015. View Article : Google Scholar : PubMed/NCBI
|
|
15
|
Lee M and Yoon JH: Metabolic interplay
between glycolysis and mitochondrial oxidation: The reverse Warburg
effect and its therapeutic implication. World J Biol Chem.
6:148–161. 2015. View Article : Google Scholar : PubMed/NCBI
|
|
16
|
Meseure D, Alsibai K Drak and Nicolas A:
Pivotal role of pervasive neoplastic and stromal cells
reprogramming in circulating tumor cells dissemination and
metastatic colonization. Cancer Microenviron. 7:95–115. 2014.
View Article : Google Scholar : PubMed/NCBI
|
|
17
|
Martinez-Outschoorn UE, Balliet RM,
Rivadeneira DB, Chiavarina B, Pavlides S, Wang C, Whitaker-Menezes
D, Daumer KM, Lin Z, Witkiewicz AK, et al: Oxidative stress in
cancer associated fibroblasts drives tumor-stroma co-evolution: A
new paradigm for understanding tumor metabolism, the field effect
and genomic instability in cancer cells. Cell Cycle. 9:3256–3276.
2010. View Article : Google Scholar : PubMed/NCBI
|
|
18
|
Hudes G, Carducci M, Tomczak P, Dutcher J,
Figlin R, Kapoor A, Staroslawska E, Sosman J, McDermott D, Bodrogi
I, et al: Temsirolimus, interferon alfa, or both for advanced
renal-cell carcinoma. N Engl J Med. 356:2271–2281. 2007. View Article : Google Scholar : PubMed/NCBI
|
|
19
|
Motzer RJ, Escudier B, Oudard S, Hutson
TE, Porta C, Bracarda S, Grünwald V, Thompson JA, Figlin RA,
Hollaender N, et al: Efficacy of everolimus in advanced renal cell
carcinoma: A double-blind, randomised, placebo-controlled phase III
trial. Lancet. 372:449–456. 2008. View Article : Google Scholar : PubMed/NCBI
|
|
20
|
Krueger DA, Care MM, Holland K, Agricola
K, Tudor C, Mangeshkar P, Wilson KA, Byars A, Sahmoud T and Franz
DN: Everolimus for subependymal giant-cell astrocytomas in tuberous
sclerosis. N Engl J Med. 363:1801–1811. 2010. View Article : Google Scholar : PubMed/NCBI
|
|
21
|
Sotelo J, Briceño E and López-González MA:
Adding chloroquine to conventional treatment for glioblastoma
multiforme: A randomized, double-blind, placebo-controlled trial.
Ann Intern Med. 144:337–343. 2006. View Article : Google Scholar : PubMed/NCBI
|