Introduction
In 1785, Johann Heinrich Jänisch created one of the
first studies of a disease that triggers up to 14 million new cases
worldwide per year: Cancer (1).
Statistics published by the World Health Organization (WHO) in 2014
list the most common localizations of tumors (1). In men, by far the most common cancer,
accounting for 16.7% of cancer cases, occurs in the lungs, followed
by prostate cancer, accounting for 15.0% of cases, and colorectal
cancer, accounting for 10.0% of cancers. In women, lung cancer
accounts for 8.7% of cancer cases, but mostly the mammary gland is
affected, accounting for 25.2% of cancers (1). In 2010 alone, there were >70,000 new
cases of breast cancer diagnosed in Germany. Statistically, 1 in 8
women develop breast cancer during their lives (2). Although the mortality rate has
demonstrated a decreasing trend in the past decade, in 2014, 89,300
breast cancer-associated mortalities were predicted across the EU
(3). An early detection is essential
for successful treatment of the disease. The survival rate
increases significantly with early detection of the tumor (4). With screening methods such as
mammography screening, an early diagnosis is possible; however, 48%
of all diagnosed tumors in the mammary gland are already in an
advanced stage of disease at the time of diagnosis. Identification
of tumors at an early time point is therefore just as important as
devising new therapies to further curb the disease (2,3).
In previous years, the protein Lifeguard (LFG) has
been associated with breast cancer (5–7). In
certain cells, increased expression of this protein in vitro
resulted in a failure of programmed cell death. In human tissue,
increased expression was detected, particularly in breast cancer
cells (8). In addition, the
C-terminal shortened β-isoform has enhanced expression in breast
cancer cells and tissues. Notably, primary breast cancer cell lines
and tumor tissues showed a stronger expression of the isoform
compared with established cell lines, in which the longer isoform
was strongly expressed. The isoform of the protein may also protect
cells of the mammary gland from apoptosis and result in an increase
in gene expression of members of the Akt signaling pathway
(9).
Furthermore, it was demonstrated that LFG is
regulated by the lymphoid enhancer-binding factor 1 (LEF-1)
transcription factor, whereas LEF-1 is activated via the
phosphoinositide 3-kinase (PI3K)/Akt pathway and interacts with
membrane-bound phosphatidylinositol lipids that are also involved
in the phosphorylation and activation of Akt kinase (5). In follow-up studies, the expression of
the LFG protein was successfully suppressed by the use of specific
small interfering (si)RNA against the LFG transcript and the LEF-1
transcript (5,6). The siRNA-transfected cells showed
significantly increased apoptosis in the presence of perifosine and
the chemotherapeutic agents erlotinib and trastuzumab in breast
carcinoma and sarcoma cell lines (6,7). Bucan
et al identified tripartite motif-containing protein 21
(TRIM21) as an interaction partner of LFG (8). TRIM21 is a protein composed of 4 domains
that plays a role in the regulation of gene expression (10,11). The
present study aims to verify whether the disease degree of breast
cancer is associated with the LFG protein concentration in the
serum of patients.
Materials and methods
Enzyme-linked immunosorbent assay
(ELISA)
From April 2015 until May 2016, samples from breast
cancer patients and healthy volunteers were collected in
association with Professor Lück (Gynecologic Oncology Practice,
Hanover, Germany), and the concentration of LFG protein in serum
was assessed. Approval for the present study was obtained from the
Hannover Medical School's institutional review board (Hanover,
Germany). Informed consent was provided according to the
Declaration of Helsinki. The study participants included 36
patients with breast cancer and 7 healthy volunteers. Informed
consent was obtained from all subjects.
The concentration of LFG protein in the serum of the
patients and volunteers was assessed with a FAIM2 ELISA kit
(MyBioSource, Inc., San Diego, CA, USA), which was used in
accordance with the manufacturer's protocol. A double determination
was performed on 36 patients. In addition, 14 wells of a 96-well
plate were filled with the serum of healthy volunteers. All sera
were stored at −20°C prior to use. A positive control of 150 ng/µl
pure LFG protein was added to 2 wells. In order to accurately
identify the concentration, a standard was created according to the
manufacturer's protocol for the ELISA kit, which may indicate a
concentration between 39,063 and 2,500 pg/ml. Following addition of
all the samples and a subsequent 2 h incubation at 37°C, a biotin
antibody was added and again incubated for 1 h at 37°C. Subsequent
to several washing steps, horseradish peroxidase-avidin
(eBioscience, Inc., San Diego, CA, USA) was added to each well and
incubated for 1 h at 37°C. Subsequent to washing,
3,3′,5,5′-tetramethylbenzidine substrate (Sigma-Aldrich; Merck
Millipore, Darmstadt, Germany) was added to each well and incubated
in the dark for 30 min at 37°C. Finally, this was followed by the
measurement of the fluorescence signals of the plate at a
wavelength of 450 nm with a GENios plate analyzer (Tecan,
Männedorf, Switzerland).
Statistical analysis
The data obtained were analyzed with Origin software
version 9 (OriginLab Corporation, Northampton, MA, USA). All
experiments were performed in triplicate and repeated at two
independent time points. Data are presented as the mean ± standard
deviation. P<0.05 was considered to indicate a statistically
significant difference.
Results
Investigation and statistical
evaluation of measured values
Measurement with the ELISA kit was performed to
assess whether an association exists between the concentration of
LFG protein in the serum of patients and characteristic properties
of breast cancer. Therefore, the concentration of LFG protein in
the serum of 36 patients diagnosed with breast cancer and the
concentrations in the serum of 7 healthy volunteers were assessed.
The measurement of LFG serum concentration was performed by
detecting the optical density (OD) of the serum samples. The
OD450 values are shown in Tables I and II.
 | Table I.OD450 values of the
standards, healthy volunteers and a positive controla. |
Table I.
OD450 values of the
standards, healthy volunteers and a positive controla.
| Standard
(OD450) | Standard
(OD450) | Healthy
(OD450) | Volunteers | Positive
(OD450) | Control |
|---|
| 0.000 | 0.1258 | 0.1763 | 0.2232 | 0.1442 | 0.134 |
| 39.063 | 0.2423 | 0.4207 | 0.2790 |
|
|
| 78.125 | 0.3427 | 0.2658 | 0.2600 |
|
|
| 156.250 | 0.4328 | 0.4259 | 0.4245 |
|
|
| 312.500 | 0.5058 | 0.1657 | 0.1740 |
|
|
| 625.000 | 1.1678 | 0.1676 | 0.1818 |
|
|
| 1,250.000 | 2.0601 | 0.1912 | 0.2084 |
|
|
| 2,500.000 | 2.5811 |
|
|
|
|
 | Table II.OD450 values of 36
patientsa. |
Table II.
OD450 values of 36
patientsa.
| Patient samples
(OD450) |
|---|
| 0.2473 | 0.2823 | 0.1807 | 0.1608 | 0.2855 |
| 0.2168 | 0.3487 | 0.1415 | 0.164 | 0.2764 |
| 0.3808 | 0.4610 | 0.1675 | 0.2546 | 0.1293 |
| 0.4523 | 0.4558 | 0.2197 | 0.2476 | 0.1436 |
| 0.2194 | 0.3015 | 0.3447 | 0.1992 | 0.2694 |
| 0.1945 | 0.3807 | 0.3127 | 0.2507 | 0.1210 |
| 0.2007 | 0.1553 | 0.2719 | 0.1464 | 0.1327 |
| 0.2077 | 0.1698 | 0.1314 | 0.1250 | 0.1307 |
| 0.1389 | 0.1519 | 0.1998 | 0.1397 |
|
| 0.1571 | 0.1721 | 0.1638 | 0.1077 |
|
| 0.2967 | 0.2155 | 0.3027 | 0.1496 |
|
| 0.3198 | 0.3963 | 0.2724 | 0.1127 |
|
| 0.2324 | 0.1304 | 0.2471 | 0.1763 |
|
| 0.2406 | 0.1562 | 0.2301 | 0.2331 |
|
| 0.2267 | 0.1329 | 0.1573 | 0.1142 |
|
| 0.2206 | 0.1584 | 0.1624 | 0.1074 |
|
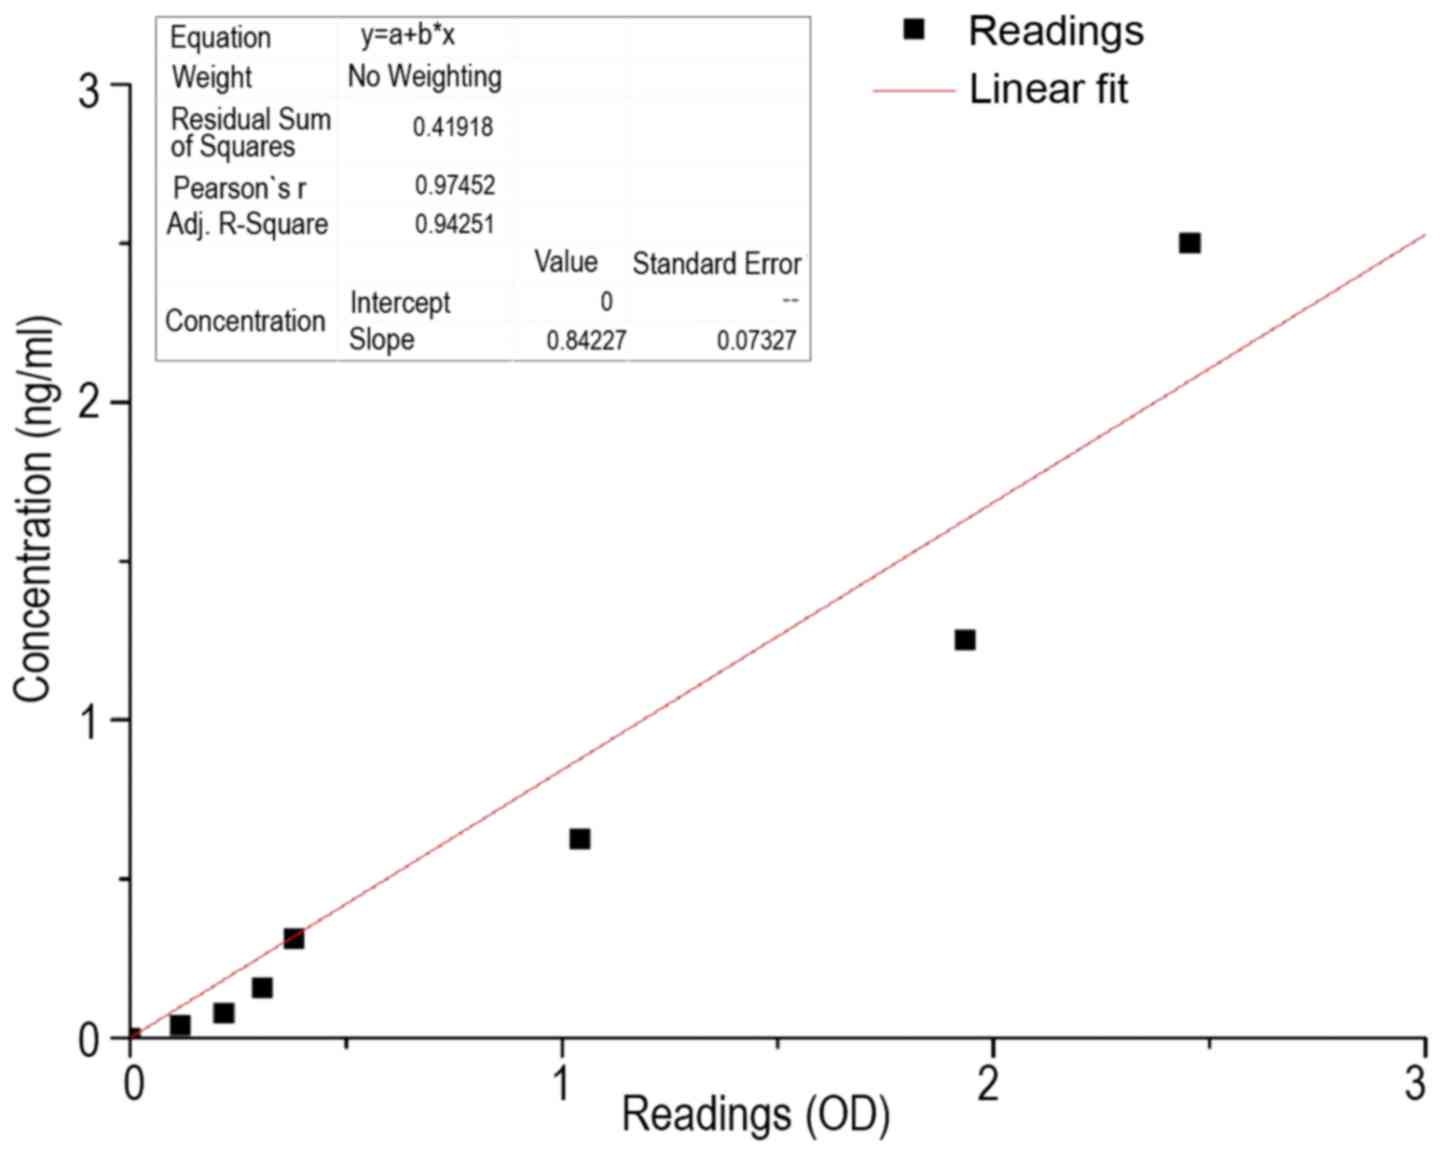
In order to convert the OD450 values in
the corresponding concentrations, the preparation of a calibration
curve based on the standard was necessary. This is shown in
Fig. 1. It was essential that the
straight line extended through the origin, as this ensures that, in
the samples in which the solvent is present exclusively, a
corresponding OD450 of 0 is obtained. The conversion
factor of OD450 to the concentration (ng/ml) was
performed using the following equation:
c(sample)=OD450x(0.84±0.073)
where c was the concentration in ng/ml and
OD450 was the OD measured at a wavelength of 450 nm.
Using the calibration curve, the serum LFG
concentrations of patients and healthy subjects was determined. The
OD values for the 36 patients are reported in Table III. Each element of Table III corresponds to the average LFG
concentration of a duplicate determination in serum of the
respective patients.
 | Table III.Concentrations of Lifeguard protein
in 36 patients with the standard deviation. |
Table III.
Concentrations of Lifeguard protein
in 36 patients with the standard deviation.
| Patient samples,
ng/ml |
|---|
| 0.196±0.017 | 0.266±0.023 | 0.136±0.012 | 0.137±0.012 | 0.237±0.021 |
| 0.351±0.030 | 0.386±0.033 | 0.163±0.014 | 0.212±0.018 | 0.115±0.010 |
| 0.174±0.015 | 0.287±0.025 | 0.277±0.024 | 0.190±0.016 | 0.164±0.014 |
| 0.172±0.015 | 0.137±0.012 | 0.170±0.015 | 0.114±0.010 | 0.111±0.010 |
| 0.125±0.011 | 0.137±0.012 | 0.153±0.013 | 0.104±0.009 |
|
| 0.260±0.023 | 0.258±0.022 | 0.242±0.210 | 0.110±0.009 |
|
| 0.199±0.017 | 0.121±0.011 | 0.201±0.017 | 0.172±0.015 |
|
| 0.188±0.016 | 0.123±0.011 | 0.135±0.012 | 0.093±0.008 |
|
Table IV reports the
average LFG concentrations of a duplicate determination in serum of
healthy subjects, as well as the measurements for the positive
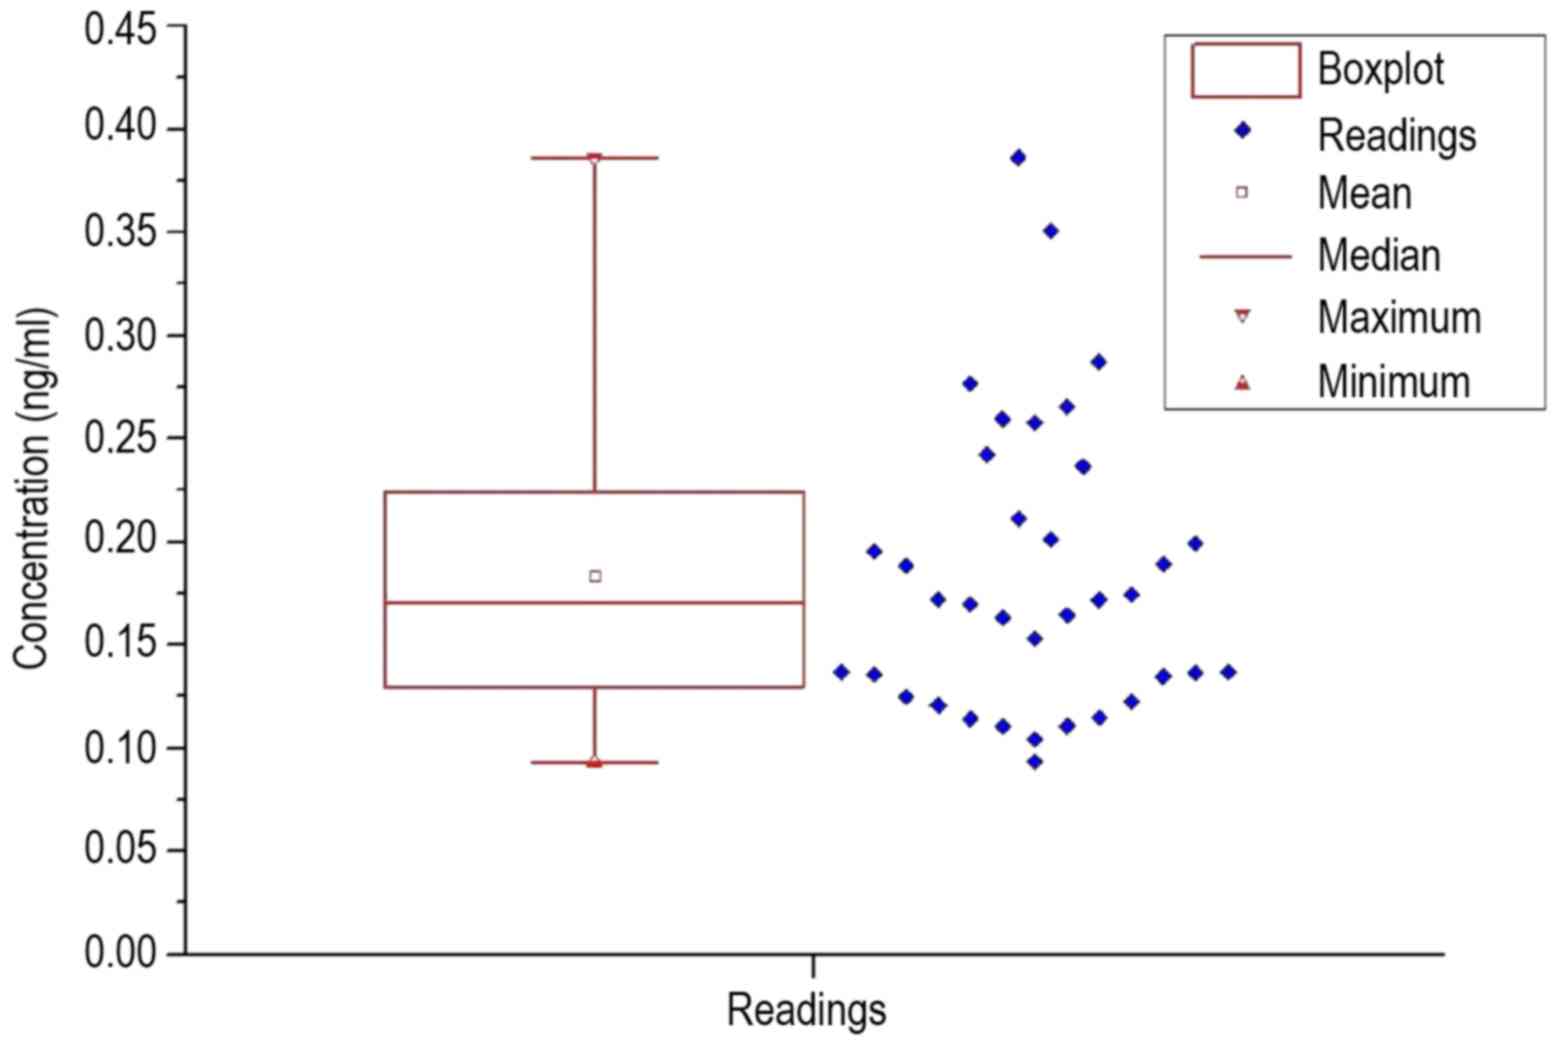
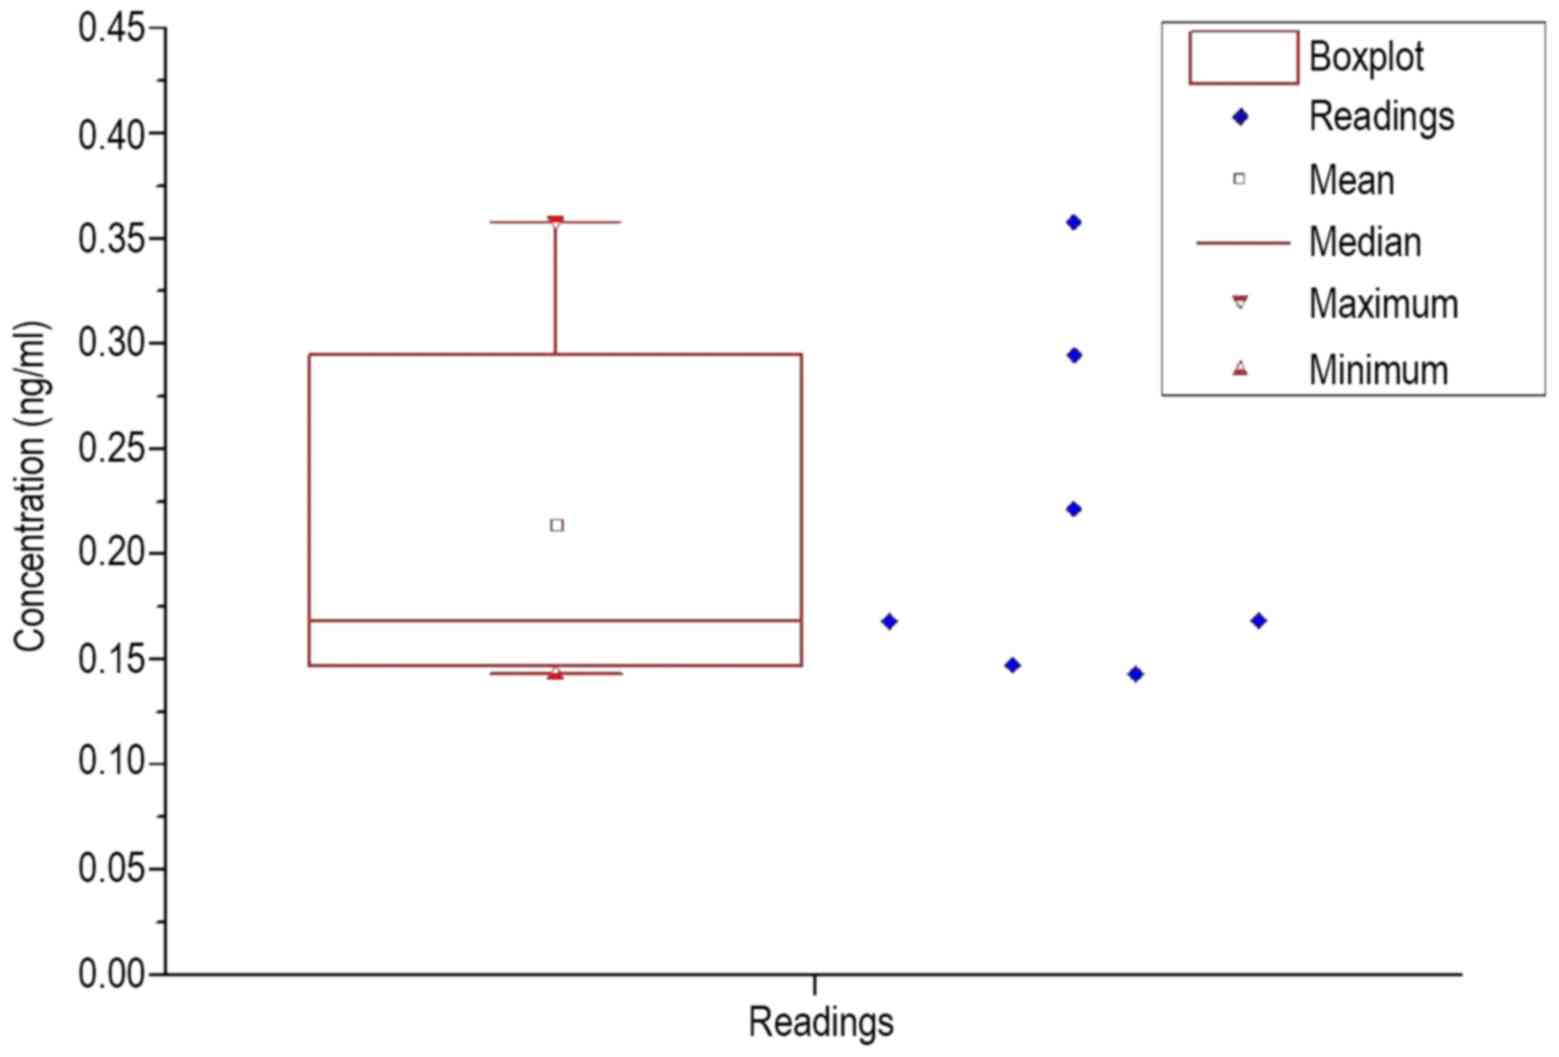
control. To visualize an overview of the spread of the values, a
box plot was prepared for each group of patients and healthy
volunteers, which are shown in Figs.
2 and 3.
 | Table IV.Concentrations of Lifeguard protein
in 7 healthy volunteers, as well as the positive control with the
respective standard deviation. |
Table IV.
Concentrations of Lifeguard protein
in 7 healthy volunteers, as well as the positive control with the
respective standard deviation.
| Healthy volunteers,
ng/ml | Positive control,
ng/ml |
|---|
| 0.168±0.015 | 0.117±0.009 |
| 0.295±0.026 |
|
| 0.221±0.019 |
|
| 0.358±0.031 |
|
| 0.143+0.012 |
|
| 0.147±0.013 |
|
| 0.168±0.015 |
|
The resulting calculated statistical values are
listed in Table V. In each
measurement, the standard deviation was extremely large. The
standard deviation in the patient group was almost 40% of the mean
value; in healthy subjects the standard deviation was ~41% of the
mean. While the average value in healthy volunteers was 0.03 ng/ml
higher than the average value in patients, the median was similar
in the patient group and healthy volunteers, at 16.8–17.1 ng/ml.
When comparing Figs. 2 and 3, a significantly larger span was observed
in the patients, as well as the lower interval in which the upper
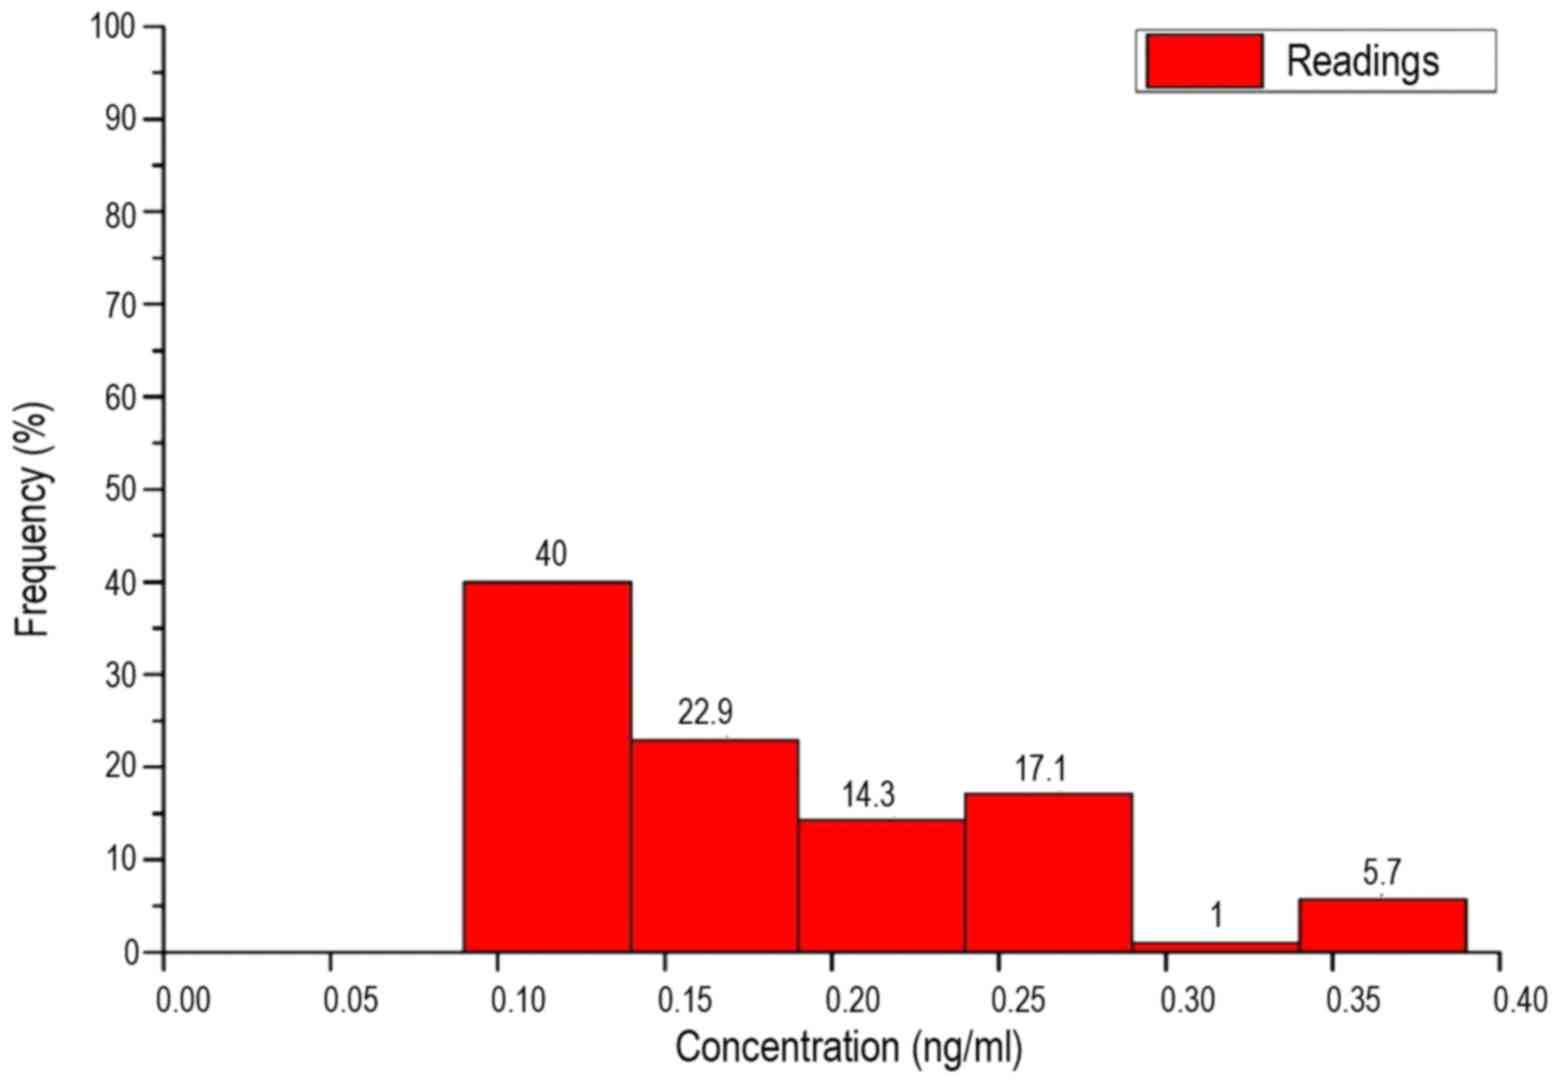
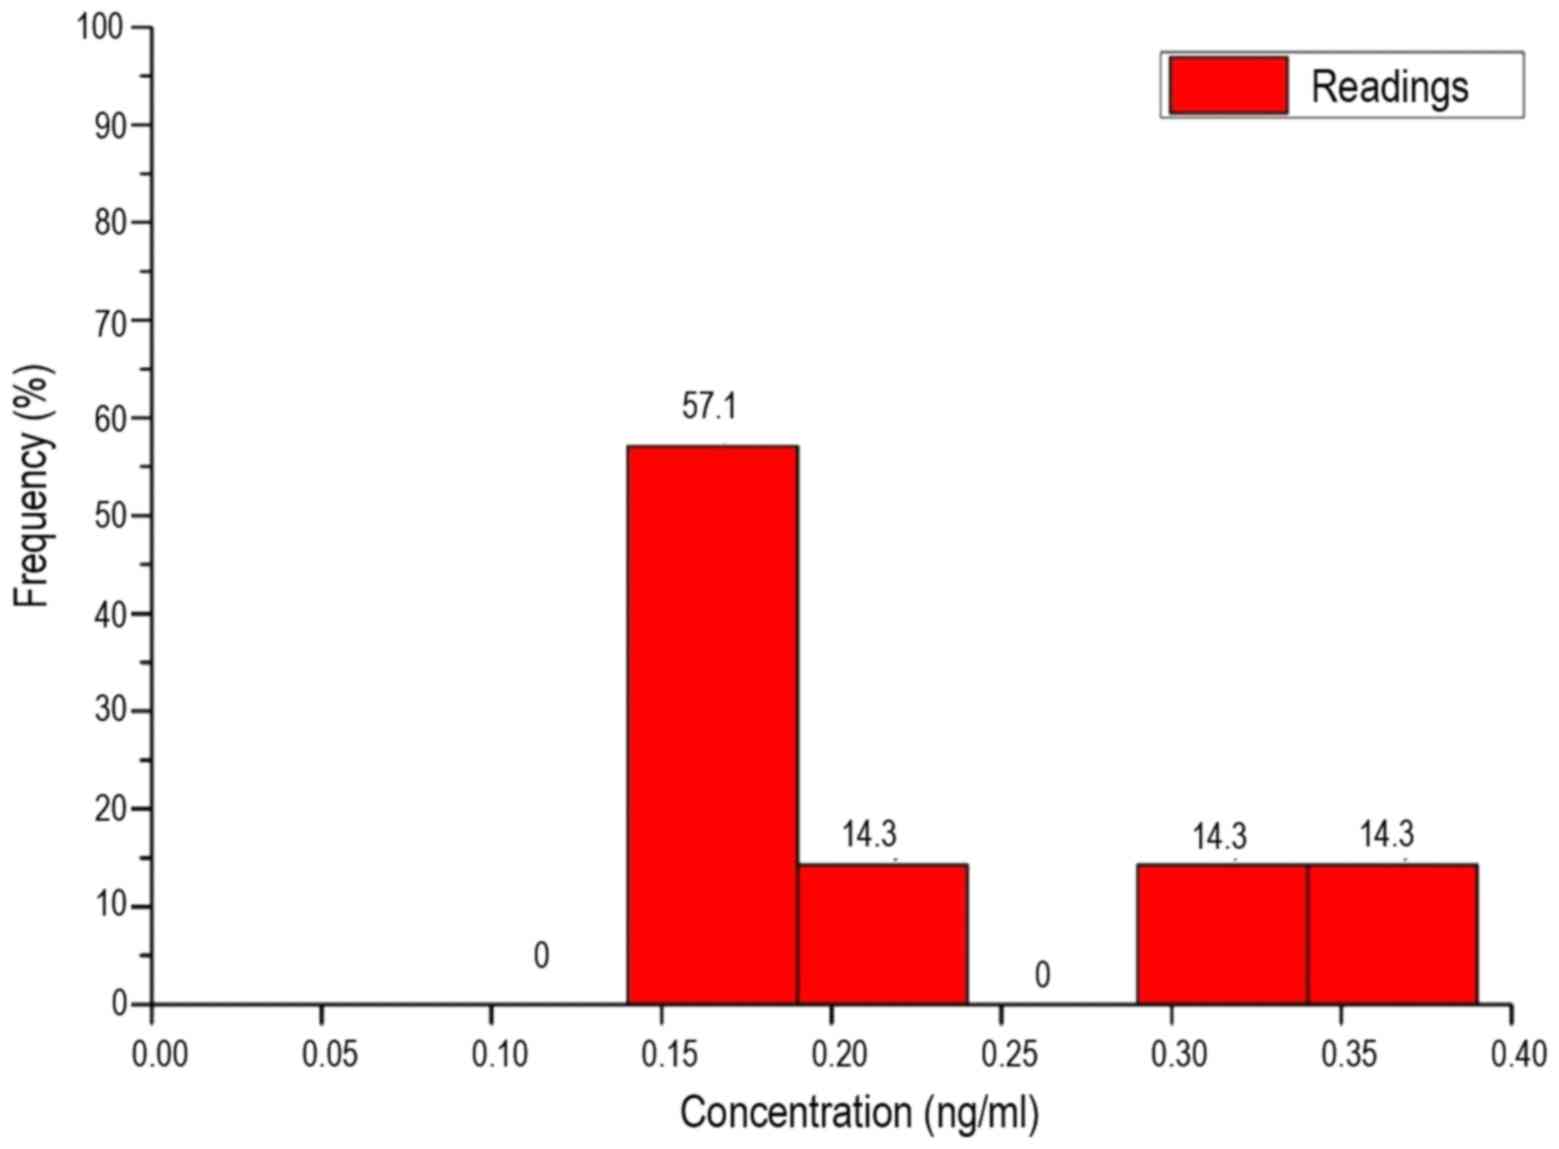
quartile is located. The histograms of each frequency distribution
are shown in Figs. 4 and 5.
 | Table V.Statistical parameters of two
measurements of the mean concentration value of Lifeguard protein
(all data are provided in ng/ml). |
Table V.
Statistical parameters of two
measurements of the mean concentration value of Lifeguard protein
(all data are provided in ng/ml).
| Group | Mean | Standard
deviation | Media | Minimum | Maximum | Number |
|---|
| Patients | 0.184 | 0.070 | 0.171 | 0.093 | 0.386 | 36 |
| Healthy
individuals | 0.214 | 0.083 | 0.168 | 0.143 | 0.358 | 7 |
The interval width Δx was derived by dividing the
breadth by the number of intervals, as follows:
Δx(ng/ml)=breadth/√n(patients)=0.04885≈0.05
Thus, the value range was divided into 6 intervals
on an identical length of 0.05 ng/ml. These are shown in Table VI. As the box plots reveal, in the
patients and healthy subjects there was no equal distribution over
all intervals, but a clear maximum in one of the intervals. The
maximum number of patients was in interval 1. Until interval 3, the
frequency of concentrations steadily declined. The number of
patients in interval 4 was slightly higher than interval 3. No
patients demonstrated concentrations in interval 5 and only 5.7% of
the measured values were classed as interval 6.
 | Table VI.Interval breadths in the
histograms. |
Table VI.
Interval breadths in the
histograms.
| Measurement | Interval 1 | Interval 2 | Interval 3 | Interval 4 | Interval 5 | Interval 6 |
|---|
| Breadth, ng/ml | 0.09–0.14 | 0.14–0.19 | 0.19–0.24 | 0.24–0.29 | 0.29–0.34 | 0.34–0.39 |
A similar result is shown in the histogram of the
healthy volunteers. The interval with the highest frequency was,
however, interval 2. None of the measured values lay in intervals 1
or 4. The remaining intervals 3, 5 and 6 reflect an equal
distribution of 14.3%.
Evaluation of measured values
according to patient and tumor characteristics
Additional evaluation of the measured values was
performed as a function of multiple attributes of the patients and
breast cancer. These characteristics included: Age of the patients;
type of histological finding; presence of various growth factors,
consisting of progesterone and estrogen receptors, and human
epidermal growth factor receptor 2; Ki67 value; grade of the tumor;
and size of the tumor and presence of lymph node involvement, as
well as metastases.
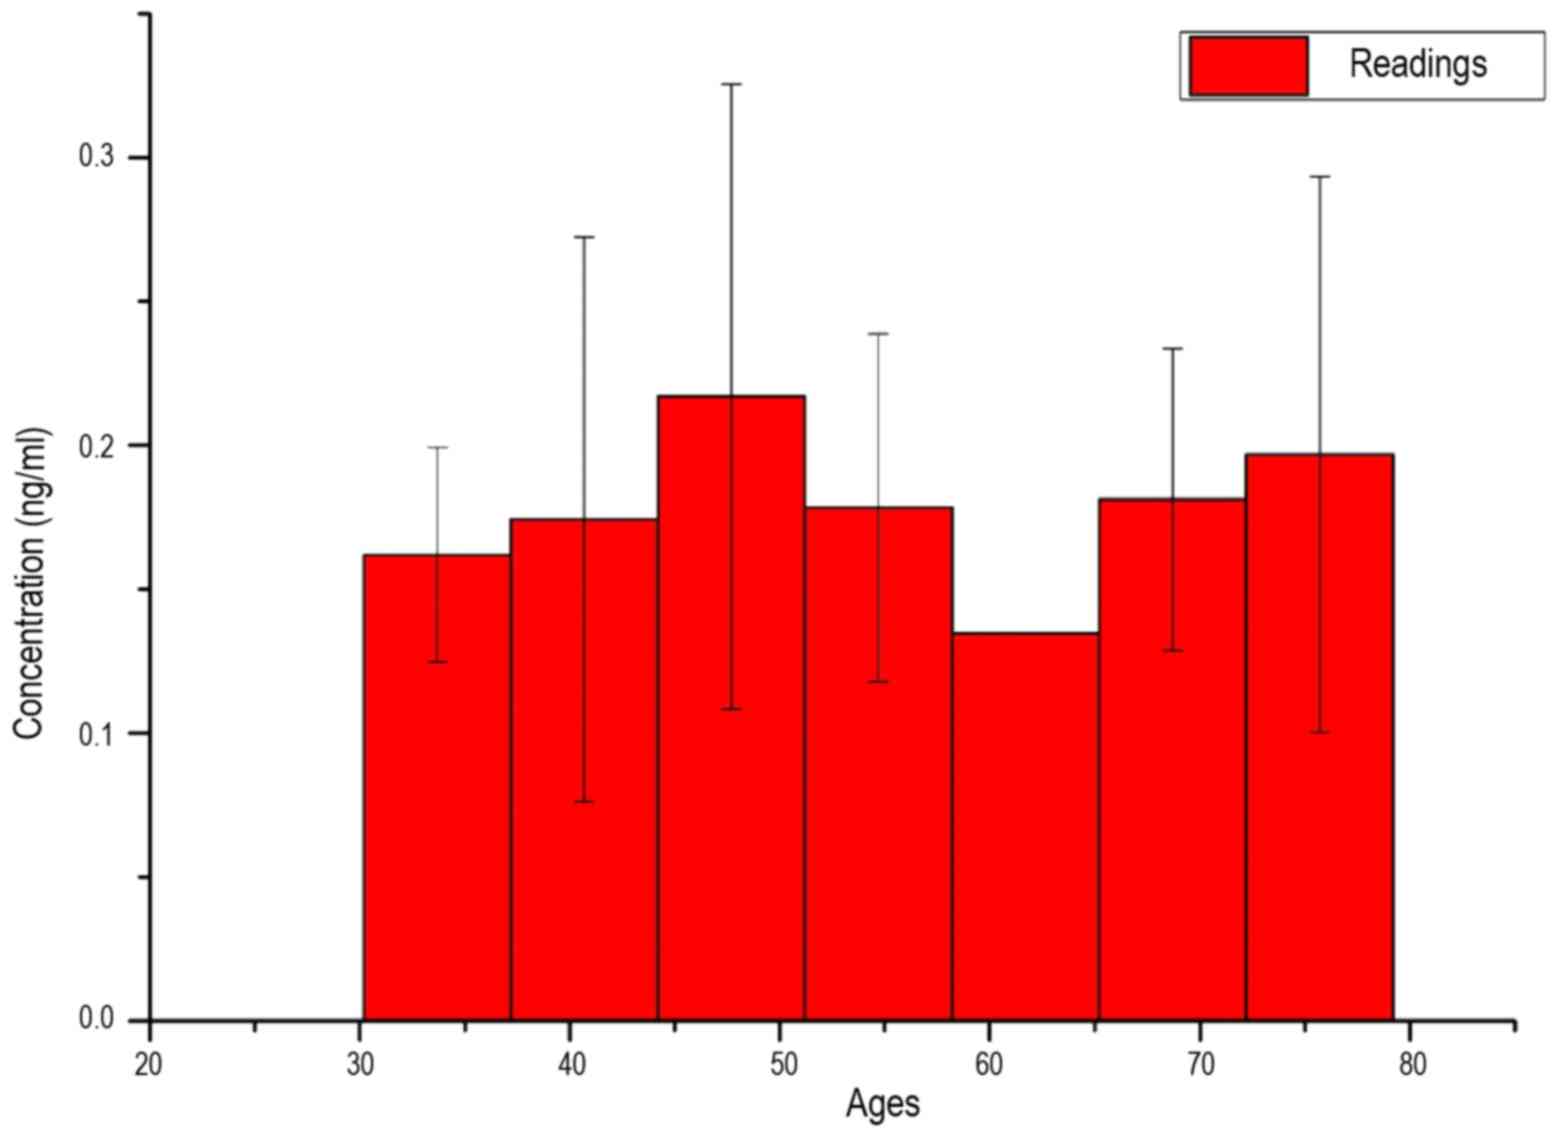
In Fig. 6, the average
measured serum LFG concentration of patients is shown as a function
of their age. As an interval breadth, the root of the span width
was taken:
Δx=√spanwidth=√79–30=7years
Due to the extremely high standard deviation, as
well as the similar average values in almost all intervals, a
uniform distribution of LFG protein concentration in all
investigated ages may be assumed.
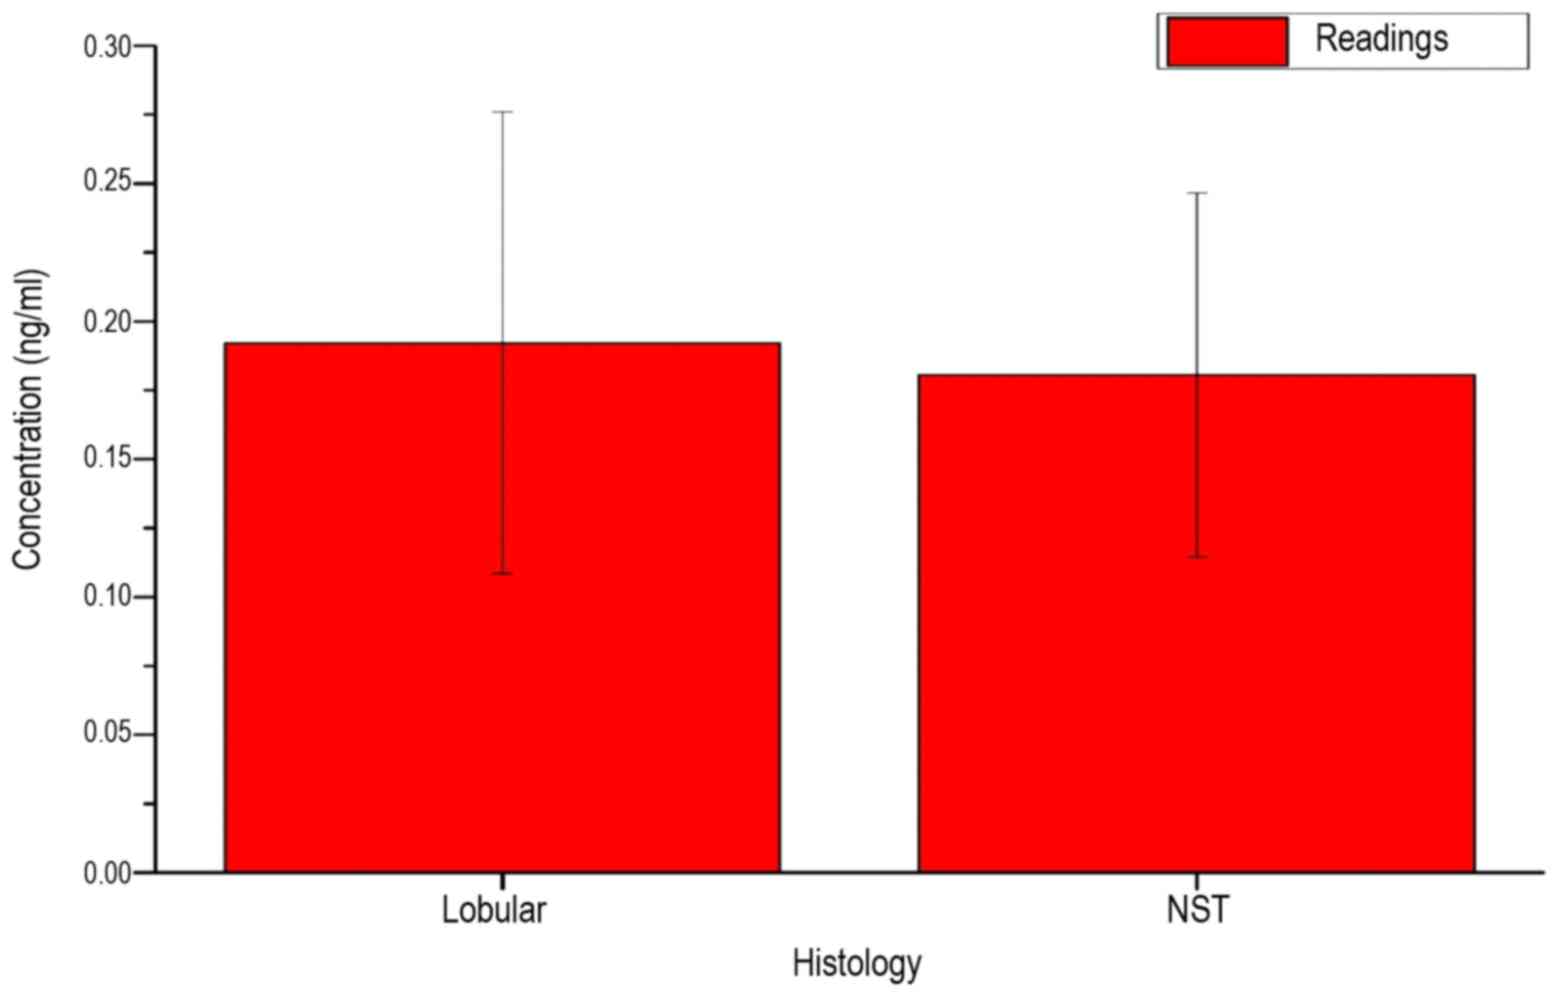
Fig. 7 shows the
measured serum LFG concentration of the patients, depending on the
histological findings of breast cancer. The similar mean and the
high standard deviations for the two possible types of findings
indicate no direct association with the LFG protein concentration
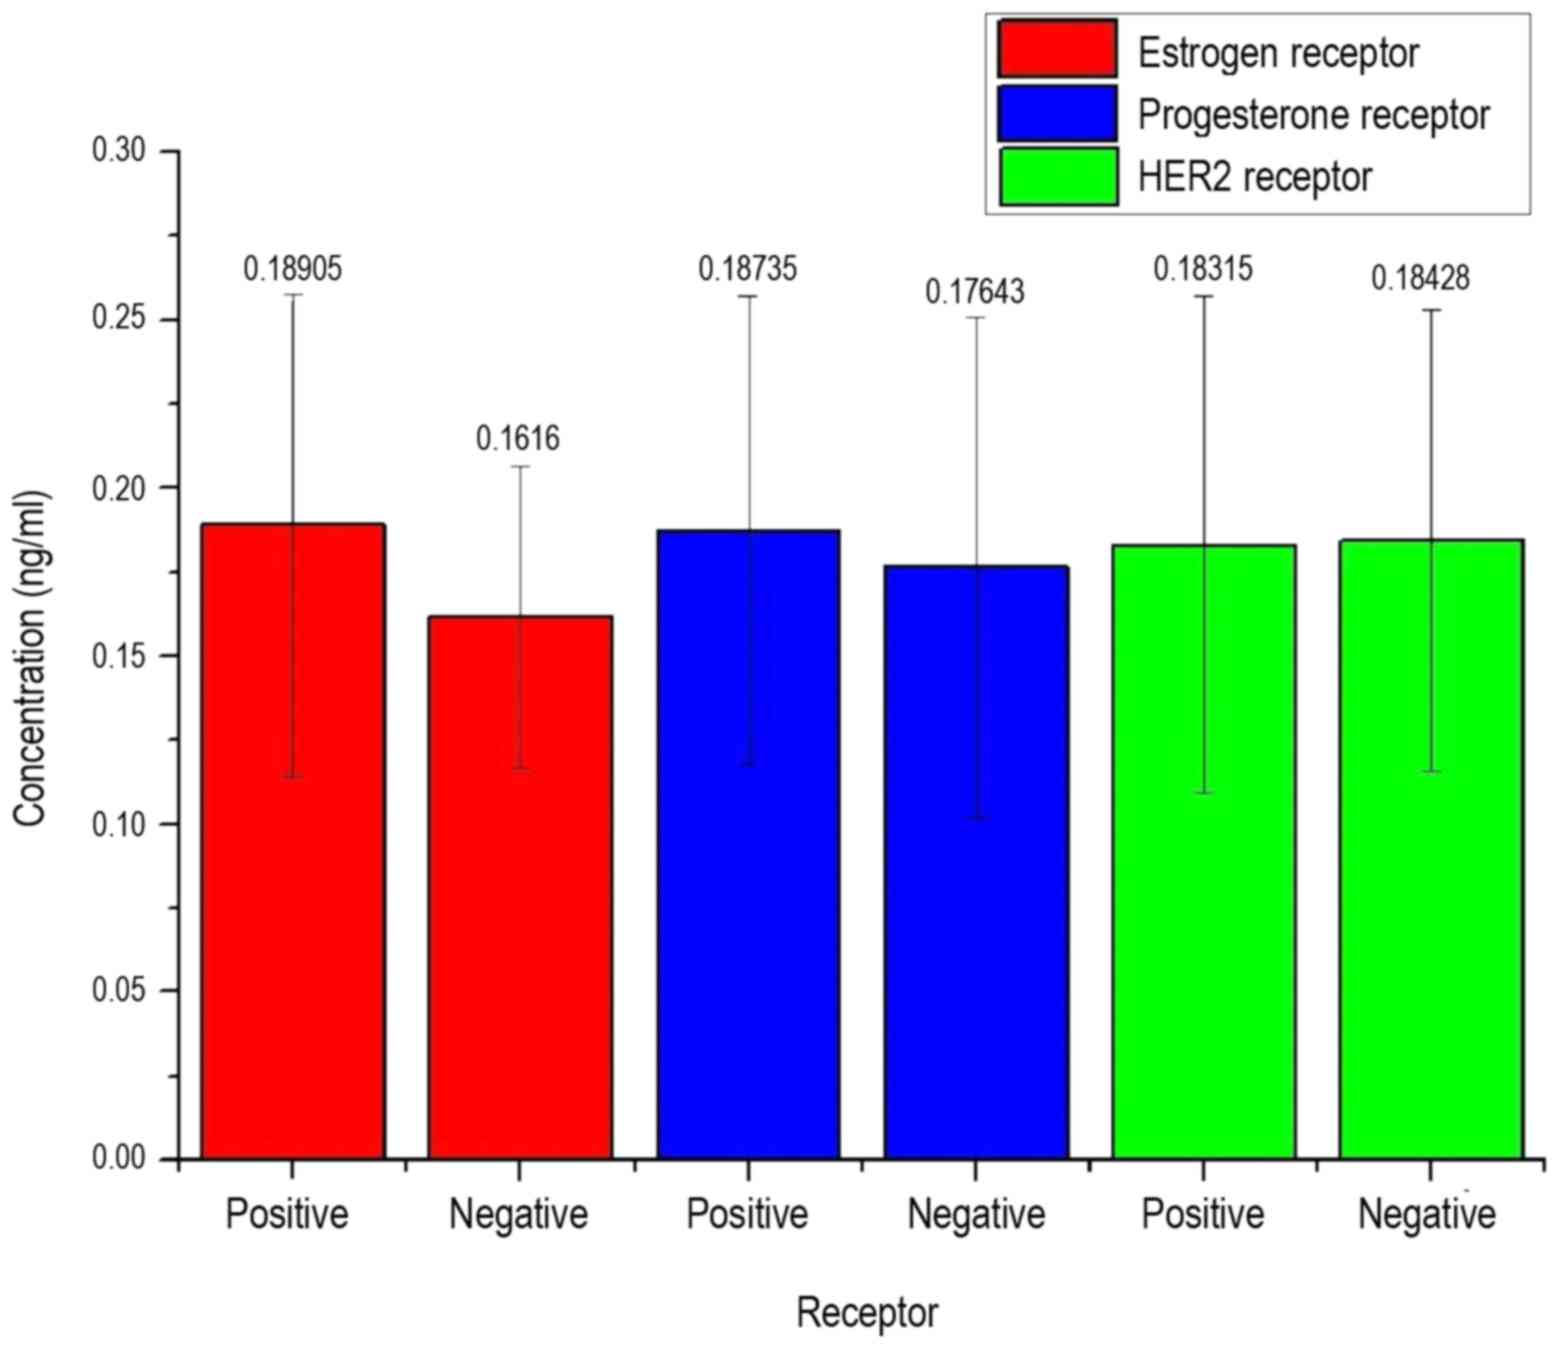
in the serum of patients. In Fig. 8,
the measured concentration of patients depending on the detection
of various types of receptors as growth factors is mapped.
In Fig. 8, it can be
observed that the LFG protein concentration is not decisive on the
presence of a receptor, as also in this approach an equal
distribution of all arithmetic means and high standard deviations
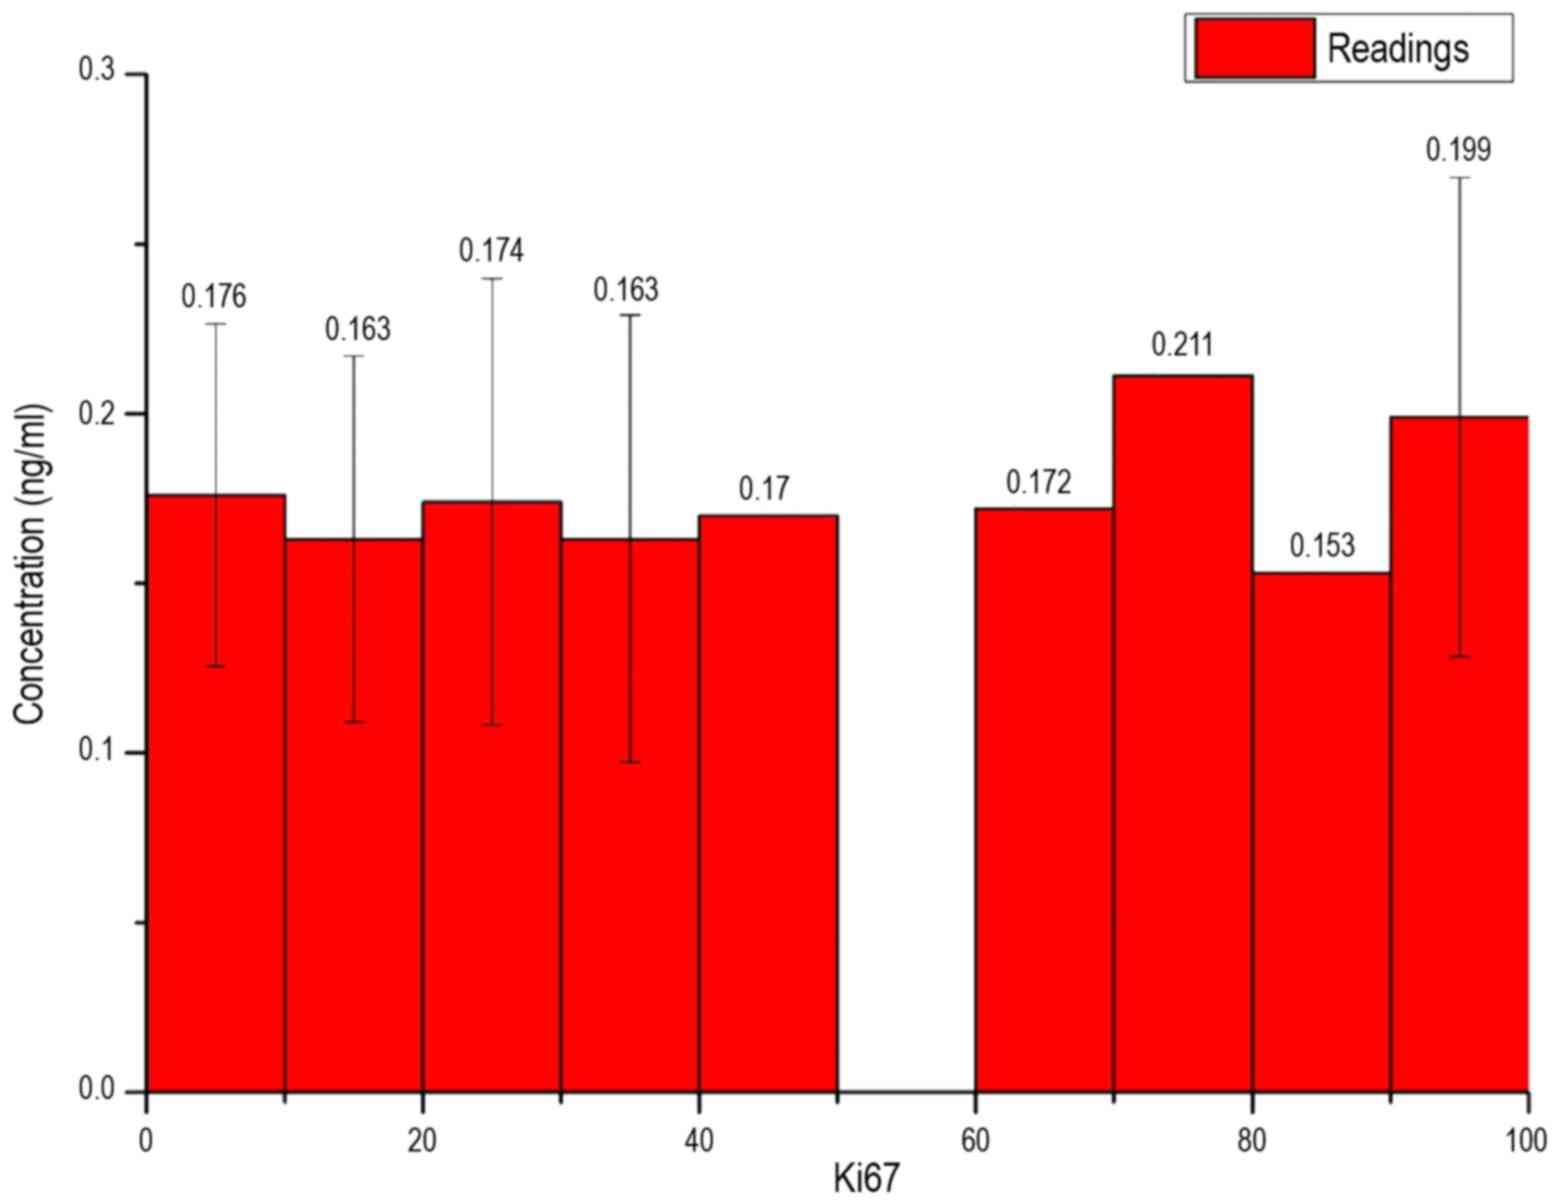
can be obtained. In Fig. 9, the
measured concentration of patients is exhibited depending on the
Ki67 value of breast cancer. As interval limits, the root of the
maximum possible amount was taken for the Ki67 value:
Δx=√Ki67(maximum)=√100=10
In Fig. 9, all bar
heights for the individual intervals were of a similar value and
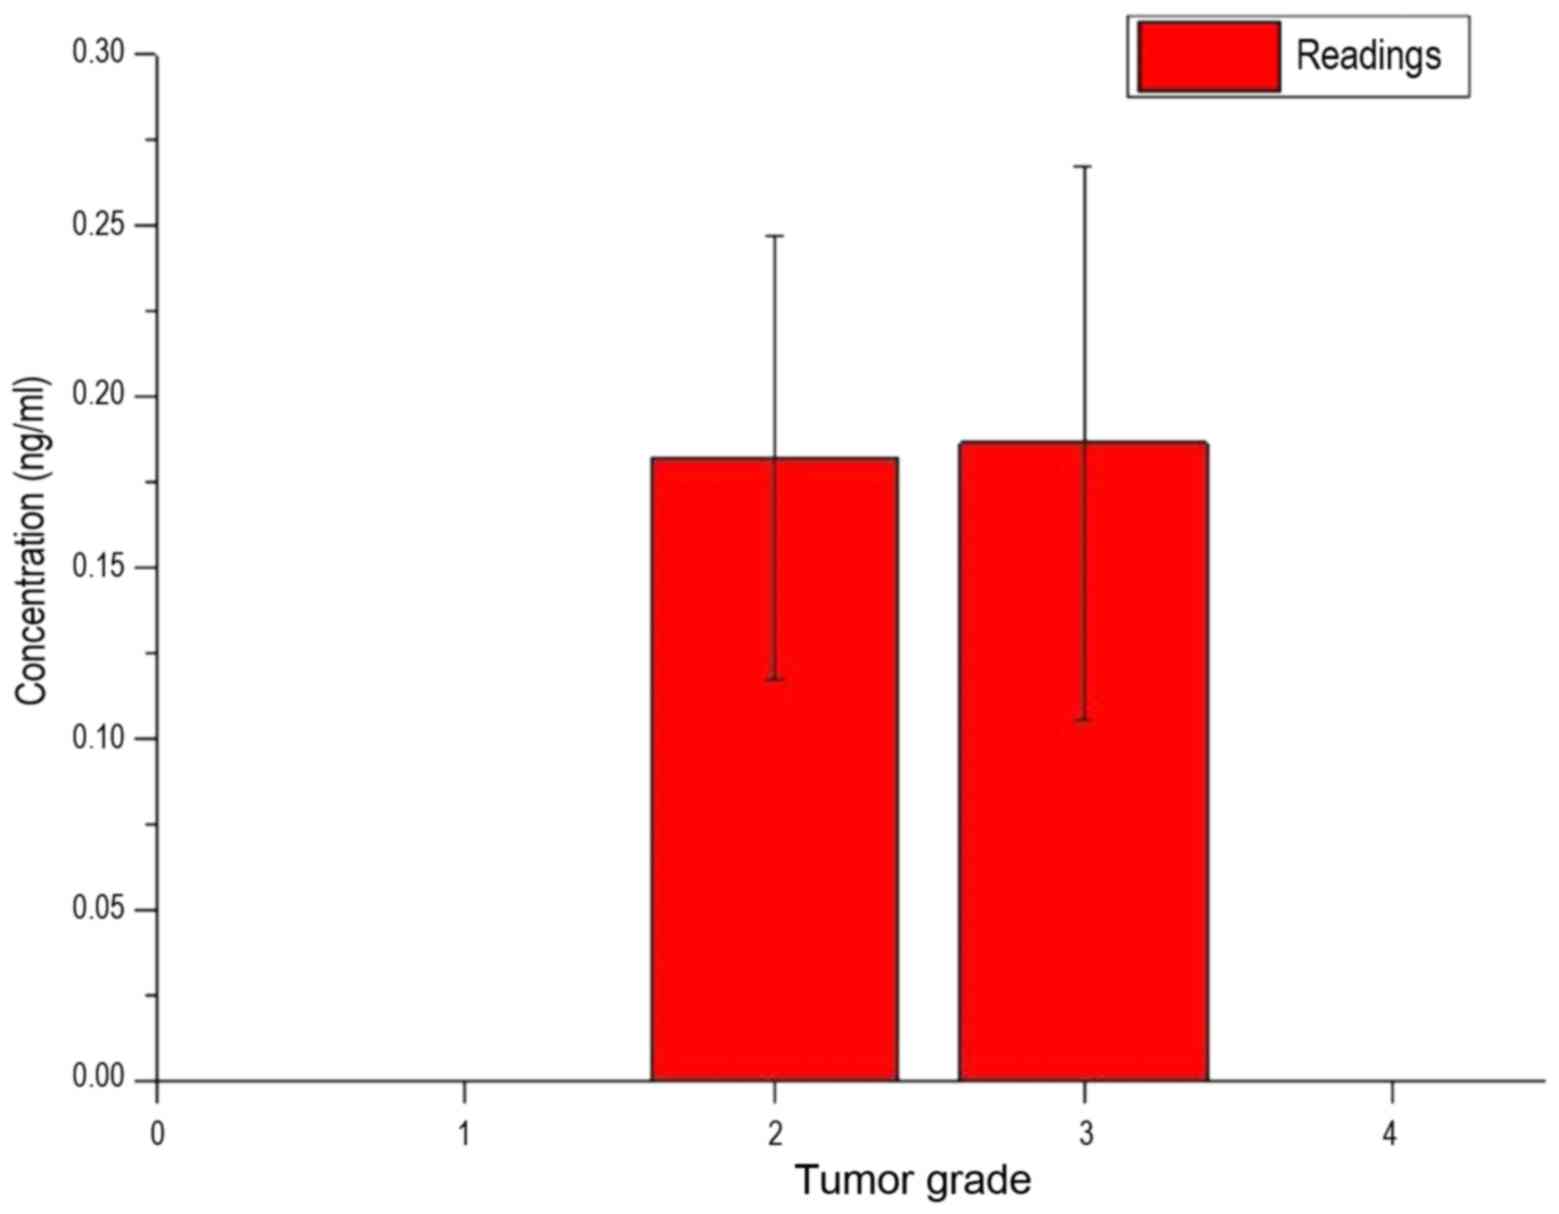
the existing standard deviations had strong variances. Fig. 10 shows the measured concentration of
LFG protein of the patients, depending on the grade of the
tumor.
In Fig. 10, it was
also shown that each bar was of a similar value and each bar had a
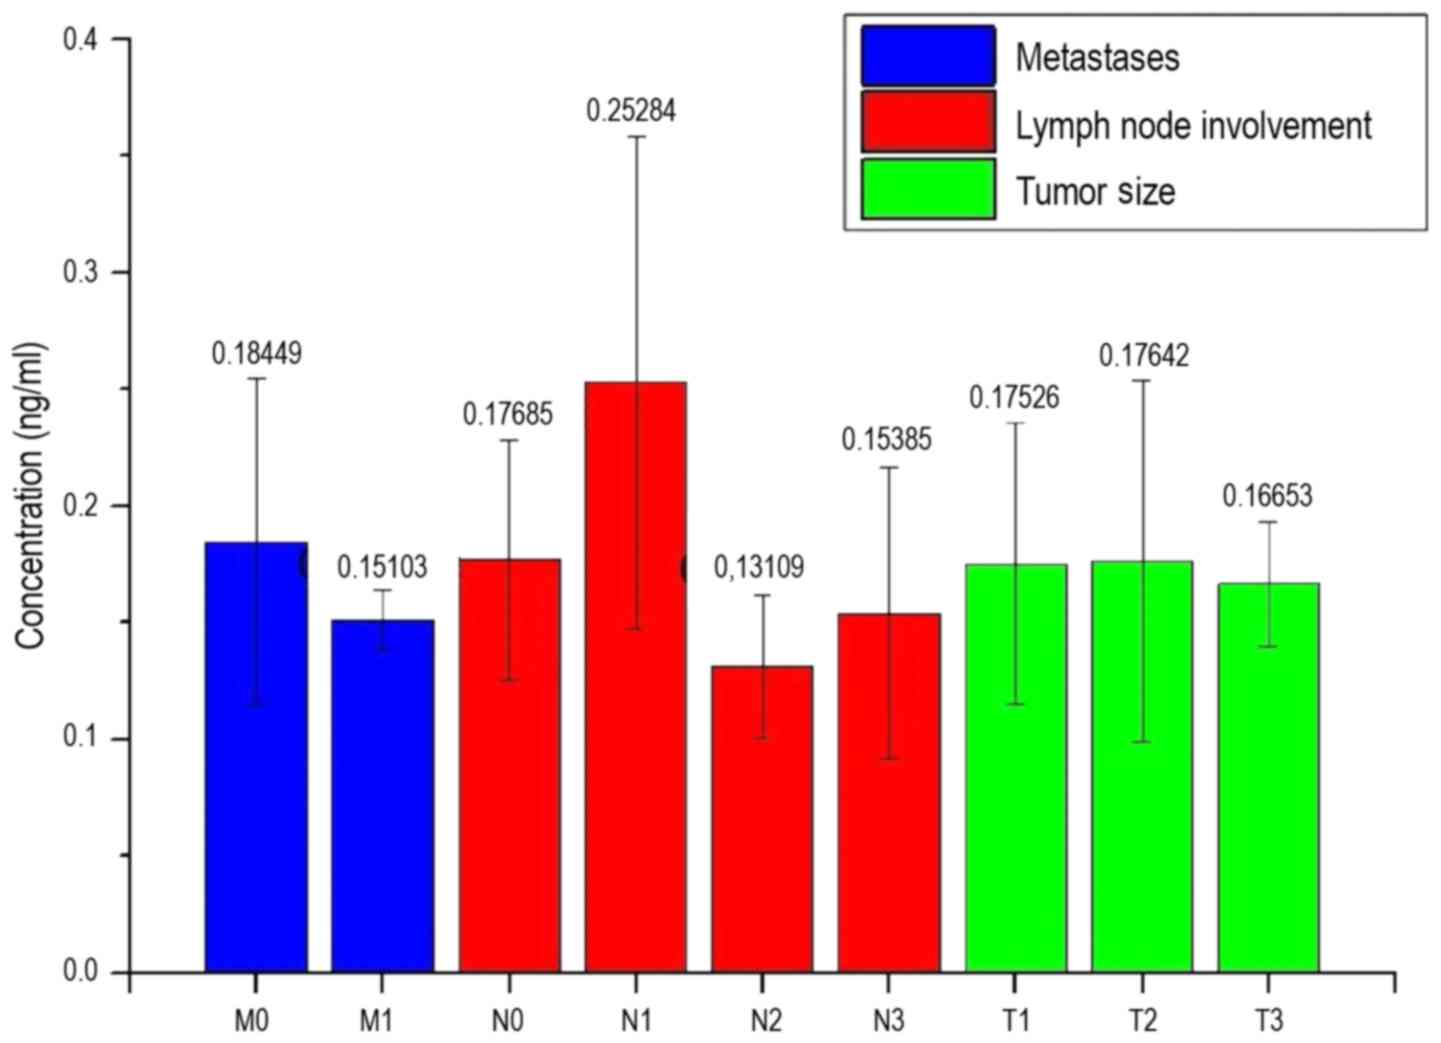
large standard deviation. Fig. 11
shows the measured concentration of the patients depending on the
properties of the different stages of cancer.
In Fig. 11, with the
exception of the concentrations of the measurements N1 and N2, all
bars were approximately the same value. The bar N1 shows a
concentration of 0.253 ng/ml, which is higher than any other. The
level of the N2 bar is the lowest at 0.131 ng/ml. With the
exception of M1, N2 and T3, all standard deviations are at a value
of at least ±0.05 ng/ml. The standard deviation of N2 and T3 is
0.03 ng/ml. The standard deviation of M1 is 0.015 ng/ml, and the
lowest of all the standard deviations.
Discussion
In the box plots of Figs.
2 and 3, as well as in the
histograms of Figs. 4 and 5, it can be observed that the LFG
concentration in the serum of patients and also from healthy
volunteers is not arbitrarily large, but dependent on a previously
unknown subject. The mean LFG protein concentration in the serum of
all samples was 0.1–0.2 ng/ml, with certain exceptions (≤0.39
ng/ml). The histograms do not contain an equal distribution of
concentration over the entire intervals, but instead demonstrate a
maximum at an interval followed by lower concentrations in higher
intervals. Comparing the two histograms, the frequency distribution
appears to be similar, which initially does not indicate a direct
function of the LFG protein concentration in the serum of patients
with the characteristics of breast cancer.
The LFG protein concentration in the serum of
patients is presented in Figs.
7–10. Although there are
differences between certain average values of concentrations, the
standard deviation of all measured values is too high, as that
there may be an association between the LFG protein concentration
and a property.
Fig. 10 shows that
tumor size and the occurrence of metastasis are not directly
associated with the concentration of LFG protein in the serum.
Although the average concentrations in patients without metastases
is higher than in patients with metastatic disease, there is such a
large standard deviation in the measurements of the patients
without metastases that no clear dependence can be detected.
Additionally, only three readings of patients with metastases were
available for measurements, and therefore no statistically
significant differences were identified. A similar problem appears
with the values of the patients with lymph node involvement. The
mean values show the tendency that with a low involvement level of
the lymph node (N1), a higher LFG protein concentration is present
in the serum compared with no (N0) or higher lymph node involvement
(N2 + N3). By contrast, the standard deviations are high.
Furthermore, there were only 4 samples available for N1, 3 samples
for N2 and 6 samples for N3, so that an insufficient statistical
significance exists in the present analysis.
Fig. 6 shows that the
concentration of LFG protein in the serum of the patients is also
not dependent on the age of patients, since there is an equal
distribution across all ages. Also, in this measurement there were
too few samples available for the age groups, with low or no
standard deviation to underline a statistical significance.
Despite the results of the histograms, Tables I and II must be observed critically as there is a
high variance within several duplicate determinations in certain
cases. In one case, concentrations of 0.2155 ng/ml and 0.3863 ng/ml
were determined, resulting in a difference of 0.181 ng/ml.
Assessing the other readings, this difference in results is
extremely high and is likely to be caused by errors in the
experimental procedure. The fluorometer GENios Tecan, which was
used to determine the OD450 values, could have performed
an erroneous measurement. However, since a value of 0.12 ng/ml was
determined for the positive control and thus only a difference of
0.03 ng/ml is present from the true value, this possibility can be
excluded. The general failure of the method can also be excluded
due to the correct measurement of the standard; however, the
possibility that an erroneous measurement was performed in
individual wells remains. With the exception of that possibility,
the ELISA kit used is described as highly sensitive, so small
errors may have a major impact on the result. In particular, the
washing steps subsequent to drying are described with numerous
possible error sources, as not only a certain degree of care, but
also a fast working speed is required.
The present results demonstrate that a discrete
concentration of LFG protein is present in the human serum. Taking
into account that LFG is a transmembrane protein and, accordingly,
assumes a large extent of cellular functions, this is a significant
identification.
Using the ELISA kit, a direct association between
the LFG protein concentrations in the serum of patients and various
characteristics of breast cancer was excluded. Thus, the initial
hypothesis to use the LFG protein concentration in the serum as a
tumor marker for the diagnosis of breast cancer cannot be realized.
However, the histograms demonstrate distinct maxima, which indicate
an association with a currently unknown factor. Thus, further
investigation is required. For example, additional examination of
the association between other medical conditions, such as
rheumatoid arthritis or diabetes, as well as everyday habits such
as diet and smoking as aspects associated with LFG protein
concentration in the serum. Therefore, additional research on the
origin of the LFG protein concentration in the serum may provide
important insights into the human biological function and operation
of the LFG protein.
Acknowledgements
The present study was funded by the Niedersächsische
Krebsgesellschaft (Hanover, Germany; grant number B/Sc). The
authors are grateful to Ms. Andrea Lazaridis (Hanover Medical
School, Hanover, Germany) for her excellent technical
assistance.
References
|
1
|
Stewart BW and Wild CP: World Cancer
Report 2014. IARC Publications; Lyon: 2014
|
|
2
|
Robert Koch Institute and the Association
of Population-Based Cancer Registries in Germany, . Cancer in
Germany 2009/2010. 9th. Robert Koch Institute; Berlin: 2013, (In
German).
|
|
3
|
Malvezzi M, Bertuccio P, Levi F, La
Vecchia C and Negri E: European cancer mortality predictions for
the year 2014. Ann Oncol. 25:1650–1656. 2014. View Article : Google Scholar : PubMed/NCBI
|
|
4
|
Weinberg RA: The Biology of Cancer. 2nd.
Garland Science; New York, NY: pp. 252013
|
|
5
|
Bucan V, Adili MY, Choi CY, Eddy MT, Vogt
PM and Reimers K: Transactivation of Lifeguard (LFG) by Akt-/LEF-1
pathway in MCF-7 and MDA-MB 231 human breast cancer cells.
Apoptosis. 15:814–821. 2010. View Article : Google Scholar : PubMed/NCBI
|
|
6
|
Bucan V, Choi CY, Lazaridis A, Vogt PM and
Reimers K: Silencing of anti-apoptotic transmembrane protein
lifeguard sensitizes solid tumor cell lines MCF-7 and SW872 to
perifosine-induced cell death activation. Oncol Lett. 2:419–422.
2011.PubMed/NCBI
|
|
7
|
Gratzke AL, Reimers K, Vogt PM and Bucan
V: Sensitising breast cancer cells to chemotherapy by
downregulation of Lifeguard. Cancer Sci Ther. 6:411–416. 2014.
|
|
8
|
Bucan V, Mandel K, Bertram C, Lazaridis A,
Reimers K, Park-Simon TW, Vogt PM and Hass R: LEF-1 regulates
proliferation and MMP-7 transcription in breast cancer cells. Genes
Cells. 17:559–567. 2012. View Article : Google Scholar : PubMed/NCBI
|
|
9
|
Dastagir N, Lazaridis A, Dastagir K,
Reimers K, Vogt PM and Bucan V: Role of lifeguard β-isoform in the
development of breast cancer. Oncol Rep. 32:1335–1340.
2014.PubMed/NCBI
|
|
10
|
Wada K, Niida M, Tanaka M and Kamitani T:
Ro52-mediated monoubiquitination of IKKβ down-regulates NF-κB
Signalling. J Biochem. 146:821–832. 2009. View Article : Google Scholar : PubMed/NCBI
|
|
11
|
Freemont PS: RING for destruction? Curr
Biol. 10:R84–R87. 2000. View Article : Google Scholar : PubMed/NCBI
|


