Introduction
Lung cancer may be classified into two main groups,
small-cell lung cancer (SCLC) and non-small cell lung cancer
(NSCLC) (1). Epidemiological data
revealed that tobacco smoke exposure is the leading risk factor of
lung cancer and NSCLC accounts for 85% of lung cancer cases
(2,3).
Despite encouraging progress made in the early detection and
therapeutic strategies, lung cancer remains one of the most common
malignancies worldwide, with a poor prognosis of NSCLC patients and
a relative low 5-year survival rate (3). Therefore, novel prognostic biomarkers
should be identified and applied in combination with current
staging systems to improve the prognostic evaluation and clinical
management of patients with NSCLC.
T-box transcription factors are highly
evolutionarily conserved and serve critical roles in a variety of
cellular biological events (4). T-box
3 (Tbx3), a member of the T-box transcription factor family,
is widely expressed in the nervous system, heart, lungs and
pancreas (4). Accumulating evidence
has demonstrated that Tbx3 is involved in the developmental
process by binding to the T-box motif with a 20–24 nucleotide
palindromic sequence, the T-site, or half of the sequence in the
promoters of target genes (5). A
mutation of Tbx3 was demonstrated to be closely associated
with the pluripotency of embryonic stem cells and the invasiveness
of cancer (6). In resectable
pancreatic carcinoma (7), melanoma
(8), bladder cancer (9) and colorectal cancer (10), Tbx3 was revealed to be
overexpressed and associated with poor prognosis of cancer.
Recently, Tbx3 was reported to serve a key role in melanoma
migration and invasion by acting as a key substrate of protein
kinase B and thus inducing the repression of E-cadherin (8). Additionally, Tbx3 is involved in
the anti-proliferative event mediated by the transforming growth
factor β1 signaling pathway by repressing the oncogenic Tbx2
in human breast epithelial MCF-12A cells (11).
The expression of Tbx3 in lung tissue under
normal physiological conditions has previously been established
(12). However, to the best of our
knowledge, the expression status of Tbx3 in patients with
NSCLC has not been investigated to date. In order to understand the
role of Tbx3 in cancer and to improve the poor prognosis of
NSCLC, further investigation into the expression status and
clinical significance of Tbx3 in NSCLC is required. The
present study evaluated Tbx3 expression at the messenger RNA
(mRNA) and protein levels in NSCLC tissue samples, and analyzed the
correlations between Tbx3 expression and various
clinicopathological parameters. Finally, the present study aimed to
explore the association between Tbx3 overexpression and the
prognosis of NSCLC.
Materials and methods
Patients and sample collections
A total of 86 patients with NSCLC (46 males and 40
females) were enrolled in the present study. All patients underwent
treatment at the People's Hospital of Dongyang City (Dongyang,
China) between August 2007 and October 2010. The stage of cancer of
patients was classified according to the tumor-node-metastasis
(TNM) staging system. The tumor tissues and matched adjacent normal
tissues were frozen in liquid nitrogen following surgical resection
and preserved at −80°C prior to use. Clinicopathological data were
collected, including age, gender, tumor size, tobacco smoking
status, alcohol drinking status, TNM stage and differentiation.
Patients characteristics are summarized in Table I. The present study was approved by
the ethics committee of The People's Hospital of Dongyang City.
Written informed consent was obtained from all patients prior to
enrollment in the present study.
 | Table I.Correlation of Tbx3 expression
level with the clinicopathological features of patients with
non-small cell lung cancer. |
Table I.
Correlation of Tbx3 expression
level with the clinicopathological features of patients with
non-small cell lung cancer.
|
|
| Tbx3
expression level |
|
|---|
|
|
|
|
|
|---|
| Variable | Cases, n | High | Low | P-value |
|---|
| Gender |
|
Male | 46 | 30 | 16 | 0.116 |
|
Female | 40 | 31 | 9 |
|
| Age, years |
|
≥50 | 51 | 33 | 18 | 0.146 |
|
<50 | 35 | 28 | 7 |
|
| Tumor size, cm |
| ≥5 | 45 | 32 | 13 | 0.035 |
|
<5 | 41 | 29 | 12 |
|
| Tobacco smoking
status |
|
Non-smoker | 38 | 28 | 10 | 0.036 |
|
Smoker | 48 | 33 | 15 |
|
| Alcohol drinking
status |
|
Non-drinker | 49 | 33 | 16 | 0.062 |
|
Drinker | 37 | 28 | 9 |
|
|
Differentiation |
|
Poor | 46 | 32 | 14 | 0.014 |
|
Well/moderate | 40 | 29 | 11 |
|
| Tumor stage |
|
I–II | 42 | 30 | 12 | 0.002 |
|
III–IV | 44 | 31 | 13 |
|
Cell lines and cell culture
The A549 and NCI-H460 human NSCLC cell lines were
obtained from the American Type Culture Collection (ATCC; Manassas,
VA, USA). For cell culture, Dulbecco's modified Eagle's medium
supplemented with 10% fetal bovine serum (Gibco; Thermo Fisher
Scientific, Inc., Waltham, MA, USA), 100 U/ml penicillin and 100
U/ml streptomycin were used, and a 100% humidified atmosphere was
maintained (37°C, 5% CO2).
Tbx3 depletion in A549 and NCI-H460
cells
The sequences of Tbx3-specific short hairpin
RNA (shRNA) and control shRNA were described in a previous study
(13) and obtained from Invitrogen
(Thermo Fisher, Scientific, Inc.). A549 and NCI-H460 cell lines
stably expressing Tbx3 shRNA were synthesized by retroviral
transduction of the pSUPER.Retro.Puro (Addgene, Inc., Cambridge,
MA, USA) vector encoding shRNA against Tbx3, followed by
selection in 1 µg/ml puromycin.
Cell proliferation assay
The MTT assay was performed to evaluate the level of
cell proliferation. Following transfection, cells with
Tbx3-specific shRNA or control shRNA were seeded in 96-well
plates at a density of 4,000 cells/well and incubated under the
aforementioned conditions (37°C, 5% CO2). Following 12,
24, 48 and 72 h culture, 20 µl of 5 mg/ml MTT (Sigma-Aldrich; Merck
KGaA, Darmstadt, Germany) was added to each well. The plates were
incubated for a further 4 h under the same conditions (37°C, 5%
CO2), and subsequently 150 µl of dimethylsulfoxide was
added until the purple formazan was completely dissolved. The
absorbance of each well was determined using the
Multiskan® Spectrum (Thermo Fisher Scientific, Inc.) at
a wavelength of 490 nm. Each independent experiment was performed
three times.
Total RNA extraction and reverse
transcription-quantitative polymerase chain reaction (RT-qPCR)
analysis
Total RNA was extracted from the transfected cells,
tumor tissues and matched normal tissues using an RNeasy Mini kit
(Qiagen GmbH, Hilden, Germany), according to the manufacturer's
protocol, and first-strand complementary DNA was synthesized from 5
ng total RNA using the QuantiTect Reverse Transcription kit (Qiagen
GmbH).
The expression level of Tbx3 in transfected
cells, tumor tissues and normal tissues was quantified using
SYBR®-Green PCR Master Mix (Applied Biosystems; Thermo
Fisher Scientific, Inc.). RT-qPCR was performed using an ABI-7500
Real-Time PCR system (Applied Biosystems; Thermo Fisher Scientific,
Inc.) and analyzed using ABI SDS software (version 2.0.6; Applied
Biosystems; Thermo Fisher Scientific, Inc.). The primers used for
RT-qPCR were synthesized by Invitrogen (Thermo Fisher Scientific,
Inc.) and listed as follows: Human Tbx3 sense
5′-CCCGAAGAAGACGTAGAAGATGAC-3′ and antisense
5′-CCCGAAGAAGAGGTGGAGGACGAC-3′; human β-actin (ACTB) sense
5′-CCTCCATCGTCCACCGCAAATG-3′ and antisense
5′-TGCTGTCACCTTCACCGTTCCA-3′. The following optimized cycling
conditions were used: 95°C for 10 min, followed by 40 cycles at
95°C for 15 sec and 55°C for 15 sec. Each sample was analyzed in
triplicate and the mean value was determined. The expression level
of Tbx3 was normalized to the endogenous control,
ACTB. The relative expression level of Tbx3 was
evaluated using the 2−ΔΔCq method (14).
Western blot analysis
Western blotting was performed to assess the
expression level of Tbx3 in transfected cells, tumor tissues
and normal tissues. Protein concentration was determined using the
standard Bradford assay kit (cat. no. P0006; Beyotime Institute of
Biotechnology, Haimen, China). Equal amount of total protein was
loaded onto a 10% SDS-PAGE gel and blotted onto a nitrocellulose
membrane in a humid environment. The membrane was blocked with 5%
milk in TBS containing 0.05% Tween 20 (TBST) and incubated with
anti-Tbx3 antibody (dilution, 1:2,000; cat no. ab89220;
Abcam, Cambridge, UK) at room temperature for 1 h. The anti-β-actin
antibody (dilution, 1:2,000; cat. no. ab6276; Abcam) was used as
the internal control and incubated at room temperature for 1 h.
Subsequently, the membrane was washed three times with TBST and
incubated with a secondary anti-rabbit immunoglobulin G antibody
conjugated to horseradish peroxidase (dilution, 1:5,000; cat. no.
SC-2054; Santa Cruz Biotechnology, Inc., Dallas, TX, USA) at room
temperature for 1 h. Blots were developed using the enhanced
chemiluminescence method, according to the manufacturer's protocol
(Pierce; Thermo Fisher Scientific, Inc.). Autoradiography signals
were analyzed using an ImageQuant RT ECL gel imaging system (GE
Healthcare Bio-Sciences, Pittsburgh, PA, USA). The gray-scale ratio
of Tbx3 to β-actin in each sample was considered as the
relative protein expression level. Patients who exhibited Tbx3
expression levels in tumor tissues that was higher compared with
adjacent noncancerous tissues were classified into the high Tbx3
expression group. Patients with a lower Tbx3 expression level in
tumor tissues compared with the adjacent noncancerous tissues were
classified into low Tbx3 expression group.
Flow cytometry for cell cycle
assessment
Following transfection of Tbx3-specific shRNA
or control shRNA, the A549 and NCI-H460 cells were collected by
trypsinization (Sigma-Aldrich; Merck KGaA), washed with PBS and
fixed with 70% cold ethanol overnight at −20°C. The
ethanol-suspended cells were then collected, washed and stained
with propidium iodide (PI) staining buffer (5 µg/ml PI and 0.25
µg/ml RNase) for 30 min in the dark at room temperature. Finally,
cell cycle analysis was performed by evaluating the DNA content of
control shRNA and Tbx3-specific shRNA-transfected NSCLC cell lines
using a FACSCalibur™ flow cytometer (BD Biosciences, Franklin
Lakes, NJ, USA), according to the manufacturer's protocol. The
results were analyzed using the ModFit LT software (version 3.2;
Verity Software House, Inc., Topsham, ME, USA).
Cell migration assay
Cell migration in culture was determined using a
two-dimensional in vitro scratch motility assay, as
previously described (15). The A549
and NCI-H460 cell lines transfected with control shRNA or
Tbx3-specific shRNA were seeded at 2×10⁶ cells/well in
6-well plates. A linear wound was made by scratching cells with the
tip of a p1000 pipette (Axygen; Corning Life Sciences, Tewksbury,
MA, USA). To prevent cell proliferation, mitomycin C
(Sigma-Aldrich; Merck KGaA) was added at a final concentration of
10 µg/ml. Cells were incubated at 37°C in 5% CO2. The
wound widths were measured at the time of the scratching (0 h) and
at various time points (2, 4 and 6 h). Images were captured using a
BX53 microscope (Olympus Corporation, Tokyo, Japan), and migration
distances were measured using AxioVision software version 4.8
(Zeiss GmbH, Jena, Germany). The difference in width represents the
distance migrated in µm.
Statistical analysis
All the data collected in the present study were
analyzed using SPSS software (version 20.0; IBM SPSS, Armonk, NY,
USA). Data are expressed as the mean ± standard deviation.
Differences between groups were determined by the χ2
test. The Kaplan-Meier log-rank test was used for survival
analysis, whereas prognostic factors were examined by univariate
and multivariate analyses (Cox's regression test). P<0.05 was
considered to indicate a statistically significant difference.
Results
Tbx3 is highly expressed in NSCLC
tissues
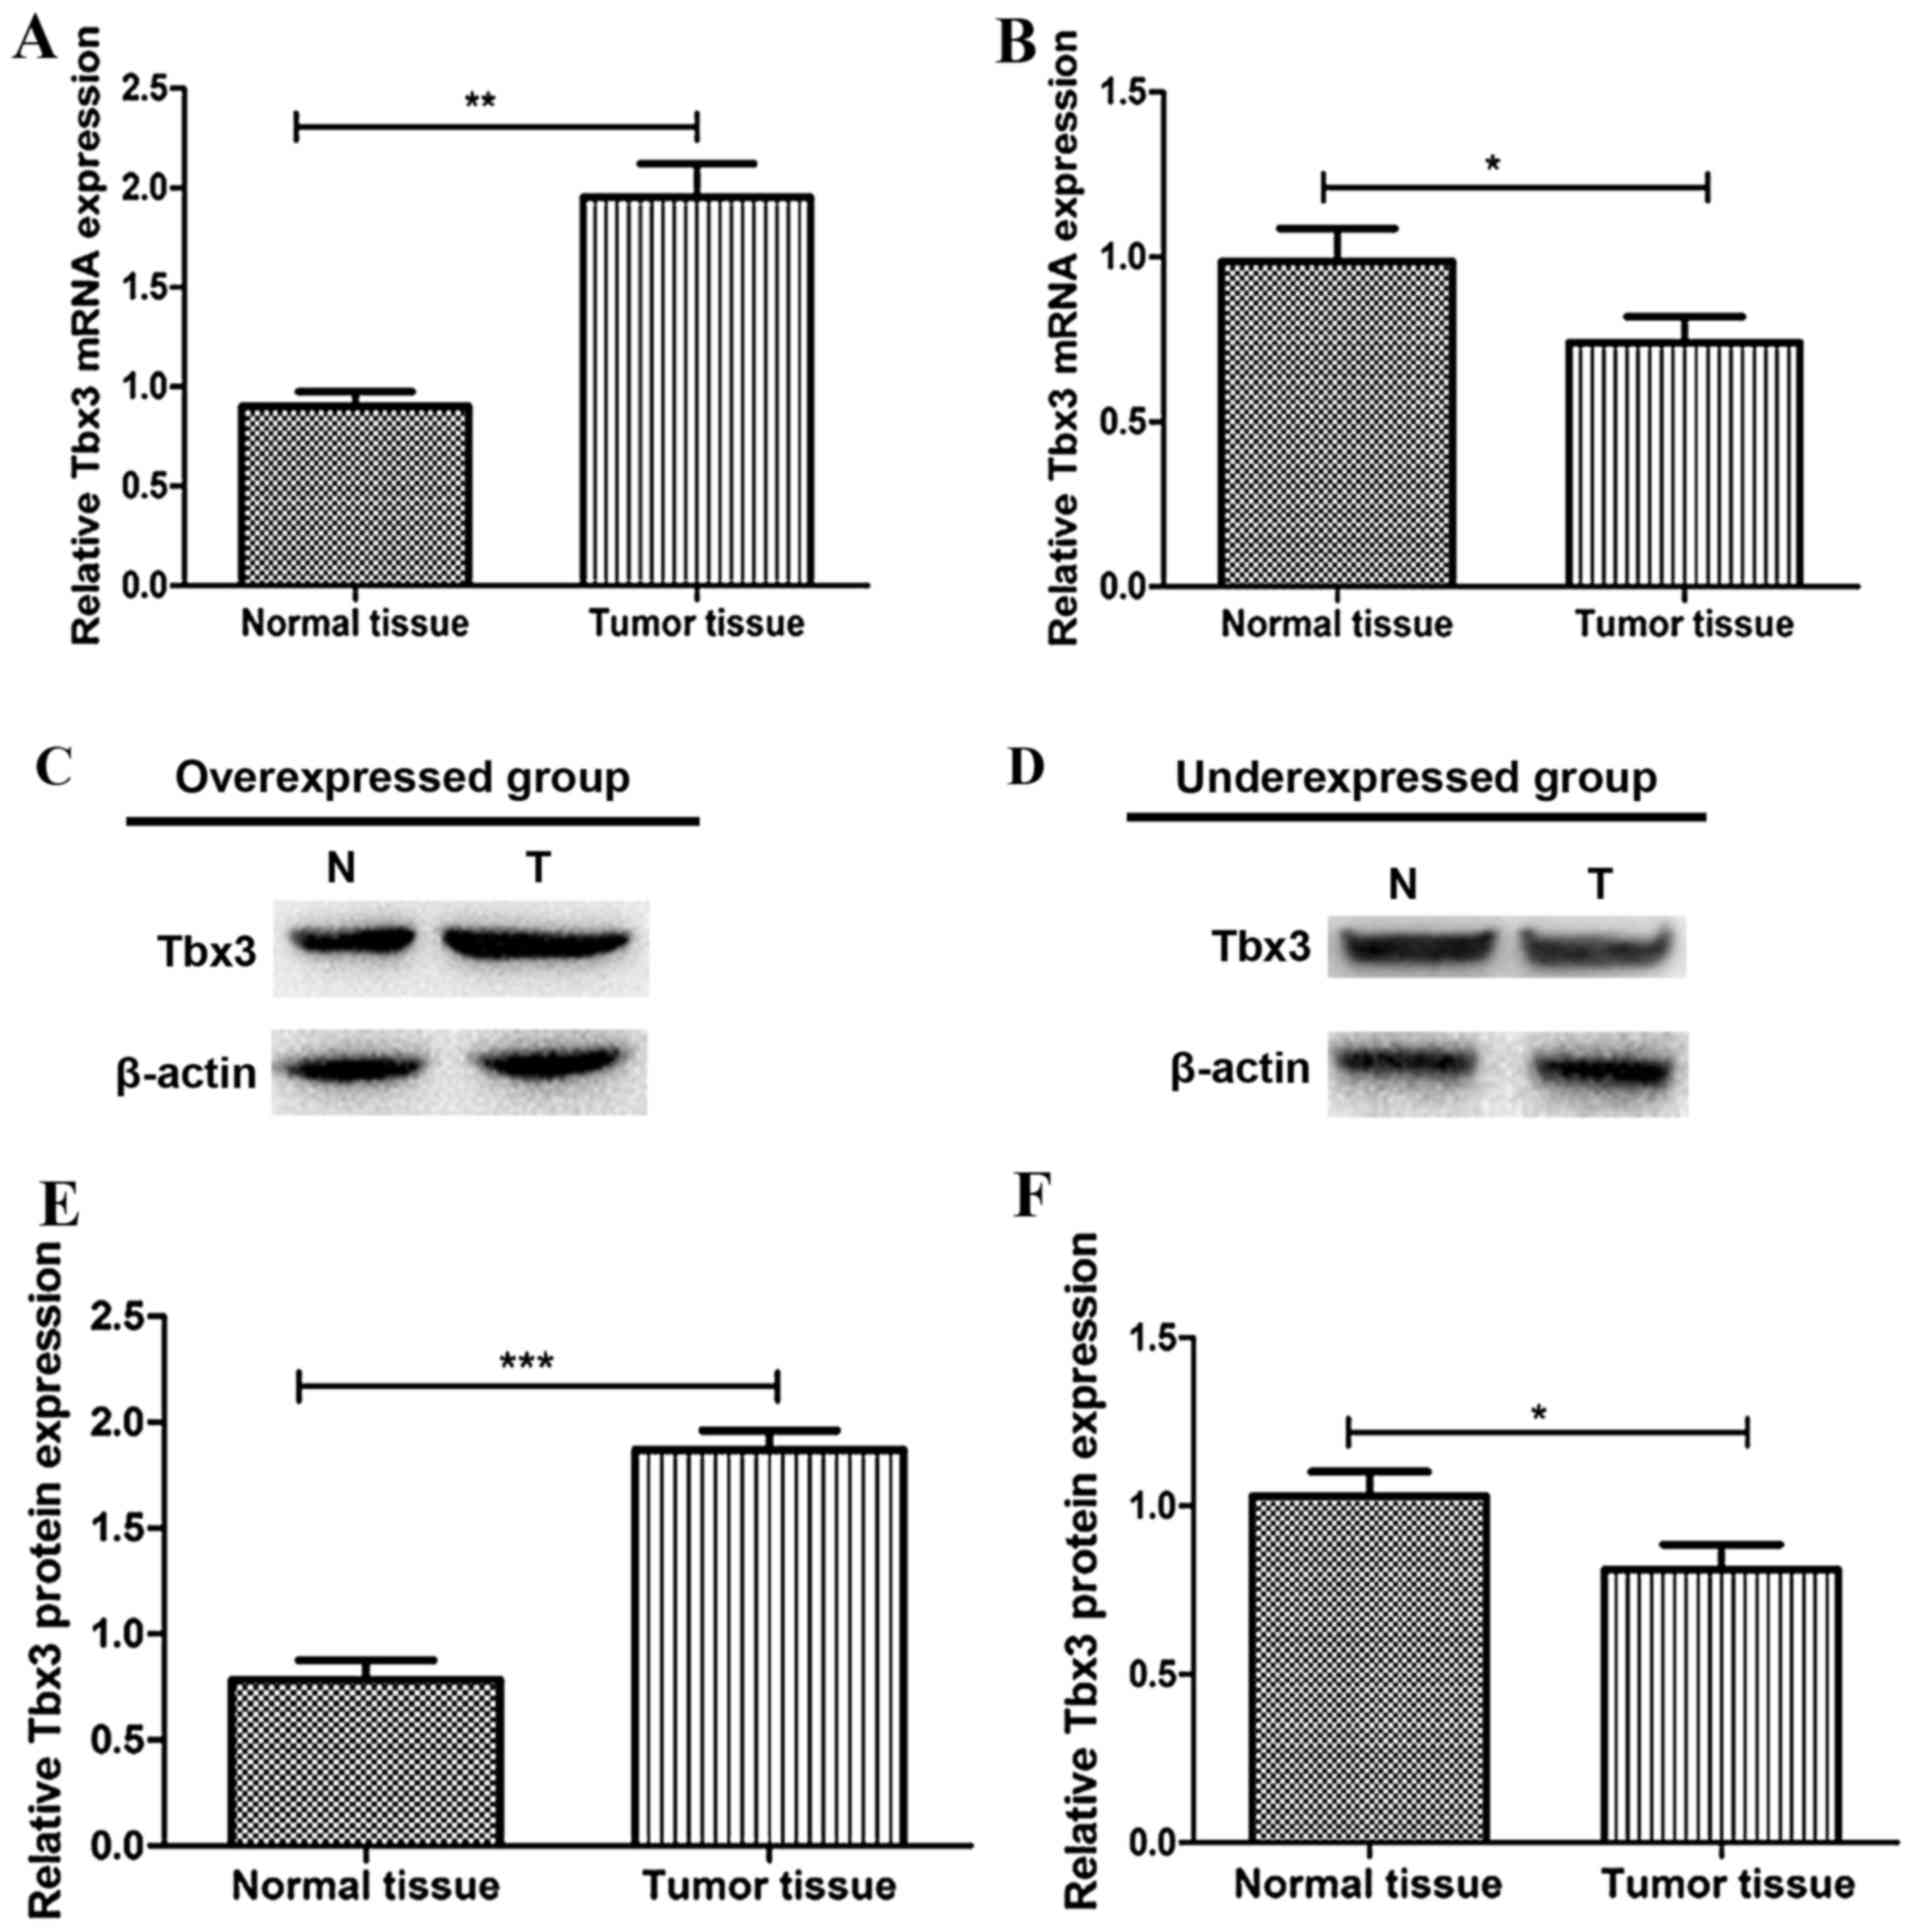
In order to evaluate the expression level of
Tbx3 in NCLC tissues, RT-qPCR and western blot analysis were
performed to quantify the Tbx3 expression levels. As
presented in Fig. 1A and B, the mRNA
expression level of Tbx3 in normal or tumor tissues was
determined. The present study demonstrated that 61/86 patients with
NSCLC (70.9%) displayed a significantly higher Tbx3 gene
expression level in tumor tissues compared with that in adjacent
normal tissues (overexpressed group); thus, in the majority of
cases, Tbx3 was overexpressed in patients with NSCLC. The
remaining 25 cases displayed lower Tbx3 gene expression
level in tumor tissues compared with those in normal tissues
(underexpressed group). Furthermore, the results of the western
blot analysis verified the conclusions drawn from RT-qPCR. The
protein level of Tbx3 in the overexpressed group was
significantly higher in tumor tissues compared with that in normal
tissues (P<0.001, Fig. 1C and E).
Additionally, the expression level of Tbx3 was lower in
tumor tissues compared with that in the normal tissues of the
underexpressed group (P<0.05; Fig. 1D
and F).
Tbx3 overexpression promotes cell
proliferation
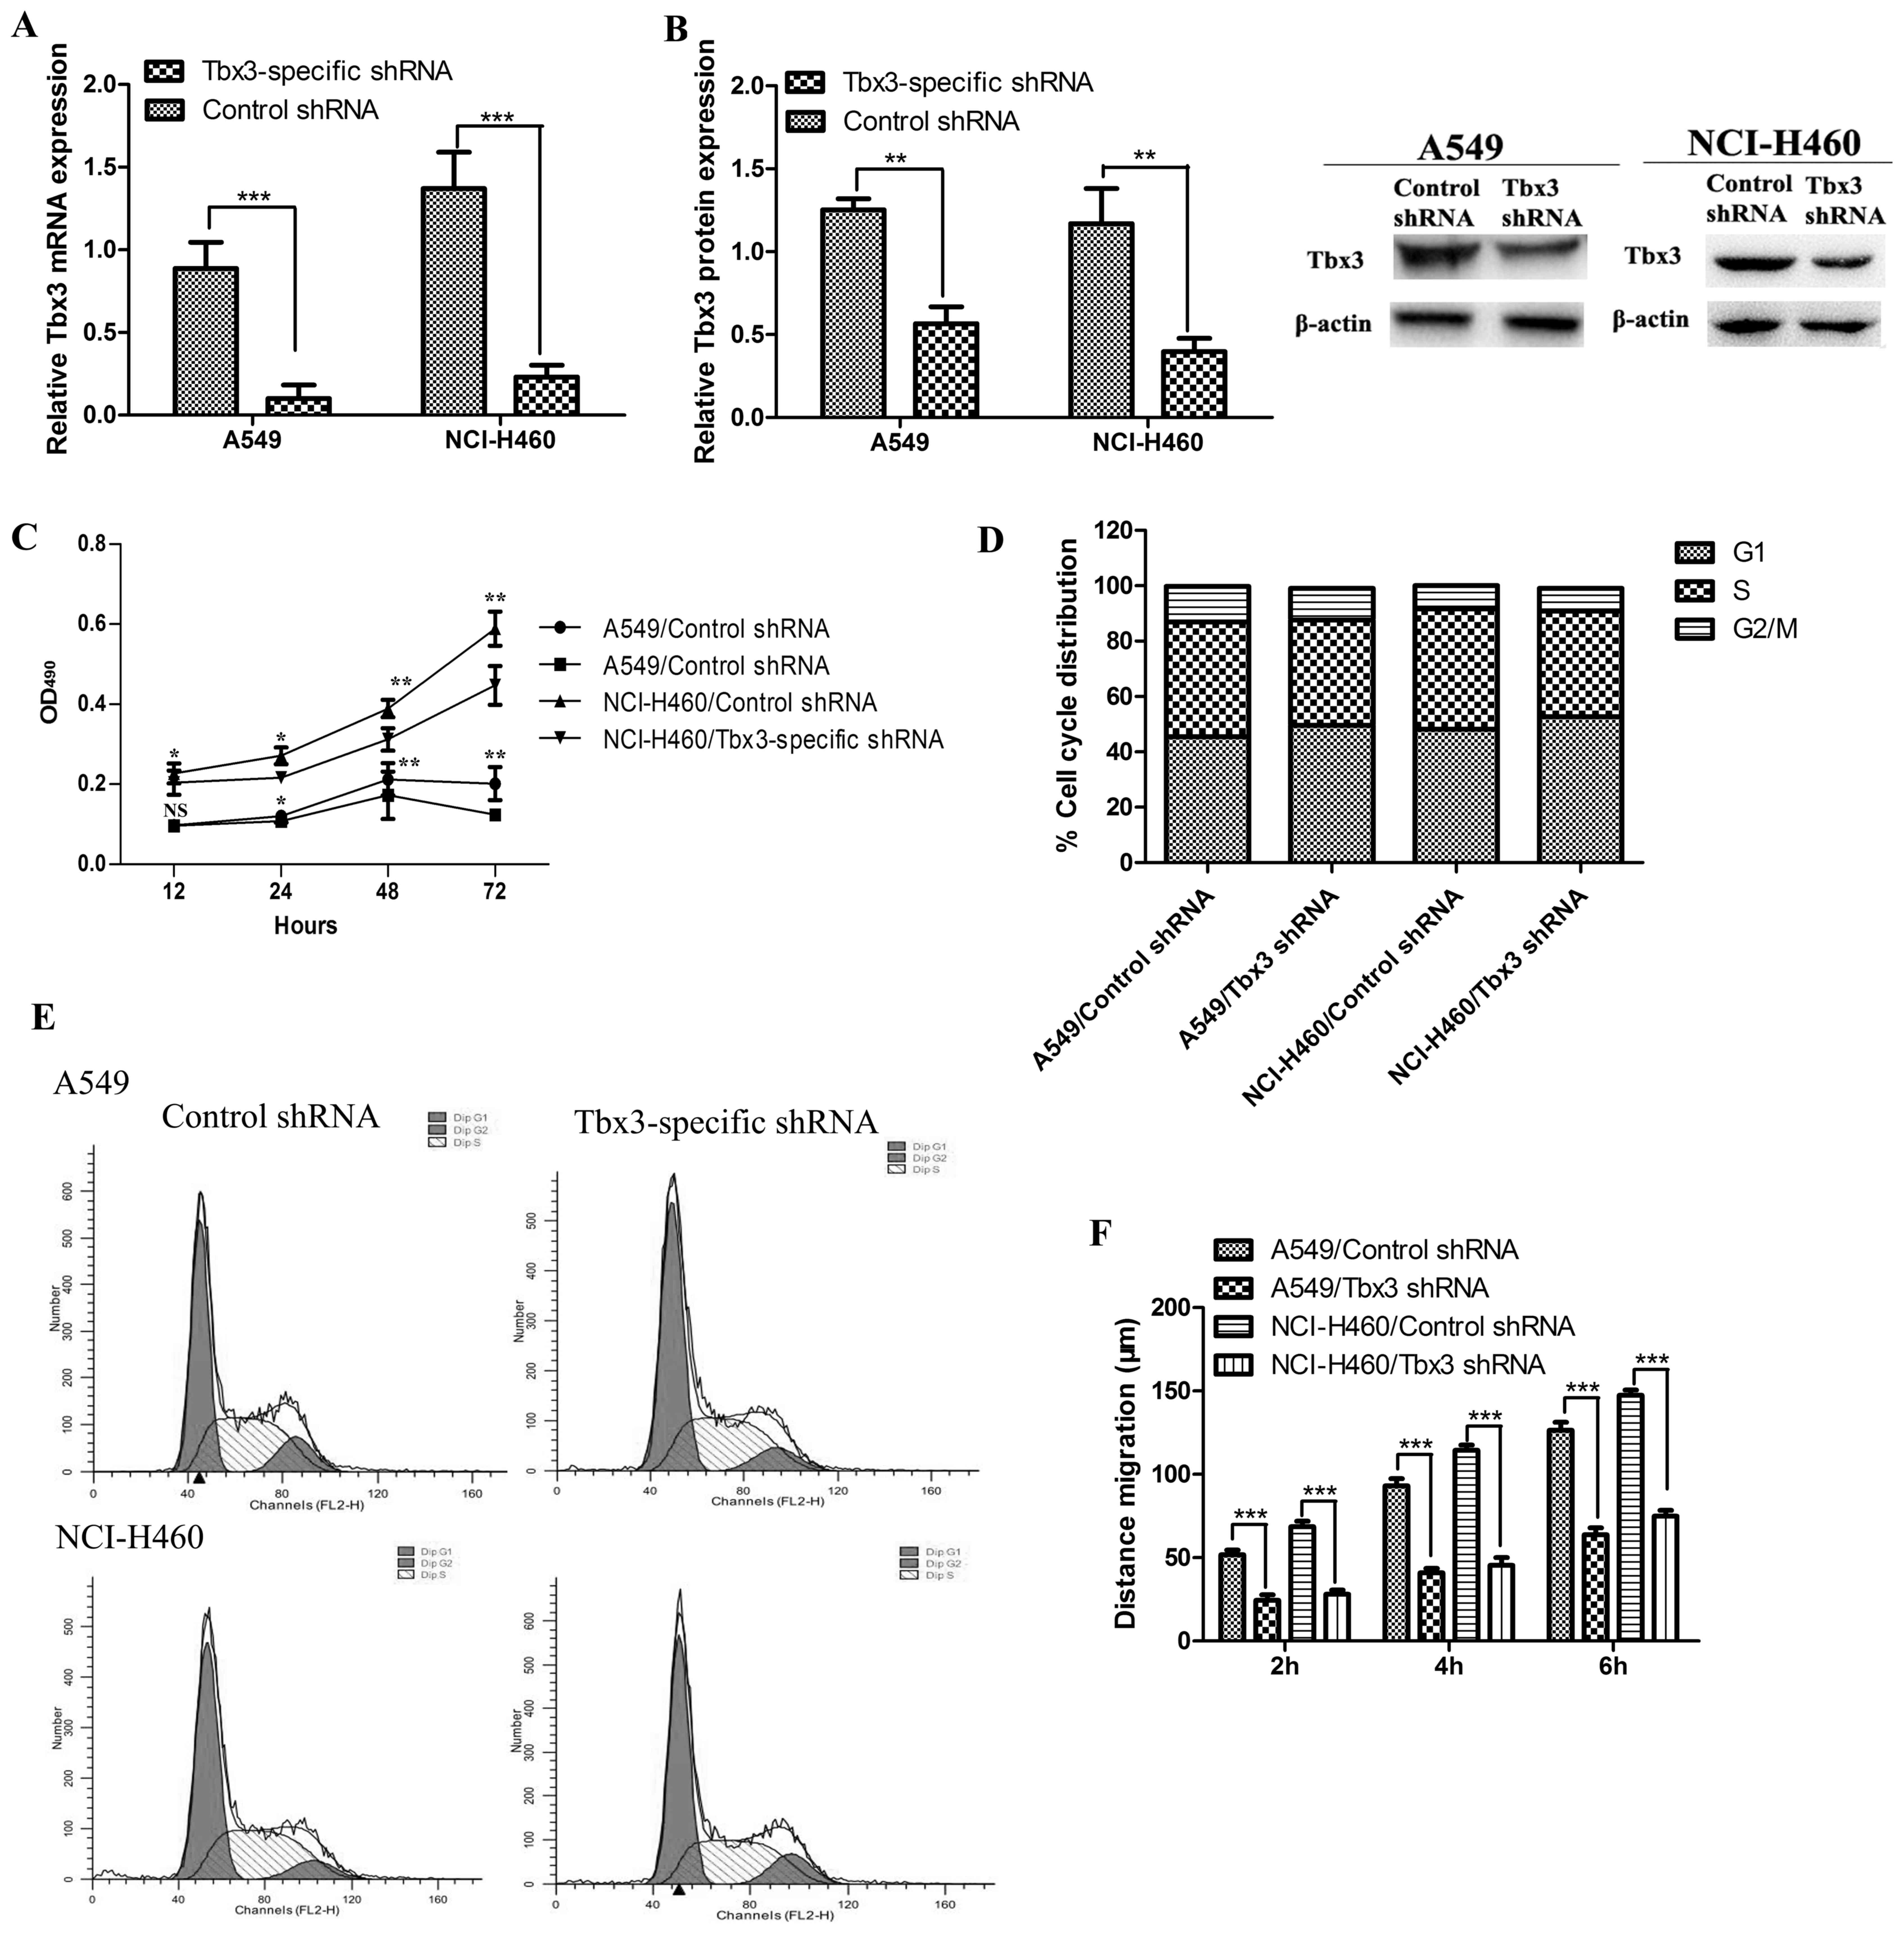
To evaluate the role of Tbx3 in the process
of tumorigenesis, Tbx3-specific shRNA was introduced to the
A549 and NCI-H460 NSCLC cell lines with the aim of downregulating
the expression level of Tbx3. The gene expression level of
Tbx3 in transfected cells was determined by RT-qPCR. As
demonstrated in Fig. 2A, the mRNA
expression level of Tbx3 in A549 and NCI-H460 cells
transfected with Tbx3-specific shRNA was significantly
decreased (P<0.05) compared with that in the control
shRNA-transfected cells. Western blot analysis confirmed that the
level of Tbx3 was significantly downregulated with the
transfection of Tbx3-specific shRNA (P<0.05; Fig. 2B). These results indicated that the
knockdown of Tbx3 significantly decreased the mRNA and
protein expression levels of Tbx3, which suggested the
highly regulated control of Tbx3-specific shRNA
(P<0.05).
Furthermore, the role of Tbx3 in cell
proliferation was assessed by MTT assay. The results demonstrated
that the optical densities of A549 or NCI-H460 cells transfected
with Tbx3-specific shRNA were significantly lower compared
with those of the A549 or NCI-H460 cells with the control shRNA
(P<0.05; Fig. 2C), which indicated
that Tbx3 overexpression may promote cell proliferation.
Downregulation of Tbx3 affects the
distribution of cell cycle proportion
It has been well established that Tbx3
participates in the regulation of the cell cycle (16). In order to investigate the role of
Tbx3 in regulating the cell cycle, flow cytometry was
performed to determine whether Tbx3 overexpression affects
the cell cycle of A549 and NCI-H460 cells. The results (Fig. 2D and E) indicated that the
Tbx3-specific shRNA-transfected cells displayed a slight
increase in cell population in the G1 growth phase,
whereas the proliferation of cells in the S and G2/M
phases were decreased compared with those of the control cells. The
aforementioned results suggested that the expression level of
Tbx3 may affect the cell cycle distribution and lead to the
change in cell proliferation.
Tbx3 overexpression promotes cell
migration
Investigating the clinicopathological function of
Tbx3 is crucial for understanding tumorigenesis. The effect
of Tbx3 overexpression on cell migration required further
study. Therefore, the present study analyzed the mobility of cells
transfected with Tbx3-specific shRNA or control shRNA by
performing a two-dimensional scratch assay. As presented in
Fig. 2F, the migration distance of
cells transfected with Tbx3-specific shRNA was significantly
lower (P<0.05) than that of the control shRNA-transfected group
at all the selected time points (2, 4 and 6 h). The results
presented (Fig. 2F) confirmed that
Tbx3 overexpression promoted cell migration in A549 and
NCI-H460 cells.
Clinical significance of Tbx3
overexpression in NSCLC
The clinical significance of Tbx3
overexpression in colorectal cancer (10) and pancreatic carcinoma (7) has been revealed in previous studies.
Therefore, the clinical significance of Tbx3 expression in
NSCLC patients was analyzed in the present study by evaluating the
correlation of Tbx3 expression with clinicopathological
characteristics. It was demonstrated that Tbx3 expression
was significantly associated with tumor size (P=0.035), tobacco
smoking status (P=0.036), TNM stage (P=0.002) and differentiation
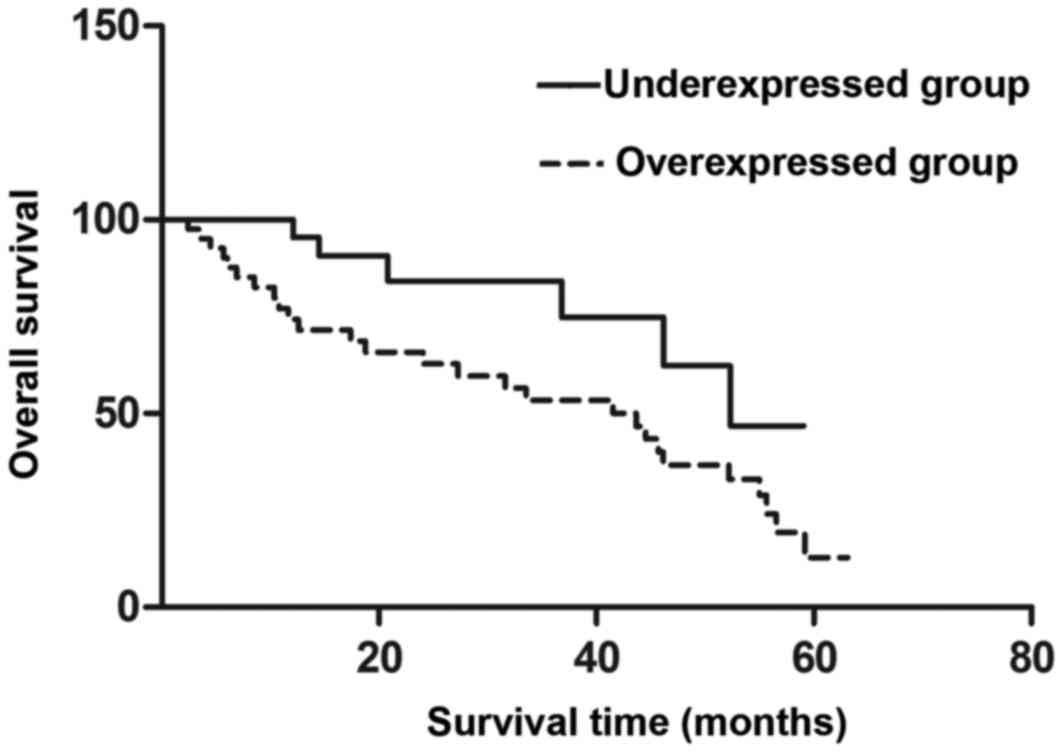
(P=0.014) (Table I). In addition, the
5-year overall survival rates were 13.14 and 49.56% in the
overexpressed and underexpressed groups, respectively. Notably, the
survival rates of these two groups were significantly different
(P=0.046); thus, the patients with high Tbx3 expression
levels had decreased 5-year survival rates compared with those with
low Tbx3 expression (Fig.
3).
Tbx3 overexpression is associated with
the poor prognosis of NSCLC
The association between Tbx3 expression and
prognosis in patients with NSCLC was evaluated by univariate and
multivariate analyses. Multivariate analysis using Cox's
proportional hazards model was performed to analyze whether one
factor can be considered as an independent factor for the prognosis
of NSCLC patients, focusing on the factors that significantly
affect the survival rate of patients with NSCLC obtained from
univariate analysis. From the univariate and multivariate analysis
results, the same conclusions could be drawn: Tumor
differentiation, tumor size, tobacco smoking status, tumor stage
and Tbx3 expression level were identified as independent
prognosis factors for patients with NSCLC (Table II).
| Table II.Univariate and multivariate analyses
of overall survival rate. |
Table II.
Univariate and multivariate analyses
of overall survival rate.
|
| Univariate
analysis |
| Multivariate
analysis |
|
|---|
|
|
|
|
|
|
|---|
| Variables | HR | 95% CI | P-value | HR | 95% CI | P-value |
|---|
| Tbx3 | 2.131 | 1.022–4.022 | 0.018 | 2.252 | 1.052–4.052 | 0.026 |
| Age | 0.908 | 0.418–1.418 | 0.507 | 0.913 | 0.421–1.421 | 0.514 |
| Gender | 1.003 | 0.456–2.456 | 0.391 | 0.997 | 0.453–2.453 | 0.373 |
| Tumor size | 2.242 | 1.039–4.039 | 0.030 | 1.917 | 0.931–3.931 | 0.034 |
| Tobacco smoking
status | 2.260 | 1.057–4.057 | 0.029 | 2.229 | 1.026–4.026 | 0.031 |
| Alcohol drinking
status | 1.510 | 0.741–3.741 | 0.164 | 1.588 | 0.761–3.761 | 0.108 |
|
Differentiation | 2.311 | 1.094–4.094 | 0.026 | 2.015 | 1.066–4.066 | 0.028 |
| Tumor stage | 2.553 | 1.177–5.177 | 0.014 | 2.367 | 1.135–4.135 | 0.016 |
Discussion
Each year, ~1.2 million novel NSCLC cases are
diagnosed worldwide (2). Despite
progress being made in the development of therapeutic strategies
for NSCLC (17–19), the 5-year overall survival rate
remains low (10–15%) (3). One reason
for this is the high frequency of tumor metastasis in patients with
NSCLC (20). Metastasis is widely
accepted as one of the most decisive factors influencing the
prognosis of patients with cancer (21). Therefore, it is imperative to identify
effective predictive factors for the diagnosis and treatment of
NSCLC. As a member of the Tbx2 subfamily, Tbx3 has
been confirmed to be implicated in a number of human diseases,
particularly cancer (6–8,10). The
overexpression of Tbx3 is present in several cancer
subtypes, including colorectal cancer and pancreatic carcinoma
(7,10). More importantly, the poor prognosis of
cancer is also associated with the overexpression of Tbx3
(7,10). Previous studies have established that
Tbx3 serves an important role in the regulation of cell
proliferation, cell cycle, cell apoptosis and cell migration in
tumor cells (7,8,10).
The expression of Tbx3 in lung tissues has
previously been demonstrated (12);
however, the role of Tbx3 in the pathogenesis of NSCLC
requires further investigation. To the best of our knowledge, the
present study evaluated the expression level of Tbx3 in
NSCLC and its association with the clinicopathological
characteristics of patients with NSCLC for the first time.
Tbx3 was revealed to be overexpressed in NSCLC tissues
compared with that in adjacent normal tissues by RT-qPCR and
western blot analysis. Furthermore, the overexpression of
Tbx3 is closely associated with TNM stage, differentiation
and recurrence of cancer in patients with NSCLC. As a result, the
present study demonstrated that patients with Tbx3
overexpression had a shorter 5-year survival rate compared with
that of patients with underexpression of Tbx3. Additionally,
the present study identified that Tbx3 overexpression was an
independent prognostic biomarker for the prediction of prognosis
for patients with NSCLC. Based on these findings, the present study
further investigated the mechanisms underlying Tbx3 in
tumorigenesis. Firstly, the shRNA transfection strategy was used to
downregulate the expression level of Tbx3. RT-qPCR was
performed to estimate the relative transcriptional level of
Tbx3, and this indicated that the mRNA level of Tbx3
was significantly decreased following the Tbx3-specific
shRNA transfection. Furthermore, the effect of Tbx3
expression on cell proliferation was analyzed by comparing the
Tbx3-specific shRNA-transfected and control
shRNA-transfected cells. The results demonstrated that Tbx3
overexpression promoted cell proliferation. In order to determine
whether cell proliferation is affected by cell cycle progression,
flow cytometry was performed to analyze the cell population in
various phases of the cell cycle. It was demonstrated that the
G1 phase was upregulated, whereas the S and
G2/M phases were downregulated in the
Tbx3-specific shRNA-transfected group compared with the
findings in the control shRNA-transfected group. These results
indicated that Tbx3 overexpression may promote cell
proliferation. Furthermore, the cell migration distance of
Tbx3-specific shRNA-transfected cells and control
shRNA-transfected cells was evaluated, and the results suggested
that Tbx3 overexpression may promote cell migration. This
indicated that Tbx3 overexpression serves an important role
in tumorigenesis via cell proliferation and cell migration
promotion.
In conclusion, the present study demonstrated for
the first time that Tbx3 is associated with the progression
of NSCLC and may act as an independent prognostic biomarker for
patients with NSCLC. Furthermore, the preliminary mechanism of
Tbx3 in tumorigenesis was also discussed. Taken together,
the results of the present study and previous findings (7,8,10) associated with the role Tbx3 in
cancer suggested that Tbx3 may potentially be an effective
therapeutic target and prognostic predictor for patients with
NSCLC.
References
|
1
|
Li YX, Chen YJ, Chang LJ, Hendryx M and
Luo JH: Clinical biomarkers and prognosis in Taiwanese patients
with Non-small cell lung cancer (NSCLC). J Cancer Ther. 3:412–423.
2012. View Article : Google Scholar
|
|
2
|
Hecht SS: Tobacco smoke carcinogens and
lung cancer. J Natl Cancer Inst. 91:1194–1210. 1999. View Article : Google Scholar : PubMed/NCBI
|
|
3
|
Siegel R, Naishadham D and Jemal A: Cancer
statistics, 2012. CA Cancer J Clin. 62:10–29. 2012. View Article : Google Scholar : PubMed/NCBI
|
|
4
|
Zhao ZQ, Tian W, Wang L, Wang H, Qin X,
Xing Q, Pang S and Yan B: Genetic and functional analysis of the
TBX3 gene promoter in indirect inguinal hernia. Gene. 554:101–104.
2015. View Article : Google Scholar : PubMed/NCBI
|
|
5
|
Takashima Y and Suzuki A: Regulation of
organogenesis and stem cell properties by T-box transcription
factors. Cell Mol Life Sci. 70:3929–3945. 2013. View Article : Google Scholar : PubMed/NCBI
|
|
6
|
Chan YS, Göke J, Ng JH, Lu X, Gonzales KA,
Tan CP, Tng WQ, Hong ZZ, Lim YS and Ng HH: Induction of a human
pluripotent state with distinct regulatory circuitry that resembles
preimplantation epiblast. Cell Stem Cell. 13:663–675. 2013.
View Article : Google Scholar : PubMed/NCBI
|
|
7
|
Wang HC, Meng QC, Shan ZZ, Yuan Z and
Huang XY: Overexpression of Tbx3 predicts poor prognosis of
patients with resectable pancreatic carcinoma. Asian Pac J Cancer
Prev. 16:1397–1401. 2015. View Article : Google Scholar : PubMed/NCBI
|
|
8
|
Peres J, Mowla S and Prince S: The T-box
transcription factor, Tbx3, is a key substrate of AKT3 in
melanomagenesis. Oncotarget. 6:1821–1833. 2014. View Article : Google Scholar
|
|
9
|
Du HF, Ou LP, Yang X, Song XD, Fan YR, Tan
B, Luo CL and Wu XH: A new PKCα/β/TBX3/E-cadherin pathway is
involved in PLCε-regulated invasion and migration in human bladder
cancer cells. Cell Signal. 26:580–593. 2014. View Article : Google Scholar : PubMed/NCBI
|
|
10
|
Shan ZZ, Yan XB, Yan LL, Tian Y, Meng QC,
Qiu WW, Zhang Z and Jin ZM: Overexpression of Tbx3 is correlated
with epithelial-mesenchymal transition phenotype and predicts poor
prognosis of colorectal cancer. Am J Cancer Res. 5:344–353.
2015.PubMed/NCBI
|
|
11
|
Li J, Ballim D, Rodriguez M, Cui R, Goding
CR, Teng H and Prince S: The anti-proliferative function of the
TGF-β1 signaling pathway involves the repression of the oncogenic
Tbx2 by its homologue Tbx3. J Biol Chem. 289:35633–35643. 2014.
View Article : Google Scholar : PubMed/NCBI
|
|
12
|
Washkowitz AJ, Gavrilov S, Begum S and
Papaioannou VE: Diverse functional networks of Tbx3 in development
and disease. Wiley Interdiscip Rev Syst Biol Med. 4:273–283. 2012.
View Article : Google Scholar : PubMed/NCBI
|
|
13
|
Rattenbacher B, Beisang D, Wiesner DL,
Jeschke JC, von Hohenberg M, St Louis-Vlasova IA and Bohjanen PR:
Analysis of CUGBP1 targets identifies GU-repeat sequences that
mediate rapid mRNA decay. Mol Cell Biol. 30:3970–3980. 2010.
View Article : Google Scholar : PubMed/NCBI
|
|
14
|
Livak KJ and Schmittgen TD: Analysis of
relative gene expression data using real-time quantitative PCR and
the 2(−Delta Delta C(T)) method. Methods. 25:402–408. 2001.
View Article : Google Scholar : PubMed/NCBI
|
|
15
|
Peres J, Davis E, Mowla S, Bennett DC, Li
JA, Wansleben S and Prince S: The highly homologous T-box
transcription factors, Tbx2 and Tbx3, have distinct roles in the
oncogenic process. Genes Cancer. 1:272–282. 2010. View Article : Google Scholar : PubMed/NCBI
|
|
16
|
Wensing LA and Campos AH: TBX3, a
downstream target of TGF-β1, inhibits mesangial cell apoptosis. Exp
Cell Res. 328:340–350. 2014. View Article : Google Scholar : PubMed/NCBI
|
|
17
|
Gao C, Yu Z, Liu S, Xin H and Li X:
Overexpression of CUGBP1 is associated with the progression of
non-small cell lung cancer. Tumor Biol. 36:4583–4589. 2015.
View Article : Google Scholar
|
|
18
|
Liu Y, Gao WM, Siegfried JM, Weissfeld JL,
Luketich JD and Keohavong P: Promoter methylation of RASSFIA and
DAPK and mutations of K-ras, p53, and EGFR in lung tumors from
smokers and never-smokers. BMC cancer. 7:742007. View Article : Google Scholar : PubMed/NCBI
|
|
19
|
Zhao S, Qiu ZX, Zhang L and Li W:
Prognostic values of ERK1/2 and p-ERK1/2 expressions for poor
survival in non-small cell lung cancer. Tumor Biol. 36:4143–4150.
2015. View Article : Google Scholar
|
|
20
|
Ohgami A, Mitsudomi T, Sugio K, Tsuda T,
Oyama T, Nishida K, Osaki T and Yasumoto K: Micrometastatic tumor
cells in the bone marrow of patients with non-small cell lung
cancer. Ann Thorac Surg. 64:363–367. 1997. View Article : Google Scholar : PubMed/NCBI
|
|
21
|
Pavese J, Odgen IM and Bergan RC: An
orthotopic murine model of human prostate cancer metastasis. J Vis
Exp. e50873:2013.
|