Introduction
Radiotherapy (RT) remains one of the most common
types of therapy used alone or in combination with other
therapeutics to treat cancer. In clinical practice, ~50% of all
cancer patients receive radiotherapy at some point during
treatment. Currently, to allow repair and recovery of
radiation-induced damage to normal tissue cells, radiotherapy is
administered in fractions of ~2 Gy every 24 h, 5 days/week for ≤7
weeks. However, the majority of the knowledge in the field of
radiobiology comes from single dose (SD) irradiation research
(1). Therefore, a detailed
investigation of the molecular processes mediating the cellular
response to fractionated dose (FD) irradiation is required to
improve the efficiency of radiotherapy.
There is an emerging body of knowledge on the
comprehensive molecular mechanisms underlying the cellular response
to FD irradiation and the mechanisms associated with resistance to
RT. Previous studies have shown that treatment with multiple
fractions of irradiation produces a different gene expression
signature in several cancer cell lines compared with SD irradiation
(2,3).
For instance, exposure to 10 Gy delivered as fractionated
irradiation results in increased changes in differential gene
expression in prostate cancer PC3 and DU145 cells (4). In addition, as demonstrated by gene
expression profiles, exposure to FD irradiation can induce a
significantly different microRNA (miRNA/miR) expression profile
compared with SD (5,6). miRNAs perform an important role in the
regulation of the expression of genes involved in the cellular
response to radiation-induced DNA damage (7). Previous studies have reported that the
modulation of miRNA expression levels in cancer cells can alter
their sensitivity to irradiation (8–10).
Therefore, the integration of gene and miRNA signatures of
radiosensitivity could lead to a reliable strategy for predicting
radiation-induced cellular responses. Furthermore, the silencing of
radiation-induced miRNAs could be implemented in direct antitumor
therapies to improve the response of tumor cells to RT.
Several previous studies using a gene expression
microarray approach indicated expression of a different set of
genes in several human cancer cell xenografts following exposure to
irradiation compared with cells irradiated in vitro,
suggesting that the tumor microenvironment may affect the outcome
of irradiation (2,11). The LLC1 cell line was established from
the lung of a C57BL mouse bearing a primary Lewis lung carcinoma
tumor. This cell line is highly tumorigenic and immunologically
compatible with the murine immune system, unlike widely used human
cancer cell xenograft models. Consequently, the LLC1 cell line is
primarily used in syngeneic animal models to evaluate the efficacy
of anticancer treatment in vivo (12). The present study analyzed global gene
and miRNA expression changes in LLC1 cells exposed to SD of 2 or 10
Gy irradiation and FD of 5×2 Gy irradiation.
Materials and methods
Cell culture and maintenance
The LLC1 mouse Lewis lung carcinoma cell line was
obtained from the American Type Culture Collection (Manassas, VA,
USA). Cells were cultured at 37°C in a humidified atmosphere
containing 5% CO2 with Dulbecco's modified Eagle's
medium (DMEM; Thermo Fisher Scientific, Inc., Waltham, MA, USA)
supplemented with 10% fetal bovine serum (Thermo Fisher Scientific,
Inc.), 2 mM L-glutamine (Thermo Fisher Scientific, Inc.), 100 U/ml
penicillin (Carl Roth GmbH Co., KG, Karlsruhe, Germany) and 0.1
mg/ml streptomycin (Carl Roth GmbH Co., KG).
Animals and tumor model
C57BL/6 female mice (Vilnius University, Vilnius,
Lithuania) were maintained at a constant temperature (22±1°C),
relative humidity (55±10%) and photoperiod (12 h light/dark cycle)
in the Open Access Centre at the National Cancer Institute of
Lithuania (Vilnius, Lithuania). All animal procedures were
performed in accordance with the guidelines established by State
Food and Veterinary Service Animal Care and Use Committee (Vilnius,
Lithuania) that approved the current study (approval no. 0190). Two
female mice at 10–12 weeks of age and 19–22 g body weight were
injected subcutaneously with Lewis lung carcinoma LLC1 cells
(1×10⁶ cells suspended in DMEM medium) into their right
groins. Animals were sedated with ketamine hydrochloride alone (0.1
mg/g body mass; ROTEXMEDICA GmbH, Trittau, Germany) by injection of
0.1–0.2 ml/animal solution in sterile normal saline (B. Braun
Melsungen AG, Melsungen, Germany) into the caudal thigh muscles and
sacrificed by cervical dislocation, and their tumors were excised,
homogenized and resuspended in normal saline 10 days following the
implantation. Mice in each experimental group containing 6 female
mice were injected with 0.2 ml of the obtained suspension into
their right groin. Tumors were allowed to reach a volume of 400–600
mm3 prior to irradiation. Tumor volumes were measured
with vernier calipers and calculated according to the following
formula: Tumor volume=(length × width × height of tumor) × π/6.
Cell and tumor irradiation
LLC1 cells and tumors were exposed to a SD of 2–10
Gy or a FD course of 2 Gy daily for ≤5 days using a Varian 6MV
Clinac 600 C/D linear accelerator X-ray system (Varian Medical
Systems, Inc., Palo Alto, CA, USA) at room temperature. The dose
rate was ~3 Gy/min. Prior to irradiation, animals were sedated with
ketamine hydrochloride alone (0.1 mg/g body mass) by injection of
0.1–0.2 ml/animal solution in sterile normal saline into the caudal
thigh muscles and placed in a customized harness that allowed the
groin to be exposed to irradiation, whereas the rest of the body
was shielded by lead. In all of the experiments separate controls
of non-irradiated mice tumors were used for SD or FD regimens.
Clonogenic survival assay
LLC1 cells were plated in 6-well plates 24 h prior
to irradiation (500–10,000 cells/well) and treated with SD of up to
10 Gy or FD of 2 Gy of ionizing radiation (IR) daily for ≤5 days.
In total, 8 days subsequent to irradiation LLC1 cell colonies
(>50 cells/colony) were stained with crystal violet and counted
manually. Clonogenic survival was evaluated as described previously
(13). The mean cell survival
fraction from 3 independent experiments was used to represent
survival at each irradiation dose.
Total RNA and miRNA extraction
Total RNA enriched with small noncoding RNAs was
isolated using the mirVana RNA isolation kit (Thermo Fisher
Scientific, Inc.) according to manufacturer's protocol. For total
RNA extraction, LLC1 cells were plated into 25 cm2 cell
culture flasks for RNA isolation (0.7×10⁶ or
0.1×10⁶ cells/flask for the SD and FD irradiation
regimens, respectively). Subsequently, ~1×10⁶ LLC1 cells
were harvested 4 h following SD (2 or 10 Gy) or FD (5×2 Gy)
irradiation and were used for total RNA extraction. Following the
same experimental design, untreated or irradiated animals were
sacrificed, tumors excised and 100 mg of mouse tumor tissue was
used for total RNA extraction. The quantity and quality of RNA were
measured using a NanoDrop 2000c Spectrophotometer (Thermo Fisher
Scientific, Inc.) and Agilent 2100 Bioanalyzer (Agilent
Technologies, Inc., Santa Clara, CA, USA).
Gene expression microarrays
RNA sample preparation, labeling and hybridization
were performed using the kits described below according to the
manufacturer's protocol. Briefly, 1 µg of total RNA was used for
cDNA synthesis and amplification using the MessageAmp aRNA
Amplification kit (Thermo Fisher Scientific, Inc.). Subsequently,
825 ng of cDNA was labeled with Cy3/Cy5 using the
Arcturus® Turbo Labeling™
Cy®3/Cy®5 kit (Thermo Fisher Scientific,
Inc.). The cDNA was then hybridized to the Mouse Whole Genome 4×44k
Oligonucleotide Microarray (Agilent Technologies, Inc.) using a HS
400 Hybridization station (Tecan Group, Ltd., Männedorf,
Switzerland). A total of 3 independent replicates for each sample
were run. Microarray slides were scanned using the LS Reloaded
laser scanner (Tecan Group Ltd.). Microarray image analysis and
data generated were analyzed using ImaGene software (version 9.0;
BioDiscovery, El Segundo, CA, USA) and GeneSpring GX software
(version 11.5; Agilent Technologies, Inc.). Raw extracted gene
expression data were normalized through Loess regression analysis
to account for variation. Genes that exhibited a significant
(P<0.05) fold-change in expression of >1.5 were defined as
differentially expressed in LLC1 cells between the untreated and
irradiated groups. The microarray design and data are available
from the Gene Expression Omnibus (GEO) database (accession no.
GSE84108; ncbi.nlm.nih.gov/geo) (14).
miRNA expression microarrays
miRNA labeling was performed using the miRNA
Complete Labeling and Hyb kit (Agilent Technologies, Inc.)
according to manufacturer's protocol. Briefly, 100 ng of total RNA
was dephosphorylated and directly labeled with Cy3. Samples were
dried out and resuspended in Hi-RPM Hybridization Buffer (Agilent
Technologies, Inc.), containing a GE Blocking Agent (Agilent
Technologies, Inc.) and denaturized by heating for 5 min at 100°C.
In a further step, samples were hybridized to Mouse miRNA 8×15K
Microarrays (Agilent Technologies, Inc.) containing probes for 627
mouse miRNAs from the Sanger database version 12 (15) for 20 h at 55°C in a rotating
hybridization oven. A total of 3 independent replicates for each
sample were used. Slides were then washed 3 times in PBS and
scanned with the SureScan Microarray Scanner (Agilent Technologies,
Inc.). Microarray images were extracted using Feature Extraction
software (version 10.7.3.1; Agilent Technologies, Inc.). To
normalize raw probe values, experimental samples were normalized to
the mean of all samples using GeneSpring GX software (version 11.5;
Agilent Technologies, Inc.). miRNAs that exhibited a significant
(P<0.05) fold-change in expression of >2 were defined as
differentially expressed in LLC1 cells between the untreated and
irradiated groups. Microarray data are available at the GEO
database (accession no. GSE84109).
Enrichment analysis
Kyoto Encyclopedia of Genes and Genomes (KEGG)
pathway enrichment analysis of gene expression data was performed
using the WEB-based GEne SeT AnaLysis Toolkit, as described
previously (16). P-values were
calculated using the hypergeometric test and adjusted using the
Benjamini and Hochberg procedure. Functional KEGG pathway
categories associated with ≥5 genes were considered as
significantly enriched (P<0.05) in differentially expressed
genes. In silico miRNA target analysis was performed with
Diana Tools using the microT-CDS algorithm, as described previously
(17,18).
Reverse transcription-quantitative
polymerase chain reaction (RT-qPCR) for the evaluation of the mRNA
expression
To validate differential gene expression changes,
the RevertAid RT kit (Thermo Fisher Scientific, Inc.) was used for
cDNA synthesis according to manufacturer's protocol. Briefly, 1 µg
of total RNA was added to a 20 µl RT reaction containing 5 µM
random hexamer primers, 1 µM deoxynucleotide (dNTP) mix, 20 units
RNase inhibitor and 20 units reverse transcriptase. Thermocycling
conditions were as follows: 25°C for 5 min; 42°C for 60 min; 70°C
for 5 min.
RT-qPCR was performed using a MasterCycler
RealPlex4 RT-PCR system (Eppendorf, Hamburg, Germany.)
and 2X Kapa SYBR Fast qPCR Master mix (Kapa Biosystems, Inc.,
Wilmington, MA, USA) according to manufacturer's protocol. All
reactions were performed in a 10 µl reaction volume containing 5 µl
2X Kapa SYBR Fast qPCR Master mix, 1 µl 10 ng/µl cDNA, 0.2 µl 10 µM
forward and reverse primer mixture and 3.8 µl nuclease-free water.
Thermocycling conditions were as follows: 95°C for 3 min; and 40
cycles of 3 sec at 95°C and 30 sec at 60°C. The relative changes in
gene expression were evaluated using the 2−∆∆Cq method
as described previously (19). For
the normalization of the expression data, hypoxanthine
phosphoribosyltransferase 1 (Hprt1) was used as a reference gene.
Each experiment was repeated at least 3 times. RT controls were
used for determination of genomic DNA contamination.
The sequences of the primers were as follows: Hprt1
forward (F), 5′-CCTAAGATGAGCGCAAGTTGAA-3′ and reverse (R),
5′-CCACAGGACTAGAACACCTGCTAA-3′; p21 F, 5′-CCAGGCCAAGATGGTGTCTT-3′
and R, 5′-TGAGAAAGGATCAGCCATTGC-3′; cyclin G1 (Ccng1) F,
5′-ACAACTGACTCTCAGAAACTGC-3′ and R, 5′-CATTATCATGGGCCGACTCAAT-3′;
thrombospondin 2 (Thbs2) F, 5′-CTGGGCATAGGGCCAAGAG-3′ and R,
5′-GCTTGACAATCCTGTTGAGATCA-3′; BTG anti-proliferation factor 2
(Btg2) F, 5′-GGACGCACTGACCGATCATTA-3′ and R,
5′-GATACAGCGATAGCCAGAACC-3′.
RT-qPCR for the evaluation of the
miRNA expression
To validate differential changes in miRNA
expression, the RevertAid RT kit (Thermo Fisher Scientific, Inc.)
was used for cDNA synthesis as described previously (20). Briefly, 0.2 µg of total RNA was added
to a 20 µl RT reaction containing 1 µM specific RT primer, 1 µM
dNTP mix, 20 units RNase inhibitor and 20 units reverse
transcriptase. Thermocycling conditions were as follows: 25°C for
20 min; 37°C for 60 min; and 70°C for 10 min. The sequences of the
specific RT primers were as follows:
SnoRNA-135,5′-GTCGTATCCAGTGCAGGGTCCGAGGTATTCGCACTGGATACGACCTTCAG-3′;
miR-34b-3p,
5′-GTCGTATCCAGTGCAGGGTCCGAGGTATTCGCACTGGATACGACGATGGC-3′;
miR-34c-5p,
5′-GTCGTATCCAGTGCAGGGTCCGAGGTATTCGCACTGGATACGACGCAATC-3′;
miR-186-5p,
5′-GTCGTATCCAGTGCAGGGTCCGAGGTATTCGCACTGGATACGACAGCCCA-3′; and
miR-145a-5p,
5′-GTCGTATCCAGTGCAGGGTCCGAGGTATTCGCACTGGATACGACAGGGAT-3′.
RT-qPCR was performed using the Eco™ RT-PCR system
(Illumina, San Diego, CA, USA) and 2X Kapa SYBR Fast qPCR Master
mix (Kapa Biosystems, Inc.) according to manufacturer's protocol.
All reactions were performed in a 10 µl reaction volume containing
5 µl 2X Kapa SYBR Fast qPCR Master mix, 1 µl 5 ng/µl cDNA, 0.2 µl
forward and reverse primer mixture (10 µM) and 3.8 µl nuclease-free
water. Thermocycling conditions were as follows: 95°C for 3 min; 3
cycles of 15 sec at 95°C, 1 min at 55°C and 30 sec at 60°C; and 32
cycles of 10 sec at 95°C and 30 sec at 60°C. The relative changes
in miRNA expression were evaluated using the 2−∆∆Cq
method (17). For the normalization
of the expression data, SnoRNA-135 was used as a reference gene.
The sequences of primers used for the amplification were as
follows: SnoRNA-135 forward, 5′-GTAGTGGTGAGCCTATGGTTTT-3′;
miR-34b-3p forward, 5′-CGGCGAATCACTAACTCCACT-3′; miR-34c-5p
forward, 5′-GGCGAGGCAGTGTAGTTAGCT-3′; miR-186-5 forward,
5′-GGCGCAAAGAATTCTCCTTT-3′; miR-145a-5p forward,
5′-CGGTCCAGTTTTCCCAGGA-3′; and a reverse primer,
5′-GTGCAGGGTCCGAGGT-3′.
Statistical analysis
Data were analyzed using GraphPad Prism software
(version 6.0; GraphPad Software, La Jolla, CA, USA). A Student's
t-test was performed to statistically compare differences between
the untreated and irradiated groups. P<0.05 was considered to
indicate a statistically significant difference. All experiments
were independently repeated ≥3 times.
Results
Clonogenic cell survival
Clonogenic survival analysis revealed that LLC-1
cells were more sensitive to SD irradiation compared with FD
irradiation (data not shown). The surviving fractions of LLC1 cells
following 2–10 Gy SD irradiation were 62.2±4.1–1.1±0.51% compared
with non-irradiated cells. LLC1 cell survival decreased to
19.81±4.65% following 5×2 Gy FD irradiation compared with
non-irradiated cells.
Global mRNA expression changes
Genome wide gene expression microarray data analysis
revealed that a total of 2,294 genes were differentially expressed
(fold-change >1.5; P<0.05) in LLC1 cells 4 h following
treatment with 2 Gy SD (SD2), 10 Gy (SD10) or 5×2 Gy FD irradiation
compared with the untreated cells (Fig.
1). The amount of differentially expressed genes following
irradiation was dose delivery-dependent. The exposure of LLC1 cells
to SD2 resulted in the differential expression of 422 genes. By
contrast, the expression of 1,258 and 1,465 genes was significantly
altered following exposure to SD10 and FD irradiation,
respectively. The ratio of upregulated and downregulated genes was
similar following all irradiation regimens. Microarray data
analysis also revealed that 145 differently expressed genes were
common between all irradiation regimens.
KEGG pathway enrichment analysis
In order to elucidate which pathways were
significantly affected by irradiation treatment, genes identified
to be differentially expressed (fold-change >1.5; P<0.05)
following SD or FD were grouped into functional KEGG pathway
categories (Table I). KEGG pathway
analysis revealed that the ‘cell cycle’ and ‘p53 signaling pathway’
categories were the most significantly altered following all
irradiation regimens, and the ‘DNA replication’ and ‘apoptosis’
categories were also significantly altered subsequent to SD10 and
FD irradiation regimens. Genes associated with ‘Pathways in cancer’
were the most significantly enriched among all KEGG categories
following SD10 and FD irradiation. Furthermore, subsequent to
exposure to SD10 or FD the second most significantly altered
functional categories were related to DNA repair (‘mismatch
repair’, ‘nucleotide excision repair’ and ‘base excision repair’)
and the immune response (‘cytokine-cytokine receptor interaction’,
‘hepatitis C’, ‘chemokine signaling pathway’, ‘B cell receptor
signaling pathway’, ‘Janus kinase-signal transducer and activator
of transcription signaling pathway’ and ‘Toll-like receptor
signaling pathway’). The pathway enrichment data also revealed that
SD10 and FD irradiation significantly altered the expression of
genes involved in the ‘mitogen activated protein kinase (MAPK’,
‘tumor growth factor-β’, ‘vascular endothelial growth factor’,
‘wingless-type MMTV integration site family’ and ‘insulin’
signaling pathways.
 | Table I.Kyoto Encyclopedia of Genes and
Genomes pathway enrichment categories for genes differentially
expressed in LLC1 cells following single dose (2 or 10 Gy) or
fractionated dose (5×2 Gy) irradiation. |
Table I.
Kyoto Encyclopedia of Genes and
Genomes pathway enrichment categories for genes differentially
expressed in LLC1 cells following single dose (2 or 10 Gy) or
fractionated dose (5×2 Gy) irradiation.
|
| 2 Gy | 10 Gy | 5×2 Gy |
|---|
|
|
|
|
|
|---|
| Category | No. of genes | P-value | No. of genes | P-value | No. of genes | P-value |
|---|
| Pathways in
cancer | 11 | 0.0005 | 38 |
1.76×10⁻¹⁶ | 53 |
3.50×10⁻²⁷ |
| Cell cycle | 5 | 0.0069 | 25 |
2.88×10⁻¹⁶ | 28 |
3.48×10⁻¹⁸ |
| p53 signaling
pathway | 10 |
2.37×10−09 | 15 |
2.07×10⁻¹⁰ | 24 |
2.46×10⁻²⁰ |
| MAPK signaling
pathway | 0 | NS | 20 |
2.73×10−06 | 29 |
8.91×10⁻¹¹ |
| Cytokine-cytokine
receptor interaction | 7 | 0.0066 | 19 |
2.84×10−06 | 26 |
1.35×10−09 |
| DNA
replication | 0 | NS | 8 |
2.09×10−06 | 10 |
3.89×10−08 |
| TGF-β signaling
pathway | 3 | NS | 14 |
1.92×10−08 | 14 |
6.72×10−08 |
| Apoptosis | 6 | 0.0007 | 16 |
3.41×10⁻¹⁰ | 17 |
1.40×10⁻¹⁰ |
| VEGF signaling
pathway | 0 | NS | 9 |
7.35×10−05 | 12 |
8.71×10−07 |
| Hepatitis C | 0 | NS | 16 |
1.63×10−07 | 19 |
4.13×10−09 |
| Mismatch
repair | 0 | NS | 7 |
1.10×10−06 | 8 |
1.20×10−07 |
| Nucleotide excision
repair | 0 | NS | 7 |
7.45×10−05 | 12 |
1.72×10−09 |
| Wnt signaling
pathway | 0 | NS | 9 | 0.0076 | 15 |
1.24×10−05 |
| Chemokine signaling
pathway | 0 | NS | 15 |
2.07×10−05 | 16 |
2.50×10−05 |
| B cell receptor
signaling pathway | 5 | 0.0022 | 11 |
1.96×10−06 | 10 |
3.51×10−05 |
| Base excision
repair | 2 | NS | 8 |
3.42×10−06 | 7 |
7.77×10−05 |
| Jak-STAT signaling
pathway | 6 | 0.0035 | 14 |
1.13×10−05 | 14 |
4.64×10−05 |
| Insulin signaling
pathway | 4 | NS | 17 |
2.63×10−08 | 17 |
1.20×10−07 |
| RIG-I-like receptor
signaling pathway | 0 | NS | 2 | NS | 6 | 0.01 |
| Toll-like receptor
signaling pathway | 0 | NS | 7 | 0.008 | 9 | 0.0013 |
| Homologous
recombination | 0 | NS | 5 | 0.0006 | 5 | 0.0009 |
Heat map analysis
Radiation-induced changes in the expression of
individual genes from the p53, cell cycle, apoptosis and immune
response-associated KEGG pathway categories, which were the most
significantly altered in LLC1 cells following SD and FD
irradiation, were color coded to demonstrate the expression
patterns of genes within each category following exposure to SD and
FD irradiation protocols (Fig. 2).
Typically, the heat maps demonstrated that the differential
expression of genes peaked in cells exposed to SD10 or FD
irradiation. In addition, the extent of certain differentially
expressed genes was different in cells irradiated with FD compared
with SD.
The microarray data indicated that a total of 27
genes involved in the p53 signaling pathway were significantly
altered in LLC1 cells exposed to all irradiation regimens (Fig. 2A). Fig.
2B depicts a total of 77 genes associated with immune response
regulation that were differentially expressed in LLC1 cells
following irradiation treatment. This subset of the heat map
reveals that the expression of 51 genes was upregulated and 26
genes were downregulated. The expression of chemokines ccl7 and
ccl9 peaked in response to 10 Gy, whereas FD induced the expression
of cxcl5. The irradiation regimens also induced the expression of
tumor necrosis factor-associated cytokines tnfrsf10b and tnfrsf19,
which peaked following 10 Gy irradiation. FD also significantly
altered the expression of tnfrsf9, tnfrsf18 and tnfrsf25. The
expression of cytokines, including figf, vegfa pdgfc, ctf1 and
il11, was significantly altered in LLC1 cells in response to FD
irradiation. The irradiation regimens induced the expression of
transcription factors Nfatc1 and Stat1, which peaked following
SD10. In addition, FD significantly induced the expression of
Stat5a. Exposure to radiation also altered the expression of a
total of 34 genes involved in cell cycle regulation (Fig. 2C). The majority of the differentially
expressed genes were downregulated, whereas the expression of only
9 genes was upregulated in this category. Heat map analysis also
demonstrated that 19 apoptosis related genes were differentially
expressed in cells following irradiation (Fig. 2D). The expression of a total of 14
genes was upregulated in this category, including proapoptotic Fas,
Bad, Bid, Casp7, Trp53, Tradd, Thfrsf10b, and anti-apoptotic Bcl2l1
and Cfalr genes. In addition, the expression of 5
apoptosis-associated genes was downregulated in cells following to
exposure to irradiation in this group, including Bcl2 and Xiap
peaked following SD10.
Global miRNA expression changes
The miRNA microarray data revealed that a total of
18 miRNAs were differentially expressed (>2-fold; P<0.05) in
LLC1 cells exposed to all irradiation protocols (Table II). The expression of 2 miRNAs,
miR-34c-5p and miR-145a-3p, was significantly altered by all
irradiation protocols, whereas miR-34c-3p and miR-34b-3p were
upregulated following exposure to SD10 and FD. Data in Table II also revealed that the highest
number of miRNAs was differently altered in LLC1 cells following
exposure to FD, resulting in deregulated expression of 7 unique
miRNAs. The expression of miR-186-5p, miR-145a-5p, miR-129-5p,
miR-192-5p, miR-129-2-3p and miR-30c-5p was upregulated, and
miR-105 was downregulated, in LLC1 cells following the FD
regimen.
| Table II.Relative expression of differentially
expressed miRNAs in LLC1 cells following single dose (2 or 10 Gy)
or fractionated dose (5×2 Gy) irradiation. |
Table II.
Relative expression of differentially
expressed miRNAs in LLC1 cells following single dose (2 or 10 Gy)
or fractionated dose (5×2 Gy) irradiation.
|
|
| Relative expression
(irradiation dose) |
|---|
|
|
|
|
|---|
| miRNA | miRbase ID no. | 2 Gy | 10 Gy | 5×2 Gy |
|---|
| miR-34c-5p | MIMAT0000381 | 2.19a | 2.79a | 5.30a |
| miR-145a-3p | MIMAT0004534 | −2.46a | −2.08a | −2.94a |
| miR-878-5p | MIMAT0004932 | −2.20a | −2.74a | −2.43 |
| miR-126a-5p | MIMAT0000137 | −2.16a | −1.6 | −2.15 |
| miR-338-5p | MIMAT0004647 | −2.03a | 1.10 | −1.89 |
| miR-26b-3p | MIMAT0004630 | −1.31 | −2.32a | −1.33 |
| miR-136-5p | MIMAT0000148 | −1.28 | 2.17a | −1.43 |
| miR-466a-5p | MIMAT0004759 | −1.73 | −2.58a | −3.28 |
| miR-710 | MIMAT0003500 | −1.71 | −2.45a | −3.11 |
| miR-34b-3p | MIMAT0004581 | 2.18 | 4.07a | 14.78a |
| miR-34c-3p | MIMAT0004580 | 2.32 | 4.77a | 24.93a |
| miR-30c-5p | MIMAT0000514 | −1.10 | 1.11 | 5.50a |
| miR-105 | MIMAT0004856 | −1.54 | −1.31 | −3.65a |
| miR-129-5p | MIMAT0000209 | 1.27 | 2.07 | 4.26a |
| miR-129-2-3p | MIMAT0000544 | −1.09 | 1.35 | 8.10a |
| miR-145a-5p | MIMAT0000157 | 1.12 | 1.12 | 6.99a |
| miR-186-5p | MIMAT0000215 | 1.46 | 1.55 | 3.55a |
| miR-192-5p | MIMAT0000517 | 1.55 | 1.36 | 2.62a |
miRNA target filter analysis
In order to determine functions of the 18 miRNA
significantly altered following exposure to SD and FD irradiation
in the post-transcriptional regulation of gene expression, the
present study identified 6,343 individual target genes potentially
regulated by these miRNA using in silico miRNA target
analysis. Subsequently, negative associations between all
differently expressed genes and miRNAs associated with cell cycle
regulation, the p53 signaling pathway, apoptosis and the immune
response were identified, indicating a potential miRNA-mRNA
connection in these processes.
The miRNAs showing inverse associations with
differently expressed target genes involved in selected pathways
are shown in Table III. A negative
association was identified between the differential expression of 6
miRNAs and 11 mRNAs in the cell cycle, p53 signaling pathway and
apoptosis KEGG categories. miRNA target analysis also revealed that
20 differentially expressed genes from the immune response category
were inversely associated with the differential expression of 12
miRNAs.
| Table III.miRNA target filter analysis of
differentially expressed target genes and miRNAs from the cell
cycle, p53, apoptosis and immune response categories that
demonstrated an inverse association in LLC1 cells exposed to single
dose (10 Gy) or fractionated dose (5×2 Gy) irradiation. |
Table III.
miRNA target filter analysis of
differentially expressed target genes and miRNAs from the cell
cycle, p53, apoptosis and immune response categories that
demonstrated an inverse association in LLC1 cells exposed to single
dose (10 Gy) or fractionated dose (5×2 Gy) irradiation.
|
| 10 Gy | 5×2 Gy |
|---|
|
|
|
|
|---|
| Category | miRNA | Target gene | miRNA | Target gene |
|---|
| Cell cycle | miR-34c-5p↑ | E2f3↓; E2f5↓;
Ccne2↓ | miR-30c-5p↑ | Ccne2↓; Stag1↓;
Orc4↓; Skp2↓ |
|
|
|
| miR-34c-5p↑ | Ccne2↓; E2f3↓ |
|
|
|
| miR-129-5p↑ | Stag1↓; Orc4↓ |
|
|
|
| miR-145a-5p↑ | Orc4↓ |
|
|
|
| miR-186-5p↑ | Cdc27↓; Stag1↓ |
| p53 signaling
pathway | miR-34c-5p↑ | Ccne2↓ | miR-30c-5p↑ | Ccne2↓ |
|
|
|
| miR-34c-5p↑ | Ccne2↓ |
|
|
|
| miR-129-5p↑ | Pten↓ |
|
|
|
| miR-145a-3p↓ | Pmaip1↑;
Sesn2↑ |
| Apoptosis |
|
| miR-30c-5p↑ | Ppp3cb↓ |
| Immune
response | miR-34b-3p↑ | Spred1↓ | miR-30c-5p↑ | Lepr↓; Kras↓;
Ppp3cb↓ |
|
| miR-34c-3p↑ | Spred1↓ | miR-34c-3p↑ | Gng5↓ |
|
| miR-34c-5p↑ | Pdk1↓ | miR-34c-5p↑ | Pdk1↓ |
|
| miR-136-5p↓ | Eda2r↑ | miR-129-5p↑ | Il6ra↓; Rock1↓ |
|
| miR-145a-3p↓ | Cr2↑; Inpp5d↑ | miR-186-5p↑ | Vegfa↓; Pias2↓ |
|
| miR-466a-5p↓ | Eda2r↑; Egfr↑;
Inhbb↑ | miR-192-5p↑ | Crk↓; Pias2↓ |
|
| miR-710↓ | Stat1↑;
Pik3r3↑ | miR-105↓ | Tgfbr2↑;
Stat1↑ |
|
|
|
| miR-145a-3p↓ | Tgfbr2↑; Cr2↑;
Inpp5d↑; Ticam1↑ |
Microarray data validation
To validate the microarray data, the present study
selected 4 upregulated genes and miRNAs for RT-qPCR analysis
(Table IV). The results indicated
that the expression of genes involved in the p53 signaling pathway,
including Btg2, cyclin Ccng1, p21 and Thbs2, were significantly
upregulated in LLC1 cells following irradiation compared with the
untreated cells. RT-qPCR analysis also revealed that miR-34b-3p and
miR-34c-5p were significantly upregulated in LLC1 cells following
exposure of SD10 and FD, whereas miR-186-5p and miR-145a-5p were
significantly upregulated following FD, compared with untreated
cells. RT-qPCR analysis validated the gene and miRNA microarray
data.
| Table IV.Validation of gene and miRNA
microarray data by RT-qPCR. |
Table IV.
Validation of gene and miRNA
microarray data by RT-qPCR.
| A, Gene |
|---|
|
|---|
|
| Irradiation
dose |
|---|
|
|
|
|---|
| Data | 10 Gy | 5×2 Gy |
|---|
| Btg2 |
|
|
|
RT-qPCR | 5.09±0.34 | 4.51±0.73 |
|
Microarrays | 5.38±1.55 | 2.74±0.09 |
| Ccng1 |
|
|
|
RT-qPCR | 4.02±0.57 | 3.2±0.47 |
|
Microarrays | 2.06±0.47 | 2.30±0.45 |
| P21 |
|
|
| RT-qPCR | 2.64±0.06 | 2.6±0.49 |
| Microarrays | 5.96±1.28 | 2.43±0.16 |
| Thbs2 |
|
|
| RT-qPCR | 1.30±0.10 | 2.76±0.67 |
| Microarrays | 1.29±0.18 | 2.26±0.11 |
|
| B, miRNA |
|
|
| Irradiation
dose |
|
|
|
| Data | 10 Gy | 5×2 Gy |
|
| miR-34b-3p |
|
|
| RT-qPCR | 2.76±0.48 | 3.6±0.58 |
| Microarrays | 4.07±1.53 | 14.78±4.75 |
| miR-34c-5p |
|
|
| RT-qPCR | 2.67±0.66 | 2.32±0.34 |
| Microarrays | 2.79±0.33 | 5.3±0.90 |
| miR-186-5p |
|
|
| RT-qPCR | 1.62±0.48 | 2.28±0.06 |
| Microarrays | 1.55±0.59 | 3.55±0.81 |
| miR-145a-5p |
|
|
| RT-qPCR | 1.41±0.46 | 3.44±0.49 |
| Microarrays | 1.12±0.88 | 6.99±1.41 |
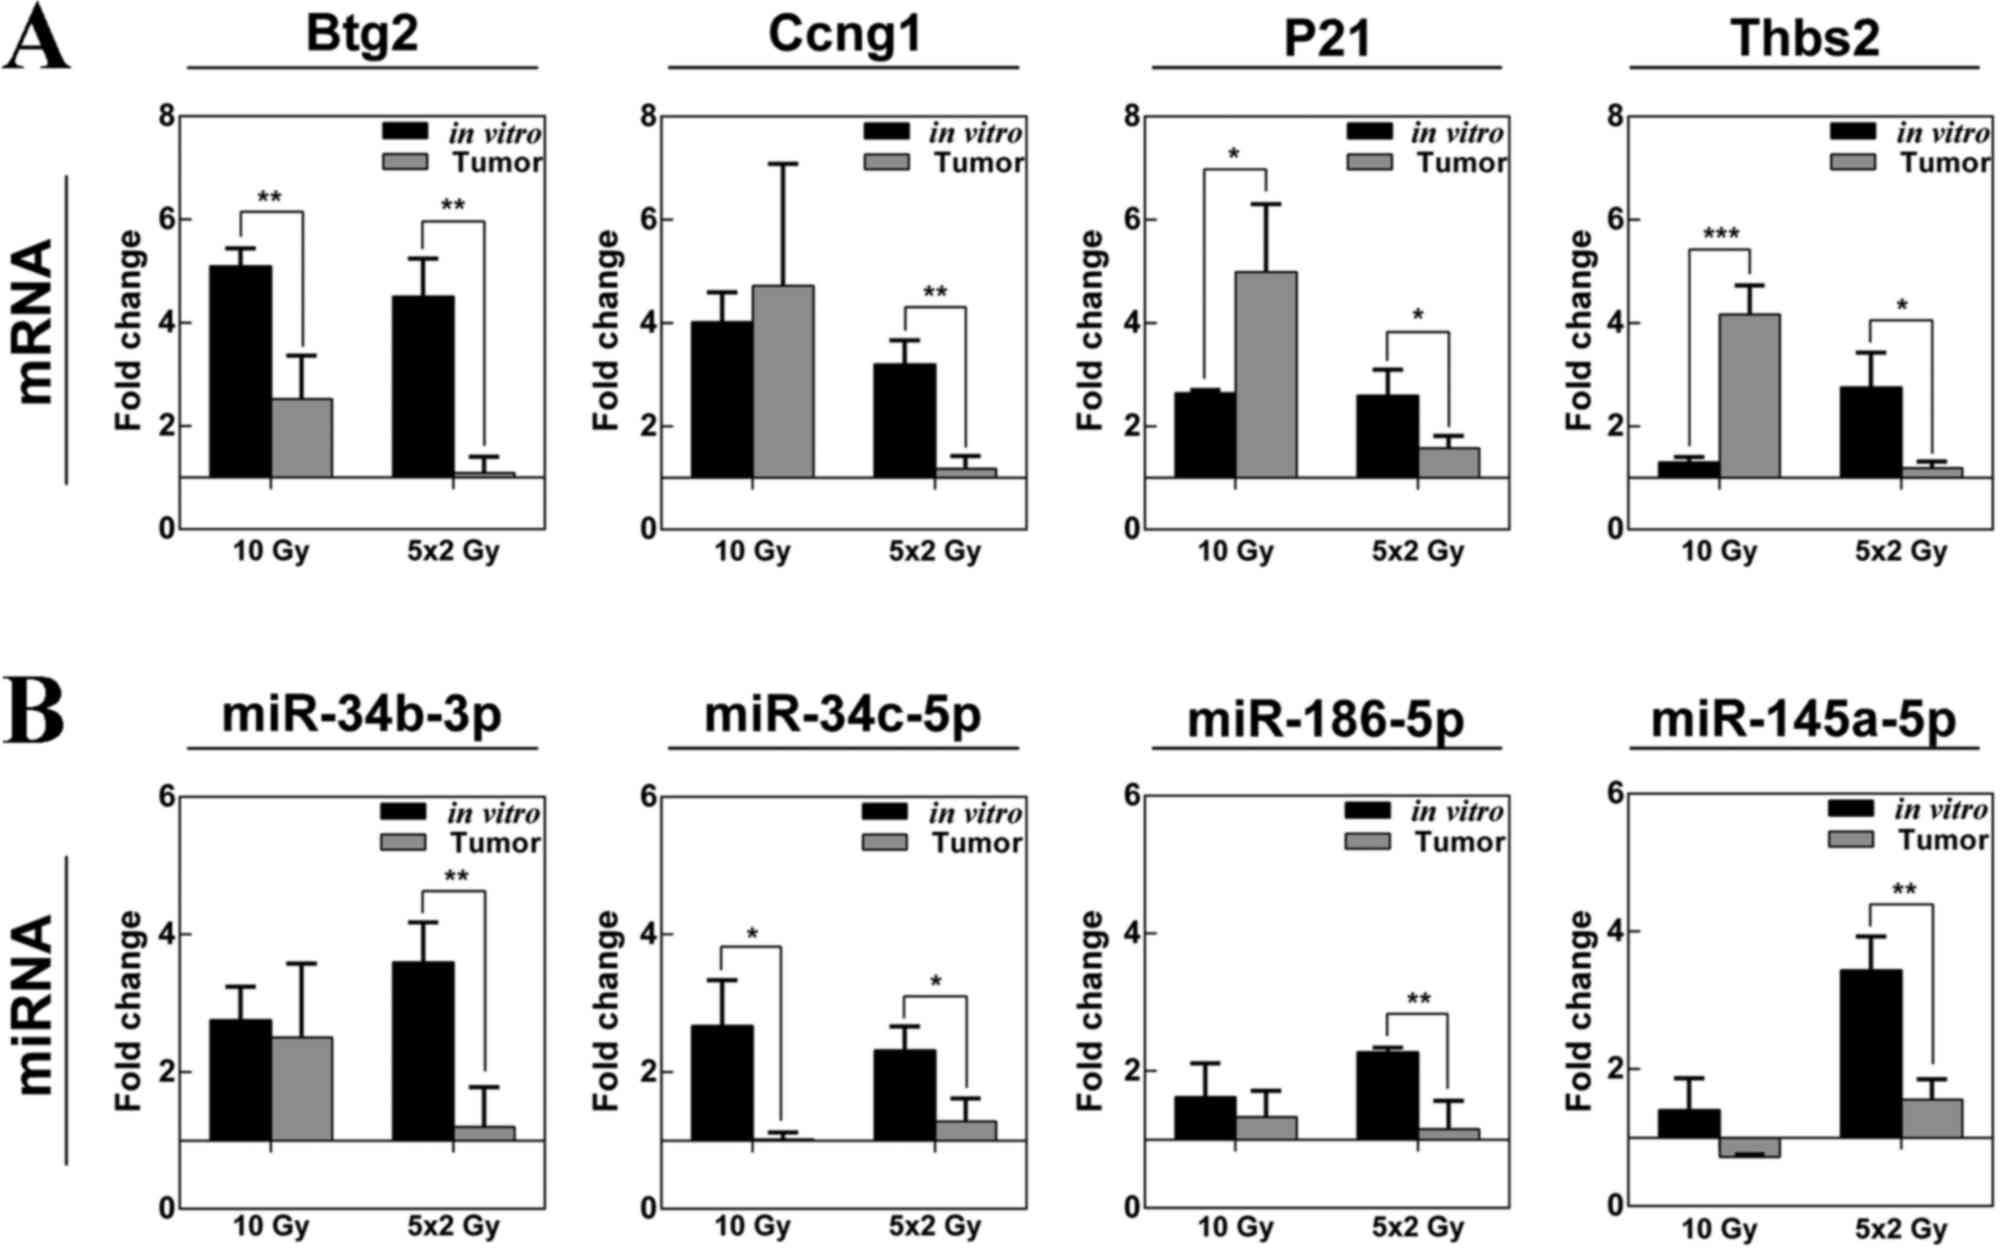
The present study compared the difference in
expression of selected genes and miRNAs in LLC1 cells grown in
vitro and LLC1 tumors in vivo following SD10 and FD
irradiation (Fig. 3A and B). RT-qPCR
analysis revealed that the expression of btg2, ccng1 and p21 was
upregulated in tumors and LLC1 cells following SD treatment with 10
Gy. Thbs2 was also upregulated in vivo following irradiation
of 10 Gy, whereas the expression of thbs2 was only significantly
altered in vitro following FD. Notably, the expression of
the selected genes was not significantly altered in LLC tumors
following the FD irradiation regimen, which is in contrast to the
results identified in LLC1 cells. Additionally, RT-qPCR analysis
indicated no significant changes in the expression of the selected
miRNAs in LLC1 tumors following irradiation (Fig. 3B).
Discussion
The present study investigated the changes in gene
and miRNA expression signatures following SD2, SD10 and 5×2 Gy FD
irradiation in mouse lung carcinoma LLC1 cells and syngeneic LLC1
tumors. The obtained data revealed that the gene expression
profiles of LLC1 cells were irradiation dose delivery-dependent. In
addition, the present study demonstrated through KEGG pathway
enrichment analysis that the p53 signaling, cell cycle, apoptosis
and immune response pathways were the most significantly altered
functional categories in LLC1 cells following irradiation. The
extent of differential expression was also irradiation dose
delivery-dependent. The results of the miRNA microarray indicated
that FD irradiation induced a significantly different miRNA
expression pattern compared with SD irradiation. Furthermore, miRNA
target filter analysis revealed a significant association between
mRNA and miRNA expression signatures in LLC1 cells following
exposure to radiation. However, RT-qPCR analysis demonstrated that
LLC1 tumors exhibited no significant change in the expression of
selected genes and miRNAs following a FD irradiation regimen.
The microarray data revealed that FD irradiation
induced differential expression in the highest number of genes. In
addition, a total of 145 genes were commonly expressed between all
irradiation regimens, demonstrating a significantly different gene
expression pattern in LLC1 cells following exposure to SD or FD
radiation. These results are supported by previous studies
(2,4,5) that also
indicated that different gene expression profiles in human breast
and prostate carcinoma and normal endothelium cell lines were
irradiation dose delivery-dependent. In addition, Palayoor et
al (5) have previously identified
potential therapeutic targets from investigated the response of
human prostate carcinoma cells exposed to FD radiation (3). The results of previous studies and the
present study suggest that FD irradiation could be a relevant
approach to identifying genes and molecular pathways that are
clinically important for the improving the efficacy of
radiotherapy.
The present study demonstrated that the most
significantly altered functional categories in LLC1 cells following
all irradiation regimens were cell cycle regulation and the p53
signaling pathways. In addition, the most significant pathway
enrichment was identified in cells exposed to FD. The transcription
factor p53 serves an essential role in the cellular response to
IR-induced DNA damage (21). The
activation of p53 results in temporary cell cycle arrest to
facilitate the repaired of damaged DNA, in addition to apoptosis if
the damage cannot be repaired (22,23). The
present study identified that the majority of cell cycle-associated
genes were downregulated in LLC1 cells following SD and FD
irradiation regimens, including genes promoting G1/S and
G2/M transition. Notably, the expression of the kinases
Atr and Chek1, which are implicated in S-phase DNA damage
checkpoint arrest (24), were also
downregulated in LLC1 cells following irradiation. In addition,
irradiation resulted in a significant upregulation of p21, which is
a master regulator of cell cycle checkpoint progression or arrest
(25). However, the deregulation of
gene expression was more robust in cells exposed to FD. These
included differentially expressed genes associated with the
progression of DNA replication and mitosis. For example, the
expression of anaphase-promoting complex (APC/C) encoding genes,
including Cdc26, Cdc27, Anapc2 and Anapc11, was altered in cells
exposed to FD radiation. In addition, FD irradiation deregulated
the expression of Bub1 and Bub3, which are involved in the spindle
assembly checkpoint and the regulation of APC/C catalytic activity
(26). Furthermore, the irradiated
LLC1 cells demonstrated significantly upregulated expression of
genes involved in the regulation of apoptosis. However, microarray
data indicated that the deregulation of gene expression associated
with pro-apoptotic processes peaked in cells exposed to SD10. The
expression levels of anti-apoptotic genes, including Bcl2l1 and
Akt2, were increased in cells following the exposure to FD compared
with SD. These data indicate that the survival of LLC1 cells is
significantly higher following exposure to FD compared with SD10.
The pro-survival effect of the radiation-induced DNA damage
response of LLC1 cells treated with FD is likely dependent on the
cumulative effect of the differential expression of genes.
The present study revealed that the expression of
genes involved in the immune response was significantly altered in
LLC1 cells following all irradiation regimens. Despite this, the
number of differentially expressed genes was similar in cells
exposed to SD10 and FD. However, the set of specific differentially
expressed inflammatory genes was significantly different following
the different irradiation protocols. This is in accordance with the
results of previous studies, which identified a distinct expression
profile of immune response genes between cells exposed to SD or FD
(3,5).
Microarray analysis performed in the current study also
demonstrated that genes from the immune response category,
including genes encoding chemokines, cytokines, cytokine receptors
and tumor necrosis factors, were differently expressed in the
irradiated LLC1 cells compared with non-irradiated cells. The
results of the present study are consistent with previous studies
demonstrating that RT can promote the immune recognition of tumor
cells by increasing the expression of antigen-presenting molecules,
pro-inflammatory cytokines and the release of ‘Damage-associated
molecular signals’, leading to the attraction of immune cells to
the irradiated tumor site (27–29).
Additionally, the expression of transcription factors, including
Nfatc1 and Stat1, were upregulated in cells exposed to SD and FD
radiation. Members of the Stat family have been demonstrated to
activate the transcription of genes involved in cancer cell
survival, proliferation and angiogenesis (30). Furthermore, Stat1 is considered to
serve an important role in regulating the expression of
interferon-stimulated genes (ISGs) (31). The transactivation of ISGs by Stat1
can be induced as a part of the cellular response to IR and can
lead to increased radioresistance (32). In the current study, treatment with FD
radiation elevated the expression of Stat5a, suggesting that other
Stat family members may be involved in resistance to radiotherapy.
This is further supported by a previous study that demonstrated an
association between the expression of Stat5a and radiosensitivity
in head and neck squamous cell carcinoma cells (33). These findings suggest that the
radiation-induced immune response in irradiated LLC1 cells may
contribute to tumor development in a dose delivery-dependent
manner. Radiation-induced alterations in the expression of
inflammatory genes are considered to be pro-immunogenic,
highlighting the potential of combining RT with immunotherapy for
the treatment of cancer (34,35). Preclinical data also indicates that
the promotion of antitumor immune response is irradiation delivery
type-dependent, since RT delivered as a SD is not sufficient to
induce antitumor immunity (36–38).
Together these findings indicate possible directions for the
development of more efficient anticancer irradiation treatment
strategies, based on exploiting the pro-survival and immunogenic
tumor signaling pathway alterations during FD irradiation.
It has previously been demonstrated that exposure to
SD radiation results in the differential expression of miRNAs in
various cancer and normal cells (39). In the present study, the expression of
a total of 18 miRNAs was significantly altered in LLC1 cells
exposed to IR. Microarray analysis also identified that the
expression of miR-34 cluster miRNAs, including miR-34b and miR34c,
was significantly upregulated in cells exposed to SD or FD
radiation. Previous studies have demonstrated that members of the
miR-34 cluster are regulated by p53 and involved in the regulation
of cell cycle arrest, proliferation inhibition and apoptosis
(40). miR-34 cluster miRNAs have
also been identified to be upregulated in different human cancer
cells exposed to IR (41,42). These observations suggest that miR-34
cluster miRNAs serve an important role in the response of LLC1
cells to IR. The microarray data analysis demonstrated that FD
irradiation induced the most robust deregulation of miRNA
expression, indicating that the expression of miRNA is also altered
in an irradiation delivery-dependent manner. Similar results were
identified in previous studies, which demonstrated a high degree of
alteration in the expression of miRNAs in prostate cancer and
endothelium cells following FD (5,6). In
addition, Leung et al (43)
reported that only a small number of miRNAs differentially
expressed in breast cancer cells exposed to SD or FD were the same,
suggesting that FD induces a distinct miRNA signature compared with
SD radiation.
To further extend the understanding of the roles
miRNAs serve in the cellular response to IR, the present study
performed miRNA target filter analysis to identify potential
functional associations between differentially expressed mRNAs and
miRNAs in LLC1 cells exposed to radiation. However, the
identification of regulatory miRNAs and their target mRNAs remains
a major challenge since a single miRNA may regulate multiple mRNAs
and vice versa. In addition, statistical methods which are able to
identify these miRNA-controlled regulations may result in thousands
of putative miRNA-mRNA pairs, leading to an inability to extract a
biologically relevant understanding of the collective function of
differentially expressed miRNAs (44). Therefore, the present study
investigated the negative association between the expression of
miRNAs and genes associated with p53, cell cycle regulation,
apoptosis and immune response pathways, which were shown to be the
most prominently altered in LLC1 cells following SD and FD
irradiation.
It has been shown that the transcription factor p53
performs an important role in the regulation of the transcription
of several miRNAs, which in turn control the expression of
p53-regulated genes that mediate cell cycle arrest and apoptosis
(40,45). The present miRNA target analysis
revealed an inverse association between the expression of miR-34c
and E2f3, E2f5 and Ccne2, suggesting that the upregulation of
miR-34c could be associated with G1 phase regulation in
LLC1 cells exposed to radiation. This is also supported by previous
studies that have highlighted the role of miR-34c in the induction
of G1 and G2/M cell cycle arrest (46,47). In
addition, Li et al (48) have
demonstrated that the expression of E2F3 is reduced following the
upregulation of miR-34c in endometrial carcinoma cells, indicating
that E2F3 could be a target of miR-34c. The present study
identified a negative association between several miRNAs and genes
that were differentially expressed in cells exposed to FD
radiation. For example, the upregulation of miR-30c was associated
with the downregulation of Ccne2, Stag1, Orc4 and Skp2. In
addition, the expression of Stag1 and Orc4 was inversely associated
with the expression of miR-129, miR-145a and miR-186. These
observations suggest that these miRNAs perform important roles in
the cell cycle arrest response to radiation in LLC1 cells in a dose
delivery-dependent manner. However, no significant association was
observed between differentially expressed miRNAs and genes involved
in apoptosis, with the exception of a negative association between
the expression of miR-30c and Ppp3cb. Nevertheless, several miRNAs
that were differentially expressed subsequent to irradiation have
previously been demonstrated to be associated with the regulation
of apoptosis, indicating that they may serve a similar role in
irradiated LLC1 cells. For example, the overexpression of miR-129
was identified to promote the death of irradiated breast cancer
cells by targeting high mobility group box 1 for degradation
(49). In addition, miR-30c was
demonstrated to serve an important role in the radiation-induced
hematopoietic cell damage response (50).
There is emerging evidence that miRNAs are involved
in the radiation-induced regulation of inflammatory responses
(5–7).
miRNA target filter analysis revealed that the majority of miRNAs
differentially expressed in LLC1 cells exposed to SD and FD
radiation were inversely associated with several genes associated
with the immune response, highlighting the role of miRNA in the
inflammatory response to irradiation. Target filter analysis also
indicated that the regulation of miRNAs and inflammatory
response-associated genes in LLC1 cells treated with fractionated
irradiation was significantly different. In addition, the
upregulation of Stat1 was associated with the downregulation of
miR-710 in cells exposed to SD and with the downregulation of
miR-105 in cells exposed to FD. The present study demonstrated that
treatment with FD also upregulated the expression of miR-145-5p,
which has previously been identified to target Stat1 (51), indicating that certain differentially
expressed genes could be regulated by distinct miRNAs in cells
exposed to SD or FD radiation. These data suggest that the
regulation of the immune response by miRNAs in irradiated LLC1
cells may be irradiation dose delivery-dependent.
The results of the present study demonstrate that
the expression of genes and miRNAs is different in LLC1 tumors and
LLC1 cells in vitro following exposure to SD10 or FD
irradiation. Despite the fact that treatment with SD10 increased
the expression of genes involved in the p53 signaling pathway in
LLC1 tumors, no significant change in the expression of selected
genes and miRNAs were observed in vivo following the
exposure to FD radiation, suggesting that the radiation-induced
changes in gene and miRNA expression may be modulated by the tumor
microenvironment. Similar results of different cellular response to
irradiation under the different microenvironment conditions were
obtained by previous studies, which have applied different
strategies to validate in vitro data. Camphausen et
al (11) reported that
glioblastoma U87 and U251 cells exposed to 6 Gy SD radiation in
vivo exhibited a different set of differentially expressed
genes compared with cells grown in vitro. In addition, Tsai
et al (2) demonstrated that
prostate cancer DU145 cell xenografts exhibited a different profile
of genes induced by SD and FD compared with the same cells exposed
to irradiation in vitro, indicating that a 10 Gy exposure
in vivo could only reach an effect of up to 3 Gy exposure
under in vitro growth conditions. These data suggest that
investigations into the effects of gene and miRNA expression will
require more biologically relevant experimental conditions.
In conclusion, the present study indicates that the
gene and miRNA expression profiles in LLC1 cells exposed to
radiation are dose delivery type-dependent. In addition, data
analysis revealed that the altered expression of miRNAs and
targeted mRNAs may affect radiation-induced DNA damage response
pathways differently in LLC1 cells exposed to SD and FD
irradiation. The results of the present study may be applied to
improve the outcome of radiotherapy. However, experimental in
vitro conditions, including the tumor microenvironment, should
be considered in more detail in further investigations.
Acknowledgements
The present study was supported by the European
Social Fund under the National Integrated Programme of
Biotechnology and Biopharmacy (grant no.
VP1-3.1-SMM-08-K01-005).
Glossary
Abbreviations
Abbreviations:
|
RT
|
radiotherapy
|
|
IR
|
ionizing radiation
|
|
SD
|
single dose
|
|
FD
|
fractionated dose
|
References
|
1
|
Lawrence YR, Vikram B, Dignam JJ,
Chakravarti A, Machtay M, Freidlin B, Takebe N, Curran WJ Jr,
Bentzen SM, Okunieff P, et al: NCI-RTOG translational program
strategic guidelines for the early-stage development of
radiosensitizers. J Natl Cancer Inst. 105:11–24. 2013. View Article : Google Scholar : PubMed/NCBI
|
|
2
|
Tsai MH, Cook JA, Chandramouli GV, DeGraff
W, Yan H, Zhao S, Coleman CN, Mitchell JB and Chuang EY: Gene
expression profiling of breast, prostate, and glioma cells
following single versus fractionated doses of radiation. Cancer
Res. 67:3845–3852. 2007. View Article : Google Scholar : PubMed/NCBI
|
|
3
|
John-Aryankalayil M, Palayoor ST, Cerna D,
Simone CB II, Falduto MT, Magnuson SR and Coleman CN: Fractionated
radiation therapy can induce a molecular profile for therapeutic
targeting. Radiat Res. 174:446–458. 2010. View Article : Google Scholar : PubMed/NCBI
|
|
4
|
Simone CB II, John-Aryankalayil M,
Palayoor ST, Makinde AY, Cerna D, Falduto MT, Magnuson SR and
Coleman CN: mRNA expression profiles for prostate cancer following
fractionated irradiation are influenced by p53 status. Transl
Oncol. 6:573–585. 2013. View Article : Google Scholar : PubMed/NCBI
|
|
5
|
Palayoor ST, John-Aryankalayil M, Makinde
AY, Falduto MT, Magnuson SR and Coleman CN: Differential expression
of stress and immune response pathway transcripts and miRNAs in
normal human endothelial cells subjected to fractionated or
single-dose radiation. Mol Cancer Res. 12:1002–1015. 2014.
View Article : Google Scholar : PubMed/NCBI
|
|
6
|
John-Aryankalayil M, Palayoor ST, Makinde
AY, Cerna D, Simone CB II, Falduto MT, Magnuson SR and Coleman CN:
Fractionated radiation alters oncomir and tumor suppressor miRNAs
in human prostate cancer cells. Radiat Res. 178:105–117. 2012.
View Article : Google Scholar : PubMed/NCBI
|
|
7
|
Zhao L, Lu X and Cao Y: MicroRNA and
signal transduction pathways in tumor radiation response. Cell
Signal. 25:1625–1634. 2013. View Article : Google Scholar : PubMed/NCBI
|
|
8
|
Gong P, Zhang T, He D and Hsieh JT:
MicroRNA-145 modulates tumor sensitivity to radiation in prostate
cancer. Radiat Res. 184:630–638. 2015. View Article : Google Scholar : PubMed/NCBI
|
|
9
|
Weidhaas JB, Babar I, Nallur SM, Trang P,
Roush S, Boehm M, Gillespie E and Slack FJ: MicroRNAs as potential
agents to alter resistance to cytotoxic anticancer therapy. Cancer
Res. 67:11111–11116. 2007. View Article : Google Scholar : PubMed/NCBI
|
|
10
|
Balça-Silva J, Neves Sousa S, Gonçalves
AC, Abrantes AM, Casalta-Lopes J, Botelho MF, Sarmento-Ribeiro AB
and Silva HC: Effect of miR-34b overexpression on the
radiosensitivity of non-small cell lung cancer cell lines.
Anticancer Res. 32:1603–1609. 2012.PubMed/NCBI
|
|
11
|
Camphausen K, Purow B, Sproull M, Scott T,
Ozawa T, Deen DF and Tofilon PJ: Orthotopic growth of human glioma
cells quantitatively and qualitatively influences radiation-induced
changes in gene expression. Cancer Res. 65:10389–10393. 2005.
View Article : Google Scholar : PubMed/NCBI
|
|
12
|
Pawlik A, Delmar P, Bosse S, Sainz L,
Petat C, Pietu G, Thierry D and Tronik-Le Roux D: Changes in
transcriptome after in vivo exposure to ionising radiation reveal a
highly specialised liver response. Int J Radiat Biol. 85:656–671.
2009. View Article : Google Scholar : PubMed/NCBI
|
|
13
|
Buch K, Peters T, Nawroth T, Sänger M,
Schmidberger H and Langguth P: Determination of cell survival after
irradiation via clonogenic assay versus multiple MTT Assay-a
comparative study. Radiat Oncol. 7:12012. View Article : Google Scholar : PubMed/NCBI
|
|
14
|
Barrett T, Wilhite SE, Ledoux P,
Evangelista C, Kim IF, Tomashevsky M, Marshall KA, Phillippy KH,
Sherman PM, Holko M, et al: NCBI GEO: Archive for functional
genomics data sets-update. Nucleic Acids Res. 41:(Database issue).
D991–D995. 2013. View Article : Google Scholar : PubMed/NCBI
|
|
15
|
Griffiths-Jones S, Grocock RJ, van Dongen
S, Bateman A and Enright AJ: miRBase: microRNA sequences, targets
and gene nomenclature. Nucleic Acids Res. 34:D140–D144. 2006.
View Article : Google Scholar : PubMed/NCBI
|
|
16
|
Wang J, Duncan D, Shi Z and Zhang B:
WEB-based GEne SeT AnaLysis Toolkit (WebGestalt): Update 2013.
Nucleic Acids Res. 41:(Web Server issue). W77–W83. 2013. View Article : Google Scholar : PubMed/NCBI
|
|
17
|
Paraskevopoulou MD, Georgakilas G,
Kostoulas N, Vlachos IS, Vergoulis T, Reczko M, Filippidis C,
Dalamagas T and Hatzigeorgiou AG: DIANA-microT web server v5.0:
Service integration into miRNA functional analysis workflows.
Nucleic Acids Res. 41:(Web Server issue). W169–W173. 2013.
View Article : Google Scholar : PubMed/NCBI
|
|
18
|
Vlachos IS, Kostoulas N, Vergoulis T,
Georgakilas G, Reczko M, Maragkakis M, Paraskevopoulou MD,
Prionidis K, Dalamagas T and Hatzigeorgiou AG: DIANA miRPath v.2.0:
Investigating the combinatorial effect of microRNAs in pathways.
Nucleic Acids Res. 40:(Web Server issue). W498–W504. 2012.
View Article : Google Scholar : PubMed/NCBI
|
|
19
|
Livak KJ and Schmittgen TD: Analysis of
relative gene expression data using real-time quantitative pcr and
the 2(−Delta Delta C(T)) method. Methods. 25:402–408. 2001.
View Article : Google Scholar : PubMed/NCBI
|
|
20
|
Butkytė S, Čiupas L, Jakubauskienė E,
Vilys L, Mocevicius P, Kanopka A and Vilkaitis G:
Splicing-dependent expression of microRNAs of mirtron origin in
human digestive and excretory system cancer cells. Clin
Epigenetics. 8:332016. View Article : Google Scholar : PubMed/NCBI
|
|
21
|
Rashi-Elkeles S, Elkon R, Shavit S,
Lerenthal Y, Linhart C, Kupershtein A, Amariglio N, Rechavi G,
Shamir R and Shiloh Y: Transcriptional modulation induced by
ionizing radiation: p53 remains a central player. Mol Oncol.
5:336–348. 2011. View Article : Google Scholar : PubMed/NCBI
|
|
22
|
Fei P and El-Deiry WS: P53 and radiation
responses. Oncogene. 22:5774–5783. 2003. View Article : Google Scholar : PubMed/NCBI
|
|
23
|
Mirzayans R, Andrais B, Scott A and Murray
D: New insights into p53 signaling and cancer cell response to DNA
damage: Implications for cancer therapy. J Biomed Biotechnol.
2012:1703252012. View Article : Google Scholar : PubMed/NCBI
|
|
24
|
Willis N and Rhind N: Regulation of DNA
replication by the S-phase DNA damage checkpoint. Cell Division.
4:132009. View Article : Google Scholar : PubMed/NCBI
|
|
25
|
Cazzalini O, Scovassi AI, Savio M, Stivala
LA and Prosperi E: Multiple roles of the cell cycle inhibitor
p21CDKN1A in the DNA damage response. Mutat Res. 704:12–20. 2010.
View Article : Google Scholar : PubMed/NCBI
|
|
26
|
Shepperd LA, Meadows JC, Sochaj AM,
Lancaster TC, Zou J, Buttrick GJ, Rappsilber J, Hardwick KG and
Millar JB: Phosphodependent recruitment of Bub1 and Bub3 to
Spc7/KNL1 by Mph1 kinase maintains the spindle checkpoint. Curr
Biol. 22:891–899. 2012. View Article : Google Scholar : PubMed/NCBI
|
|
27
|
Formenti SC and Demaria S: Combining
radiotherapy and cancer immunotherapy: A paradigm shift. J Natl
Cancer Inst. 105:256–265. 2013. View Article : Google Scholar : PubMed/NCBI
|
|
28
|
Derer A, Deloch L, Rubner Y, Fietkau R,
Frey B and Gaipl US: Radio-immunotherapy-induced immunogenic cancer
cells as basis for induction of systemic anti-tumor immune
responses-pre-clinical evidence and ongoing clinical applications.
Front Immunol. 6:5052015. View Article : Google Scholar : PubMed/NCBI
|
|
29
|
Wattenberg MM, Fahim A, Ahmed MM and Hodge
JW: Unlocking the combination: Potentiation of radiation-induced
antitumor responses with immunotherapy. Radiat Res. 182:126–138.
2014. View Article : Google Scholar : PubMed/NCBI
|
|
30
|
O'Shea JJ, Schwartz DM, Villarino AV,
Gadina M, McInnes IB and Laurence A: The JAK-STAT pathway: Impact
on human disease and therapeutic intervention. Annu Rev Med.
66:311–328. 2015. View Article : Google Scholar : PubMed/NCBI
|
|
31
|
Au-Yeung N, Mandhana R and Horvath CM:
Transcriptional regulation by STAT1 and STAT2 in the interferon
JAK-STAT pathway. JAKSTAT. 2:e239312013.PubMed/NCBI
|
|
32
|
Cheon H, Holvey-Bates EG, Schoggins JW,
Forster S, Hertzog P, Imanaka N, Rice CM, Jackson MW, Junk DJ and
Stark GR: IFNβ-dependent increases in STAT1, STAT2, and IRF9
mediate resistance to viruses and DNA damage. EMBO J. 32:2751–2763.
2013. View Article : Google Scholar : PubMed/NCBI
|
|
33
|
Stegeman H, Kaanders JH, Verheijen MM,
Peeters WJ, Wheeler DL, Iida M, Grénman R, van der Kogel AJ, Span
PN and Bussink J: Combining radiotherapy with MEK1/2, STAT5 or
STAT6 inhibition reduces survival of head and neck cancer lines.
Mol Cancer. 12:1332013. View Article : Google Scholar : PubMed/NCBI
|
|
34
|
Kalbasi A, June CH, Haas N and Vapiwala N:
Radiation and immunotherapy: A synergistic combination. J Clin
Invest. 123:2756–2763. 2013. View Article : Google Scholar : PubMed/NCBI
|
|
35
|
Frey B, Rubner Y, Kulzer L, Werthmöller N,
Weiss EM, Fietkau R and Gaipl US: Antitumor immune responses
induced by ionizing irradiation and further immune stimulation.
Cancer Immunol Immunother. 63:29–36. 2014. View Article : Google Scholar : PubMed/NCBI
|
|
36
|
Dewan MZ, Galloway AE, Kawashima N,
Dewyngaert JK, Babb JS, Formenti SC and Demaria S: Fractionated but
not single-dose radiotherapy induces an immune-mediated abscopal
effect when combined with anti-CTLA-4 antibody. Clin Cancer Res.
15:5379–5388. 2009. View Article : Google Scholar : PubMed/NCBI
|
|
37
|
Schaue D, Ratikan JA, Iwamoto KS and
McBride WH: Maximizing tumor immunity with fractionated radiation.
Int J Radiat Oncol Biol Phys. 83:1306–1310. 2012. View Article : Google Scholar : PubMed/NCBI
|
|
38
|
Kulzer L, Rubner Y, Deloch L, Allgäuer A,
Frey B, Fietkau R, Dörrie J, Schaft N and Gaipl US: Norm- and
hypo-fractionated radiotherapy is capable of activating human
dendritic cells. J Immunotoxicol. 11:328–336. 2014. View Article : Google Scholar : PubMed/NCBI
|
|
39
|
Metheetrairut C and Slack FJ: MicroRNAs in
the ionizing radiation response and in radiotherapy. Curr Opin
Genet Dev. 23:12–19. 2013. View Article : Google Scholar : PubMed/NCBI
|
|
40
|
Hermeking H: p53 Enters the MicroRNA
World. Cancer Cell. 12:414–418. 2007. View Article : Google Scholar : PubMed/NCBI
|
|
41
|
Girardi C, De Pittà C, Casara S, Sales G,
Lanfranchi G, Celotti L and Mognato M: Analysis of miRNA and mRNA
expression profiles highlights alterations in ionizing radiation
response of human lymphocytes under modeled microgravity. PLoS One.
7:e312932012. View Article : Google Scholar : PubMed/NCBI
|
|
42
|
Josson S, Sung SY, Lao K, Chung LW and
Johnstone PA: Radiation modulation of microRNA in prostate cancer
cell lines. Prostate. 68:1599–1606. 2008. View Article : Google Scholar : PubMed/NCBI
|
|
43
|
Leung CM, Chen TW, Li SC, Ho MR, Hu LY,
Liu WS, Wu TT, Hsu PC, Chang HT and Tsai KW: MicroRNA expression
profiles in human breast cancer cells after multifraction and
single-dose radiation treatment. Oncol Rep. 31:2147–2156.
2014.PubMed/NCBI
|
|
44
|
Jayaswal V, Lutherborrow M, Ma DD and Yang
Hwa Y: Identification of microRNAs with regulatory potential using
a matched microRNA-mRNA time-course data. Nucleic Acids Res.
37:e602009. View Article : Google Scholar : PubMed/NCBI
|
|
45
|
Hermeking H: MicroRNAs in the p53 network:
Micromanagement of tumour suppression. Nat Rev Cancer. 12:613–626.
2012. View Article : Google Scholar : PubMed/NCBI
|
|
46
|
Cannell IG, Kong YW, Johnston SJ, Chen ML,
Collins HM, Dobbyn HC, Elia A, Kress TR, Dickens M, Clemens MJ, et
al: p38 MAPK/MK2-mediated induction of miR-34c following DNA damage
prevents Myc-dependent DNA replication. Proc Natl Acad Sci USA.
107:5375–5380. 2010. View Article : Google Scholar : PubMed/NCBI
|
|
47
|
Achari C, Winslow S, Ceder Y and Larsson
C: Expression of miR-34c induces G2/M cell cycle arrest in breast
cancer cells. BMC Cancer. 14:5382014. View Article : Google Scholar : PubMed/NCBI
|
|
48
|
Li F, Chen H, Huang Y, Zhang Q, Xue J, Liu
Z and Zheng F: miR-34c plays a role of tumor suppressor in HEC1-B
cells by targeting E2F3 protein. Oncol Rep. 33:3069–3074.
2015.PubMed/NCBI
|
|
49
|
Luo J, Chen J and He L: mir-129-5p
attenuates irradiation-induced autophagy and decreases
radioresistance of breast cancer cells by targeting HMGB1. Med Sci
Monit. 21:4122–4129. 2015. View Article : Google Scholar : PubMed/NCBI
|
|
50
|
Li XH, Ha CT, Fu D and Xiao M:
Micro-RNA30c negatively regulates REDD1 expression in human
hematopoietic and osteoblast cells after gamma-irradiation. PLoS
One. 7:e487002012. View Article : Google Scholar : PubMed/NCBI
|
|
51
|
Gregersen LH, Jacobsen AB, Frankel LB, Wen
J, Krogh A and Lund AH: MicroRNA-145 targets in colon cancer cells.
PLoS One. 5:e88362010. View Article : Google Scholar : PubMed/NCBI
|