Introduction
Pancreatic neuroendocrine tumors (PanNETs) are
considered to be rare neoplasms, accounting for 1–2% of all
pancreatic neoplasms (1). However,
the diagnosed incidence of PanNET is increasing owing to the
development of imaging technologies (2). PanNETs constitute a heterogeneous group
of neoplasms (3) whose clinical and
biological behavior ranges from benign to highly aggressive
(4,5).
The World Health Organization (WHO) has published
several studies concerning the classification of neuroendocrine
tumors (NETs) (6–8). A recent study classified NETs into NET
grade 1 (G1), NET grade 2 (G2) or neuroendocrine carcinoma (NEC)
based on pathological parameters, including the cell mitotic count
and the Ki-67 proliferation index (8). NET G1 and G2 are well-differentiated
tumor types, whereas NECs are poorly differentiated. G1 and G2
tumors exhibit different biological behaviors (1). Given that G2 tumors may possess more
malignant features than G1 tumors, the pretreatment identification
of NET grade is important in determining treatment strategy
(9).
Numerous imaging methods have been employed for
PanNET detection, including endoscopic ultrasound, computed
tomography (CT), magnetic resonance imaging (MRI) and positron
emission tomography (PET)/CT. The findings of PanNET imaging have
been widely investigated; however, the biological features of a
PanNET cannot be fully evaluated until the entire tumor has been
resected (10). Recently, several
studies have also tried to evaluate the grade and aggressiveness of
PanNET using imaging techniques, including contrast-enhanced CT
(11,12), contrast-enhanced MRI (5), diffusion-weighted magnetic resonance
imaging (DWI) (5) and fludeoxyglucose
(FDG)-PET (13). These studies showed
that these imaging techniques may be useful for differentiating
benign PanNETs (G1 and G2) from non-benign PanNET (NEC). However,
these studies did not show whether the imaging approach alone could
differentiate between G1 and G2 tumors.
DWI is a functional modality that detects the random
diffusion of water protons within biological tissues (14). It has been suggested that increased
tumor cellularity causes a decrease in extracellular space, which
may result in greater restriction of water diffusion (15). Recently, DWI has been used to predict
the tumor staging, the tumor grade and the prognosis in a variety
of neoplasms (16,17). Tumor cellularity differs between
PanNET G1 and PanNET G2. Thus, DWI could also be used to predict
the PanNET grade. Based on 30 PanNET patients undergoing DWI
scanning, Kim et al showed that DWI is useful for
differentiating between PanNET G1 and PanNET G2 (2). However, to the best of our knowledge, no
further studies have been performed on a larger population and the
correlation between histopathological characteristics and apparent
diffusion coefficient (ADC) has not been described. The aim of the
present study was therefore to investigate the value of DWI in
well-differentiated PanNET grading, and to identify the association
between histopathological characteristics and ADC values.
Materials and methods
Patient selection
This retrospective study complied with the
recommendations of our Institutional Review Board (The First
Affiliated Hospital, College of Medicine Zhejiang University) and
formal consent was waived. Between February 2012 and October 2014,
52 patients with proven PanNET (not including NEC) were considered
for inclusion in this study. A total of 6 patients were excluded
from this study owing to missing clinic records or DWI imaging
sequences. In addition, 2 patients were excluded, as their tumors
were not classified according to the WHO classification. A total of
44 patients with surgery-proven PanNET were finally evaluated in
the study. In this study, PanNET was divided into NET G1 and NET G2
according to the updated WHO classification for neuroendocrine
tumors (7).
MRI study
Upper abdominal MRI was performed using a Signa HDx
3.0-T unit (GE Healthcare Bio-Sciences, Pittsburgh, PA, USA) (n=26)
or Achieva 3.0-T (Philips Medical Systems B.V., Eindhoven, The
Netherlands) (n=18) using eight-channel phased-array torso coils.
Patients fasted for 8 h prior to MRI examination. Fat-suppressed
liver acquisition with volume acceleration (GE Signa HDxt 3.0-T MRI
unit; TR/TE, 3.1/1.5 msec) or 3D T1-weighted high-resolution
isotropic volume examinations (Philips Achieva 3.0-T MRI unit;
TR/TE, 4.0/1.9 msec) imaging sequences (with and without
gadolinium) and a single-shot fast-spin-echo T2-weighted sequence
(TR/TE, 5,000–8,000/80 msec), with a 4–5-mm slice thickness, 1-mm
interslice gap, 384×256 matrix and 30–35-cm field of view, were
performed on each patient. DWI was performed using the single-shot
echo-planar imaging technique (TR/TE, 6,000–8,000/6–70 msec) with
b-values of 0 and 1,000 sec/mm2. Following the
intravenous injection of 0.1 mmol/kg gadolinium (2.5 ml/sec), axial
and sagittal turbo-FLASH T1 images were obtained.
MRI analysis
Two experienced gastrointestinal radiologists (with
>8 years of experience in abdominal MRI reading) were blinded to
the clinical and pathological findings when analyzing the images.
All images were reviewed on a picture archiving communication
system and extended to an MR workstation for quantitative analysis.
The imaging parameters included the tumor position, tumor size,
tumor margin (well-circumscribed or ill-defined border), the
presence of cystic components (solid or cystic-solid), and the
presence or absence of enhancement. The presence of dilated
pancreatic ducts and metastases was also recorded. Cystic lesions
within the tumor were identified as areas that were hypointense on
pre-contrast T1-weighted images, markedly hyperintense on
T2-weighted images and presented with non-enhancement.
ADC maps of lesions were reconstructed at the
workstation based on the b-values (0 and 1,000 sec/mm2).
ADC values for the tumor and the normal pancreas were measured. A
region of interest (ROI) was manually drawn along the tumor border
in an image that showed the tumor at its maximum dimension,
avoiding necrotic or cystic components. A similar ROI was manually
drawn in the normal pancreas, avoiding the main duct. The ADC
values were measured at least three times by each radiologist and
the mean was calculated from the data obtained by the two
radiologists.
Histological analysis
Pathological specimens were observed by light
microscopy and immunohistochemical analysis. Briefly, the specimens
were fixed in 4% paraformaldehyde at 4°C for 72 h, dehydrated
through a series of ascending ethanol solutions (40–100%), embedded
in paraffin and sliced at 5 µm for hematoxylin and eosin staining.
For immunohistochemical staining, the sections were incubated with
5% BSA to block non-specific staining, and then incubated with an
anti-Ki-67 monoclonal antibody (ab1667; dilution, 1:100; Abcam,
Cambridge, MA, USA) overnight at 4°C. The PanNETs were divided into
PanNET G1 and PanNET G2, according to the updated WHO
classification for neuroendocrine tumors, i.e., according to the
mitotic incidence per 10 high-power fields (HPFs) or Ki-67
proliferation index (percentage of positive cells in areas of
highest nuclear labeling). If the mitotic count was <2/10 HPFs
and/or the Ki-67 index was ≤2, the tumor was diagnosed as NET G1.
If the mitotic count was 2–20/10 HPFs and/or the Ki-67 index was
3–20, the tumor was diagnosed as NET G2.
Statistical analysis
The data were analyzed using SPSS 16.0 (SPSS, Inc.,
Chicago, IL, USA) and Medcalc software (Ostend, Belgium).
Quantitative data were shown as the mean ± standard deviation (SD)
and were analyzed by an independent-sample t-test or one-way
analysis of variance. Qualitative data were represented as
percentages and were analyzed using the χ2 test or
Fisher's exact test. Spearman's rank correlation analysis was
adopted to assess the correlation between ADC values and
histopathological variables. Receiver operating characteristic
(ROC) curves were adopted to determine the cut-off values of ADC
and its sensitivity, specificity and accuracy of prediction.
P<0.05 was considered to indicate a statistically significant
difference.
Results
Patient characteristics
The characteristics of the PanNET patients are
listed in Table I. Patient ages range
from 30 to 76 years (mean ± SD, 52.8±10.1 years). In total, 27
(61.4%) patients were female and 17 (38.6%) patients were male.
Overall, 17 (38.6%) patients were asymptomatic. Abdominal pain,
confusion of consciousness, dizziness and hypodynamia was observed
in 8, 5, 6 and 3 patients, respectively. According to the WHO
classification, PanNET G1 tumors were observed in 34 patients
(77.3%) and PanNET G2 tumors were observed in 10 patients (22.7%).
A total of 23 lesions were observed in the pancreatic head and
neck, and 21 lesions were observed in the body and tail. The size
of the masses ranged from 0.8 to 6.5 cm, with a mean diameter of
2.4±1.6 cm. The mean levels of carcinoembryonic antigen, cancer
antigen 19–9 and blood glucose were 5.35 ng/ml (normal reference
level, <5 ng/ml), 51.2 kU/l (normal reference level, <37
kU/l) and 4.9 mmol/l (normal reference level, <6.1 mmol/l),
respectively.
 | Table I.Clinical data of patients. |
Table I.
Clinical data of patients.
| Variables | Value |
|---|
| Mean age (range),
years | 52.8 (30–76) |
| Gender, n (%) |
|
| Male | 17 (38.6) |
|
Female | 27 (61.4) |
| Clinical symptoms, n
(%) |
|
| Abdominal
pain | 8 (18.2) |
| Confusion
of consciousness | 5 (11.4) |
|
Dizziness | 6 (13.6) |
|
Hypodynamia | 3 (6.8) |
|
Others | 5 (11.4) |
|
Asymptomatic | 17 (38.6) |
| WHO classification, n
(%) |
|
| G1 | 34 (77.3) |
| G2 | 10 (22.7) |
| Location, n (%) |
|
|
Pancreatic head/neck | 23 (52.3) |
|
Pancreatic body/tail | 21 (47.7) |
| Size (range),
cma | 2.4±1.6
(0.8–6.5) |
| CEA,
ng/mla | 5.4±19.9 |
| CA199,
ku/la | 51.2±188.9 |
| Blood glucose,
mmol/la | 4.9±1.37 |
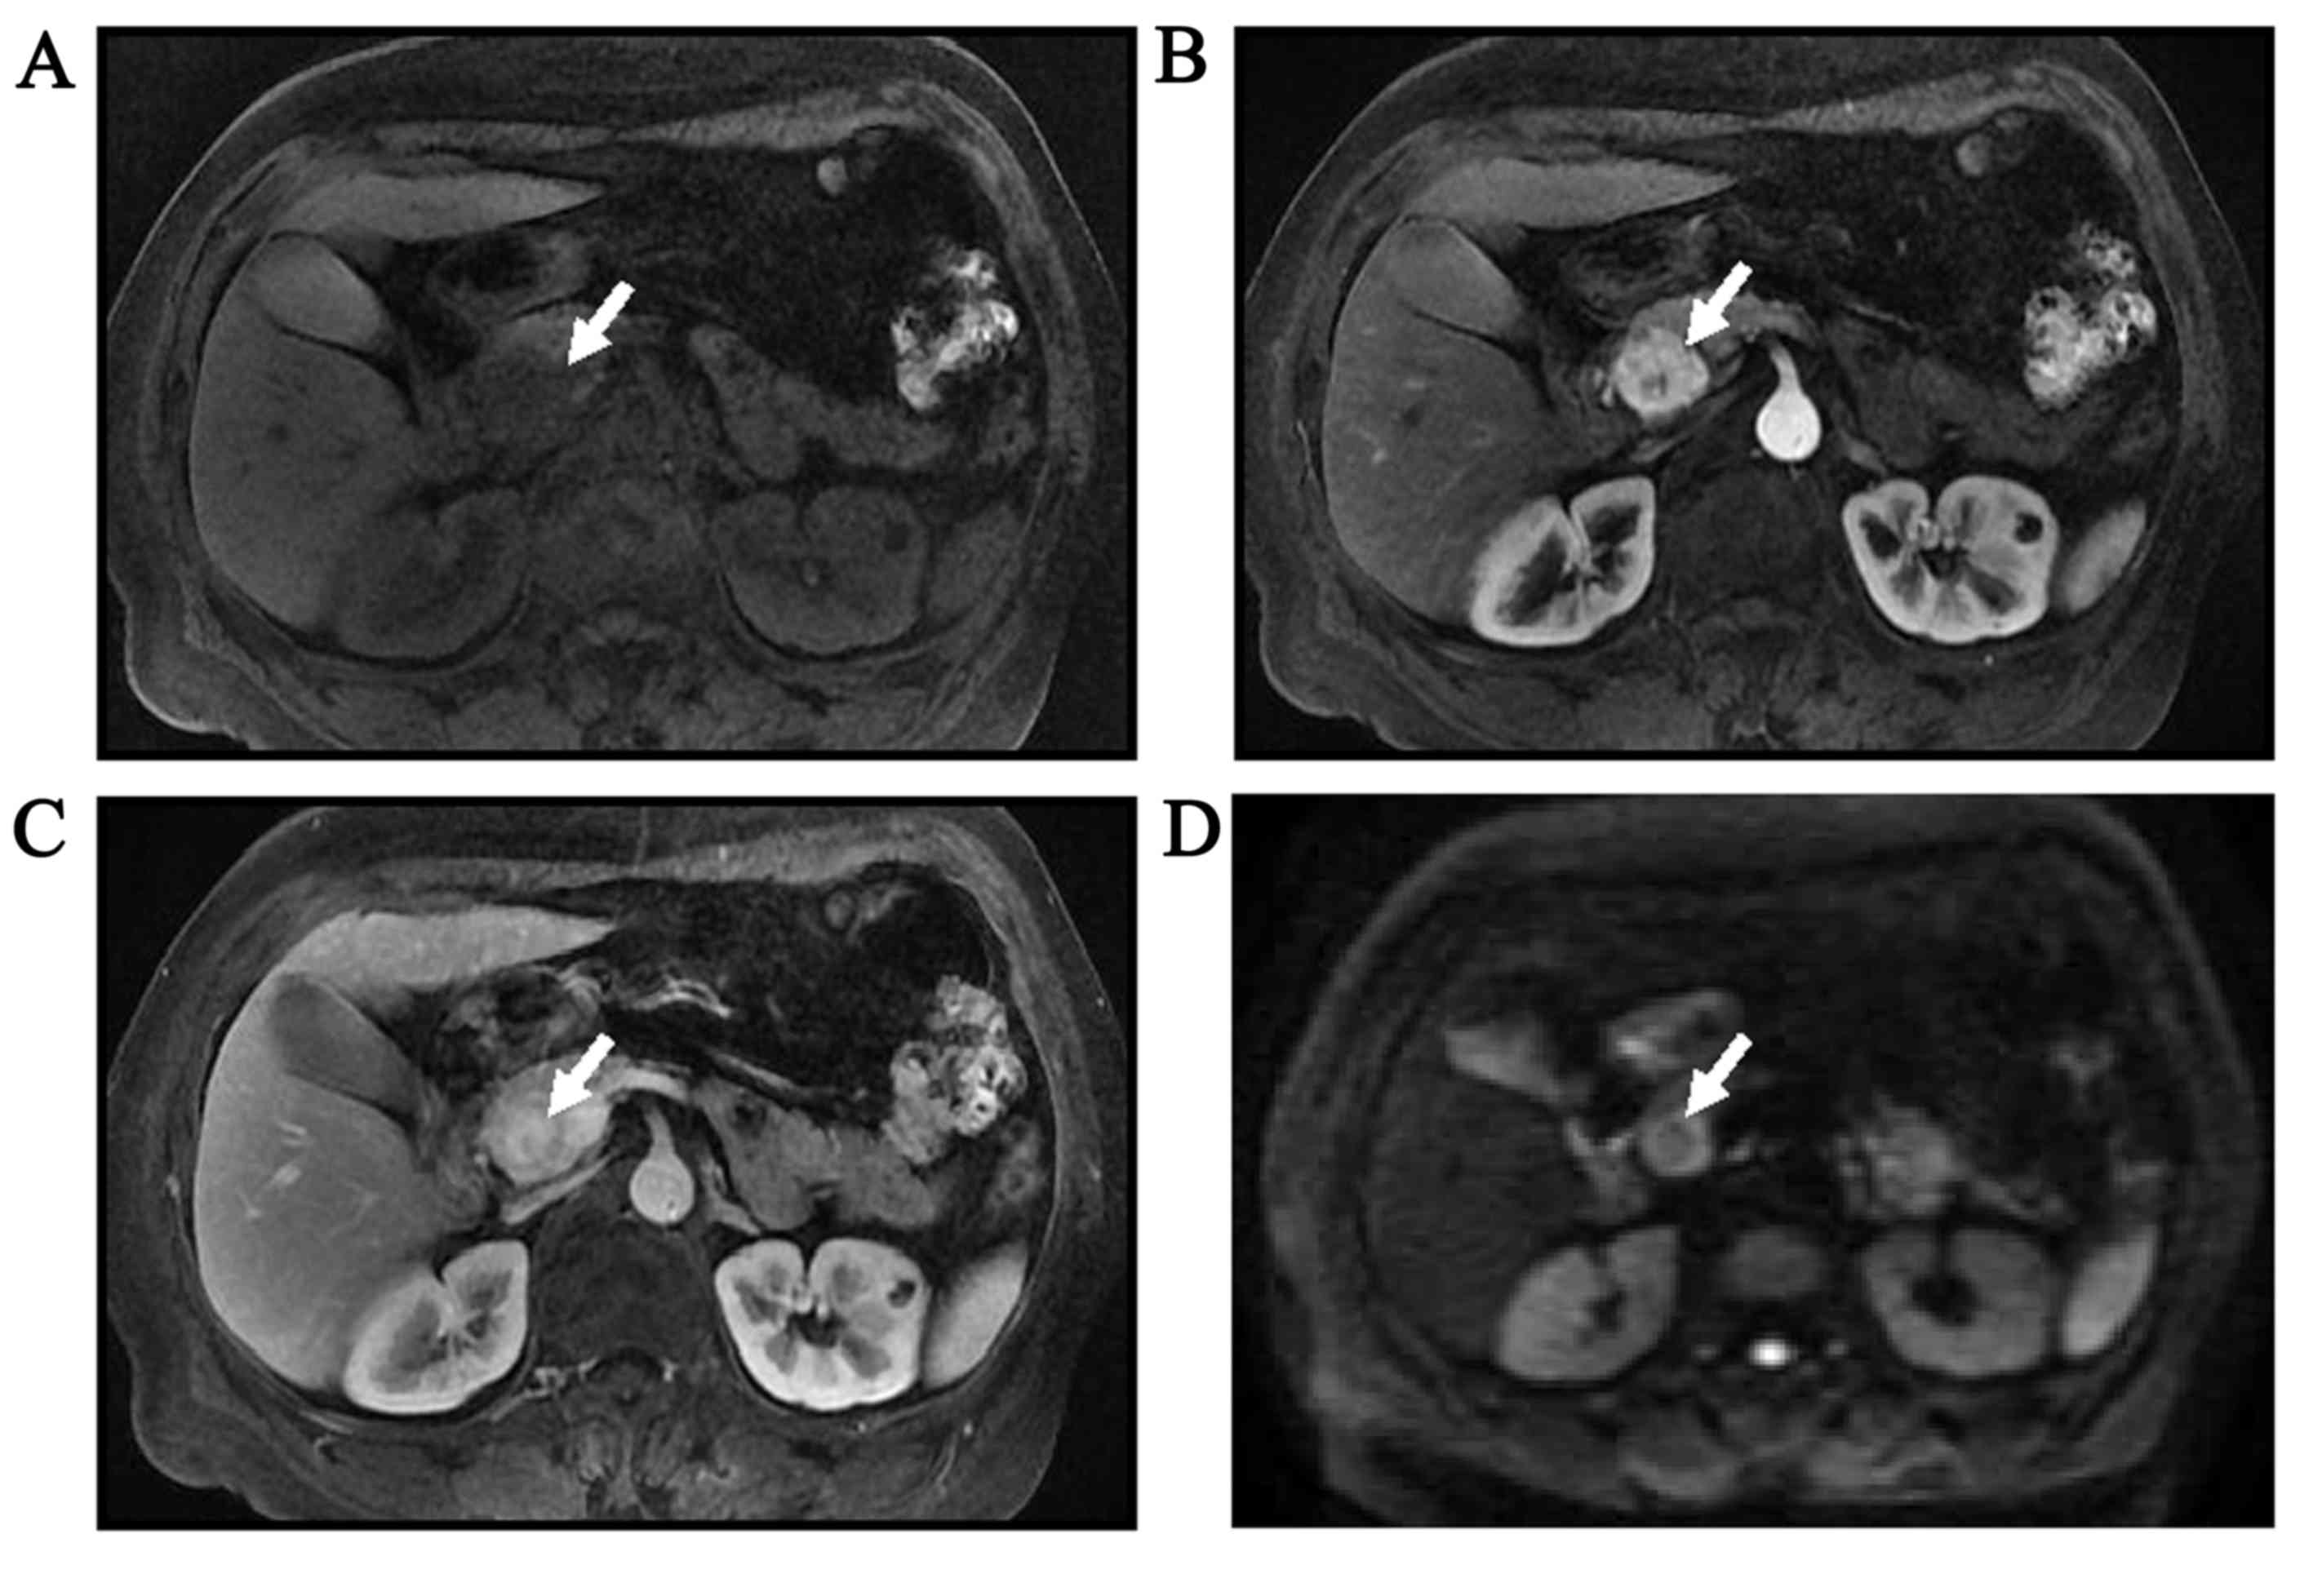
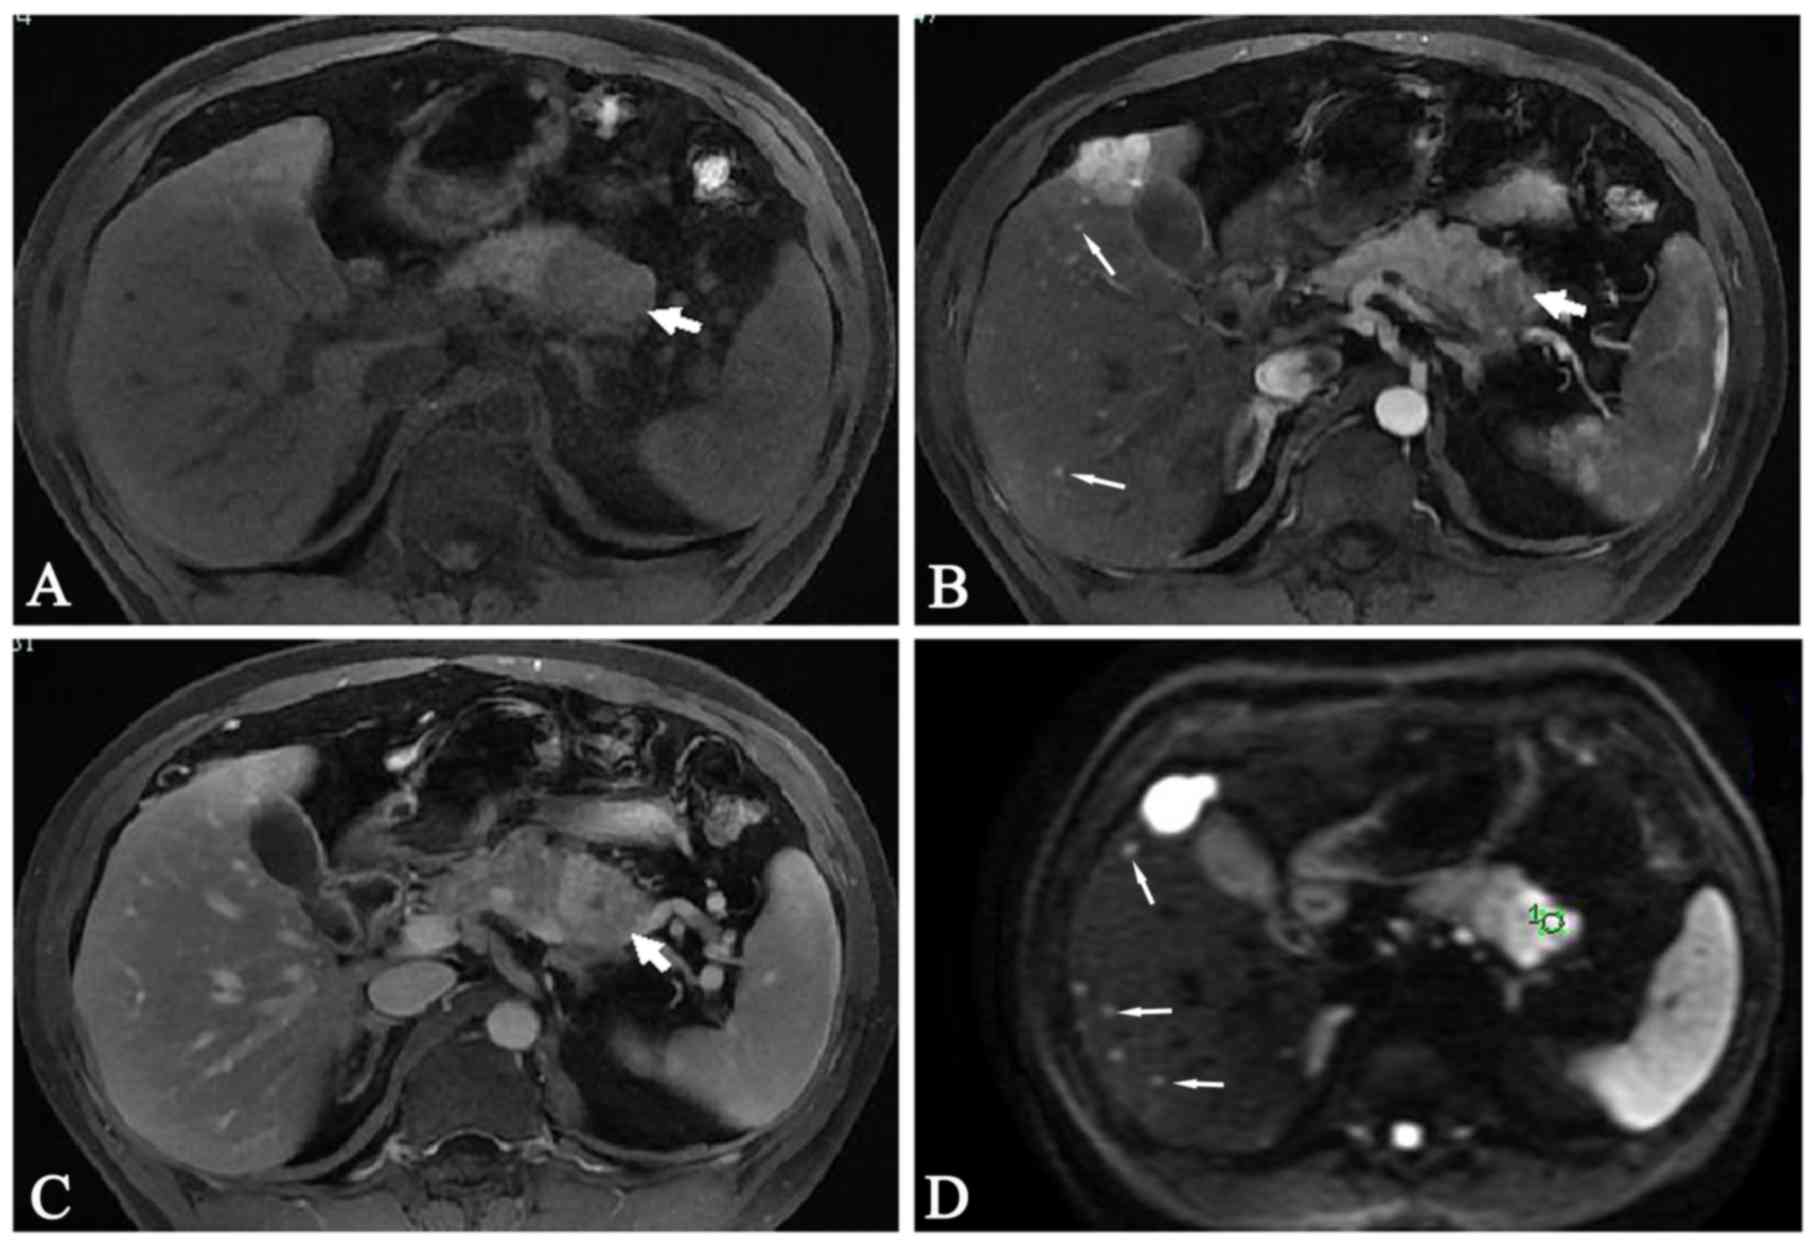
MRI findings of PanNET G1 and PanNET
G2
Table II summarizes
the MRI findings of PanNET. A common MRI finding for PanNET G2
compared with PanNET G1 was ill-defined tumor borders (P=0.009). In
total, 3 patients (30.0%) with PanNET G2 exhibited tumors with
ill-defined borders, whereas all PanNET G1 patients exhibited
tumors with well-circumscribed borders. Lymph node metastases or
distal metastases were more often observed in PanNET G2 compared
with G1 tumors (P<0.05). No differences in solid and cystic
pattern, enhancement, MRI signal of parenchyma, pancreatic duct
dilation or size were observed between PanNET G1 and PanNET G2
tumors. A total of 10 patients with PanNET G1 and 8 patients with
PanNET G2 showed marked hyperintensity in DWI images (P=0.008). The
T1-weighted unenhanced and gadolinium-enhanced images of PanNET G1
and G2 are shown in Figs. 1 and
2.
| Table II.Summary of MRI findings. |
Table II.
Summary of MRI findings.
|
| Tumor grade, n |
|
|---|
|
|
|
|
|---|
| MRI findings | PanNET G1 (n=34) | PanNET G2 (n=10) | Total | P-value |
|---|
| Shape |
|
|
| 0.01 |
|
Well-circumscribed | 34 | 7 | 40 |
|
|
Ill-defined borders | 0 | 3 | 4 |
|
| Solid and cystic
pattern |
|
|
| 0.51 |
|
Solid | 5 | 2 | 7 |
|
|
Cystic-solid | 29 | 8 | 37 |
|
| MRI enhancement |
|
|
| 0.59 |
|
Homogeneous | 8 | 2 | 10 |
|
|
Heterogeneous | 26 | 8 | 34 |
|
| MRI signal of
tumor |
|
|
|
|
|
TIWI |
|
|
| 0.41 |
|
Isointense | 7 | 1 | 8 |
|
|
Hypointense | 27 | 9 | 36 |
|
|
T2WI |
|
|
| 0.58 |
|
Isointense | 5 | 1 | 6 |
|
|
Hyperintense | 29 | 9 | 38 |
|
|
DWI |
|
|
| 0.01 |
|
Moderate hyperintense | 24 | 2 | 26 |
|
| Marked
hyperintense | 10 | 8 | 18 |
|
| P-duct
dilation | 4 | 1 | 5 | 0.68 |
| Lymph node or
distal metastases | 0 | 2 | 2 | 0.05 |
| Size | 2.2±1.6 | 3.1±1.8 |
| 0.14 |
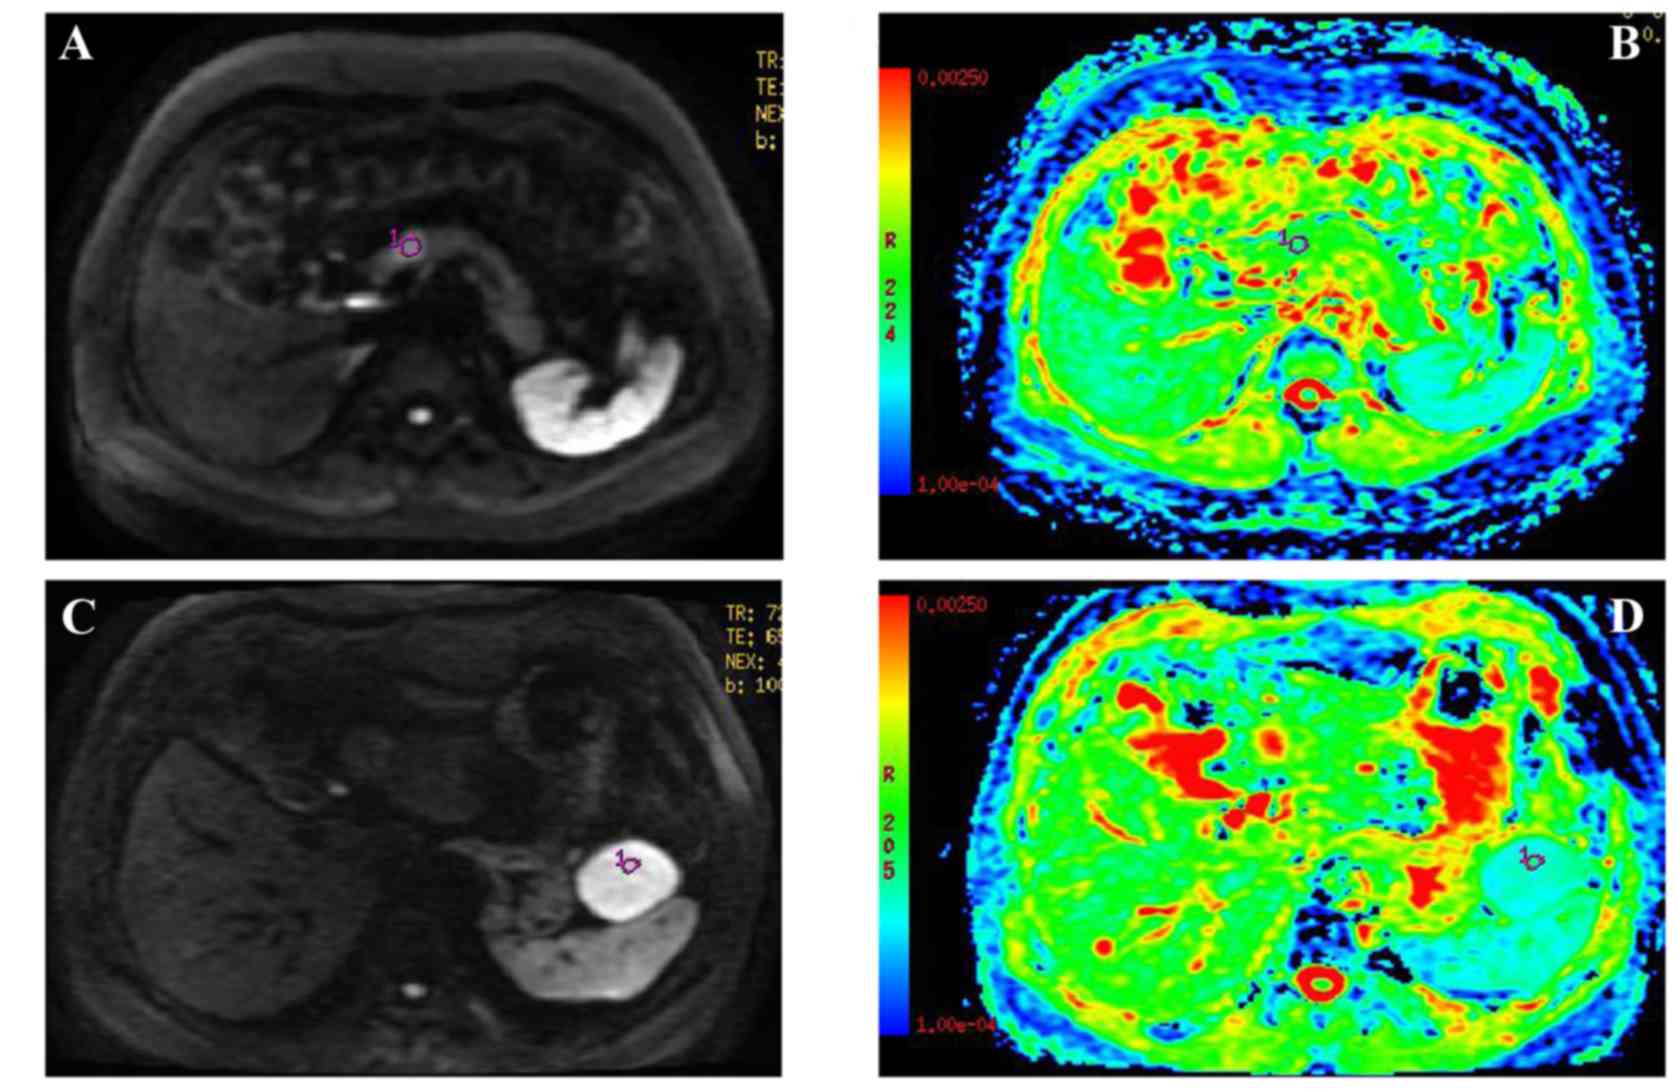
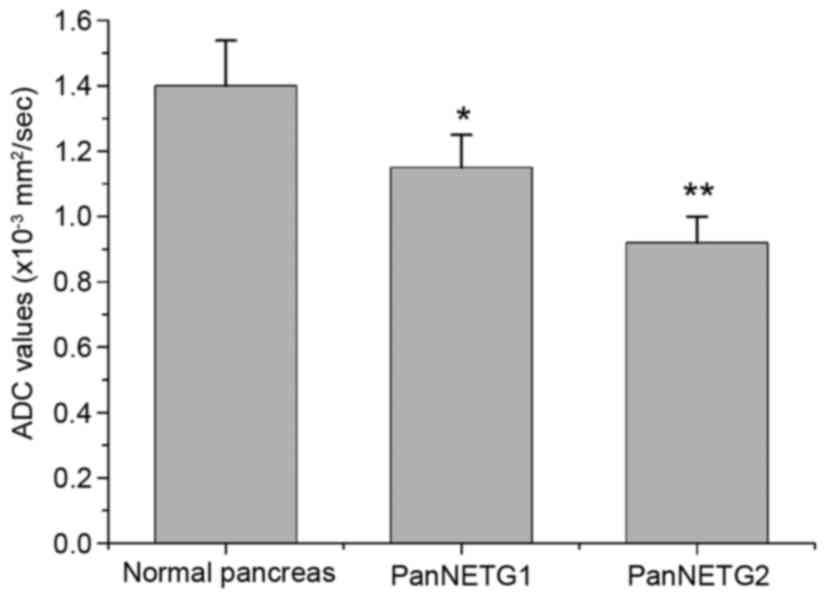
The DWI and ADC maps of PanNET G1 and PanNET G2 are
shown in Fig. 3. Fig. 4 shows mean ADC values, which are
significantly different between the normal pancreas and PanNET G1
(P<0.01), between the normal pancreas and PanNET G2 (P<0.01),
and between PanNET G1 and PanNET G2 (P<0.05).
Correlation between ADC values and
pathological parameters
Negative correlations were found between ADC values
and the Ki-67 proliferation index (r=−0.132, P=0.031), mitotic
count (r=−0.124, P=0.04) and PanNET grade (r=−0.159, P=0.006).
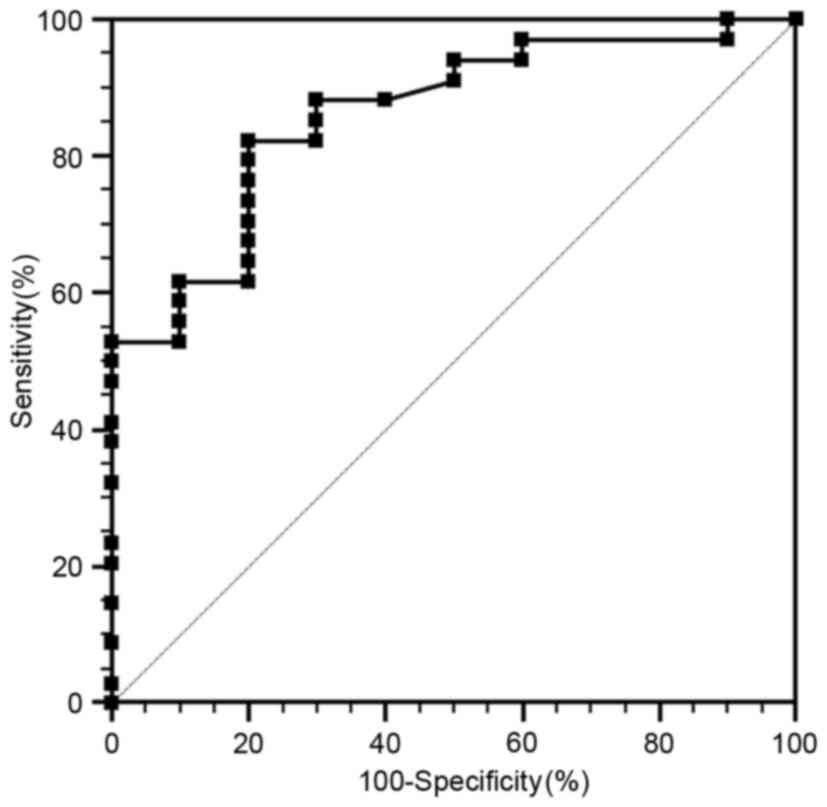
ROC analysis
ROC curves were used to determine the cut-off values
that differentiate PanNET G1 from PanNET G2 (Fig. 5). The area under the curve (AUC) is
0.81. The cut-off value is 0.930×10⁻³
mm2/sec, with 82.4% sensitivity and 79.5% specificity
for predicating PanNET G2 tumors.
Discussion
Determination of the lesion grade prior to surgical
resection would allow for the appropriate treatment to be
administered. Several imaging approaches have been used to
discriminate between presumably benign and malignant PanNET.
However, few studies have used imaging methods to differentiate
between PanNET G1 and PanNET G2 (2).
In the present study, the data showed that ADC values correlate
with the Ki-67 proliferation index, mitotic count and PanNET grade.
The findings in the study further demonstrated that DWI can be used
to discriminate between PanNET G1 and PanNET G2, with acceptable
sensitivity and specificity.
PanNETs are considered to be hypervascular tumors.
Therefore, contrast-enhanced CT and MRI have been used to
discriminate between presumably benign and malignant PanNET
(5,11,12).
Cappelli et al (11)
demonstrated that the CT contrast enhancement pattern may
preoperatively associate with PanNET behavior and WHO grade. Kim
et al (12) showed that NEC
could be differentiated from G1/G2 by using enhanced CT.
Gadoxetic-acid-enhanced MRI also revealed differences in
enhancement pattern in the arterial phase between benign and
non-benign PanNETs (5). Wang et
al (1) and Jang et al
(5) previously used DWI to assess
differences in ADC values between PanNET subtypes and observed a
significant difference in mean ADC between well-differentiated
PanNET and NEC. PET/CT can also be used for the preoperative
differential diagnosis of PanNETs of varying grades (13). The maximum standardized uptake value
(SUVmax) of NEC tumors is significantly higher than that of G1/G2
tumors, which suggests that FDG-PET is useful for differentiating
NEC PanNETs from G1/G2 PanNETs (13).
However, these studies mainly showed the differential diagnosis of
benign and non-benign PanNETs.
Certain G2 tumors also have metastatic features
(13). Therefore, the differentiation
between G1 and G2 tumors should also be made prior to surgical
resection. Several studies have been conducted to discriminate
between G1 and G2 tumors using imaging methods (1,2,9). Takumi et al (9) showed that enhancements in contrast in
the pancreatic parenchymal and portal venous phase differ
significantly between G1 and G2 tumors. Kim et al (2) reported that ADC values differed
significantly between PanNET G1 and G2, and that the ADC value was
useful for differentiating PanNET G1 from G2. Wang et al
(1) showed that the ADC value of G2
tumors was lower than that of G1 tumors. The results of the present
study are consistent with Kim et al (2) and Wang et al (1). A significant difference was observed
between ADC values for PanNET G1 and G2. Using ADC values to
distinguish G1 from G2 exhibited a sensitivity of 82.4% and
specificity of 79.5%, with an AUC of 0.81. The data further
confirmed that the ADC value is also associated with the grade of
the well-differentiated PanNET.
The ADC value could reflect the degree of water
motion (1). The diffusion of water,
dense cellularity and extracellular space tortuosity are recognized
as the reasons for the decrease in ADC value in malignant tumors.
Previous data have shown that the cell density of G2 tumors is
higher than that of G1 tumors, which may result in a decrease in
the volume of extracellular and intracellular spaces (1). Consequently, the free motion of water
molecules is restricted, resulting in a decrease in ADC values
(18). In addition, the increased
tumor cellularity could also cause the decrease in ADC value
(16). Wang et al (1) speculated that marked fibrosis may also
account for the low ADC values of certain well-differentiated
PanNETs.
On the basis of the WHO PanNET grading
classification, the mitotic count and Ki-67 proliferation index
have been recognized as critical pathological parameters (7,8). PanNETs
are classified as G1 if they have a mitotic count <2 per 10 HPFs
and/or a Ki-67 index <2%, as G2 if they have a mitotic count of
2–20 per 10 HPFs and/or a Ki-67 index of 3–20%, and as NEC if they
have a mitotic count >20 per 10 HPFs and/or a Ki-67 index
>20%. Higher Ki-67 labeling index values are associated with
high-grade malignancy. The present study additionally showed that
ADC value is also associated with histopathological factors,
including mitotic count and Ki-67 proliferation index.
This study had several potential limitations. First,
as PanNETs are rare, the number of patients was relatively small,
particularly for the PanNET G2 patients, which may limit the
statistical power. As such, further studies with large sample sizes
will be required. Second, patients with NEC are not included in
this study, as such tumors were considered unresectable (19). Third, as the results of ROC analysis
are associated with patient population, the data may be different
to other studies and therefore requires validation by future
studies. Finally, as this is a retrospective study, selection bias
may exist.
In conclusion, the present data demonstrated that
well-differentiated PanNET with different WHO classification grades
have varying ADC values. ADC value also correlates with the
pathological parameters of PanNET (the mitotic count and Ki-67
index). ADC value is therefore a valuable imaging parameter in
predicting WHO grade in well-differentiated PanNET.
References
|
1
|
Wang Y, Miller FH, Chen ZE, Merrick L,
Mortele KJ, Hoff FL, Hammond NA, Yaghmai V and Nikolaidis P:
Diffusion-weighted MR imaging of solid and cystic lesions of the
pancreas. Radiographics. 31:E47–E64. 2011. View Article : Google Scholar : PubMed/NCBI
|
|
2
|
Kim JH, Eun HW, Kim YJ, Han JK and Choi
BI: Staging accuracy of MR for pancreatic neuroendocrine tumor and
imaging findings according to the tumor grade. Abdom Imaging.
38:1106–1114. 2013. View Article : Google Scholar : PubMed/NCBI
|
|
3
|
Ehehalt F, Saeger HD, Schmidt CM and
Grützmann R: Neuroendocrine tumors of the pancreas. Oncologist.
14:456–467. 2009. View Article : Google Scholar : PubMed/NCBI
|
|
4
|
Ito T, Sasano H, Tanaka M, Osamura RY,
Sasaki I, Kimura W, Takano K, Obara T, Ishibashi M, Nakao K, et al:
Epidemiological study of gastroenteropancreatic neuroendocrine
tumors in Japan. J Gastroenterol. 45:234–243. 2010. View Article : Google Scholar : PubMed/NCBI
|
|
5
|
Jang KM, Kim SH, Lee SJ and Choi D: The
value of gadoxetic acid-enhanced and diffusion-weighted MRI for
prediction of grading of pancreatic neuroendocrine tumors. Acta
Radiol. 55:140–148. 2014. View Article : Google Scholar : PubMed/NCBI
|
|
6
|
DeLellis RA, Lloyd RV, Heitz P and Eng C:
Pathology and genetics of tumors of endocrine organs. International
Agency for Research on Cancer (IARC); Lyon: pp. 177–182. 2004
|
|
7
|
Klimstra DS, Arnold R and Capella C:
Neuroendocrine neoplasms of the pancreasBosman FT, Carneiro F,
Hruban RH and Theise ND: WHO Classification of Tumours of the
Digestive System. 3. 4th. International Agency for Research on
Cancer (IARC); Lyon: pp. 322–326. 2010;
|
|
8
|
Bosman FT, Carneiro F, Hruban RH and
Theise N: WHO classification of tumours of the digestive system.
Lyon: IARC Press; 2010;
|
|
9
|
Takumi K, Fukukura Y, Higashi M, Ideue J,
Umanodan T, Hakamada H, Kanetsuki I and Yoshiura T: Pancreatic
neuroendocrine tumors: Correlation between the contrast-enhanced
computed tomography features and the pathological tumor grade. Eur
J Radiol. 84:1436–1443. 2015. View Article : Google Scholar : PubMed/NCBI
|
|
10
|
Rindi G and Wiedenmann B: Neuroendocrine
neoplasms of the gut and pancreas: New insights. Nat Rev
Endocrinol. 8:54–64. 2012. View Article : Google Scholar
|
|
11
|
Cappelli C, Boggi U, Mazzeo S, Cervelli R,
Campani D, Funel N, Contillo BP and Bartolozzi C: Contrast
enhancement pattern on multidetector CT predicts malignancy in
pancreatic endocrine tumours. Eur Radiol. 25:751–759. 2015.
View Article : Google Scholar : PubMed/NCBI
|
|
12
|
Kim DW, Kim HJ, Kim KW, Byun JH, Song KB,
Kim JH and Hong SM: Neuroendocrine neoplasms of the pancreas at
dynamic enhanced CT: Comparison between grade 3 neuroendocrine
carcinoma and grade 1/2 neuroendocrine tumour. Eur Radiol.
25:1375–1383. 2015. View Article : Google Scholar : PubMed/NCBI
|
|
13
|
Tomimaru Y, Eguchi H, Tatsumi M, Kim T,
Hama N, Wada H, Kawamoto K, Kobayashi S, Morii E, Mori M, et al:
Clinical utility of 2-[(18)F] fluoro-2-deoxy-Dglucose positron
emission tomography in predicting World Health Organization grade
in pancreatic neuroendocrine tumors. Surgery. 157:269–276. 2015.
View Article : Google Scholar : PubMed/NCBI
|
|
14
|
Balci NC, Perman WH, Saglam S, Akisik F,
Fattahi R and Bilgin M: Diffusion-weighted magnetic resonance
imaging of the pancreas. Top Magn Reson Imaging. 20:43–47. 2009.
View Article : Google Scholar : PubMed/NCBI
|
|
15
|
Wang Y, Chen ZE, Yaghmai V, Nikolaidis P,
McCarthy RJ, Merrick L and Miller FH: Diffusion-weighted mr imaging
in pancreatic endocrine tumors correlated with histopathologic
characteristics. J Magn Reson Imaging. 33:1071–1079. 2011.
View Article : Google Scholar : PubMed/NCBI
|
|
16
|
Higano S, Yun X, Kumabe T, Watanabe M,
Mugikura S, Umetsu A, Sato A, Yamada T and Takahashi S: Malignant
astrocytic tumors: Clinical importance of apparent diffusion
coefficient in prediction of grade and prognosis. Radiology.
241:839–846. 2006. View Article : Google Scholar : PubMed/NCBI
|
|
17
|
Humphries PD, Sebire NJ, Siegel MJ and
Olsen ØE: Tumors in pediatric patients at diffusion-weighted MR
imaging: Apparent diffusion coefficient and tumor cellularity.
Radiology. 245:848–854. 2007. View Article : Google Scholar : PubMed/NCBI
|
|
18
|
Padhani AR, Liu G, Koh DM, Chenevert TL,
Thoeny HC, Takahara T, Dzik-Jurasz A, Ross BD, van Cauteren M,
Collins D, et al: Diffusion-weighted magnetic resonance imaging as
a cancer biomarker: Consensus and recommendations. Neoplasia.
11:102–125. 2009. View Article : Google Scholar : PubMed/NCBI
|
|
19
|
Tatsumoto S, Kodama Y, Sakurai Y,
Shinohara T, Katanuma A and Maguchi H: Pancreatic neuroendocrine
neoplasm: Correlation between computed tomography enhancement
patterns and prognostic factors of surgical and endoscopic
ultrasound-guided fine-needle aspiration biopsy specimens. Abdom
Imaging. 38:358–366. 2013. View Article : Google Scholar : PubMed/NCBI
|