Introduction
Esophageal cancer (EC), also known as oesophageal
cancer, is one of the most aggressive tumors of the
gastrointestinal tract, and ranks the sixth most common cause of
cancer mortality (1). According to
the statistical data of National Central Cancer Registry of China,
an estimated 287,632 patients were diagnosed with and 208,473
patients succumbed to EC in 2010 in China (2). Although the EC-associated mortality rate
has decreased over the past 30 years, it remains a major cancer
burden in high risk areas (3). Thus,
the early diagnosis and treatment of EC are vital.
Previous studies have indicated that tumor-specific
microRNAs (miRNAs/miRs) are considered to be potential biomarkers
for the early diagnosis and treatment of EC (4–6). miRNAs, a
class of endogenous short non-protein-coding RNA molecules, bind to
their target sites within the mRNA molecules via base-pairing with
complementary sequences at a post-transcriptional level, and thus
certain miRNAs are considered to be oncogenes or tumor suppressor
genes (7–9). Previous studies have suggested that
miRNAs are primarily expressed in EC tissue and plasma. For
example, miR-145, miR-133a and miR-133b were demonstrated to
function as tumor suppressors by targeting FSCN1 in
esophageal squamous cell carcinoma (ESCC) (10). miR-375 may inhibit tumor growth and
metastasis in ESCC by repressing insulin-like growth factor 1
receptor (11). miR-92a has been
revealed to promote tumor metastasis of ESCC via epithelial
cadherin (12). In addition, miR-21,
miR-184 and miR-221 in the plasma were demonstrated to be
correlated with the recurrence of ESCC, and serve as oncogenes in
ESCC (13). However, miRNA expression
in the saliva of patients with EC remains largely unknown.
Due to the extensive blood supply to the salivary
glands, saliva is a promising bodily fluid for use in the early
detection of diseases including cancer, infectious and
cardiovascular diseases (14,15). Previous studies have also suggested
that saliva molecules may be used to detect human organic and
systemic diseases (16,17). In addition, Xie et al (18) analyzed the expression levels of miRNAs
in saliva samples and revealed that miR-10b, miR-144 and miR-451 in
whole saliva were significantly upregulated in patients with EC.
These miRNAs demonstrate promise as biomarkers for the detection of
EC due to the convenience and noninvasive nature of saliva
collection (18). However, the target
genes of theses miRNAs were not mentioned and the precise functions
of these miRNAs remain to be fully understood. Using the same data
as Xie et al (18), the
present study aimed to identify the validated target genes of the
miRNAs that were differentially expressed between whole saliva
samples from patients with EC and healthy controls, and to analyze
the potential functions of the targets by gene ontology (GO) and
Kyoto Encyclopedia of Genes and Genomes (KEGG) enrichment
analyses.
Materials and methods
Microarray data and data
preprocessing
The miRNA expression profile (GSE41268) was
extracted from the Gene Expression Omnibus (GEO) database (19) (http://www.ncbi.nlm.nih.gov/geo/) based on the
Agilent-021827 Human miRNA Microarray platform (V3; miRBase release
12.0 miRNA ID version; Agilent Technologies, Inc., Santa Clara, CA,
USA). This dataset was deposited by Xie et al (18). The microarray contained 10 chips of
whole saliva samples from 7 patients with EC and 3 healthy
controls. The pathology of the patients with EC was squamous cell
carcinoma: 1 patient was stage I, 1 patient was stage II, 3
patients were stage III and 2 patients were stage IV. The
probe-level data in CEL files were converted into the miRNA
expression profiles. For miRNAs corresponding to multiple probes
that exhibited a plurality of expression values, the miRNA
expression values of those probes were averaged. Log2
transformation was performed on probes that mapped with the miRNA
names labeled in the annotation platform to normalize the data from
a skewed distribution to the approximate normal distribution
(20).
Screening of differentially expressed
miRNAs
The Linear Models for Microarray Data package
(21) was used to normalize the data
and identify the differentially expressed miRNAs between patients
with EC and healthy controls. miRNAs with the cutoff criteria of
log2fold change (FC) >1 and P<0.05 were considered
to be significantly differentially expressed. In order to explore
whether the miRNAs were sample-specific, the Pheatmap package
(22) in R was used to perform
hierarchical clustering by comparing the value of each miRNA in 10
samples.
Target genes for differentially
expressed miRNAs
miRecords (http://c1.accurascience.com/miRecords/download.php) is
an integrated resource for animal miRNA-target interactions
(23). The miRecords database
currently contains 1,135 records of interactions between 644 miRNAs
and 1,901 target genes in 9 animal species. In the present study,
the validated target genes were extracted according to the
miRecords database.
Interaction network analysis
The Search Tool for the Retrieval of Interacting
Genes (STRING) database is a useful tool that provides multiple
experimental and predicted data (24,25). In
order to study the associations between miRNAs and their targets,
the target genes were scanned by the STRING database, and
protein-protein interaction (PPI) pairs with the cutoff criterion
of a combined score >0.4 were selected. Then, the regulatory
network that contained these miRNAs and the PPI pairs were
constructed using Cytoscape software (version 3.2.1; http://cytoscape.org/) (26).
Function enrichment analysis
The Database for Annotation, Visualization and
Integrated Discovery (DAVID) (27)
was used to identify the enriched functions in DEGs. KEGG
Orthology-Based Annotation System (KOBAS) is a software to identify
significantly enriched pathways using hypergeometric tests
(28). To explore the functions and
pathways of target genes in the development of EC, the DAVID and
KOBAS were used to identify the significantly enriched GO and KEGG
categories, respectively. P<0.05 was used as a cutoff
criterion.
Results
Screening of differentially expressed
miRNAs
With the cutoff criteria of log2FC >1
and P<0.05, 18 differentially expressed miRNAs were identified
in EC samples when compared with the healthy controls (Table I). The top 3 upregulated miRNAs were
miR-144, miR-451 and miR-509-3p, while the top 3 downregulated
miRNAs were miR-125b-1, miR-129 and miR-636. In addition, to
investigate the differences among the 10 samples, a heat map was
generated to compare their expression values. The hierarchical
clustering analysis revealed a clearly distinct expression of all
differentially expressed miRNAs between patients with EC and
healthy controls (Fig. 1).
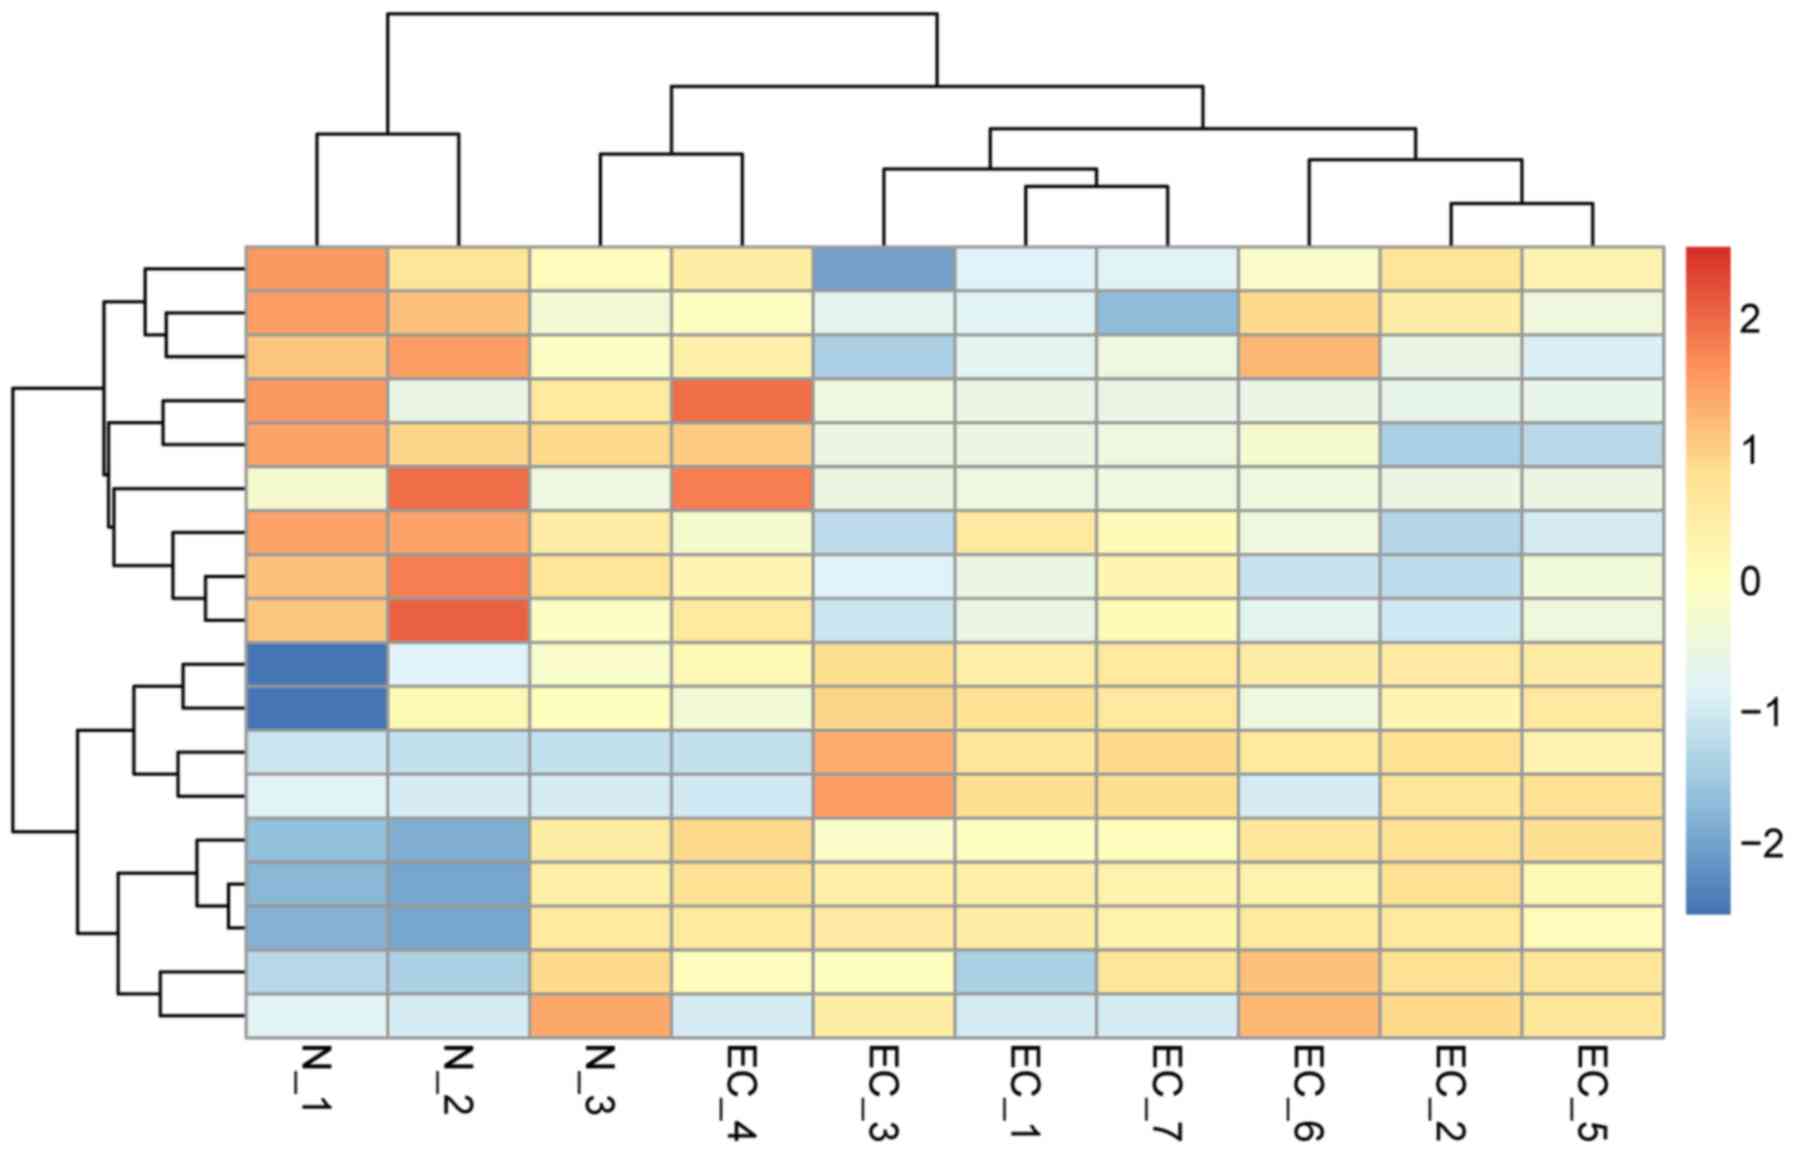 | Figure 1.Hierarchical clustering heat map of
18 differentially expressed miRNAs. Each column corresponds to a
single microarray, whereas each row indicates the expression
profile of a single gene. Red and blue represent high and low miRNA
expression, respectively. N-1, 2 and 3 indicate salivary samples in
healthy controls, while EC-1, 2, 3, 4, 5, 6 and 7 indicate salivary
samples in patients with esophageal cancer. miRNA, microRNA. |
 | Table I.Differently expressed miRNAs in
esophageal cancer tissue compared with normal tissue. |
Table I.
Differently expressed miRNAs in
esophageal cancer tissue compared with normal tissue.
| miRNA ID | P-value |
log2FC | miRNA ID | P-value |
log2FC |
|---|
| hsa-miR-125b-1 | 0.0245 | −4.5437 | hsa-miR-144 | 0.0060 | 6.8525 |
| hsa-miR-129 | 0.0024 | −3.7921 | hsa-miR-451 | 0.0107 | 6.8225 |
| hsa-miR-636 | 0.0422 | −2.1583 | hsa-miR-509-3p | 0.0408 | 5.0251 |
| hsa-miR-1909 | 0.0487 | −2.1353 | hsa-miR-486-5p | 0.0105 | 4.6848 |
| hsa-miR-1274b | 0.0008 | −1.8183 | hsa-miR-10b | 0.0497 | 4.5171 |
| hsa-miR-1274a | 0.0119 | −1.5339 | hsa-miR-363 | 0.0396 | 4.2118 |
| hsa-miR-720 | 0.0453 | −1.4932 | hsa-miR-139-3p | 0.0206 | 3.7638 |
| hsa-miR-371-5p | 0.0206 | −1.3268 | hsa-miR-648 | 0.0454 | 3.7265 |
| hsa-miR-933 | 0.0048 | −1.3112 | hsa-miR-98 | 0.0434 | 3.3743 |
Screening of validated target
mRNAs
According to the miRecords database, 43 validated
target mRNAs corresponding to 7 upregulated miRNAs (including
miR-144, miR-451 and miR-98) were acquired (Table II). No validated target gene for
downregulated miRNAs was obtained.
| Table II.Target genes of differentially
expressed miRNAs. |
Table II.
Target genes of differentially
expressed miRNAs.
| miRNA | Target | Test methods |
|---|
| hsa-miR-144 | NOTCH1 | Luciferase reporter
assay |
| hsa-miR-144 | FGA | Luciferase reporter
assay |
| hsa-miR-144 | FGB | Luciferase reporter
assay |
| hsa-miR-144 | FGG | ELISA; flow;
luciferase reporter assay |
| hsa-miR-144 | PLAG1 | Luciferase reporter
assay |
| hsa-miR-451 | AKT1 | RT-qPCR; western
blotting |
| hsa-miR-451 | MMP9 | RT-qPCR; western
blotting |
| hsa-miR-451 | MMP2 | RT-qPCR; western
blotting |
| hsa-miR-451 | ABCB1 | RT-qPCR; luciferase
reporter assay; western blotting |
| hsa-miR-451 | BCL2 | RT-qPCR; western
blotting |
| hsa-miR-451 | CAB39 | RT-qPCR; luciferase
reporter assay; western blotting; microarray |
| hsa-miR-451 | MIF | ELISA; luciferase
reporter assay; microarray; RT-qPCR; western blotting |
| hsa-miR-451 | SSSCA1 | RT-qPCR; western
blotting |
| hsa-miR-509-3p | NTRK3 | Luciferase reporter
assay |
| hsa-miR-98 | E2F1 | Luciferase reporter
assay |
| hsa-miR-98 | E2F2 | Northern blot |
| hsa-miR-98 | MYC | Luciferase reporter
assay |
| hsa-miR-98 | ACADM | RT-qPCR |
| hsa-miR-98 | AMMECR1 | RT-qPCR |
| hsa-miR-98 | CBX5 | RT-qPCR |
| hsa-miR-98 | CCL5 | ELISA |
| hsa-miR-98 | CHRNB1 | RT-qPCR |
| hsa-miR-98 | CNOT4 | RT-qPCR |
| hsa-miR-98 | EZH2 | Northern blot |
| hsa-miR-98 | HMGA2 | Northern blot;
RT-qPCR |
| hsa-miR-98 | HNRPDL | RT-qPCR |
| hsa-miR-98 | KLF13 | RT-qPCR |
| hsa-miR-98 | MEIS1 | RT-qPCR |
| hsa-miR-98 | NCOA3 | Luciferase reporter
assay |
| hsa-miR-98 | SERP1 | RT-qPCR |
| hsa-miR-98 | SLC20A1 | RT-qPCR |
| hsa-miR-98 | SOCS4 | Luciferase reporter
assay; northern blot; RT-qPCR; western blotting |
| hsa-miR-98 | THBS1 | RT-qPCR |
| hsa-miR-98 | TUSC2 | Luciferase reporter
assay; western blotting |
| hsa-miR-98 | ZFP36L1 | RT-qPCR |
| hsa-miR-98 |
ZMPSTE24 | RT-qPCR |
| hsa-miR-10b | PPARA | Luciferase reporter
assay; RT-qPCR; western blotting |
| hsa-miR-10b | KLF4 | Luciferase reporter
assay; western blotting |
| hsa-miR-10b | NCOR2 | RT-qPCR; western
blotting |
| hsa-miR-10b | HOXD10 | Luciferase reporter
assay |
| hsa-miR-10b | NF1 | GFP reporter assay;
luciferase reporter assay; microarray; RT-qPCR |
| hsa-miR-486-5p | CD40 | Microarray;
RT-qPCR |
| hsa-miR-363 | CDKN1A | RT-qPCR; luciferase
reporter assay; western blotting |
Interaction network analysis
A total of 6 miRNAs and 27 validated target genes
were mapped into the network using STRING and Cytoscape. In the
network, 5 genes including Notch homolog 1 (NOTCH1),
fibrinogen γ chain (FGG), fibrinogen α chain (FGA),
and fibrinogen β chain (FGB) were modulated by miR-144;
while 6 genes including AKT serine/threonine kinase 1
(AKT1), matrix metalloproteinase (MMP)9, and
MMP2 were modulated by miR-451. A total of 11 genes,
including v-myc avian myelocytomatosis viral oncogene homolog
(c-MYC; MYC), E2F transcription factor (E2F)1, and
E2F2 were modulated by miR-98. A total of 3 genes, including
peroxisome proliferator-activated receptor α (PPARA) and
Kruppel-like factor 4 (KLF4) were modulated by miR-10b. TNF
receptor superfamily member 5 (CD40) and cyclin-dependent
kinase inhibitor 1A (CDKN1A) were modulated by miR-485-5p
and miR-363, respectively (Fig.
2).
Function and pathway enrichment
analysis
To gain additional insight into the underlying
functions of all target genes and the target genes in the network,
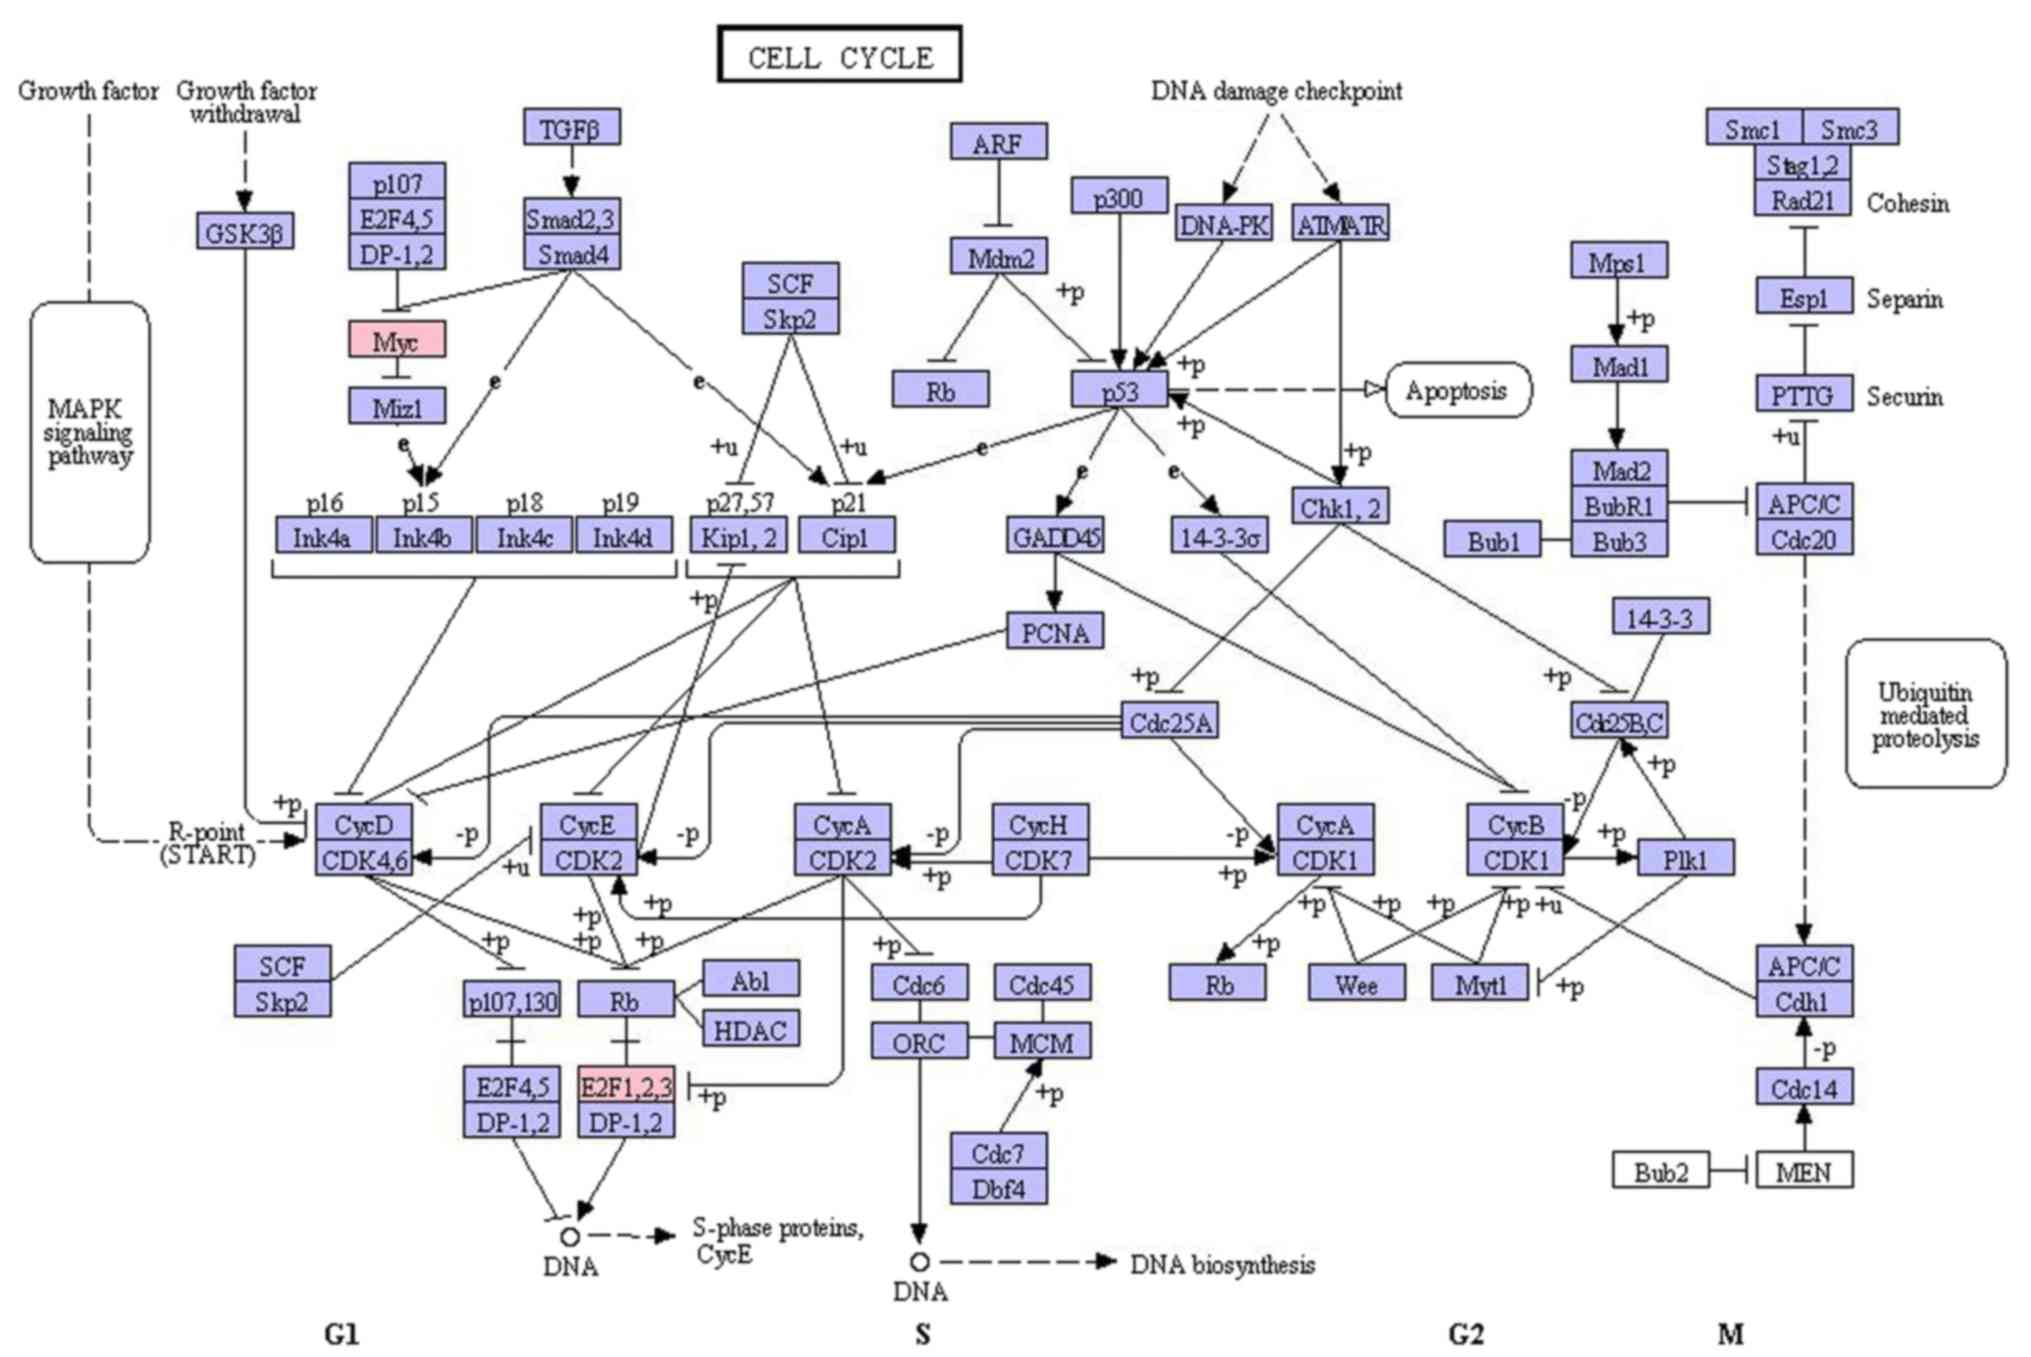
GO and KEGG enrichment analyses were performed. The results
demonstrated that the top 3 enriched GO terms were cell cycle
(E2F1, E2F2 and MYC), blood vessel development
(AKT1, NOTCH1 and MMP2) and vasculature
(AKT1, NOTCH1 and MMP2; Table III); and the top 3 enriched KEGG
pathways were cell cycle (E2F1, E2F2 and MYC),
complement and coagulation cascades (FGG, FGA and
FGB) and epidermal growth factor receptor signaling pathway
(AKT1, CDKN1A and MYC; Table IV).
| Table III.Enriched GO terms of target genes in
the microRNA-target regulatory network. |
Table III.
Enriched GO terms of target genes in
the microRNA-target regulatory network.
| Term | Count | P-value | Genes |
|---|
| GO: 0007049~cell
cycle | 10 |
4.27×10⁻⁴ | E2F1, E2F2, MYC,
AKT1, SSSCA1, TUSC2, CDKN1A, BCL2, HMGA2, THBS1 |
| GO: 0001568~blood
vessel development | 6 |
8.23×10⁻⁴ | AKT1, NOTCH1,
MMP2, ZFP36L1, NF1, THBS1 |
| GO:
0001944~vasculature development | 6 |
9.18×10⁻⁴ | AKT1, NOTCH1,
MMP2, ZFP36L1, NF1, THBS1 |
| GO: 0022402~cell
cycle process | 8 |
1.39×10⁻³ | E2F1, MYC, AKT1,
SSSCA1, CDKN1A, BCL2, HMGA2, THBS1, |
| GO:
0043067~regulation of programmed cell death | 9 |
2.65×10⁻³ | MYC, AKT1,
NOTCH1, MMP9, CDKN1A, BCL2, NF1, THBS1, MIF |
| GO:
0010941~regulation of cell death | 9 |
2.71×10⁻³ | MYC, AKT1,
NOTCH1, MMP9, CDKN1A, BCL2, NF1, THBS1, MIF |
| GO:
0051726~regulation of cell cycle | 6 |
3.09×10⁻³ | E2F1, E2F2, MYC,
AKT1, CDKN1A, BCL2 |
| GO: 0022403~cell
cycle phase | 6 |
7.93×10⁻³ | E2F1, AKT1,
SSSCA1, CDKN1A, BCL2, HMGA2 |
| GO: 0008283~cell
proliferation | 6 |
9.80×10⁻³ | E2F1, MYC,
TUSC2, BCL2, CD40, MIF |
| Table IV.Enriched Kyoto Encyclopedia of Genes
and Genomes pathways of target genes in the microRNA-target
regulatory network. |
Table IV.
Enriched Kyoto Encyclopedia of Genes
and Genomes pathways of target genes in the microRNA-target
regulatory network.
| Term | Pathway | Count | P-value | Genes |
|---|
| hsa04110 | Cell cycle | 3 |
5.49×10⁻⁹ | E2F1, E2F2,
MYC |
| hsa04610 | Complement and
coagulation cascades | 3 |
1.43×10⁻⁴ | FGG, FGA,
FGB |
| hsa04012 | ErbB signaling
pathway | 3 |
1.52×10⁻³ | AKT1, CDKN1A,
MYC |
| hsa04620 | Toll-like receptor
signaling pathway | 3 |
2.15×10⁻³ | AKT1, CD40,
CCL5 |
Discussion
miRNA expression is known to be associated with
various types of human cancer (29).
In the present study, the salivary miRNA expression profile of EC
deposited by Xie et al (18)
in GEO database was analyzed, to screen for biomarkers for
therapeutic intervention. In concordance with the study of Xie
et al (18), the present study
also demonstrated that miR-144, miR-451 and miR-10b were
significantly upregulated in saliva samples from patients with EC
and healthy controls. In addition, miR-144 was revealed to
potentially be involved in EC progression by directly targeting 5
mRNAs, including NOTCH1, FGG, FGA and
FGB. NOTCH 1 is a member of the NOTCH family. NOTCH
signaling serves an important function in a variety of
developmental processes by regulating cell differentiation,
proliferation and apoptosis (30).
NOTCH signaling has been demonstrated to be upregulated in EC, and
may be used as a therapeutic target for EC (31,32). FGG,
FGA and FGB belong to the fibrinogen family. Fibrinogen is a
glycoprotein in vertebrates that assists with the formation of
blood clots and functions as a common component of hemostasis
(33). Takeuchi et al
(34) identified that plasma
fibrinogen concentration was significantly associated with
chemoradiotherapy responsiveness in patients with ESCC. Matsuda
et al (35) suggested that the
plasma fibrinogen level may be used as a biomarker for
postoperative recurrence in advanced EC. The fibrinogen level is
correlated with tumor metastasis and recurrence in patients with
ESCC (34,35). Thus, by targeting NOTCH1,
FGG, FGA and FGB, miR-144 may be involved in
cell invasion and metastasis of EC.
miR-451 was revealed to target 6 mRNAs in the
present study, including AKT1, MMP9 and MMP2.
The protein kinase B (AKT) family has been demonstrated to
integrate extracellular signals with cell processes including
proliferation, differentiation, migration and survival (36). Previous data have demonstrated that
the phosphoinositide 3-kinase/protein kinase B/mechanistic target
of rapamycin pathway is frequently activated in numerous types of
human cancer, including colorectal cancer (37). Cancer cells are well known to exhibit
a higher proliferation rate compared with normal cells, and cancer
cells frequently fail to undergo apoptosis (38). Activated AKT may regulate its
downstream targets to increase cell proliferation and decrease
apoptosis (39). AKT activation was
described as an early cellular response to carcinogen exposure, and
may be a key step in environmental carcinogenesis (40). In addition, MMP2 and MMP9 were
demonstrated to be overexpressed in ESCC and to be associated with
esophageal tumorigenesis (41).
Therefore, the increased expression of MMPs may promote tumor
proliferation and inhibit apoptosis in the development of EC
(42).
The present study revealed that miR-10b may regulate
3 mRNAs (including PPARA and KLF4). PPARA, also
termed NR1C1, is a transcription factor that is a member of the
peroxisome proliferator-activated receptor (PPAR) group. PPARs have
been demonstrated to stimulate tumor cell proliferation and induce
neoangiogenesis in different types of gastrointestinal cancer,
including EC, liver and pancreatic cancer (43). KLF4, as a known tumor suppressor, may
regulate cell proliferation, differentiation, development and
apoptosis (44). KLF4 has been
suggested to suppress EC cell migration and invasion, as a direct
target of miR-10b (45). Therefore,
the associated miRNAs, including miR-144 and miR-451 and miR-10b,
may serve important functions in cellular processes including cell
differentiation, proliferation, metastasis and apoptosis in EC by
regulating NOTCH, FGG, FGA, FGB,
AKT1, MMP9, MMP2, PPARA and
KLF4.
Compared with the aforementioned previous study,
among the upregulated miRNAs, miR-98 and miR-363 were novel
(18). miR-98 belongs to the lethal-7
(let-7) family of miRNAs (let-7f, let-7d, miR-98 and let-7g). The
miRNA let-7 may regulate key differentiation processes during
development (46). The expression of
let-7 has been suggested to predict the response to chemotherapy in
EC (47). miR-98 may target
almost half of the validated target genes in the network,
including MYC, E2F1, and E2F2. MYC, a
well-known transcription factor, exhibited a high degree of
connectivity in the regulatory network of the present study. E2F1
and E2F2 are transcription factors and members of the E2F family.
MYC and E2Fs have been identified as associated with the cell cycle
(48). MYC overexpression enhances
and MYC downregulation inhibits cell cycle progression (48). E2F1 expression is positively
associated with cell proliferation in EC (49). E2F2 has been demonstrated to
negatively regulate a subset of genes involved in the processes of
DNA metabolism and cell cycle control (50). In addition, E2F1 and E2F2 are
expressed in a cell cycle-regulated manner, exhibiting their
highest levels in the late G1 and S phase (51). Cell cycle deregulation is a common
feature of human tumors (52). The
results of the present study also demonstrated that MYC,
E2F1 and E2F2 were enriched in the cell cycle, which
was the most significantly enriched GO function and KEGG pathway,
suggesting that MYC, E2F1 and E2F2 serve critical functions in the
cell cycle (Fig. 3). Therefore, by
targeting MYC, E2F1 and E2F2, miR-98 may be involved in the cell
cycle of EC cells, and act as novel biomarker for EC.
miR-363 was identified to be downregulated in head
and neck squamous cell carcinoma (HNSCC) tissues, and to affect
HNSCC cell invasion and metastasis (53). Hsu et al (54) indicated that miR-363 served a key
function in the increment of gastric carcinogenesis via targeting
c-Myc promotor binding protein 1, a negative regulator of MYC. In
the present study, miR-363 was suggested to directly target CDKN1A,
also termed p21, WAF1 or CIP1. The cyclin-dependent kinase
inhibitor CDKN1A is a regulator of cell cycle progression at the
G1 and S phases (55).
Therefore, miR-363 may be involved in EC by regulating its target
gene, and may be used as a novel biomarker for EC.
In addition, in contrast to the study of Xie et
al (18), the present study
identified that miR-486-5p was significantly upregulated in EC
samples (P=0.01052). This may be caused by the different
preprocessing methods used in these studies. The present study also
identified that miR-486-5p may modulate EC by targeting CD40. CD40,
a member of the TNF-receptor superfamily, was originally identified
on the surface of B cells and was suggested to regulate B cell
growth and differentiation (56). The
interaction of CD40 with the CD40 ligand was revealed to modulate
immune cells in the lymph nodes and to promote growth of local
squamous cell cancer of the head and neck by protecting tumor cells
(57,58). miR-486-5p was dysregulated in EC
saliva samples and was demonstrated to regulate CD40 in the present
study. However, additional studies are needed to verify the
involvement of miR-486-5p in EC.
In conclusion, the present study demonstrated that
the biomarkers (miR-144, and miR-451 and miR-10b) screened by Xie
et al (18) may serve an
important function in the regulation of EC by targeting
NOTCH, fibrinogen, AKT1, MMPs, PPARA
and KLF4. In addition, 2 novel biomarkers, miR-98 and
miR-363, were identified. These are associated with the EC and
modulate a serial of cell cycle-associated genes, including
MYC, E2F1, E2F2 and CDKN1A. Additional
experiments are needed to confirm the expression of miR-486-5p and
its involvement in EC, due to the discordant conclusions between
the present study and a previous study (18).
Acknowledgements
The present study was supported by Natural Science
Foundation of Liaoning Province (grant no. 2015 020561).
References
|
1
|
Whiteman DC: Esophageal cancer: Priorities
for prevention. Curr Epidemiol Rep. 1:138–148. 2014. View Article : Google Scholar
|
|
2
|
Chen W, Zheng R, Zhang S, Zeng H, Fan Y,
Qiao Y and Zhou Q: Esophageal cancer incidence and mortality in
China, 2010. Thorac Cancer. 5:343–348. 2014. View Article : Google Scholar : PubMed/NCBI
|
|
3
|
Wei WQ, Yang J, Zhang SW, Chen WQ and Qiao
YL: Esophageal cancer mortality trends during the last 30 years in
high risk areas in China: Comparison of results from national death
surveys conducted in the 1970's, 1990's and 2004–2005. Asian Pac J
Cancer Prev. 12:1821–1826. 2011.PubMed/NCBI
|
|
4
|
Yang M, Liu R, Sheng J, Liao J, Wang Y,
Pan E, Guo W, Pu Y and Yin L: Differential expression profiles of
microRNAs as potential biomarkers for the early diagnosis of
esophageal squamous cell carcinoma. Oncol Rep. 29:169–176.
2013.PubMed/NCBI
|
|
5
|
Gu J, Wang Y and Wu X: MicroRNA in the
pathogenesis and prognosis of esophageal cancer. Curr Pharm Des.
19:1292–1300. 2013. View Article : Google Scholar : PubMed/NCBI
|
|
6
|
Yao WJ, Wang YL, Lu JG, Guo L, Qi B and
Chen ZJ: MicroRNA-506 inhibits esophageal cancer cell proliferation
via targeting CREB1. Int J Clin Exp Pathol. 8:10868–10874.
2015.PubMed/NCBI
|
|
7
|
Bartel DP: MicroRNAs: Genomics,
biogenesis, mechanism, and function. Cell. 116:281–297. 2004.
View Article : Google Scholar : PubMed/NCBI
|
|
8
|
Zhang B, Pan X, Cobb GP and Anderson TA:
microRNAs as oncogenes and tumor suppressors. Dev Biol. 302:1–12.
2007. View Article : Google Scholar : PubMed/NCBI
|
|
9
|
Lucas K and Raikhel AS: Insect microRNAs:
Biogenesis, expression profiling and biological functions. Insect
Biochem Mol Biol. 43:24–38. 2013. View Article : Google Scholar : PubMed/NCBI
|
|
10
|
Kano M, Seki N, Kikkawa N, Fujimura L,
Hoshino I, Akutsu Y, Chiyomaru T, Enokida H, Nakagawa M and
Matsubara H: miR-145, miR-133a and miR-133b: Tumor-suppressive
miRNAs target FSCN1 in esophageal squamous cell carcinoma. Int
Cancer. 127:2804–2814. 2010. View Article : Google Scholar
|
|
11
|
Kong KL, Kwong DL, Chan TH, Law SY, Chen
L, Li Y, Qin YR and Guan XY: MicroRNA-375 inhibits tumour growth
and metastasis in oesophageal squamous cell carcinoma through
repressing insulin-like growth factor 1 receptor. Gut. 61:33–42.
2012. View Article : Google Scholar : PubMed/NCBI
|
|
12
|
Chen ZL, Zhao XH, Wang JW, Li BZ, Wang Z,
Sun J, Tan FW, Ding DP, Xu XH, Zhou F, et al: microRNA-92a promotes
lymph node metastasis of human esophageal squamous cell carcinoma
via E-cadherin. J Biol Chem. 286:10725–10734. 2011. View Article : Google Scholar : PubMed/NCBI
|
|
13
|
Komatsu S, Ichikawa D, Takeshita H,
Tsujiura M, Morimura R, Nagata H, Kosuga T, Iitaka D, Konishi H,
Shiozaki A, et al: Circulating microRNAs in plasma of patients with
oesophageal squamous cell carcinoma. Br J Cancer. 105:104–111.
2011. View Article : Google Scholar : PubMed/NCBI
|
|
14
|
Lee YH and Wong DT: Saliva: An emerging
biofluid for early detection of diseases. Am J Dent. 22:241–248.
2009.PubMed/NCBI
|
|
15
|
Pfaffe T, Cooper-White J, Beyerlein P,
Kostner K and Punyadeera C: Diagnostic potential of saliva: Current
state and future applications. Clin Chem. 57:675–687. 2011.
View Article : Google Scholar : PubMed/NCBI
|
|
16
|
Li Y, Elashoff D, Oh M, Sinha U, St John
MA, Zhou X, Abemayor E and Wong DT: Serum circulating human mRNA
profiling and its utility for oral cancer detection. J Clin Oncol.
24:1754–1760. 2006. View Article : Google Scholar : PubMed/NCBI
|
|
17
|
Mbulaiteye SM, Walters M, Engels EA,
Bakaki PM, Ndugwa CM, Owor AM, Goedert JJ, Whitby D and Biggar RJ:
High levels of Epstein-Barr virus DNA in saliva and peripheral
blood from Ugandan mother-child pairs. J Infect Dis. 193:422–426.
2006. View
Article : Google Scholar : PubMed/NCBI
|
|
18
|
Xie Z, Chen G, Zhang X, Li D, Huang J,
Yang C, Zhang P, Qin Y, Duan Y, Gong B and Li Z: Salivary microRNAs
as promising biomarkers for detection of esophageal cancer. PLoS
One. 8:e575022013. View Article : Google Scholar : PubMed/NCBI
|
|
19
|
Barrett T, Wilhite SE, Ledoux P,
Evangelista C, Kim IF, Tomashevsky M, Marshall KA, Phillippy KH,
Sherman PM, Holko M, et al: NCBI GEO: Archive for functional
genomics data sets-update. Nucleic Acids Res. 41(Database issue):
D991–D995. 2013. View Article : Google Scholar : PubMed/NCBI
|
|
20
|
Fujita A, Sato JR, Lde O Rodrigues,
Ferreira CE and Sogayar MC: Evaluating different methods of
microarray data normalization. BMC Bioinformatics. 7:4692006.
View Article : Google Scholar : PubMed/NCBI
|
|
21
|
Smyth GK: Limma: Linear models for
microarray dataBioinformatics and Computational Biology Solutions
Using R and Bioconductor. Gentleman R, Carey VJ, Huber W, Irizarry
RA and Dudoit S: Springer; New York: pp. 397–420. 2005, View Article : Google Scholar
|
|
22
|
Wang L, Cao C, Ma Q, Zeng Q, Wang H, Cheng
Z, Zhu G, Qi J, Ma H, Nian H and Wang Y: RNA-seq analyses of
multiple meristems of soybean: Novel and alternative transcripts,
evolutionary and functional implications. BMC Plant Biol.
14:1692014. View Article : Google Scholar : PubMed/NCBI
|
|
23
|
Xiao F, Zuo Z, Cai G, Kang S, Gao X and Li
T: miRecords: An integrated resource for microRNA-target
interactions. Nucleic Acids Res. 37(Database issue): D105–D110.
2009. View Article : Google Scholar : PubMed/NCBI
|
|
24
|
Von Mering C, Huynen M, Jaeggi D, Schmidt
S, Bork P and Snel B: STRING: A database of predicted functional
associations between proteins. Nucleic Acids Res. 31:258–261. 2003.
View Article : Google Scholar : PubMed/NCBI
|
|
25
|
Franceschini A, Szklarczyk D, Frankild S,
Kuhn M, Simonovic M, Roth A, Lin J, Minguez P, Bork P, von Mering C
and Jensen LJ: STRING v9.1: Protein-protein interaction networks,
with increased coverage and integration. Nucleic Acids Res.
41(Database issue): D808–D815. 2013. View Article : Google Scholar : PubMed/NCBI
|
|
26
|
Kohl M, Wiese S and Warscheid B:
Cytoscape: Software for visualization and analysis of biological
networks. Methods Mol Biol. 696:291–303. 2011. View Article : Google Scholar : PubMed/NCBI
|
|
27
|
Huang DW, Sherman BT, Tan Q, Collins JR,
Alvord WG, Roayaei J, Stephens R, Baseler MW, Lane HC and Lempicki
RA: The DAVID gene functional classification tool: A novel
biological module-centric algorithm to functionally analyze large
gene lists. Genome Biol. 8:R1832007. View Article : Google Scholar : PubMed/NCBI
|
|
28
|
Wu J, Mao X, Cai T, Luo J and Wei L: KOBAS
server: A web-based platform for automated annotation and pathway
identification. Nucleic Acids Res. 34(Web Server issue): W720–W724.
2006. View Article : Google Scholar : PubMed/NCBI
|
|
29
|
Farazi TA, Hoell JI, Morozov P and Tuschl
T: MicroRNAs in human cancer. Adv Exp Med Biol. 774:1–20. 2013.
View Article : Google Scholar : PubMed/NCBI
|
|
30
|
Subramaniam D, Ponnurangam S, Ramamoorthy
P, Standing D, Battafarano RJ, Anant S and Sharma P: Curcumin
induces cell death in esophageal cancer cells through modulating
Notch signaling. PLoS One. 7:e305902012. View Article : Google Scholar : PubMed/NCBI
|
|
31
|
Peters JH and Avisar N: The molecular
pathogenesis of Barrett's esophagus: Common signaling pathways in
embryogenesis metaplasia and neoplasia. J Gastrointest Surg. 14
Suppl 1:81–87. 2010. View Article : Google Scholar
|
|
32
|
Mendelson J, Song S, Li Y, Maru DM, Mishra
B, Davila M, Hofstetter WL and Mishra L: Dysfunctional transforming
growth factor-β signaling with constitutively active Notch
signaling in Barrett's esophageal adenocarcinoma. Cancer.
117:3691–3702. 2011. View Article : Google Scholar : PubMed/NCBI
|
|
33
|
Weisel JW: Fibrinogen and fibrin. Adv
Protein Chem. 70:247–299. 2005. View Article : Google Scholar : PubMed/NCBI
|
|
34
|
Takeuchi H, Ikeuchi S, Kitagawa Y, Shimada
A, Oishi T, Isobe Y, Kubochi K, Kitajima M and Matsumoto S:
Pretreatment plasma fibrinogen level correlates with tumor
progression and metastasis in patients with squamous cell carcinoma
of the esophagus. J Gastroenterol Hepatol. 22:2222–2227. 2007.
View Article : Google Scholar : PubMed/NCBI
|
|
35
|
Matsuda S, Takeuchi H, Fukuda K, Nakamura
R, Takahashi T, Wada N, Kawakubo H, Saikawa Y, Omori T and Kitagawa
Y: Clinical significance of plasma fibrinogen level as a predictive
marker for postoperative recurrence of esophageal squamous cell
carcinoma in patients receiving neoadjuvant treatment. Dis
Esophagus. 27:654–661. 2014. View Article : Google Scholar : PubMed/NCBI
|
|
36
|
Freeman-Cook KD, Autry C, Borzillo G,
Gordon D, Barbacci-Tobin E, Bernardo V, Briere D, Clark T, Corbett
M, Jakubczak J, et al: Design of selective, ATP-competitive
inhibitors of Akt. J Med Chem. 53:4615–4622. 2010. View Article : Google Scholar : PubMed/NCBI
|
|
37
|
Eide PW, Cekaite L, Danielsen SA,
Eilertsen IA, Kjenseth A, Fykerud TA, Ågesen TH, Bruun J, Rivedal
E, Lothe RA and Leithe E: NEDD4 is overexpressed in colorectal
cancer and promotes colonic cell growth independently of the
PI3K/PTEN/AKT pathway. Cell Signal. 25:12–18. 2013. View Article : Google Scholar : PubMed/NCBI
|
|
38
|
Lahtz C and Pfeifer GP: Epigenetic changes
of DNA repair genes in cancer. J Mol Cell Biol. 3:51–58. 2011.
View Article : Google Scholar : PubMed/NCBI
|
|
39
|
Weber SM, Bornstein S, Li Y, Malkoski SP,
Wang D, Rustgi AK, Kulesz-Martin MF, Wang XJ and Lu SL:
Tobacco-specific carcinogen nitrosamine
4-(methylnitrosamino)-1-(3-pyridyl)-1-butanone induces AKT
activation in head and neck epithelia. Int J Oncol. 39:1193–1198.
2011.PubMed/NCBI
|
|
40
|
West KA, Brognard J, Clark AS, Linnoila
IR, Yang X, Swain SM, Harris C, Belinsky S and Dennis PA: Rapid Akt
activation by nicotine and a tobacco carcinogen modulates the
phenotype of normal human airway epithelial cells. J Clin Invest.
111:81–90. 2003. View Article : Google Scholar : PubMed/NCBI
|
|
41
|
Samantaray S, Sharma R, Chattopadhyaya TK,
Gupta SD and Ralhan R: Increased expression of MMP-2 and MMP-9 in
esophageal squamous cell carcinoma. J Cancer Res Clin Oncol.
130:37–44. 2004. View Article : Google Scholar : PubMed/NCBI
|
|
42
|
Groblewska M, Siewko M, Mroczko B and
Szmitkowski M: The role of matrix metalloproteinases (MMPs) and
their inhibitors (TIMPs) in the development of esophageal cancer.
Folia Histochem Cytobiol. 50:12–19. 2012. View Article : Google Scholar : PubMed/NCBI
|
|
43
|
Pazienza V, Vinciguerra M and Mazzoccoli
G: PPARs signaling and cancer in the gastrointestinal system. PPAR
Res. 2012:5608462012. View Article : Google Scholar : PubMed/NCBI
|
|
44
|
Dang DT, Pevsner J and Yang VW: The
biology of the mammalian Krüppel-like family of transcription
factors. Int J Biochem Cell Biol. 32:1103–1121. 2000. View Article : Google Scholar : PubMed/NCBI
|
|
45
|
Tian Y, Luo A, Cai Y, Su Q, Ding F, Chen H
and Liu Z: MicroRNA-10b promotes migration and invasion through
KLF4 in human esophageal cancer cell lines. J Biol Chem.
285:7986–7994. 2010. View Article : Google Scholar : PubMed/NCBI
|
|
46
|
Peter ME: Let-7 and miR-200 microRNAs:
Guardians against pluripotency and cancer progression. Cell Cycle.
8:843–852. 2009. View Article : Google Scholar : PubMed/NCBI
|
|
47
|
Sugimura K, Miyata H, Tanaka K, Hamano R,
Takahashi T, Kurokawa Y, Yamasaki M, Nakajima K, Takiguchi S, Mori
M and Doki Y: Let-7 expression is a significant determinant of
response to chemotherapy through the regulation of IL-6/STAT3
pathway in esophageal squamous cell carcinoma. Clin Cancer Res.
18:5144–5153. 2012. View Article : Google Scholar : PubMed/NCBI
|
|
48
|
Bretones G, Delgado MD and León J: Myc and
cell cycle control. Biochim Biophys Acta. 1849:506–516. 2015.
View Article : Google Scholar : PubMed/NCBI
|
|
49
|
Yamazaki K, Hasegawa M, Ohoka I, Hanami K,
Asoh A, Nagao T, Sugano I and Ishida Y: Increased E2F-1 expression
via tumour cell proliferation and decreased apoptosis are
correlated with adverse prognosis in patients with squamous cell
carcinoma of the oesophagus. J Clin Pathol. 58:904–910. 2005.
View Article : Google Scholar : PubMed/NCBI
|
|
50
|
Laresgoiti U, Apraiz A, Olea M, Mitxelena
J, Osinalde N, Rodriguez JA, Fullaondo A and Zubiaga AM: E2F2 and
CREB cooperatively regulate transcriptional activity of cell cycle
genes. Nucleic Acids Res. 41:10185–10198. 2013. View Article : Google Scholar : PubMed/NCBI
|
|
51
|
Xanthoulis A and Tiniakos DG: E2F
transcription factors and digestive system malignancies: How much
do we know? World J Gastroenterol. 19:3189–3198. 2013. View Article : Google Scholar : PubMed/NCBI
|
|
52
|
Malumbres M and Barbacid M: Cell cycle,
CDKs and cancer: A changing paradigm. Nat Rev Cancer. 9:153–166.
2009. View Article : Google Scholar : PubMed/NCBI
|
|
53
|
Sun Q, Zhang J, Cao W, Wang X, Xu Q, Yan
M, Wu X and Chen W: Dysregulated miR-363 affects head and neck
cancer invasion and metastasis by targeting podoplanin. Int J
Biochem Cell Biol. 45:513–520. 2013. View Article : Google Scholar : PubMed/NCBI
|
|
54
|
Hsu KW, Wang AM, Ping YH, Huang KH, Huang
TT, Lee HC, Lo SS, Chi CW and Yeh TS: Downregulation of tumor
suppressor MBP-1 by microRNA-363 in gastric carcinogenesis.
Carcinogenesis. 35:208–217. 2014. View Article : Google Scholar : PubMed/NCBI
|
|
55
|
Gartel AL and Radhakrishnan SK: Lost in
transcription: p21 repression, mechanisms, and consequences. Cancer
Res. 65:3980–3985. 2005. View Article : Google Scholar : PubMed/NCBI
|
|
56
|
Kehry MR: CD40-mediated signaling in B
cells. Balancing cell survival, growth, and death. J Immunol.
156:2345–2348. 1996.PubMed/NCBI
|
|
57
|
Posner MR, Cavacini LA, Upton MP, Tillman
KC, Gornstein ER and Norris CM Jr: Surface membrane-expressed CD40
is present on tumor cells from squamous cell cancer of the head and
neck in vitro and in vivo and regulates cell growth in tumor cell
lines. Clin Cancer Res. 5:2261–2270. 1999.PubMed/NCBI
|
|
58
|
Cao W, Cavacini LA, Tillman KC and Posner
MR: CD40 function in squamous cell cancer of the head and neck.
Oral Oncol. 41:462–469. 2005. View Article : Google Scholar : PubMed/NCBI
|