Introduction
The majority of breast cancers (BCs) are generally
hormone-related cancers, with estradiol (E2) essentially being the
primary inducing factor (1,2). In women, E2 promotes cell proliferation,
growth and development of the mammary epithelium (3,4). The
mammary epithelium is composed of basal and myoepithelial/basal
cell lineages (5). Approximately
15–25% of mammary epithelial cells express estrogen receptor 1
(ESR1) in the normal resting breast, and are considered to
proliferate slowly and in a well-differentiated cell-type (6). However, the number of ESR1-positive
mammary cells changes throughout the menstrual cycle (7–9). Notably,
E2 induces the proliferation of ESR1-negative breast cells that
surround the ESR1-positive cells, probably through the secretion of
paracrine factors (6,7). E2 is also known to promote proliferation
in a large number of BCs, with positive correlation between ESR1
positivity and endocrine therapy (10). In addition, the number of mammary
epithelial cells and the expression of ESR1 increase to
>50% during initial diagnosis, which suggests a transformation
role that provides a target for therapy (8,9). Apart
from cellular transformation, ESR1 also plays a pivotal role in
cell proliferation and growth (11,12).
Approximately 70% of BCs are ESR+ or E2-responsive
(13). The presence of ESR1 is a good
predictive and prognostic factor for BC patients, who are likely to
respond to anti-hormone therapy with tamoxifen or aromatase
inhibitors (8). The use of adjuvant
therapy such as tamoxifen results in ~40–50% reduction in
recurrence and prolonged disease-free and overall patient survival
(14), and also provides a clinical
benefit for >50% of all metastatic ESR1+ tumors
(15). Although tamoxifen is
initially effective, ~50% of breast tumors acquire tamoxifen
resistance during the course of treatment (16–18). Such
a situation has resulted in the quest for developing novel
selective ESR modulators.
Forkhead box A1 (FOXA1) is a forkhead family member
protein encoded by the FOXA1 gene, which is located on
chromosome 14q21.1 (19,20). FOXA1 was initially identified as a
vital factor for liver development by transcriptionally activating
the liver-specific transcripts albumin and transthyretin (21); however, its role in the development of
the breast and other organs has also been reported (22–25). FOXA
proteins bind to DNA elements [A(A/T)TRTT(G/T)RYTY] as monomers to
mediate their physiological response (6). These proteins are similar to histone
linker proteins, but unlike histones, they lack basic amino acids
that are essential for chromatin compaction (26). FOXA1 protein also has the potential to
compact chromatin and reposition the nucleosome by recruiting
itself to enhancer regions of the target genes (20). The repositioning of nucleosomes is
considered to facilitate the temporal and spatial differential
binding of transcription factors in a lineage-specific manner
(27). As observed in rescue
experiments in FOXA1-null mice, FOXA1 is responsible
for post-natal development of mammary and prostate glands (25). Apart from development, FOXA1 was
observed to be highly elevated in prostate cancer and BC (28,29). In
ESR+ BC cells, FOXA1 facilitates hormone responsiveness
by modulating ESR1 binding sites in the target genes (30,31).
Thorat et al demonstrated that ~50% of ESR1-regulated target
genes and E2-induced cell proliferation requires prior FOXA1
protein recruitment (32).
Furthermore, FOXA1 expression is also associated with low breast
tumor grade, exhibiting a positive correlation with the luminal A
BC subtype (33). Such observation
suggests a strong correlation between FOXA1 expression and
luminal A breast tumor subtype; however, the co-regulatory partners
of both molecules are still undefined.
GATA binding protein 3 (GATA3) is one of the six
members of the zinc finger DNA binding protein family (22). It binds to the DNA sequence
(A/T)GATA(A/G) in the target gene, and promotes cell proliferation,
development and differentiation of different tissues and cell types
(34,35), including the luminal glandular
epithelial cells of the mammary gland (36–38). The
genes GATA3, FOXA1 and ESR1 are highly expressed in
BC, with positive correlation between them (39). ESR1 messenger RNA (mRNA) is
transcribed from ~6 promoter regions with different tissue
specificity (40). The regulatory
factors involved in GATA3 and FOXA1 expression may interact with
the ESR1 promoter region, although this remains to be
determined (28). However, a previous
whole genome expression analysis demonstrated that FOXA1 and GATA3
protein express in close association with ESR1 (41).
Previous studies have utilized the Oncomine™
software (Thermo Fisher Scientific, Inc., Waltham, MA, USA) to
correlate published microarray data (42,43) in
order to confirm the authenticity of the correlation data. The
Oncomine™ software enables to understand and analyze a number of
microarray data (multi-array), which contain multiple clinical
tumor samples and normal biopsies (44). The software function search tool
allows the queried gene to be correlated in terms of its expression
with other genes in the multi-arrays (www.oncomine.org). Such analyses will yield a
significant overlap of co-expressed genes that can link proteins in
the same molecular pathway.
The objective of the present study was to compare
the co-expressed target genes of FOXA1 and to correlate them
with ESR1 and GATA3 in order to determine the extent
of overlap using Oncomine™ microarray data. For that purpose, an
intensive individual meta-analysis of FOXA1, ESR1 and
GATA3 (putative pathway partners that may be associated in
BC tumorigenesis) was performed, followed by a comparison of the
overlapping genes. Such comparisons would provide a highly
significant number of genes that may be involved in the same
pathway. Analyses of the Oncomine™ microarray data identified 115
co-regulated genes between FOXA1 and ESR1. Comparison
of these genes with another co-related and co-regulated gene,
GATA3, identified 79 genes that are co-expressed along with
FOXA1 and ESR1 co-regulated genes, which are
consistent with the previously reported estrogen- and
ESR1-regulated pathway. Semiquantitative and quantitative
polymerase chain reaction (qPCR) analysis also confirmed a number
of the overlapping genes [PS2, B-cell lymphoma 2
(BCL2), progesterone receptor (PGR), seven in
absentia homolog 2 (SIAH2), cellular myeloblastosis viral
oncogene homolog (CMYB) and GATA3], which suggested a
significant correlation. In silico analysis of one of the
significantly associated genes, PS2, demonstrated the
presence of two FOXA1 binding sites and an estrogen response
element (ERE), which was observed to recruit FOXA1 upon E2
stimulation.
The present findings reveal novel co-expression
partners and the existence of a molecular network involving
interacting partners in the FOXA1, ESR1 and GATA3
signaling pathways.
Materials and methods
Oncomine™ analysis
Oncomine™ is an integrated cancer microarray
database and web-based data-mining platform (44). Oncomine™ analysis was performed as
previously described (42,43). The co-expressed genes correlated with
FOXA1 and ESR1 were searched for in the Oncomine™
platform. A total of 24 microarrays were selected, 20 of which were
ESR+ BC microarrays, while the remaining 4 were
normal ESR+ breast microarrays (Table I) (45–68). All
the ESR+ microarrays were selected for
co-expression analysis. The first 500 genes co-regulated with
FOXA1 and ESR1 within each microarray were retrieved
and compared separately. These 500 genes were selected based on a
>2 fold-change expression level and in an adjusted threshold by
gene rank for the top 10%. Such a threshold will return mRNA
datasets having breast cancer clinical samples, with FOXA1
and ESR1 coexpression results ranked or grouped in the top
10% of the datasets. Therefore by examining these coexpression
results we can determine genes that are coordinately expressed with
FOXA1 and ESR1, which may help to identify potential
targets in the same pathway. The repetitive genes within each study
(FOXA1 and ESR1) were removed, keeping only a single
representative of the gene in each microarray analysis. The gene
names were derived from GeneCards® (http://www.genecards.org/). To understand the
significant correlations, genes represented on >4 microarrays
were considered significant (16% frequency), and those represented
on >5 microarrays were considered highly significant (20%
frequency). Genes from the FOXA1 and ESR1 microarrays
were sorted and overlapped to identify overlapping co-expressed
genes. Such microarray coexpression analysis may help to identify
potential targets that function in the same regulatory pathway.
 | Table I.Forkhead box protein A1:estrogen
receptor 1 microarray used for the analysis. |
Table I.
Forkhead box protein A1:estrogen
receptor 1 microarray used for the analysis.
| Author | Typea | Sample numbers | Ref. |
|---|
| Higgins et
al | Normal | 34 | (45) |
| Roth et
al | Normal | 353 | (46) |
| Shyamsundar et
al | Normal | 123 | (47) |
| Tabchy et
al | Breast | 178 | (48) |
| Perou et
al | Breast | 65 | (49) |
| Su et
al | Normal | 101 | (50) |
| Zhao et
al | Breast | 64 | (51) |
| Yu et
al | Breast 3 | 96 | (52) |
| Wang et
al | Breast | 286 | (53) |
| Waddell et
al | Breast | 85 | (54) |
| Van't Veer et
al | Breast | 117 | (55) |
| Schmidt et
al | Breast | 200 | (56) |
| Pollack et
al | Breast 2 | 41 | (57) |
| Minn et
al | Breast 2 | 121 | (58) |
| Lu et
al | Breast | 129 | (59) |
| Korde et
al | Breast | 61 | (60) |
| Kao et
al | Breast | 327 | (61) |
| Julka et
al | Breast | 44 | (62) |
| Hatzis et
al | Breast | 508 | (63) |
| Gluck et
al | Breast | 158 | (64) |
| Farmer et
al | Breast | 49 | (65) |
| Desmedt et
al | Breast | 198 | (66) |
| Bos et
al | Breast | 204 | (67) |
| Bonnefoi et
al | Breast | 160 | (68) |
Cell culture and transient
transfection
The cell lines MCF7 and T47D were purchased from the
National Center for Cell Sciences (Pune, India). The MCF7 and T47D
cell lines were cultured in Dulbecco's modified Eagle medium (DMEM;
PAN Biotech GmbH, Aidenbach, Germany) and RPMI 1640 medium (PAN
Biotech GmbH) respectively, supplemented with 10% (v/v) fetal
bovine serum (PAN Biotech GmbH) and 1% (v/v)
penicillin/streptomycin (Sigma-Aldrich, St. Louis, MO, USA). The
cells were maintained under a humidified atmosphere in 5%
CO2 at 37°C. The plasmids pRB-HNF3α (expressing
FOXA1) and pAcGFPC1-ESR1 (expressing ESR1)
were provided by Professor Kenneth S. Zaret (Department of Cell and
Developmental Biology, Smilow Center for Translational Research,
Philadelphia, PA, USA) and Professor Ratna K. Vadlamudi (The
Department of Obstetrics and Gynecology, University of Texas Health
Science Center at San Antonio, San Antonio, TX, USA),
respectively.
To investigate the role of FOXA1 in the
transcriptional regulation of target genes, FOXA1 expression
plasmid (1 µg) and empty vector (1 µg) were transfected in MCF7 and
T47D cells cultured in 35-mm plates (BD Biosciences, Franklin
Lakes, NJ, USA) using the TransPass D2 transfection reagent (New
England BioLabs, Inc., Ipswich, MA, USA). Transfected and
untransfected cell lines were harvested at 24 h post-transfection.
Similarly, co-transfection was performed by transfecting
FOXA1 (500 ng) and ESR1 (500 ng) expression plasmids.
After 24 h of transfection, total RNA was isolated and
processed.
RNA isolation, reverse
transcription-PCR and qPCR
Total RNA was isolated from FOXA1-transfected
and ESR1/FOXA1-co-transfected samples at 24 h
post-transfection using TRI reagent (Sigma-Aldrich). RNA was
digested with DNase I (Sigma-Aldrich) digested converted into
complementary DNA (cDNA) using a first-strand cDNA synthesis kit
(Invitrogen; Thermo Fisher Scientific, Inc., Waltham, MA, USA). The
qPCR conditions were as follows: 95°C for 2 min, followed by 40
cycles of 95°C for 30 sec and 56–58°C for 30 sec). GAPDH was used
as a internal control. The relative quantification of gene
expression was calculated by the 2−∆∆Cq method (69). The primers used for PCR are listed in
Table II. qPCR was performed using
SYBR® Green (Sigma-Aldrich) with an MJ Research thermocycler
(Bio-Rad Laboratories, Inc., Hercules, CA, USA).
| Table II.Lists of primers used. |
Table II.
Lists of primers used.
| Primers | Primer sequence
(5′-3′) | Amplicon size
(bp) |
|---|
|
RT-FOXA1 | F:
GGGTGGCTCCAGGATGTTAGG | 194 |
|
| R:
GGGTCATGTTGCCGCTCGTAG |
|
|
RT-GATA3 | F:
CAGACCACCACAACCACACTCT | 124 |
|
| R:
GGATGCCTCCTTCTTCATAGTCA |
|
| RT-PGR | F:
CGCGCTCTACCCTGCACTC | 121 |
|
| R:
TGAATCCGGCCTCAGGTAGTT |
|
| RT-CMYB | F:
GAAGGTCGAACAGGAAGGTTATCT | 224 |
|
| R:
GTAACGCTACAGGGTATGGAACA |
|
|
RT-SIAH2 | F:
CCTCGGCAGTCCTGTTTCCCTGT | 124 |
|
| R:
CCAGGACATGGGCAGGAGTAGGG |
|
| RT-BCL2 | F:
TGTGGATGACTGAGTACCTG | 116 |
|
| R:
GGAGAAATCAAACAGAGGCC |
|
| RT-PS2 | F:
GAACAAGGTGATCTGCGCCC | 223 |
|
| R:
TTCTGGAGGGACGTCGATGG |
|
|
RT-GAPDH | F:
AAGATCATCAGCAATGCCTC | 619 |
|
| R:
CTCTTCCTCTTGTGCTCTTG |
|
| FOXA1 chip
(FOXA1 site1) PS2 | F:
CATGTTGGCCAGGCTAGTCT | 165 |
|
| R:
CATTCCGTCTAGGCCTAAGC |
|
| FOXA1 chip
(FOXA1 site2) PS2 | F:
GCTTAGGCCTAGACGGAATG | 180 |
|
| R:
CTCATATCTGAGAGGCCCTC |
|
| PS2 chip F
(ERE) | F:
TTAAGTGATCCGCCTGCTTT | 271 |
|
| R:
CTCCCGCCAGGGTAAATACT |
|
| FOXA1
consensus site | F:
CTTATGCAATGTGTTGGTCTCACG |
|
|
| R:
CGTGAGACCAACACATTGCATAAG |
|
| FOXA1 EMSA
(FOXA1 site1) PS2 |
GGCCTCCCAAAGTGTTGGGATTACAGGCGT |
|
|
|
ACGCCTGTAATCCCAACACTTTGGGAGGCC |
|
| FOXA1 EMSA
(FOXA1 site2) PS2 |
CCCCGTGAGCCACTGTTGTCACGGCCAAG |
|
|
|
CTTGGCCGTGACAACAGTGGCTCACGGGG |
|
Nuclear extract
Nuclear lysate was extracted from MCF7 cells. The
cells were washed with ice-cold phosphate-buffered saline (PBS) and
lysed with cell lysis buffer [20 mM
4-(2-hydroxyethyl)-1-piperazineethanesulfonic acid (HEPES) (pH
7.9), 50% (v/v) glycerol, 0.1% (v/v) Triton X-100, 10 mM NaCl, 1.5
mM MgCl2, 1 mM ethylene glycol-bis(β-aminoethyl
ether)-N,N,N',N'-tetraacetic acid (EGTA), 1 mM
ethylenediaminetetraacetic acid (EDTA) and 1X protease inhibitor
cocktail] (Sigma-Aldrich) for 15 min in 4°C. Nuclear pellets were
collected upon centrifugation at 500 × g for 15 min, and
resuspended in chilled extraction buffer [20 mM HEPES (pH=7.9), 50%
(v/v) glycerol, 420 mM NaCl, 10 mM MgCl2, 1 mM EGTA, 1
mM dithiothreitol (DTT) and 1X protease inhibitor cocktail]
(Sigma-Aldrich). After 30 min of incubation on ice, the nuclear
proteins were collected by centrifugation at 16,000 × g at
4°C for 30 min. The lysate prepared was stored at −80°C prior to
use.
Electrophoretic mobility shift assay
(EMSA)
In vitro DNA-protein interaction was
performed using EMSA. Oligonucleotides consisting of FOXA1 binding
sites present in the PS2 promoter were designed from −517 to −547
(EMSA1) and from −363 to −393 (EMSA2) residues upstream of the
transcription start site. The oligonucleotide sequences are
provided in Table II. The forward
primers of EMSA1 and EMSA2 were kinase-labeled with γ32P
adenosine triphosphate (BRIT, Hyderabad, India), and then annealed
with reverse complementary oligonucleotide residues in annealing
buffer [200 mM Tris-Cl (pH 7.5), 1,000 mM NaCl and 100 mM
MgCl2]. The nuclear lysate was incubated in 10 µl
binding buffer [1 M Tris-Cl (pH 7.5), 50% (v/v) glycerol, 0.5 M
EDTA, 1 mM DTT and 50 mg/ml bovine serum albumin; Sigma-Aldrich)
containing 0.2 pmol radiolabeled probe.
Poly(deoxyinosinic-deoxycytidylic) acid was used as a nonspecific
competitor. For specific competition, the radiolabeled probes were
mixed to compete with various excess molar concentrations of
unlabeled double-stranded FOXA1 consensus probe. After 25 min of
incubation at room temperature, the samples were subjected to
electrophoresis in a 6% polyacrylamide gel at 180 V in 0.5X
Tris/borate/EDTA running buffer [40 mM Tris-Cl (pH 8.3), 45 mM
boric acid and 1 mM EDTA] for 1 h. Subsequently, the gel was dried
and autoradiographed.
Chromatin immunoprecipitation (ChIP)
assay
For in vivo binding assays, ChIP was
performed. Prior to E2 treatment, MCF7 cells were maintained in
phenol-free DMEM (PAN Biotech GmbH) for 48 h. The cells were
stimulated with 100 nM E2 (Sigma-Aldrich) for additional 24 h,
fixed with 1% (v/v) formaldehyde for 10 min, washed twice with 1X
PBS (10 mM PO43−, 137 mM NaCl and 2.7 mM
KCl), lysed with cell lysis buffer [1% (v/v) sodium dodecyl sulfate
(SDS), 10 mM EDTA, 50 mM Tris-Cl (pH 8.1) and 1X protease inhibitor
cocktail] (Sigma-Aldrich) and sonicated at M2 amplitude strength
(~250W intensity level) using a Bioruptor® ultrasonicator device
(Diagenode S.A., Seraing, Belgium). The sonicated samples were
pre-cleared using protein A-sepharose beads (GE Healthcare Life
Sciences, Chalfont, UK) and incubated with 1 µg anti-FOXA1 (catalog
no., sc101058; Santa Cruz Biotechnology, Inc., Dallas, TX, USA),
anti-ESR1 (catalog no., 8644s; Cell Signaling Technology, Inc.,
Danvers, MA, USA), normal mouse immunoglobulin G (IgG) (catalog
no., kch-819-015; Diagenode S.A.) and normal rabbit IgG (catalog
no., sc-2027; Santa Cruz Biotechnology, Inc.) antibodies (diluted,
1:100) at 4°C for 1 h. The antibody-protein complexes were
separated using protein A-sepharose beads for an additional 1 h,
and washed with different washing buffers, including a low salt
wash buffer [0.1% (v/v) SDS, 1% (v/v) Triton X-100, 2 mM EDTA, 20
mM Tris-HCl (pH 8.1) and 150 mM NaCl], a high salt wash buffer
[0.1% (v/v) SDS, 1% (v/v) Triton X-100, 2 mM EDTA, 20 mM Tris-HCl
(pH 8.1) and 500 mM NaCl], a LiCl wash buffer [0.25 M LiCl, 1%
(v/v) NP-40, 1% (w/v) deoxycholic acid (sodium salt), 1 mM EDTA and
10 mM Tris-HCl (pH 8.1)] and 1X Tris/EDTA [10 mM Tris-HCl (pH 8.1)
and 1 mM EDTA]. The samples were then eluted with elution buffer
[1% (v/v) SDS and 0.1 M NaHCO3], reverse crosslinked
with 5 mM NaCl for 6 h at 65°C and subjected to proteinase K
digestion at 45°C for 1 h. The ChIP eluates were purified by
phenol-chloroform, and the purified DNA fractions were used to
perform PCR analysis to confirm the presence of ESR1 and FOXA1
binding in the PS2 promoter (Table II).
Statistical analysis
Data are shown as representative experiments
performed in triplicates, and represented as the mean ± standard
error. Differences were compared with the paired Student's t-test.
All statistical tests were performed with GraphPad Prism version
5.01 (GraphPad Software, Inc., La Jolla, CA, USA). P<0.05 was
considered to indicate a statistically significant difference.
Results and Discussion
Co-expression meta-analysis was performed using
Oncomine™ (www.oncomine.org), which is a
web-based interface cancer-profiling database containing published
microarray data that have been collected, analyzed, annotated and
maintained by Compendia Bioscience™ (Thermo Fisher Scientific,
Inc., Waltham, MA, USA). The co-expression genes for ESR1
and FOXA1 were searched and analyzed in the multi-arrays
(Table I). The first 500 highly
co-expressed genes (exhibiting both significantly low and high
expression) with a cut-off frequency of ≥4 (≥16%) studies in each
microarray were selected (Tables
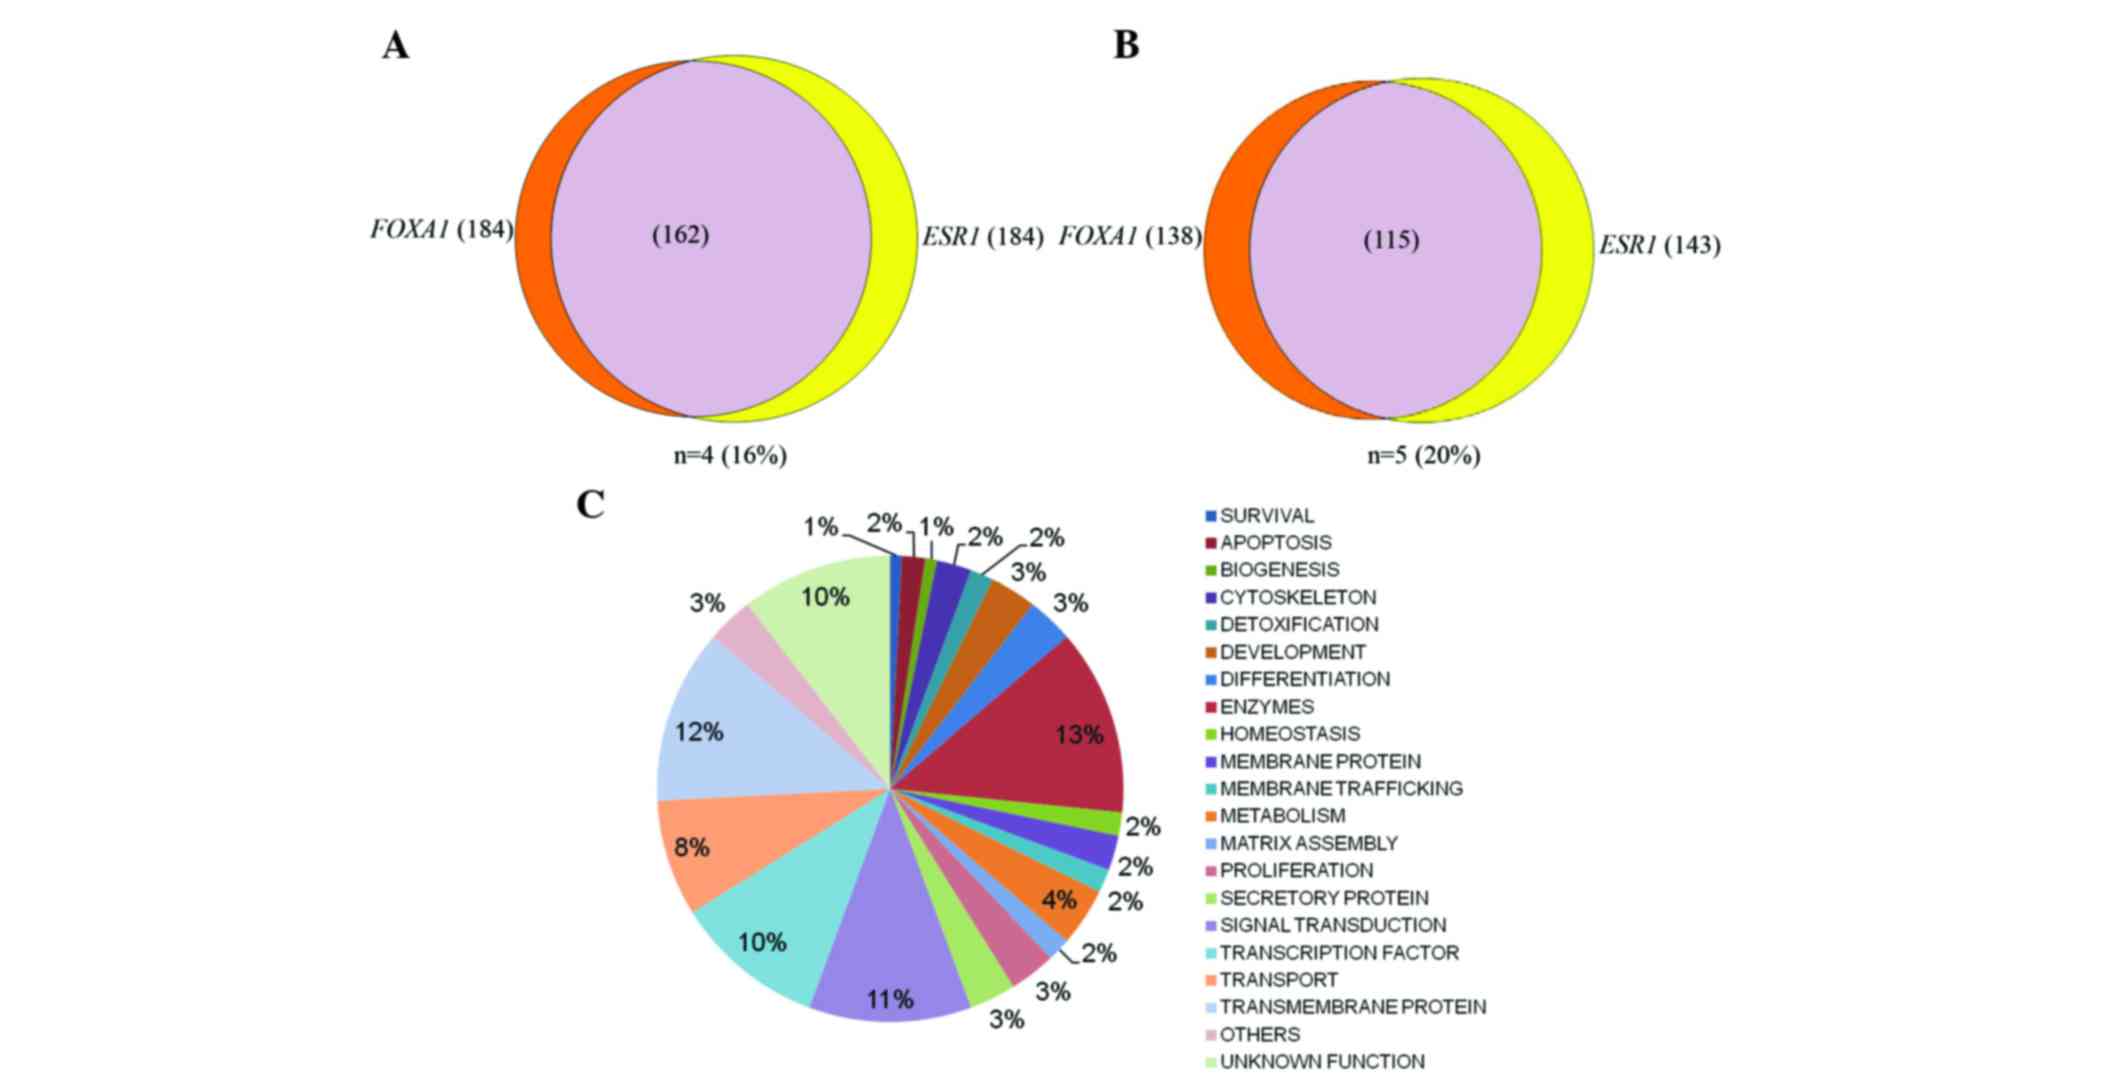
III and IV). Approximately
16–20% of genes were observed to overlap with each other when the
co-expressed genes of ESR1 and FOXA1 were combined
(Fig. 1A and B). Under higher
stringent conditions with a cut-off frequency of ≥5 (≥20%), ~115
genes overlapped in ESR1 and FOXA1 co-expression
genes multi-arrays (Fig. 1B).
Table V presents the overlapping
genes of ESR1 and FOXA1 identified in the
aforementioned multi-arrays.
| Table III.FOXA1 Oncomine™
meta-analysis. |
Table III.
FOXA1 Oncomine™
meta-analysis.
| Gene | Percentage of
co-expression (%) |
|---|
| FOXA1 | 100 |
| ESR1 | 67 |
| GATA3 | 67 |
| MLPH | 67 |
| AGR2 | 63 |
| CA12 | 63 |
| TFF3 | 63 |
| XBP1 | 63 |
| NAT1 | 58 |
| SLC39A6 | 58 |
| TBC1D9 | 58 |
| DNALI1 | 54 |
| SCNN1A | 54 |
| SLC44A4 | 54 |
| SPDEF | 54 |
| TSPAN1 | 54 |
| ANXA9 | 50 |
| DNAJC12 | 50 |
| FBP1 | 50 |
| GREB1 | 50 |
| MAGED2 | 50 |
| MAPT | 50 |
| MYB | 50 |
| TFF1 | 50 |
| AR | 46 |
| FAM174B | 46 |
| INPP4B | 46 |
| KDM4B | 46 |
| SCUBE2 | 46 |
| SIDT1 | 46 |
| VAV3 | 46 |
| ABAT | 42 |
| BCL2 | 42 |
| GPD1L | 42 |
| IL6ST | 42 |
| RHOB | 42 |
| TTC39A | 42 |
| ACADSB | 38 |
| ERBB4 | 38 |
| EVL | 38 |
| NME5 | 38 |
| SYBU | 38 |
| TOX3 | 38 |
| ZNF552 | 38 |
| CACNA1D | 33 |
| DACH1 | 33 |
| GALNT6 | 33 |
| GAMT | 33 |
| GFRA1 | 33 |
| RAB17 | 33 |
| RBM47 | 33 |
| SLC16A6 | 33 |
| SLC7A8 | 33 |
| STC2 | 33 |
| TSPAN13 | 33 |
| ZMYND10 | 33 |
| AFF3 | 29 |
| AKR7A3 | 29 |
|
C10orf116 | 29 |
|
C9orf116 | 29 |
| CRIP1 | 29 |
| CYB5A | 29 |
| ELOVL5 | 29 |
| GALNT7 | 29 |
| KCNK15 | 29 |
|
KIAA1324 | 29 |
| LASS6 | 29 |
| MCCC2 | 29 |
| MTL5 | 29 |
| PGR | 29 |
| RAB26 | 29 |
|
SERPINA5 | 29 |
| SIAH2 | 29 |
| SLC2A10 | 29 |
| AGR3 | 25 |
| CAMK2N1 | 25 |
|
CYP2B7P1 | 25 |
| FAM134B | 25 |
| GPR160 | 25 |
| GSTM3 | 25 |
| INPP5J | 25 |
| KIF5C | 25 |
| MAST4 | 25 |
| MED13L | 25 |
| NPDC1 | 25 |
| PNPLA4 | 25 |
| PP14571 | 25 |
| RABEP1 | 25 |
| SCCPDH | 25 |
| SEMA3B | 25 |
| SEMA3F | 25 |
| STARD10 | 25 |
| SYT17 | 25 |
| THSD4 | 25 |
| UGCG | 25 |
| ABCC8 | 21 |
| ABLIM3 | 21 |
| BCAS1 | 21 |
| C5orf30 | 21 |
| C6orf97 | 21 |
|
C9orf152 | 21 |
| CLSTN2 | 21 |
| CYP2B6 | 21 |
| DHCR24 | 21 |
| DUSP4 | 21 |
| DYNLRB2 | 21 |
| EFHC1 | 21 |
| ERBB3 | 21 |
| FAAH | 21 |
| FSIP1 | 21 |
| GDF15 | 21 |
| IRS1 | 21 |
| KCTD3 | 21 |
|
KIAA0040 | 21 |
| KIF16B | 21 |
| KRT18 | 21 |
| LRBA | 21 |
| METRN | 21 |
| MREG | 21 |
| MYO5C | 21 |
| PECI | 21 |
| PRR15 | 21 |
| PTPRT | 21 |
| PVRL2 | 21 |
| REEP1 | 21 |
| REEP6 | 21 |
| RERG | 21 |
| RNF103 | 21 |
| SLC19A2 | 21 |
| SLC22A5 | 21 |
| SLC4A8 | 21 |
| SYTL2 | 21 |
| TBX3 | 21 |
| TMC5 | 21 |
| TMEM30B | 21 |
| TP53TG1 | 21 |
| TTC6 | 21 |
| WFS1 | 21 |
| ADCY9 | 17 |
|
ANKRD30A | 17 |
| APBB2 | 17 |
| AZGP1 | 17 |
| BBS4 | 17 |
|
C17orf28 | 17 |
| C1orf21 | 17 |
| C1orf64 | 17 |
| C4A | 17 |
|
CACNA2D2 | 17 |
| CASC1 | 17 |
| CCNG2 | 17 |
| CELSR2 | 17 |
| CLGN | 17 |
| COX6C | 17 |
| CPB1 | 17 |
| CREB3L4 | 17 |
| CXXC5 | 17 |
| CYP4B1 | 17 |
| DEGS2 | 17 |
| EEF1A2 | 17 |
| FAM110C | 17 |
| FUT8 | 17 |
| HHAT | 17 |
| HPN | 17 |
| IGF1R | 17 |
|
KIAA0232 | 17 |
|
KIAA1244 | 17 |
| KRT8 | 17 |
| LRIG1 | 17 |
| MEIS3P1 | 17 |
| MKL2 | 17 |
| MYST4 | 17 |
| NBEA | 17 |
| NPNT | 17 |
| NRIP1 | 17 |
| PBX1 | 17 |
| PCSK6 | 17 |
| RAB27B | 17 |
| RALGPS2 | 17 |
| RND1 | 17 |
|
SLC9A3R1 | 17 |
| SPRED2 | 17 |
| STK32B | 17 |
| WWP1 | 17 |
| ZNF703 | 17 |
| Table IV.ESR1 Oncomine™
meta-analysis. |
Table IV.
ESR1 Oncomine™
meta-analysis.
| Gene | Percentage of
co-expression (%) |
|---|
| ESR1 | 100 |
| CA12 | 79 |
| GATA3 | 79 |
| NAT1 | 71 |
| SLC39A6 | 71 |
| TBC1D9 | 71 |
| DNALI1 | 67 |
| FOXA1 | 67 |
| ANXA9 | 63 |
| DNAJC12 | 63 |
| GREB1 | 63 |
| MAPT | 63 |
| ABAT | 58 |
| SCUBE2 | 58 |
| TFF3 | 58 |
| ERBB4 | 54 |
| KDM4B | 54 |
| MLPH | 54 |
| MYB | 54 |
| XBP1 | 54 |
| AGR2 | 50 |
| DACH1 | 50 |
| FBP1 | 50 |
| IL6ST | 50 |
| MAGED2 | 50 |
| TFF1 | 50 |
| VAV3 | 50 |
| ACADSB | 46 |
| GFRA1 | 46 |
| INPP4B | 46 |
|
KIAA1324 | 46 |
| PGR | 46 |
| SCNN1A | 46 |
| SLC44A4 | 46 |
| SLC7A8 | 46 |
| SPDEF | 46 |
| BCL2 | 42 |
|
C9orf116 | 42 |
| CACNA1D | 42 |
| EVL | 42 |
| GAMT | 42 |
| GPD1L | 42 |
| NME5 | 42 |
|
SERPINA5 | 42 |
| STC2 | 42 |
| SYBU | 42 |
| TTC39A | 42 |
| ZMYND10 | 42 |
| AFF3 | 38 |
| AGR3 | 38 |
| AR | 38 |
| FAM174B | 38 |
| SIDT1 | 38 |
| THSD4 | 38 |
| TSPAN1 | 38 |
| CLSTN2 | 33 |
| CYP2B6 | 33 |
|
CYP2B7P1 | 33 |
| ELOVL5 | 33 |
| FAM134B | 33 |
| KCNK15 | 33 |
| RERG | 33 |
| RHOB | 33 |
| SLC16A6 | 33 |
| SLC22A5 | 33 |
| UGCG | 33 |
| ZNF552 | 33 |
| ABCC8 | 29 |
| C5orf30 | 29 |
| C6orf97 | 29 |
| CYB5A | 29 |
| DYNLRB2 | 29 |
| GSTM3 | 29 |
| IRS1 | 29 |
| MAST4 | 29 |
| MCCC2 | 29 |
| MTL5 | 29 |
| PNPLA4 | 29 |
| PTPRT | 29 |
| RABEP1 | 29 |
| SEMA3B | 29 |
| SIAH2 | 29 |
| SUSD3 | 29 |
| SYT17 | 29 |
| TSPAN13 | 29 |
| ABLIM3 | 25 |
| ADCY9 | 25 |
| AKR7A3 | 25 |
|
C10orf116 | 25 |
|
CACNA2D2 | 25 |
| CASC1 | 25 |
| CRIP1 | 25 |
| CXXC5 | 25 |
| ERBB3 | 25 |
| FSIP1 | 25 |
| GALNT6 | 25 |
| HHAT | 25 |
| INPP5J | 25 |
| KCTD3 | 25 |
| KIF5C | 25 |
| MED13L | 25 |
| NRIP1 | 25 |
| RAB17 | 25 |
| RBM47 | 25 |
| SCCPDH | 25 |
| SEMA3F | 25 |
| SLC2A10 | 25 |
| TBX3 | 25 |
| TOX3 | 25 |
| WFS1 | 25 |
| WWP1 | 25 |
| ACOX2 | 21 |
|
ANKRD30A | 21 |
| APBB2 | 21 |
| C4A | 21 |
| CAMK2N1 | 21 |
| CCDC74B | 21 |
| CCNG2 | 21 |
| COX6C | 21 |
| DEGS2 | 21 |
| EEF1A2 | 21 |
| EFHC1 | 21 |
| FAAH | 21 |
| FUT8 | 21 |
| GALNT7 | 21 |
| IGF1R | 21 |
|
KIAA0040 | 21 |
| LASS6 | 21 |
| LRBA | 21 |
| LRIG1 | 21 |
| MEIS3P1 | 21 |
| METRN | 21 |
| MREG | 21 |
| NPDC1 | 21 |
| NPNT | 21 |
| PDZK1 | 21 |
| PRSS23 | 21 |
| RAB26 | 21 |
| REPS2 | 21 |
| RNF103 | 21 |
| SALL2 | 21 |
| STK32B | 21 |
| ZNF703 | 21 |
| ASTN2 | 17 |
| AZGP1 | 17 |
| BBS1 | 17 |
| BBS4 | 17 |
| BCAS1 | 17 |
|
C14orf45 | 17 |
|
C16orf45 | 17 |
| C1orf64 | 17 |
|
C6orf211 | 17 |
| CAPN8 | 17 |
| CELSR2 | 17 |
| CPB1 | 17 |
| CYP4B1 | 17 |
| DHCR24 | 17 |
| GDF15 | 17 |
| HPN | 17 |
|
KIAA0232 | 17 |
| LONRF2 | 17 |
| MKL2 | 17 |
| MYO5C | 17 |
| MYST4 | 17 |
| NKAIN1 | 17 |
| PARD6B | 17 |
| PBX1 | 17 |
| PCP2 | 17 |
| PCSK6 | 17 |
| PECI | 17 |
| PLAT | 17 |
| PLCD4 | 17 |
| PP14571 | 17 |
| PP1R3C | 17 |
| PREX1 | 17 |
| PRLR | 17 |
| RALGPS2 | 17 |
| RARA | 17 |
| REEP1 | 17 |
| REEP6 | 17 |
| SEC14L2 | 17 |
| SEMA3C | 17 |
|
SERPINA3 | 17 |
| SLC19A2 | 17 |
|
SLC22A18 | 17 |
| SLC27A2 | 17 |
| SSH3 | 17 |
| STARD10 | 17 |
| SYTL2 | 17 |
| TCEAL1 | 17 |
| TMEM25 | 17 |
| TMEM30B | 17 |
| TP53TG1 | 17 |
| TPRG1 | 17 |
| WNK4 | 17 |
| Table V.Overlapping meta-analysis of
ESR1 and FOXA1 with a cut-off frequency of 5
(20%). |
Table V.
Overlapping meta-analysis of
ESR1 and FOXA1 with a cut-off frequency of 5
(20%).
|
| Overlap of
ESR1 and FOXA1 (≥5 studies, ESR1=143,
FOXA1=138, overlapping genes=115) |
|---|
|
|
|
|---|
| Gene | FOXA1 (%) | ESR1 (%) | Function |
|---|
| ESR1 | 67 | 100 | Estrogen receptor
1 |
| CA12 | 63 | 79 | Carbonic anhydrase
12 |
| GATA3 | 67 | 79 | GATA binding
protein 3 |
| NAT1 | 58 | 71 | NAT1
N-acetyltransferase 1 |
| SLC39A6 | 58 | 71 | Zinc transporter
ZIP6 |
| TBC1D9 | 58 | 71 | TBC1 domain family
member 9 |
| DNALI1 | 54 | 67 | Axonemal dynein
light intermediate polypeptide 1 |
| FOXA1 | 100 | 67 | Forkhead box
protein A1 |
| ANXA9 | 50 | 63 | Annexin A9 |
| DNAJC12 | 50 | 63 | DnaJ homolog
subfamily C member 12 |
| GREB1 | 50 | 63 | Growth regulation
by estrogen in breast cancer 1 |
| MAPT | 50 | 63 |
Microtubule-associated protein tau |
| NPDC1 | 25 | 63 | Neural
proliferation differentiation and control protein 1 |
| ABAT | 42 | 58 | 4-aminobutyrate
aminotransferase |
| SCUBE2 | 46 | 58 | Signal peptide, CUB
domain, EGF-like 2 |
| TFF3 | 63 | 58 | Trefoil factor
3 |
| ERBB4 | 38 | 54 | Receptor
tyrosine-protein kinase erbB-4 |
| KDM4B | 46 | 54 | Lysine (K)-specific
demethylase 4B |
| MLPH | 67 | 54 | Melanophilin |
| MYB | 50 | 54 | Myb proto-oncogene
protein |
| XBP1 | 63 | 54 | X-box binding
protein 1 |
| AGR2 | 63 | 50 | Anterior gradient
homolog 2 |
| DACH1 | 33 | 50 | Dachshund homolog
1 |
| FBP1 | 50 | 50 |
Fructose-1,6-bisphosphatase 1 |
| IL6ST | 42 | 50 | Glycoprotein
130 |
| MAGED2 | 50 | 50 | Melanoma antigen
fmily D, 2 |
| TFF1 | 50 | 50 | Trefoil factor
1 |
| VAV3 | 46 | 50 | Guanine nucleotide
exchange factor |
| ACADSB | 38 | 46 | Acyl-CoA
dehydrogenase, short/branched chain |
| GFRA1 | 33 | 46 | GDNF family
receptor alpha-1 |
| INPP4B | 46 | 46 | Inositol
polyphosphate-4-phosphatase |
|
KIAA1324 | 29 | 46 | Estrogen-induced
gene 121 |
| PGR | 29 | 46 | Progesterone
receptor |
| SCNN1A | 54 | 46 | Sodium channel,
non-voltage-gated 1 alpha subunit |
| SLC44A4 | 54 | 46 | Choline
transporter-like protein 4 |
| SLC7A8 | 33 | 46 | Solute carrier
family 7 (amino acid transporter light chain, L system) |
| SPDEF | 54 | 46 | SAM pointed
domain-containing ETS transcription factor |
| BCL2 | 42 | 42 | B-cell lymphoma
2 |
|
C9orf116 | 29 | 42 | Chromosome 9 open
reading frame 116 |
| CACNA1D | 33 | 42 | Calcium channel,
voltage-dependent, L type, alpha 1D subunit |
| EVL | 38 | 42 | Enah/Vasp-like |
| GAMT | 33 | 42 | Guanidinoacetate
N-methyltransferase |
| GPD1L | 42 | 42 |
Glycerol-3-phosphate dehydrogenase
1-like |
| NME5 | 38 | 42 | NME/NM23 family
member 5 |
|
SERPINA5 | 29 | 42 | Serpin peptidase
inhibitor, clade A (alpha-1 antiproteinase, antitrypsin), member
5 |
| STC2 | 33 | 42 |
Stanniocalcin-related protein |
| SYBU | 38 | 42 | Syntabulin
(syntaxin-interacting) |
| TTC39A | 42 | 42 | Tetratricopeptide
repeat domain 39A |
| ZMYND10 | 33 | 42 | Zinc finger,
MYND-type containing 10 |
| AFF3 | 29 | 38 | AF4/FMR2 family,
member 3 |
| AGR3 | 25 | 38 | Anterior gradient 3
homolog (xenopus laevis) |
| AR | 46 | 38 | Androgen
receptor |
| FAM174B | 46 | 38 | Family with
sequence similarity 174, member B |
| SIDT1 | 46 | 38 | SID1 transmembrane
family, member 1 |
| THSD4 | 25 | 38 | Thrombospondin,
type I, domain containing 4 |
| TSPAN1 | 54 | 38 | Tetraspanin 1 |
| CLSTN2 | 21 | 33 | Calsyntenin 2 |
| CYP2B6 | 21 | 33 | Cytochrome P450,
family 2, subfamily B, polypeptide 6 |
|
CYP2B7P1 | 25 | 33 | Cytochrome P450,
family 2, subfamily B, polypeptide 7 pseudogene 1 |
| ELOVL5 | 29 | 33 | ELOVL fatty acid
elongase 5 |
| FAM134B | 25 | 33 | Family with
sequence similarity 134, member B |
| KCNK15 | 29 | 33 | Potassium channel,
subfamily K, member 15 |
| RERG | 21 | 33 | RAS-like,
estrogen-regulated, growth inhibitor |
| RHOB | 42 | 33 | Ras homolog family
member B |
| SLC16A6 | 33 | 33 | Solute carrier
family 16, member 6 (monocarboxylic acid transporter 7) |
| SLC22A5 | 21 | 33 | Solute carrier
family 22 (organic cation/carnitine transporter), member 5 |
| UGCG | 25 | 33 | UDP-glucose
ceramide glucosyltransferase |
| ZNF552 | 38 | 33 | Zinc finger protein
552 |
| ABCC8 | 21 | 29 | ATP-binding
cassette transporter sub-family C member 8 |
| C5orf30 | 21 | 29 | Chromosome 5 open
reading frame 30 |
| C6orf97 | 21 | 29 | Chromosome 6 open
reading frame 97 |
| CYB5A | 29 | 29 | Cytochrome B5 type
A (microsomal) |
| DYNLRB2 | 21 | 29 | Dynein, light
chain, roadblock-type 2 |
| GSTM3 | 25 | 29 | Glutathione
S-transferase mu 3 (brain) |
| IRS1 | 21 | 29 | Insulin Receptor
Substrate 1 |
| MAST4 | 25 | 29 | Microtubule
associated serine/threonine kinase family member 4 |
| MCCC2 | 29 | 29 | Methylcrotonoyl-CoA
carboxylase 2 (beta) |
| MTL5 | 29 | 29 |
Metallothionein-like 5, testis-specific
(tesmin) |
| PNPLA4 | 25 | 29 | Patatin-like
phospholipase domain containing 4 |
| PTPRT | 21 | 29 | Protein tyrosine
phosphatase, receptor type, T |
| RABEP1 | 25 | 29 | Rabaptin, RAB
GTPase binding effector protein 1 |
| SEMA3B | 25 | 29 | Sema domain,
immunoglobulin domain (Ig), short basic domain, secreted,
(semaphorin) 3B |
| SIAH2 | 29 | 29 | Siah E3 ubiquitin
protein ligase 2 |
| SYT17 | 25 | 29 | Synaptotagmin
XVII |
| TSPAN13 | 33 | 29 | Tetraspanin 13 |
| ABLIM3 | 21 | 25 | Actin binding LIM
protein family, member 3 |
| AKR7A3 | 29 | 25 | Aldo-keto reductase
family 7, member a3 (aflatoxin aldehyde reductase) |
|
C10orf116 | 29 | 25 | Chromosome 10 open
reading frame 116 |
| CRIP1 | 29 | 25 | Cysteine-rich
protein 1 (intestinal) |
| ERBB3 | 21 | 25 | V-Erb-B2
erythroblastic leukemia viral oncogene homolog 3 (avian) |
| FSIP1 | 21 | 25 | Fibrous sheath
interacting protein 1 |
| GALNT6 | 33 | 25 | Polypeptide
N-acetylgalactosaminyltransferase 6 |
| INPP5J | 25 | 25 | Inositol
polyphosphate-5-phosphatase J |
| KCTD3 | 21 | 25 | Potassium channel
tetramerisation domain containing 3 |
| KIF5C | 25 | 25 | Kinesin family
member 5C |
| MED13L | 25 | 25 | Mediator complex
subunit 13-like |
| RAB17 | 33 | 25 | Ras-related protein
Rab-17 |
| RBM47 | 33 | 25 | RNA binding motif
protein 47 |
| SCCPDH | 25 | 25 | Saccharopine
dehydrogenase (putative) |
| SEMA3F | 25 | 25 | Sema domain,
immunoglobulin domain (Ig), short basic domain, secreted,
(semaphorin) 3F |
| SLC2A10 | 29 | 25 | Solute carrier
family 2 (facilitated glucose transporter), member 10 |
| TBX3 | 21 | 25 | T-box protein
3 |
| TOX3 | 38 | 25 | TOX high mobility
group box family Member 3 |
| WFS1 | 21 | 25 | Wolfram syndrome 1
(wolframin) |
| CAMK2N1 | 25 | 21 |
Calcium/calmodulin-dependent protein
kinase II inhibitor 1 |
| EFHC1 | 21 | 21 | EF-hand domain
(C-terminal) containing 1 |
| FAAH | 21 | 21 | Fatty acid amide
hydrolase |
| GALNT7 | 29 | 21 |
UDP-N-acetyl-alpha-D-galactosamine:polypeptide
N-acetylgalactosaminyltransferase 7 (GalNAc-T7) |
|
KIAA0040 | 21 | 21 | Uncharacterized
protein KIAA0040 |
| LASS6 | 29 | 21 | LAG1 homolog,
ceramide synthase 6 |
| LRBA | 21 | 21 | LPS-responsive
vesicle trafficking, beach and anchor containing |
| METRN | 21 | 21 | Meteorin, glial
cell differentiation regulator |
| MREG | 21 | 21 | Melanoregulin |
| RAB26 | 29 | 21 | RAB26, member RAS
oncogene family |
| RNF103 | 21 | 21 | Ring finger protein
103 |
The transcription factor ESR is overexpressed in 70%
of BCs, and is a major target for endocrine therapies for luminal A
BC patients (13). Dimeric ESR binds
to promoter and distant enhancer regions of E2-sensitive genes to
regulate their expression. The binding of FOXA1 to enhancer regions
of the compact chromatin facilitates remodeling at the ESR1 binding
regions (23,30,70);
therefore, FOXA1 is also known as ‘pioneer’ transcription factor
(20). When the 115 overlapping genes
from microarrays (cut-off frequency of 5) were compared with
ESR1-stimulated genes (71), ~22% of
ESR1 and 17% of FOXA1 genes were represented in the
overlapping, co-expressed FOXA1:ESR1 microarray gene cluster
(Table VI). Furthermore, comparisons
were performed only for 51 of the ESR1-upregulated genes identified
by Tozlu et al (71), but
these 51 genes were not classified as such if they were regulated
classically or in a non-genomic manner by ESR1 protein.
| Table VI.Comparison of ESR1 and
FOXA1 co-expression Oncomine™ analysis with 51
estrogen-upregulated genes reported by Tozlu et al (71). |
Table VI.
Comparison of ESR1 and
FOXA1 co-expression Oncomine™ analysis with 51
estrogen-upregulated genes reported by Tozlu et al (71).
| ESR1 | Co-expression
Oncomine™ | FOXA1 | Co-expression
Oncomine™ |
|---|
| ESR1 | + | FOXA1 | + |
| CA12 | + | ESR1 | + |
| GATA3 | + | GATA3 | + |
| NAT1 | + | MLPH |
|
| SLC39A6 | + | AGR2 |
|
| TBC1D9 |
| CA12 | + |
| DNALI1 |
| TFF3 | + |
| FOXA1 | + | XBP1 | + |
| ANXA9 |
| NAT1 | + |
| DNAJC12 | + | SLC39A6 | + |
| TFF3 | + | SPDEF |
|
| ERBB4 | + | TSPAN1 |
|
| MLPH |
| DNAJC12 | + |
| MYB | + | FBP1 |
|
| XBP1 | + | GREB1 |
|
| FBP1 |
| MYB | + |
| IL6ST | + | TFF1 | + |
| MAGED2 |
| AR | + |
| TFF1 | + | FAM174B |
|
| ACADSB | + | KDM4B |
|
| PGR | + | ABAT |
|
| SCNN1A |
| BCL2 | + |
| SLC7A8 |
| IL6ST | + |
| BCL2 | + | TTC39A |
|
|
C9orf116 |
| ACADSB | + |
| CACNA1D |
| ERBB4 | + |
| STC2 | + | CACNA1D |
|
| AR | + | RBM47 |
|
| THSD4 |
| STC2 | + |
| CYP2B6 | + | AFF3 |
|
| RERG | + | CYB5A |
|
| C6orf97 |
| PGR | + |
| PTPRT | + | GPR160 |
|
| RABEP1 | + | GSTM3 |
|
| SEMA3B | + | INPP5J |
|
| AKR7A3 |
| RABEP1 | + |
|
CACNA2D2 |
| SEMA3B | + |
| RAB17 |
| CYP2B6 | + |
| CAMK2N1 |
| KRT18 | + |
| CCDC74B |
| LRBA | + |
| FAAH |
| PTPRT | + |
|
KIAA0040 |
| RERG | + |
| LRBA | + | SLC19A2 |
|
| HPN | + | EEF1A2 |
|
| MYO5C |
| HPN | + |
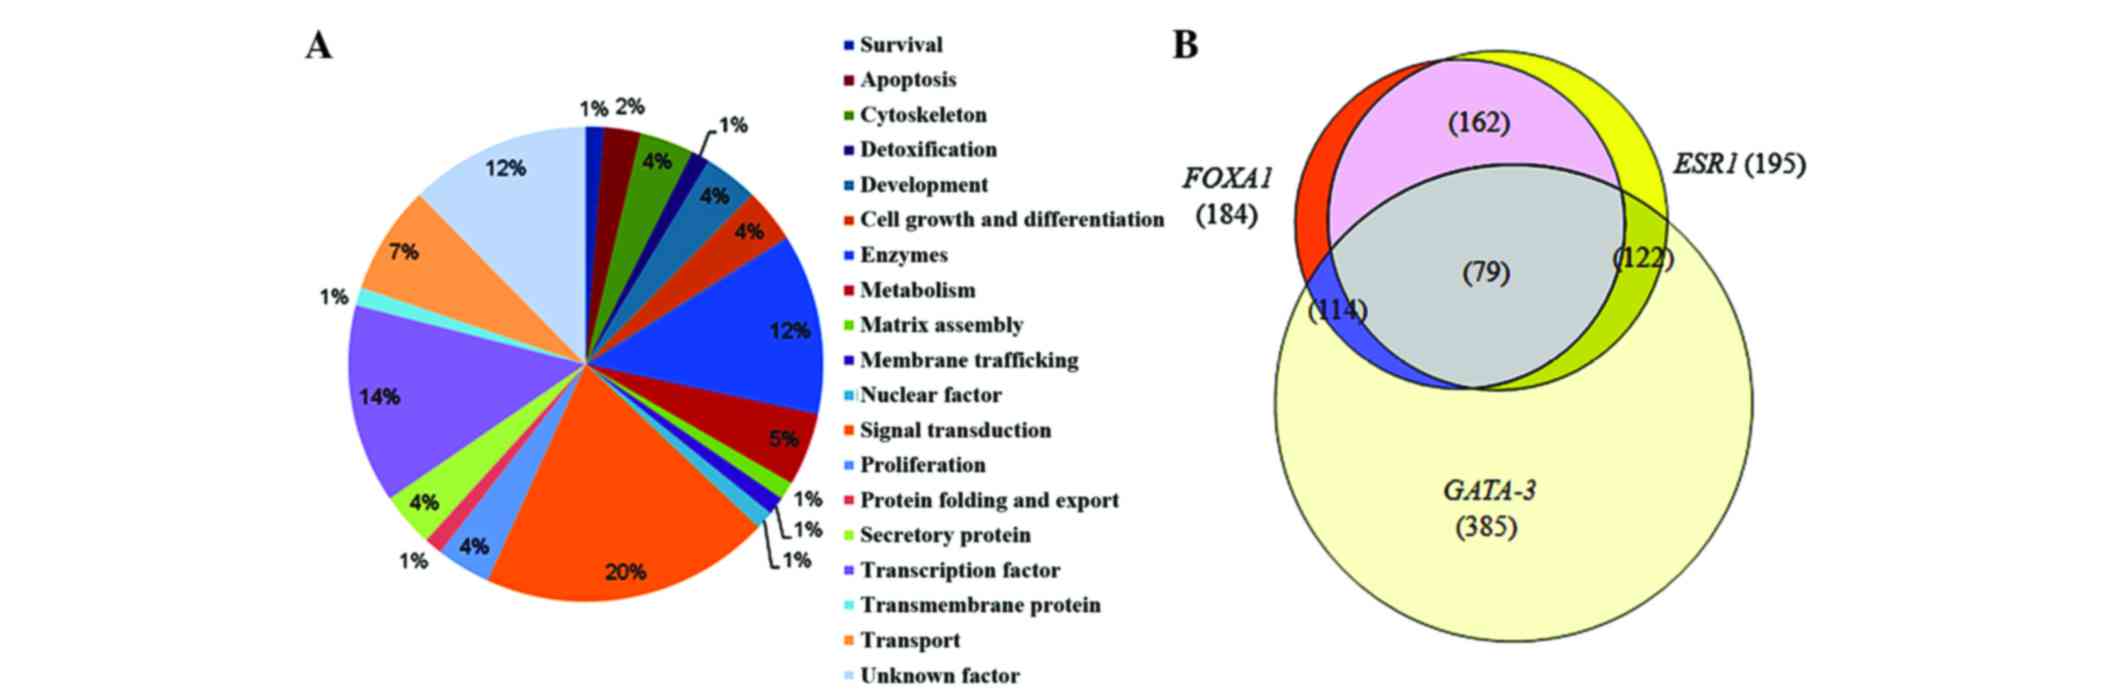
GATA3 is required for mammary gland
morphogenesis and luminal cell differentiation, and is implicated
in BC metastasis and progression (38,72).
Additionally, GATA3 is also closely associated with
ESR1 expression status, and its expression indicates
favorable BC pathological outcome (73). Since GATA3 expression together
with ESR1 and FOXA1 expression correlates strongly
with luminal BC subtypes (33,74),
GATA3 (43) was also observed
to be overlapped with the ESR1:FOXA1 gene cluster.
Approximately 79 genes were co-expressed in all the three
microarrays: ESR1, FOXA1 and GATA3. Notably,
in both co-expression overlaps (FOXA1:ESR1 and
FOXA1:ESR1:GATA3), the majority of genes were involved in
signal transduction (Figs. 1C and
2A), thus suggesting a prominent role
of these genes in BC tumorigenesis. Lin et al demonstrated
by whole-genome microarray analysis that 137 genes were regulated
by ESR1 out of the ~19,000 genes surveyed (75). However, only 89 of the 137
ESR1-regulated genes were direct targets of ESR1. When the
overlapping co-expression gene clusters (FOXA1:ESR1 or
FOXA1:ESR1:GATA3) were compared with the Lin et al
data (74), only 8 genes were
observed to be direct target genes (Table VII). One of the possible reasons for
such low detection of ESR-responsive genes may be the absence of a
responsive DNA element or non-genomic binding through specificity
protein 1, activator protein 1 or specificity protein 3 (76–78). The
pie chart and Venn diagram based on pathways of overlapping
co-expression cluster genes of FOXA1:ESR1 and
FOXA1:ESR1:GATA3 are shown in Fig.
1A-C and Fig. 2A and B,
respectively.
| Table VII.Comparison of ESR1 and
forkhead box protein A1 co-expression Oncomine™ analysis with the
direct targets of ESR1(39). |
Table VII.
Comparison of ESR1 and
forkhead box protein A1 co-expression Oncomine™ analysis with the
direct targets of ESR1(39).
| Genes | Expression
pattern |
|---|
| STC2 | ↑ |
| GREB1 | ↑ |
| SIAH2 | ↑ |
| PGR | ↑ |
| IL6ST | ↑ |
| NRIP1 | ↑ |
| ADCY9 | ↑ |
| CCNG2 | ↓ |
FOXA1, also known as hepatocyte nuclear factor 3α,
is a member of the forkhead class of DNA-binding proteins, and is
co-expressed with ESR1 in BC luminal subtype A (49,79).
Importantly, it has been previously reported that FOXA1-mediated
chromatin changes were not influenced by E2 treatment, but
contributed to the recruitment of ESR to chromatin by creating
optimal binding conditions (70). The
co-expression of ESR1 and FOXA1 is also associated with the luminal
subtype of breast tumors and patient survival (33). Approximately 50% of ESR-E2 responsive
genes require prior FOXA1 binding for their optimal expression
(32,33). As illustrated in luminal A BC cells
MCF7, there is a reduced E2-dependent gene expression and
proliferation during FOXA1 depletion in the cells (30,31). In
addition, RNA interference-mediated depletion of FOXA1 in MCF7
cells leads to a decreased expression of the PS2, BCL2,
SIAH2 and CMYB genes (25). By contrast, in the present study,
ectopic FOXA1 expression was able to regulate the ESR1
target genes PS2, BCL2, PGR, SIAH2, CMYB and GATA3 in
both MCF7 and T47D BC cells (Fig. 3A and
B). The ectopic expression of FOXA1 is shown in Fig. 3A and C.
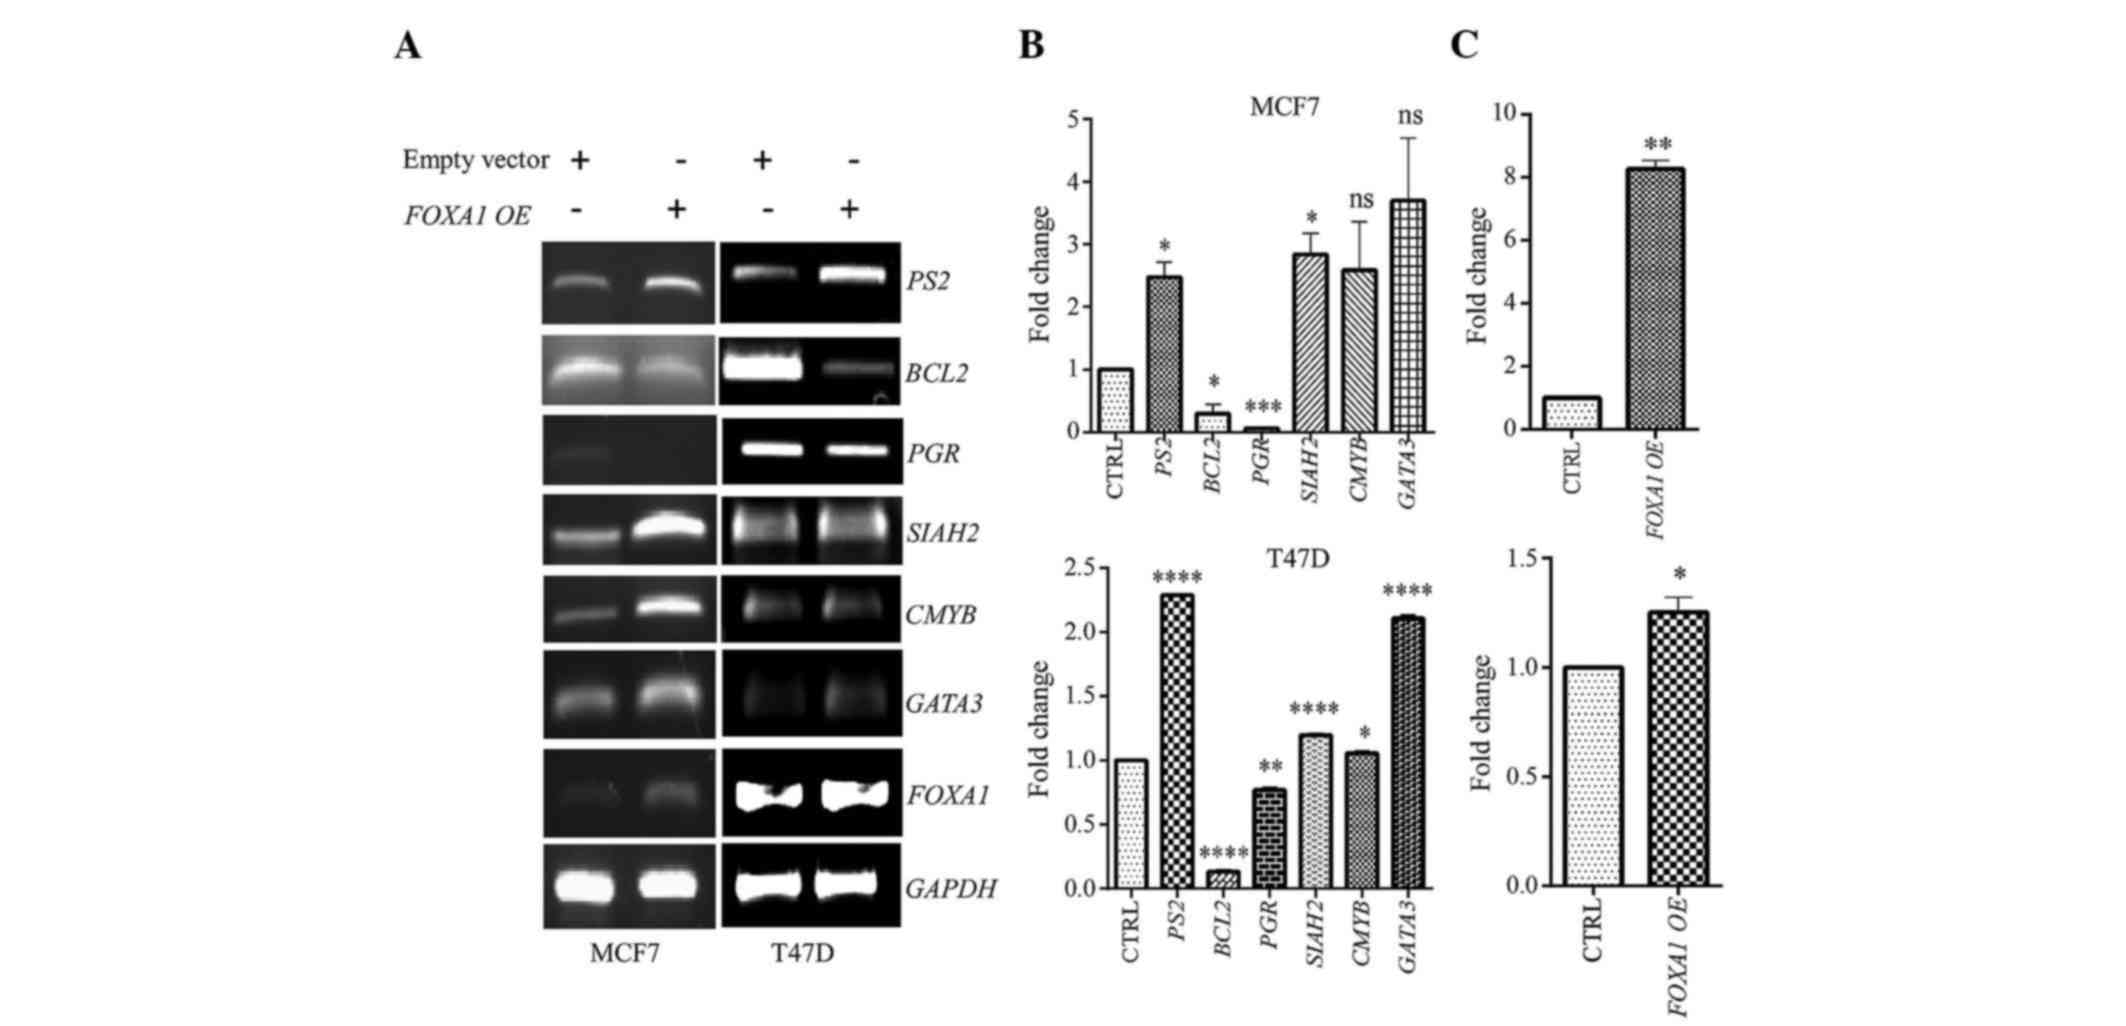 | Figure 3.Gene expression analysis using RT-PCR
and RT-qPCR. Several identified genes from the FOXA1:ESR1
overlapping cluster were examined following ectopic FOXA1
expression in ESR-positive MCF7 and T47D cell lines at 24 h
post-transfection. Glyceraldehyde 3-phosphate dehydrogenase was
used as an internal control. (A) Gene expression of
FOXA1:ESR1 overlapping genes using RT-PCR. (B) Gene
expression of FOXA1:ESR1 overlapping genes using RT-qPCR.
(C) FOXA1 overexpression following FOXA1 ectopic
expression, as determined by RT-qPCR. *P≤0.05, **P≤0.01,
***P≤0.001, ****P≤0.0001, vs. the control. ns, not significant;
RT-qPCR, reverse transcription-quantitative polymerase chain
reaction; BCL2, B-cell lymphoma 2; PGR, progesterone
receptor; GATA3, GATA binding protein 3; FOXA1,
forkhead box protein A1; GAPDH, glyceraldehyde 3-phosphate
dehydrogenase; CTRL, control; OE, overexpression; PS2,
trefoil factor 1; SIAH2, seven in absentia homolog 2;
CMYB, cellular myeloblastosis viral oncogene homolog. |
The secretory protein trefoil factor (TFF) 1 or PS2
is abnormally expressed in ~50% of BCs (80). In mammary carcinoma, forced PS2
expression resulted in increased cell proliferation and survival in
mammary carcinoma cells with anchorage-independent growth,
migration and invasion in a xenograft model (81). The present study identified that the
PS2 gene co-expresses with ESR1 and FOXA1, but
the molecular pathway involved is not clearly understood.
Bioinformatic analysis of the PS2 promoter indicated the
presence of two FOXA1 binding sites at 8 bp downstream and 132 bp
upstream, respectively, of a molecularly characterized ERE site in
the PS2 promoter (Fig. 4A).
EMSA confirmed that FOXA1 binds to the PS2 promoter at FOXA1
site 1 (−546 to 534 nucleotide position) and FOXA1 site 2 (−390 to
−378 nucleotide position) (Fig. 4B and
C). To confirm the specificity of EMSA binding, cold probe
(non-radioactively labeled) competition with FOXA1 consensus
sequence was performed for both EMSA1 and EMSA2 sequences. With
increasing concentrations of cold probe (100–150-fold) there was a
clear indication of cold probe competition, as observed by the
decreased protein-DNA complex (Fig.
4B). In vivo ChIP assay also confirmed FOXA1 binding in
both sites using an anti-FOXA1 antibody (Fig. 4C). A similar in vitro assay for
the ERE site in PS2 was not performed, as it was confirmed
previously by Amiry et al (81). Notably, an enhanced recruitment of
FOXA1 to its site was also observed during E2 stimulation.
Subsequently, enhanced FOXA1 recruitment to the FOXA1 site also
resulted in elevated levels of ESR1 recruitment to the ERE site of
the PS2 gene. In addition, there was also a slight
recruitment of FOXA1 to the ERE site during E2 stimulation
(Fig. 5). To understand the effect of
ESR1 and FOXA1 co-expression on the PS2 gene
and other FOXA/ESR1 co-regulated genes, transient
transfection was performed in ESR1+ T47D BC cells.
PS2 along with CMYB, BCL2 and SIAH2
were significantly regulated by FOXA1, and co-transfection
with ESR1 expression plasmid suggested an interaction
between these genes. Importantly, the regulation was significantly
enhanced during ESR1 and FOXA1 co-transfection
compared with only FOXA1-transfected cells (Fig. 6). For example, the target genes
CMYB, SIAH2 and PS2 were significantly
upregulated upon co-transfection with ESR1/FOXA1
expression plasmids, thus suggesting a co-regulatory function of
ESR1/FOXA1 on the above target genes. In the case of
the PS2 gene, FOXA1 and ESR1 responsive
elements were observed to be separated by ~122 nucleotides
(Fig. 4A). Therefore, one of the
probable reasons for enhanced PS2 transcription during
FOXA1/ESR1 co-transfection may be the recruitment of
ESR1 and FOXA1 to their respective responsive sites,
thereby causing a synergistic effect. However, the presence of
FOXA1 sites adjacent to ERE in the promoter of other target genes
remains to be determined. In addition to PS2, the
established target gene of ESR1, other genes such as
BCL2, PGR, SIAH2 and CMYB were also detected in both
the co-expression overlapping genes and in individual microarrays
with ESR1 and FOXA1, which suggests the validity of
the present meta-analysis.
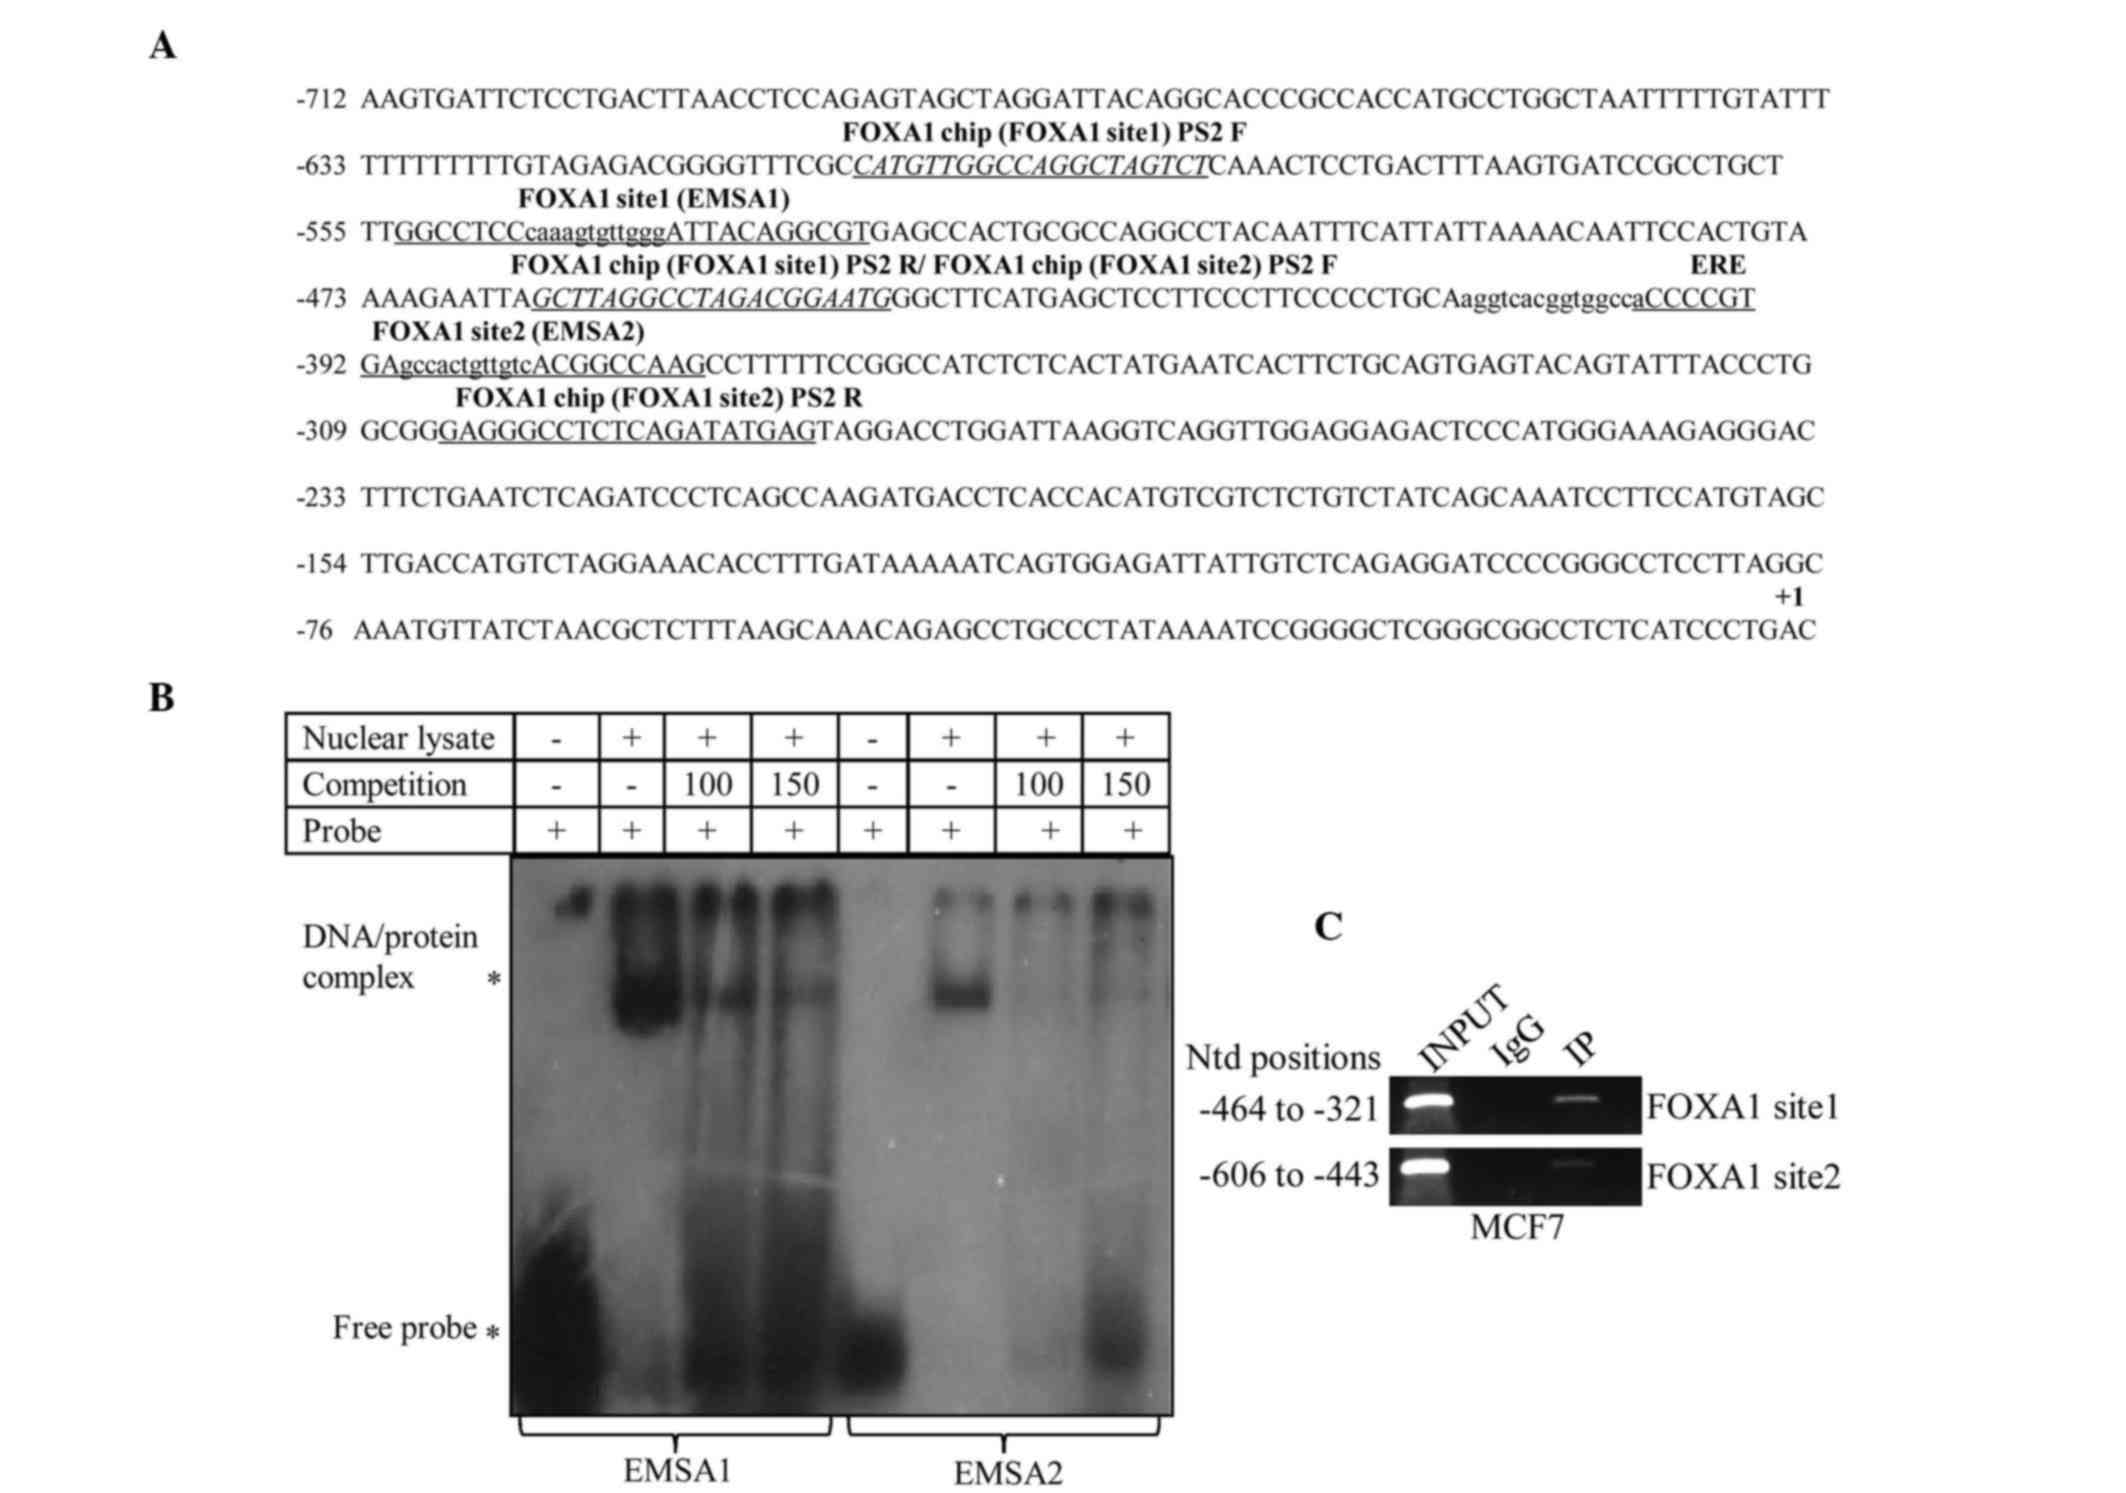 | Figure 4.Schematic representation of the
PS2 promoter. (A) Schematic diagram showing the presence of
a functional estrogen response element (−407 nucleotide position)
and two putative FOXA1 binding sites at −384 and −539
nucleotide positions, respectively. (B) In vitro binding
assay. A total of 30 bp oligonucleotides containing FOXA1
binding sites were labeled with γ32P radioisotope and
incubated with nuclear lysate extracted from MCF7 cells. An
unlabeled FOXA1 (cold probe) consensus sequence was used for
competition at 100 and 150-fold molar excess. The reactions were
subjected to electrophoresis in a 6% polyacrylamide gel at 180 V in
0.5X Tris/borate/ethylenediaminetetraacetic acid for ~1 h, and
subsequently, the gel was dried and autoradiographed. (C) In
vivo ChIP assay was performed for FOXA1 binding sites
using an anti-FOXA1 antibody. The DNA elute from ChIP was subjected
to polymerase chain reaction analysis from −321 to −464 and from
−443 to −606 nucleotide positions for site 1 and site 2,
respectively. FOXA1, forkhead box protein A1; ERE, estrogen
response element; ChIP, chromatin immunoprecipitation; EMSA,
electrophoretic mobility shift assay; IP, immunoprecipitation; IgG,
immunoglobulin G; Ntd, nucleotide; PS2, trefoil factor
1. |
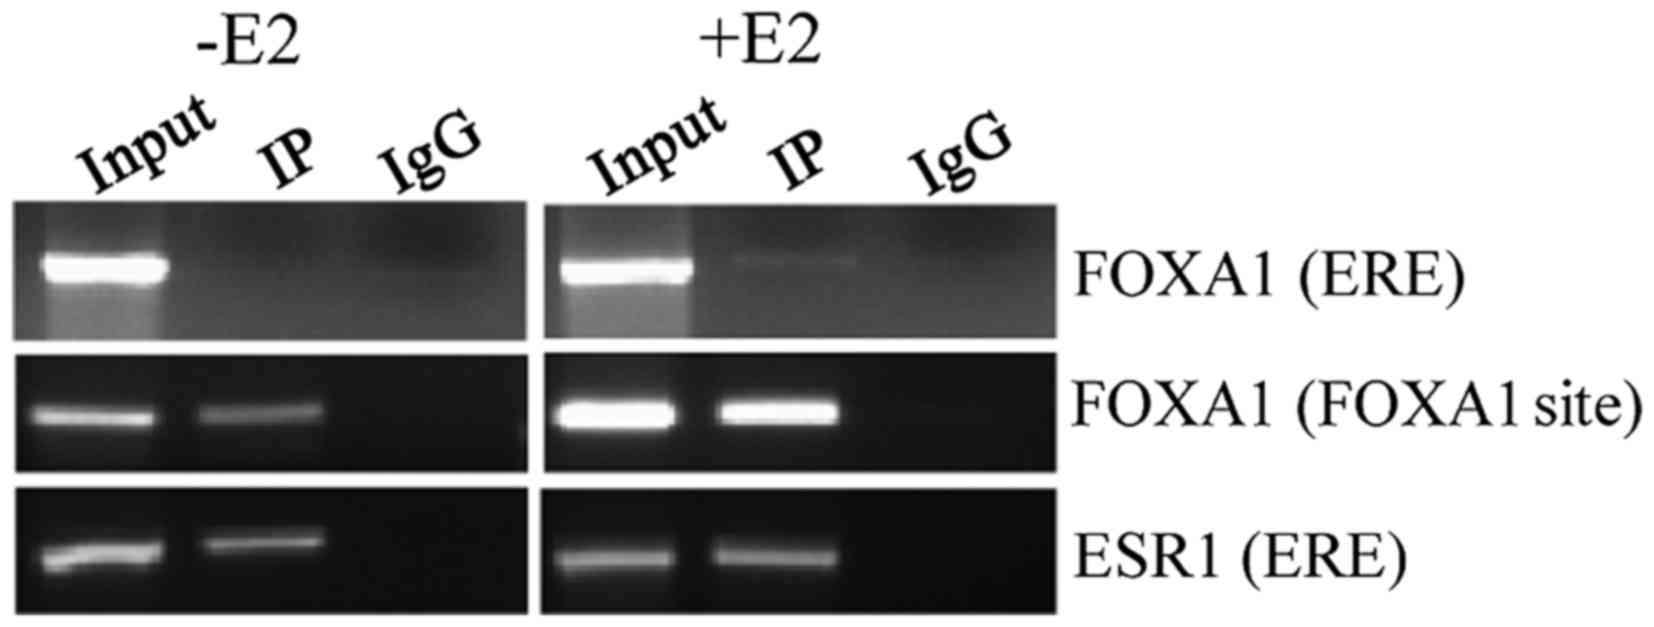 | Figure 5.Effect of FOXA1 and
ESR1 on the PS2 promoter. For ChIP assay, MCF7 cells
in the absence or presence of estradiol stimulation were sonicated,
lysed and pre-cleared. ChIP with specific antibodies against FOXA1
and ESR1 along with corresponding control Ig G was performed. The
nucleotide positions −573 to −315 and −506 to −344 represent the
ERE and FOXA1 binding sequences, respectively, in the
PS2 promoter. The eluted ChIP DNA samples were subjected to
PCR analysis using ERE or FOXA1 site-specific primers. The
PCR samples were electrophoresed in a 2% agarose gel. E2,
estradiol; Ntd, nucleotide; IP, immunoprecipitation; IgG,
immunoglobulin G; FOXA1, forkhead box protein A1; ERE,
estrogen response element; ESR1, estrogen receptor 1; ChIP,
chromatin immunoprecipitation; PCR, polymerase chain reaction;
PS2, trefoil factor 1. |
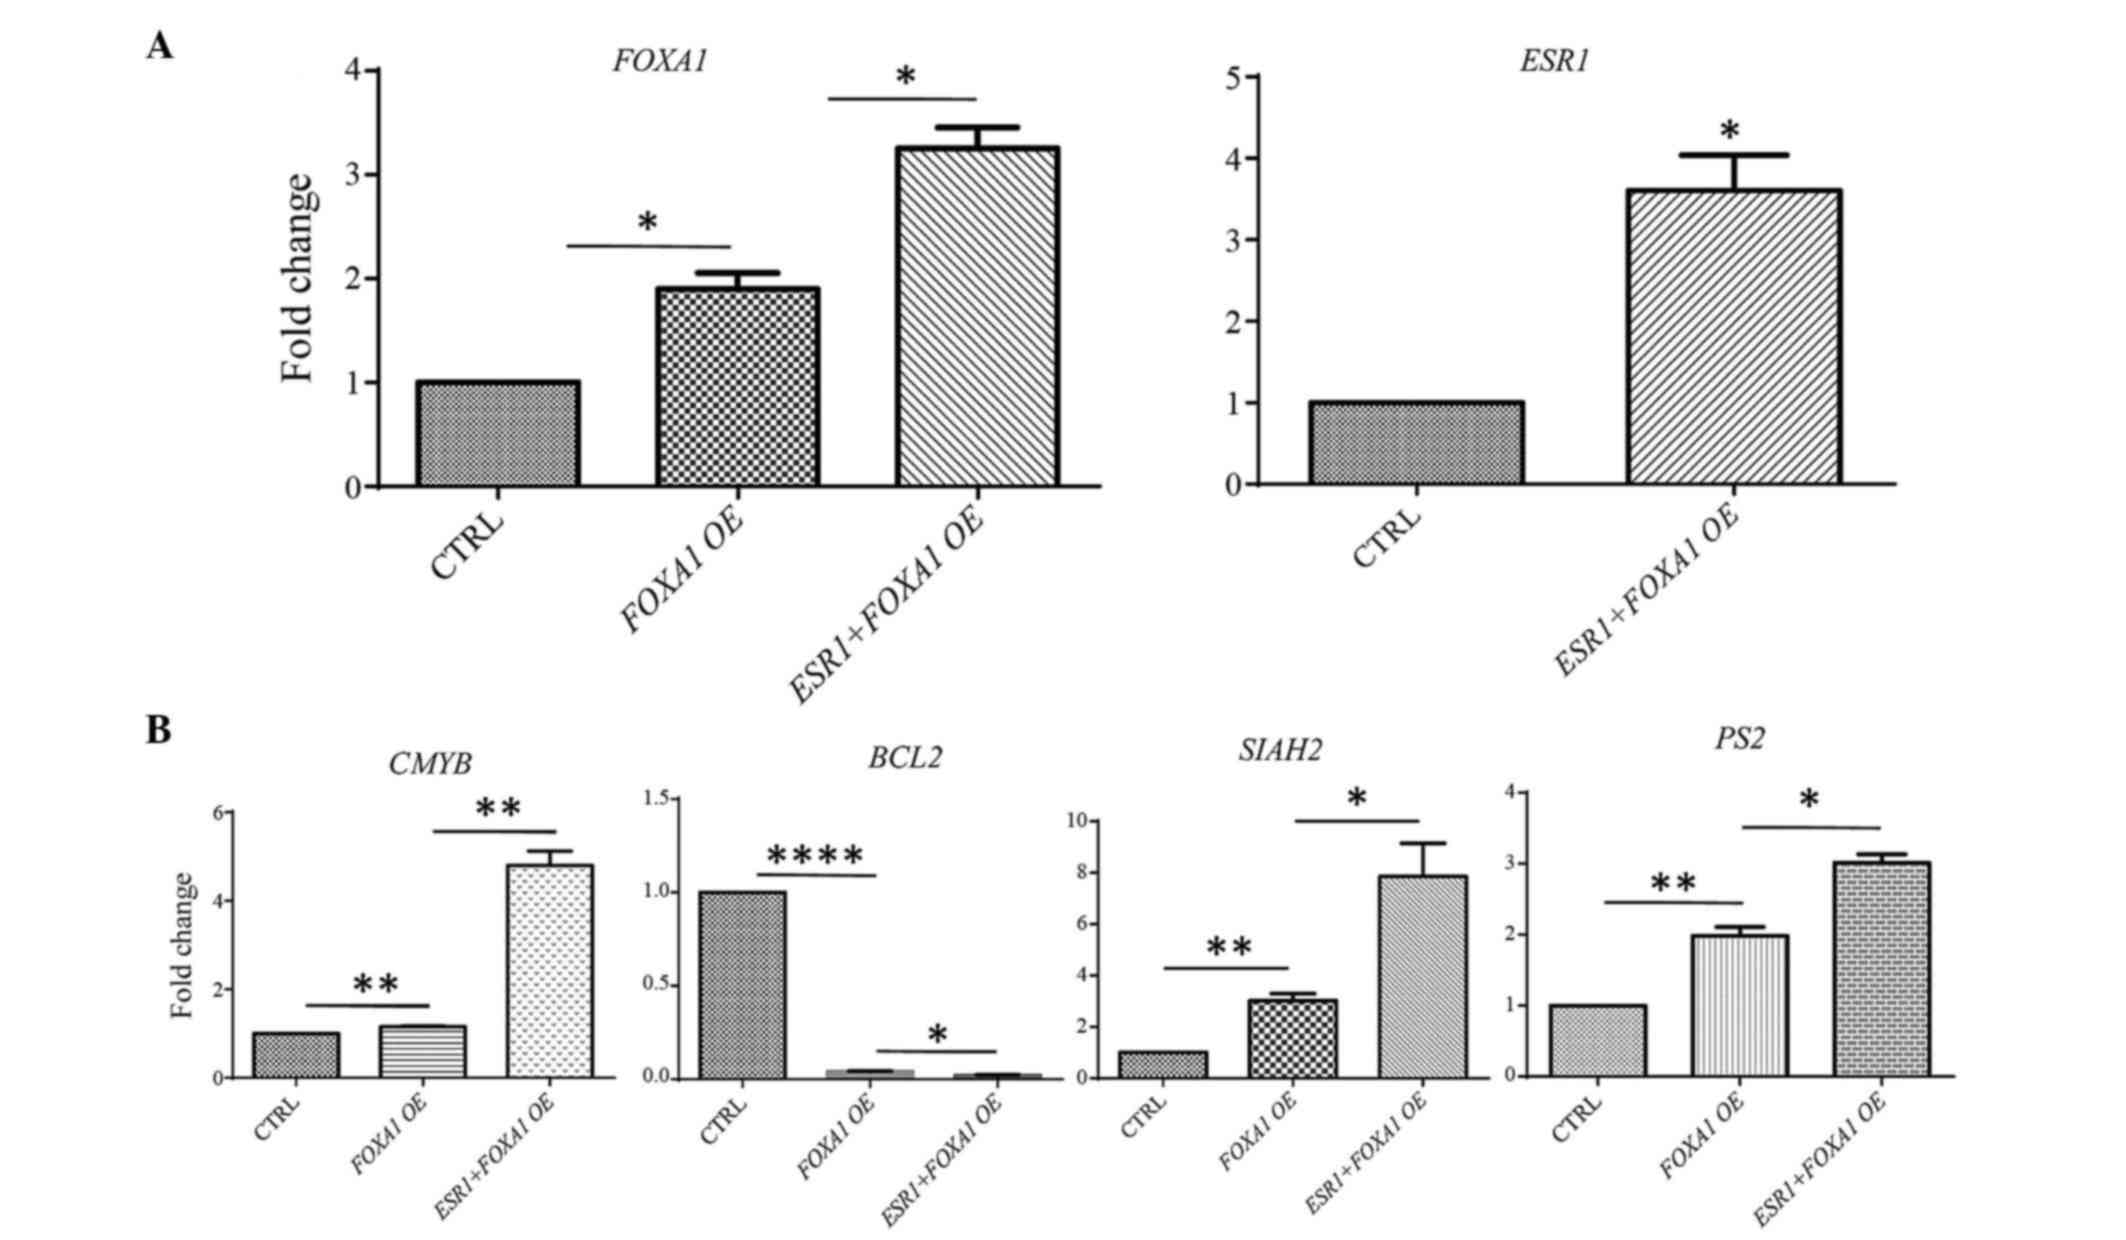 | Figure 6.Quantification of target genes
regulated by FOXA1 and FOXA/ESR1 extracted
from multi-array analysis. RT-qPCR was performed from FOXA1
and FOXA1/ESR1-transfected samples in the T47D cell
line. (A) Overexpression of FOXA1 and ESR1 was
confirmed by RT-qPCR in FOXA1 and
FOXA1/ESR1-co-transfected cells. (B) Effect of
FOXA1 and FOXA1/ESR1 transfection on the
target genes (CMYB, B-cell lymphoma 2, SIAH2 and
PS2) at 24 h post-transient transfection in T47D cells. The
bar diagram represents data derived from triplicate experiments.
*P≤0.05, **P≤0.001, ***P≤0.001, ****P≤0.0001. CTRL, control;
FOXA1, forkhead box protein A1; ESR1, estrogen
receptor 1; RT-qPCR, reverse transcription-quantitative polymerase
chain reaction; OE, overexpression; PS2, trefoil factor 1;
SIAH2, seven in absentia homolog 2; CMYB, cellular
myeloblastosis viral oncogene homolog. |
In addition to extrapolating highly correlated
overlapping genes, the present study also enabled the comparison of
genes that may not always have high correlation coefficient values,
and provide an advantage in clustering co-expression overlapping
genes based on their pathway (Figs.
1C and 2B). In addition to the
ESR-established pathway genes (GATA3, growth regulation by
estrogen in breast cancer 1, TFF1, TFF3, epidermal growth
factor receptor 4, MYB, PGR and BCL2), novel pathways
can be proposed according to the results of the present study,
including protein folding (DnaJ heat shock protein family 40 member
C12), development and differentiation (neural proliferation,
differentiation and control 1, anterior gradient 2,
metallothionein-like 5, semaphorin 3B, actin-binding LIM protein 3,
chromosome 10 open reading frame 116, T-box 3 and meteorin) and
metabolism (solute carrier family 39, member 6, 4-aminobutyrate
aminotransferase, elongation of very long chain fatty acids protein
5, methylcrotonoyl-CoA carboxylase 2 and cytochrome P450 2B6),
which have a direct and indirect influence during
tumorigenesis.
In the present study, co-expression analysis has
been used to depict overlapping co-regulatory genes in known
pathways; however, this analysis has certain caveats. First, the
overlapping genes were clustered based on gene ontology data.
Second, the clustered meta-analysis genes are only a predictive
hypothesis, which requires experimental validation. Third, it may
be possible that a number of true FOXA1:ESR1 pathways
interacting partners are lost due to the stringency used in the
analysis. However, the present analysis provides novel pathways for
assessing the FOXA1:ESR1 and FOXA1:ESR1:GATA3
signaling pathway axes, particularly in breast tumorigenesis.
In conclusion, Oncomine™ co-expression
meta-analysis provided a cluster of genes with definitive pathways
based on stronger co-expression co-efficient analysis using
different microarrays, which may be of higher significance than a
single microarray. To the best of our knowledge, the present is the
first study to provide insight into FOXA1:ESR1 and
FOXA1:ESR1:GATA3 co-expressed genes involved in BC
tumorigenesis. The microarray analysis also provides information on
novel intricate pathways, including protein folding, metabolism,
development and differentiation. To understand the role of these
predictive pathways, a future experimental model is required to
further validate the present findings.
Acknowledgements
The present study was supported by a core grant
from the Institute of Life Sciences, Department of Biotechnology,
Government of India (New Delhi, India) awarded to S.C. and B.M.K.
The authors thank Kathi Downs (Sr. Inside Sales and Support
Specialist, Compendia Bioscience; Thermo Fisher Scientific, Inc.)
for providing the trail version of Oncomine™ and Dr Karen L.
(American Journal Experts, LLC, Durham, NC, USA) for editing the
present manuscript.
References
|
1
|
Colditz GA: Relationship between estrogen
levels, use of hormone replacement therapy, and breast cancer. J
Natl Cancer Inst. 90:814–823. 1998. View Article : Google Scholar : PubMed/NCBI
|
|
2
|
Nomura Y, Tashiro H, Hamada Y and
Shigematsu T: Relationship between estrogen receptors and risk
factors of breast cancer in Japanese pre- and postmenopausal
patients. Breast Cancer Res Treat. 4:37–43. 1984. View Article : Google Scholar : PubMed/NCBI
|
|
3
|
Borellini F and Oka T: Growth control and
differentiation in mammary epithelial cells. Environ Health
Perspect. 80:85–99. 1989. View Article : Google Scholar : PubMed/NCBI
|
|
4
|
Zhang HZ, Bennett JM, Smith KT, Sunil N
and Haslam SZ: Estrogen mediates mammary epithelial cell
proliferation in serum-free culture indirectly via mammary
stroma-derived hepatocyte growth factor. Endocrinology.
143:3427–3434. 2002. View Article : Google Scholar : PubMed/NCBI
|
|
5
|
Richert MM, Schwertfeger KL, Ryder JW and
Anderson SM: An atlas of mouse mammary gland development. J Mammary
Gland Biol Neoplasia. 5:227–241. 2000. View Article : Google Scholar : PubMed/NCBI
|
|
6
|
Clarke RB, Howell A, Potten CS and
Anderson E: Dissociation between steroid receptor expression and
cell proliferation in the human breast. Cancer Res. 57:4987–4991.
1997.PubMed/NCBI
|
|
7
|
Russo J, Ao X, Grill C and Russo IH:
Pattern of distribution of cells positive for estrogen receptor
alpha and progesterone receptor in relation to proliferating cells
in the mammary gland. Breast Cancer Res Treat. 53:217–227. 1999.
View Article : Google Scholar : PubMed/NCBI
|
|
8
|
Ali S and Coombes RC: Endocrine-responsive
breast cancer and strategies for combating resistance. Nat Rev
Cancer. 2:101–112. 2002. View
Article : Google Scholar : PubMed/NCBI
|
|
9
|
Jiang Y, Zou L, Lu WQ, Zhang Y and Shen
AG: Foxo3a expression is a prognostic marker in breast cancer. PloS
One. 8:e707462013. View Article : Google Scholar : PubMed/NCBI
|
|
10
|
Gross JM and Yee D: How does the estrogen
receptor work? Breast Cancer Res. 4:62–64. 2002. View Article : Google Scholar : PubMed/NCBI
|
|
11
|
Power KA and Thompson LU: Ligand-induced
regulation of ERalpha and ERbeta is indicative of human breast
cancer cell proliferation. Breast Cancer Res Treat. 81:209–221.
2003. View Article : Google Scholar : PubMed/NCBI
|
|
12
|
Akaogi K, Nakajima Y, Ito I, Kawasaki S,
Oie SH, Murayama A, Kimura K and Yanagisawa J: KLF4 suppresses
estrogen-dependent breast cancer growth by inhibiting the
transcriptional activity of ERalpha. Oncogene. 28:2894–2902. 2009.
View Article : Google Scholar : PubMed/NCBI
|
|
13
|
Lumachi F, Brunello A, Maruzzo M, Basso U
and Basso SM: Treatment of estrogen receptor-positive breast
cancer. Curr Med Chem. 20:596–604. 2013. View Article : Google Scholar : PubMed/NCBI
|
|
14
|
Breast Cancer Trialists' Collaborative
Group, . Systemic treatment of early breast cancer by hormonal,
cytotoxic, or immune therapy. 133 randomised trials involving
31,000 recurrences and 24,000 deaths among 75,000 women. Early
Breast Cancer Trialists' Collaborative Group. Lancet. 339:71–85.
1992.PubMed/NCBI
|
|
15
|
Osborne CK: Tamoxifen in the treatment of
breast cancer. N Engl J Med. 339:1609–1618. 1998. View Article : Google Scholar : PubMed/NCBI
|
|
16
|
Osborne CK and Schiff R: Mechanisms of
endocrine resistance in breast cancer. Annu Rev Med. 62:233–247.
2011. View Article : Google Scholar : PubMed/NCBI
|
|
17
|
Garcia-Becerra R, Santos N, Diaz L and
Camacho J: Mechanisms of resistance to endocrine therapy in breast
cancer: Focus on signaling pathways, miRNAs and genetically based
resistance. Int J Mol Sci. 14:108–145. 2013. View Article : Google Scholar
|
|
18
|
Kabel AM, Altalhi D, Alsharabi H, Qadi O
and Ad Khan M: Tamoxifen-resistant breast cancer: Causes of
resistance and possible management. Journal of Cancer Research and
Treatment. 4:37–40. 2016.
|
|
19
|
Lin L, Miller CT, Contreras JI, Prescott
MS, Dagenais SL, Wu R, Yee J, Orringer MB, Misek DE, Hanash SM, et
al: The hepatocyte nuclear factor 3 alpha gene, HNF3alpha (FOXA1),
on chromosome band 14q13 is amplified and overexpressed in
esophageal and lung adenocarcinomas. Cancer Res. 62:5273–5279.
2002.PubMed/NCBI
|
|
20
|
Sekiya T, Muthurajan UM, Luger K, Tulin AV
and Zaret KS: Nucleosome-binding affinity as a primary determinant
of the nuclear mobility of the pioneer transcription factor FoxA.
Genes Dev. 23:804–809. 2009. View Article : Google Scholar : PubMed/NCBI
|
|
21
|
Costa RH, Grayson DR and Darnell JE Jr:
Multiple hepatocyte-enriched nuclear factors function in the
regulation of transthyretin and alpha 1-antitrypsin genes. Mol Cell
Biol. 9:1415–1425. 1989. View Article : Google Scholar : PubMed/NCBI
|
|
22
|
Tilghman SM and Belayew A: Transcriptional
control of the murine albumin/alpha-fetoprotein locus during
development. Proc Natl Acad Sci USA. 79:pp. 5254–5257. 1982;
View Article : Google Scholar : PubMed/NCBI
|
|
23
|
Kaestner KH: The hepatocyte nuclear factor
3 (HNF3 or FOXA) family in metabolism. Trends Endocrinol Metab.
11:281–285. 2000. View Article : Google Scholar : PubMed/NCBI
|
|
24
|
Lee CS, Friedman JR, Fulmer JT and
Kaestner KH: The initiation of liver development is dependent on
Foxa transcription factors. Nature. 435:944–947. 2005. View Article : Google Scholar : PubMed/NCBI
|
|
25
|
Bernardo GM and Keri RA: FOXA1: A
transcription factor with parallel functions in development and
cancer. Biosci Rep. 32:113–130. 2012. View Article : Google Scholar : PubMed/NCBI
|
|
26
|
Cirillo LA, McPherson CE, Bossard P,
Stevens K, Cherian S, Shim EY, Clark KL, Burley SK and Zaret KS:
Binding of the winged-helix transcription factor HNF3 to a linker
histone site on the nucleosome. EMBO J. 17:244–254. 1998.
View Article : Google Scholar : PubMed/NCBI
|
|
27
|
Lupien M, Eeckhoute J, Meyer CA, Wang Q,
Zhang Y, Li W, Carroll JS, Liu XS and Brown M: FoxA1 translates
epigenetic signatures into enhancer-driven lineage-specific
transcription. Cell. 132:958–970. 2008. View Article : Google Scholar : PubMed/NCBI
|
|
28
|
Lacroix M and Leclercq G: About GATA3,
HNF3A, and XBP1, three genes co-expressed with the oestrogen
receptor-alpha gene (ESR1) in breast cancer. Mol Cell Endocrinol.
219:1–7. 2004. View Article : Google Scholar : PubMed/NCBI
|
|
29
|
Mirosevich J, Gao N, Gupta A, Shappell SB,
Jove R and Matusik RJ: Expression and role of Foxa proteins in
prostate cancer. Prostate. 66:1013–1028. 2006. View Article : Google Scholar : PubMed/NCBI
|
|
30
|
Carroll JS and Brown M: Estrogen receptor
target gene: An evolving concept. Molecular Endocrinol.
20:1707–1714. 2006. View Article : Google Scholar
|
|
31
|
Laganiere J, Deblois G, Lefebvre C,
Bataille AR, Robert F and Giguère V: From the Cover: Location
analysis of estrogen receptor alpha target promoters reveals that
FOXA1 defines a domain of the estrogen response. Proc Natl Acad Sci
USA. 102:pp. 11651–11656. 2005; View Article : Google Scholar : PubMed/NCBI
|
|
32
|
Thorat MA, Marchio C, Morimiya A, Savage
K, Nakshatri H, Reis-Filho JS and Badve S: Forkhead box A1
expression in breast cancer is associated with luminal subtype and
good prognosis. J Clin Pathol. 61:327–332. 2008. View Article : Google Scholar : PubMed/NCBI
|
|
33
|
Badve S, Turbin D, Thorat MA, Morimiya A,
Nielsen TO, Perou CM, Dunn S, Huntsman DG and Nakshatri H: FOXA1
expression in breast cancer - correlation with luminal subtype A
and survival. Clinical Cancer Res. 13:4415–4421. 2007. View Article : Google Scholar
|
|
34
|
Burch JB: Regulation of GATA gene
expression during vertebrate development. Semin Cell Dev Biol.
16:71–81. 2005. View Article : Google Scholar : PubMed/NCBI
|
|
35
|
Zheng R and Blobel GA: GATA transcription
factors and cancer. Genes Cancer. 1:1178–1188. 2010. View Article : Google Scholar : PubMed/NCBI
|
|
36
|
Yoon NK, Maresh EL, Shen D, Elshimali Y,
Apple S, Horvath S, Mah V, Bose S, Chia D, Chang HR and Goodglick
L: Higher levels of GATA3 predict better survival in women with
breast cancer. Hum Pathol. 41:1794–1801. 2010. View Article : Google Scholar : PubMed/NCBI
|
|
37
|
Kouros-Mehr H, Slorach EM, Sternlicht MD
and Werb Z: GATA3 maintains the differentiation of the luminal cell
fate in the mammary gland. Cell. 127:1041–1055. 2006. View Article : Google Scholar : PubMed/NCBI
|
|
38
|
Asselin-Labat ML, Sutherland KD, Barker H,
Thomas R, Shackleton M, Forrest NC, Hartley L, Robb L, Grosveld FG,
van der Wees J, et al: GATA3 is an essential regulator of
mammary-gland morphogenesis and luminal-cell differentiation. Nat
Cell Biol. 9:201–209. 2007. View Article : Google Scholar : PubMed/NCBI
|
|
39
|
Schaner ME, Ross DT, Ciaravino G, Sorlie
T, Troyanskaya O, Diehn M, Wang YC, Duran GE, Sikic TL, Caldeira S,
et al: Gene expression patterns in ovarian carcinomas. Mol Biol
Cell. 14:4376–4386. 2003. View Article : Google Scholar : PubMed/NCBI
|
|
40
|
Flouriot G, Griffin C, Kenealy M,
Sonntag-Buck V and Gannon F: Differentially expressed messenger RNA
isoforms of the human estrogen receptor-alpha gene are generated by
alternative splicing and promoter usage. Mol Endocrinol.
12:1939–1954. 1998. View Article : Google Scholar : PubMed/NCBI
|
|
41
|
Albergaria A, Paredes J, Sousa B, Milanezi
F, Carneiro V, Bastos J, Costa S, Vieira D, Lopes N, Lam EW, et al:
Expression of FOXA1 and GATA3 in breast cancer: The prognostic
significance in hormone receptor-negative tumours. Breast Cancer
Res. 11:R402009. View Article : Google Scholar : PubMed/NCBI
|
|
42
|
Wilson BJ and Giguère V: Identification of
novel pathway partners of p68 and p72 RNA helicases through
Oncomine™ meta-analysis. BMC Genomics. 8:4192007. View Article : Google Scholar : PubMed/NCBI
|
|
43
|
Wilson BJ and Giguère V: Meta-analysis of
human cancer microarrays reveals GATA3 is integral to the estrogen
receptor alpha pathway. Mol Cancer. 7:492008. View Article : Google Scholar : PubMed/NCBI
|
|
44
|
Rhodes DR, Yu J, Shanker K, Deshpande N,
Varambally R, Ghosh D, Barrette T, Pandey A and Chinnaiyan AM:
Oncomine™: A cancer microarray database and integrated data-mining
platform. Neoplasia. 6:1–6. 2004. View Article : Google Scholar : PubMed/NCBI
|
|
45
|
Higgins JPT, Wang L, Kambham N, Montgomery
K, Mason V, Vogelmann SU, Lemley KV, Brown PO, Brooks JD and van de
Rijn M: Gene expression in the normal adult human kidney assessed
by complementary DNA microarray. Mol Biol Cell. 15:1–656.
2004.PubMed/NCBI
|
|
46
|
Roth RB, Hevezi P, Lee J, Willhite D,
Lechner SM, Foster AC and Zlotnik A: Gene expression analyses
reveal molecular relationships among 20 regions of the human CNS.
Neurogenetics. 7:67–80. 2006. View Article : Google Scholar : PubMed/NCBI
|
|
47
|
Shyamsundar R, Kim YH, Higgins JP,
Montgomery K, Jorden M, Sethuraman A, van de Rijn M, Botstein D,
Brown PO and Pollack JR: A DNA microarray survey of gene expression
in normal human tissues. Genome Biol. 6:R222005. View Article : Google Scholar : PubMed/NCBI
|
|
48
|
Tabchy A, Valero V, Vidaurre T, Lluch A,
Gomez H, Martin M, Qi Y, Barajas-Figueroa LJ, Souchon E, Coutant C,
et al: Evaluation of a 30-gene paclitaxel, fluorouracil,
doxorubicin and cyclophosphamide chemotherapy response predictor in
a multicenter randomized trial in breast cancer. Clinc Cancer Res.
16:5351–5361. 2010. View Article : Google Scholar
|
|
49
|
Perou CM, Sørlie T, Eisen MB, van de Rijn
M, Jeffrey SS, Rees CA, Pollack JR, Ross DT, Johnsen H, Akslen LA,
et al: Molecular portraits of human breast tumours. Nature.
406:747–752. 2000. View Article : Google Scholar : PubMed/NCBI
|
|
50
|
Su AI, Cooke MP, Ching KA, Hakak Y, Walker
JR, Wiltshire T, Orth AP, Vega RG, Sapinoso LM, Moqrich A, et al:
Large-scale analysis of the human and mouse transcriptomes. Proc
Natl Acad Sci USA. 99:pp. 4465–4470. 2002; View Article : Google Scholar : PubMed/NCBI
|
|
51
|
Zhao H, Langerød A, Ji Y, Nesland JM,
Tibshirani R, Bukholm IK, Kåresen R, Botstein D, Børresen-Dale A
and Jeffrey SS: Different gene expression patterns in invasive
Lobular and ductal carcinomas of the breast. Mol Biol Cell.
15:2523–2536. 2004. View Article : Google Scholar : PubMed/NCBI
|
|
52
|
Yu K, Ganesan K, Miller LD and Tan P: A
modular analysis of breast cancer reveals a novel low-grade
molecular signature in estrogen receptor-positive tumors. Clin
Cancer Res. 12:3288–3296. 2006. View Article : Google Scholar : PubMed/NCBI
|
|
53
|
Wang Y, Klijn JG, Zhang Y, Sieuwerts AM,
Look MP, Yang F, Talantov D, Timmermans M, Meijer-van Gelder ME, Yu
J, et al: Gene-expression profiles to predict distant metastasis of
lymph-node-negative primary breast cancer. Lancet. 365:671–679.
2005. View Article : Google Scholar : PubMed/NCBI
|
|
54
|
Waddell N, Cocciardi S, Johnson J, Healey
S, Marsh A, Riley J, da Silva L, Vargas AC, Reid L; kConFab
Investigators, ; Simpson PT, Lakhani SR and Chenevix-Trench G: Gene
expression profiling of formalin-fixed, paraffin-embedded familial
breast tumours using the whole genome-DASL assay. J Pathol.
221:452–461. 2010.PubMed/NCBI
|
|
55
|
van 't Veer LJ1, Dai H, van de Vijver MJ,
He YD, Hart AA, Mao M, Peterse HL, van der Kooy K, Marton MJ,
Witteveen AT, et al: Gene expression profiling predicts clinical
outcome of breast cancer. Nature. 415:530–536. 2002. View Article : Google Scholar : PubMed/NCBI
|
|
56
|
Schmidt M, Böhm D, von Törne C, Steiner E,
Puhl A, Pilch H, Lehr HA, Hengstler JG, Kölbl H and Gehrmann M: The
humoral immune system has a key prognostic impact in node-negative
breast cancer. Cancer Res. 68:5405–5413. 2008. View Article : Google Scholar : PubMed/NCBI
|
|
57
|
Pollack JR, Sørlie T, Perou CM, Rees CA,
Jeffrey SS, Lonning PE, Tibshirani R, Botstein D, Børresen-Dale AL
and Brown PO: Microarray analysis reveals a major direct role of
DNA copy number alteration in the transcriptional program of human
breast tumors. Proc Natl Acad Sci USA. 99:pp. 12963–12968. 2002;
View Article : Google Scholar : PubMed/NCBI
|
|
58
|
Minn AJ, Gupta GP, Siegel PM, Bos PD, Shu
W, Giri DD, Viale A, Olshen AB, Gerald WL and Massagué J: Genes
that mediate breast cancer metastasis to lung. Nature. 436:518–524.
2005. View Article : Google Scholar : PubMed/NCBI
|
|
59
|
Lu X, Lu X, Wang ZC, Iglehart JD, Zhang X
and Richardson AL: Predicting features of breast cancer with gene
expression patterns. Breast Cancer Res Treat. 108:191–201. 2008.
View Article : Google Scholar : PubMed/NCBI
|
|
60
|
Korde LA, Lusa L, McShane L, Lebowitz PF,
Lukes L, Camphausen K, Parker JS, Swain SM, Hunter K and Zujewski
JA: Gene expression pathway analysis to predict response to
neoadjuvant docetaxel and capecitabine for breast cancer. Breast
Cancer Res Treat. 119:685–699. 2010. View Article : Google Scholar : PubMed/NCBI
|
|
61
|
Kao KJ, Chang KM, Hsu HC and Huang AT:
Correlation of microarray-based breast cancer molecular subtypes
and clinical outcomes: implications for treatment optimization. BMC
Cancer. 11:1432011. View Article : Google Scholar : PubMed/NCBI
|
|
62
|
Julka PK, Chacko RT, Nag S, Parshad R,
Nair A, Oh DS, Hu Z, Koppiker CB, Nair S, Dawar R, et al: A phase
II study of sequential neoadjuvant gemcitabine plus doxorubicin
followed by gemcitabine plus cisplatin in patients with operable
breast cancer: prediction of response using molecular profiling. Br
J Cancer. 98:1327–1335. 2008. View Article : Google Scholar : PubMed/NCBI
|
|
63
|
Hatzis C, Pusztai L, Valero V, Booser DJ,
Esserman L, Lluch A, Vidaurre T, Holmes F, Souchon E, Wang H, et
al: A genomic predictor of response and survival following
taxane-anthracycline chemotherapy for invasive breast cancer. JAMA.
305:1873–1881. 2011. View Article : Google Scholar : PubMed/NCBI
|
|
64
|
Glück S, Ross JS, Royce M, McKenna EF Jr,
Perou CM, Avisar E and Wu L: TP53 genomics predict higher clinical
and pathologic tumor response in operable early-stage breast cancer
treated with docetaxel-capecitabine ± trastuzumab. Breast Cancer
Res Treat. 132:781–791. 2012. View Article : Google Scholar : PubMed/NCBI
|
|
65
|
Farmer P, Bonnefoi H, Becette V,
Tubiana-Hulin M, Fumoleau P, Larsimont D, Macgrogan G, Bergh J,
Cameron D, Goldstein D, et al: Identification of molecular apocrine
breast tumours by microarray analysis. Oncogene. 24:4660–4771.
2005. View Article : Google Scholar : PubMed/NCBI
|
|
66
|
Desmedt CI, Piette F, Loi S, Wang Y,
Lallemand F, Haibe-Kains B, Viale G, Delorenzi M, Zhang Y,
d'Assignies MS, et al: TRANSBIG Consortium: Strong time dependence
of the 76-gene prognostic signature for node-negative breast cancer
patients in the TRANSBIG multicenter independent validation series.
Clin Cancer Res. 13:3207–3214. 2007. View Article : Google Scholar : PubMed/NCBI
|
|
67
|
Bos PD, Zhang XH, Nadal C, Shu W, Gomis
RR, Nguyen DX, Minn AJ, van de Vijver MJ, Gerald WL, Foekens JA and
Massagué J: Genes that mediate breast cancer metastasis to the
brain. Nature. 459:1005–1009. 2009. View Article : Google Scholar : PubMed/NCBI
|
|
68
|
Bonnefoi H, Potti A, Delorenzi M, Mauriac
L, Campone M, Tubiana-Hulin M, Petit T, Rouanet P, Jassem J, Blot
E, et al: Validation of gene signatures that predict the response
of breast cancer to neoadjuvant chemotherapy: a substudy of the
EORTC 10994/BIG 00–01 clinical trial. Lancet Oncol. 8:1071–1078.
2007. View Article : Google Scholar : PubMed/NCBI
|
|
69
|
Livak and Schmittgen: Analysis of relative
gene expression data using real-time quantitative PCR and the
2−ΔΔCT method. Methods. 25:402–408. 2001. View Article : Google Scholar : PubMed/NCBI
|
|
70
|
Jozwik KM and Carroll JS: Pioneer factors
in hormone-dependent cancers. Nat Rev Cancer. 12:381–385. 2012.
View Article : Google Scholar : PubMed/NCBI
|
|
71
|
Tozlu S, Girault I, Vacher S, Vendrell J,
Andrieu C, Spyratos F, Cohen P, Lidereau R and Bieche I:
Identification of novel genes that co-cluster with estrogen
receptor alpha in breast tumor biopsy specimens, using a
large-scale real-time reverse transcription-PCR approach. Endocr
Relat Cancer. 13:1109–1120. 2006. View Article : Google Scholar : PubMed/NCBI
|
|
72
|
Cimino-Mathews A, Subhawong AP, Illei PB,
Sharma R, Halushka MK, Vang R, Fetting JH, Park BH and Argani P:
GATA3 expression in breast carcinoma: Utility in triple-negative,
sarcomatoid, and metastatic carcinomas. Hum Pathol. 44:1341–1349.
2013. View Article : Google Scholar : PubMed/NCBI
|
|
73
|
Voduc D, Cheang M and Nielsen T: GATA3
expression in breast cancer has a strong association with estrogen
receptor but lacks independent prognostic value. Cancer Epidemiol
Biomarkers Prev. 17:365–373. 2008. View Article : Google Scholar : PubMed/NCBI
|
|
74
|
Mehra R, Varambally S, Ding L, Shen R,
Sabel MS, Ghosh D, Chinnaiyan AM and Kleer CG: Identification of
GATA3 as a breast cancer prognostic marker by global gene
expression meta-analysis. Cancer Res. 65:11259–11264. 2005.
View Article : Google Scholar : PubMed/NCBI
|
|
75
|
Lin CY, Ström A, Vega VB, Kong SL, Yeo AL,
Thomsen JS, Chan WC, Doray B, Bangarusamy DK, Ramasamy A, et al:
Discovery of estrogen receptor alpha target genes and response
elements in breast tumor cells. Genome Biol. 5:R662004. View Article : Google Scholar : PubMed/NCBI
|
|
76
|
Kim K, Barhoumi R, Burghardt R and Safe S:
Analysis of estrogen receptor alpha-Sp1 interactions in breast
cancer cells by fluorescence resonance energy transfer. Mol
Endocrinol. 19:843–854. 2005. View Article : Google Scholar : PubMed/NCBI
|
|
77
|
Lambertini E, Tavanti E, Torreggiani E,
Penolazzi L, Gambari R and Piva R: ERalpha and AP-1 interact in
vivo with a specific sequence of the F promoter of the human
ERalpha gene in osteoblasts. J Cell Physiol. 216:101–110. 2008.
View Article : Google Scholar : PubMed/NCBI
|
|
78
|
Li L and Davie JR: Association of Sp3 and
estrogen receptor alpha with the transcriptionally active trefoil
factor 1 promoter in MCF-7 breast cancer cells. J Cell Biochem.
105:365–369. 2008. View Article : Google Scholar : PubMed/NCBI
|
|
79
|
Oh DS, Troester MA, Usary J, Hu Z, He X,
Fan C, Wu J, Carey LA and Perou CM: Estrogen-regulated genes
predict survival in hormone receptor-positive breast cancers. J
Clin Oncol. 24:1656–1664. 2006. View Article : Google Scholar : PubMed/NCBI
|
|
80
|
Buache E, Etique N, Alpy F, Stoll I,
Muckensturm M, Reina-San-Martin B, Chenard MP, Tomasetto C and Rio
MC: Deficiency in trefoil factor 1 (TFF1) increases tumorigenicity
of human breast cancer cells and mammary tumor development in
TFF1-knockout mice. Oncogene. 30:3261–3273. 2011. View Article : Google Scholar : PubMed/NCBI
|
|
81
|
Amiry N, Kong X, Muniraj N, Kannan N,
Grandison PM, Lin J, Yang Y, Vouyovitch CM, Borges S, Perry JK, et
al: Trefoil factor-1 (TFF1) enhances oncogenicity of mammary
carcinoma cells. Endocrinology. 150:4473–4483. 2009. View Article : Google Scholar : PubMed/NCBI
|