Introduction
A nutraceutical is a food or a part of a food that
provides medicinal and health benefits (1). Several nutraceuticals originate from
natural sources. Understanding the action of these active
nutritional compounds and their mechanisms associated with their
health benefits is of interest. Apigenin, 4′,5,7-trihydroxyflavone,
is a promising food-based flavonoid compound present abundantly in
common fruits and vegetables including oranges, parsley, celery,
spearmint, tea, wheat sprouts, perennial chamomile, onions and a
number of seasonings (2). It has been
demonstrated to display a variety of biological activities,
including anti-inflammatory, anti-oxidant, anticarcinogenic,
chemoprevention and tumor growth inhibition (3,4).
The higher incidence of cholangiocarcinoma (CCA), a
malignant tumor derived from intrahepatic or extrahepatic biliary
tracts, occurs in Southeast Asian countries such as Thailand
(5). Congenital liver malformations,
primary sclerosing cholangitis and infection with the parasitic
liver flukes Opisthorchis viverrini are risk factors for
cholangiocarcinoma (6). The risk of
cholangiocarcinoma increases in patients with chronic liver disease
with either form of viral hepatitis, B or C (7,8), alcoholic
liver disease or cirrhosis from a number of causes (9,10). Our
group has established the proteomic map of a Thai human
cholangiocarcinoma HuCCA-1 cell line and compared it to Thai human
hepatocellular carcinoma HCC-S102 cell line and hepatoblastoma
HepG2 cell line by studying their soluble proteins (11) and membrane proteins (12).
Apoptosis, a process of programmed cell death in
multicellular organisms, is one of the main types of cell death
pathway and involves a series of biochemical events, which lead to
cell morphology and mortality (13).
When the apoptotic process occurs, the cell body and fragments are
safely disposed. This serves a critical role in the multiple steps
of tumorigenesis. The specific proteolytic activities of caspases,
cysteinyl-aspartate proteases, are recognized to be responsible for
many of these morphologic alterations (14,15).
Several proteins are known to potentially inhibit (16) or promote (17) the onset of apoptosis by a number of
means of activation. Several studies have focused on
apoptosis-associated proteins in apoptotic cells (18,19).
The use of apigenin as an anticancer agent in
vitro for the treatment of various cancer cells including
prostate, breast, cervical, lung, tongue oral, leukemia and
colorectal cancer has increased (20–22). The
evidence of apigenin-induced apoptosis has been demonstrated in a
number of cancer cell lines but there is no study on the anticancer
action of apigenin on cholangiocarcinoma cell lines.
In the present study, MTT assays were performed to
study the cytotoxicity of apigenin on a cholangiocarcinoma cell
line, and flow cytometric analysis was employed to determine the
induction of apoptosis. The proteomic analysis was also used to
study the differential protein expression between apigenin-treated
and untreated cells.
Materials and methods
Cell culture
The HuCCA-1 cell line, derived from a bile duct
tumor mass, was provided by Professor Stitaya Sirisinha, Faculty of
Science, Mahidol University (Bangkok, Thailand) and grown as a
monolayer culture in Ham's F12 culture medium (Gibco Life
Technologies; Thermo Fisher Scientific, Inc., Waltham, MA, USA),
containing 15 mM 4-(2-hydroxyethyl)-1-piperazineethanesulfonic acid
and supplemented with 10% fetal bovine serum (FBS, Hyclone
Laboratories; GE Healthcare Life Sciences, Logan, UT, USA), 100
U/ml penicillin, 100 mg/ml streptomycin and 125 ng/ml amphotericin
B. The cells were maintained at 37°C in a humidified atmosphere
with 5% CO2.
Cytotoxicity assay
Cells at 80% confluence were harvested by
trypsinization from culture flasks and seeded in 96-well plates at
104 cells per 100 µl per well. After 24 h incubation,
the cells were treated with apigenin (Sigma-Aldrich; Merck KGaA,
Darmstadt, Germany) at various concentrations (1–250 µM) for 24, 48
and 72 h. Each well was then replaced with fresh medium containing
0.5 mg/ml MTT (Sigma-Aldrich; Merck KGaA) and incubated for 2 h.
Finally, the medium was removed and 100 µl dimethyl sulfoxide was
added to each well. The absorbance was measured at 550 nm with a
microplate reader, subtracted with the absorbance at 650 nm. Data
were expressed as % cell growth compared with the untreated cells
as the control.
Detection of apoptosis
Apoptosis was detected by two different methods,
flow cytometric analysis of phosphatidylserine externalization and
a DNA fragmentation assay. For the flow cytometric analysis, the
HuCCA-1 cells were seeded in 6-well plate at 4×10⁵ cells
per 2 ml per well. After 24 h incubation, the cells were treated
with apigenin at concentrations of 20% inhibition of cell growth
(IC20), 25 µM, IC50, 75 µM and
IC90, 200 µM, respectively. After 48 h of compound
treatment, floating cells in culture media were separated whilst
adherent cells were harvested by trypsinization, then the two cell
populations were pooled together and centrifuged at 778 × g for 10
min at 4°C. The supernatant was removed and the cell pellets were
resuspended and adjusted to 1×10⁶ cells/ml in culture
media containing 1% FBS. Equal volumes of the cell suspension and
reagent of Muse™ Annexin-V & Dead Cell kit (Merck KGaA) were
mixed together in a tube and incubated at room temperature for 20
min, and analysis was performed using Muse™ Cell Analyzer (Merck
KGaA) (23). For the DNA
fragmentation assay, after 48 h of compound treatment, floating
cells in culture media were harvested by centrifugation at 778 × g
for 10 min at 4°C, whilst adherent cells were harvested by scraping
in cold 1X PBS followed by the centrifugation at 778 × g for 10 min
to collect the cells. Subsequent to this step, the cell pellets
were subjected to DNA extraction using the QIAamp DNA kit (Qiagen
GmbH, Hilden, Germany), the isolated DNA fragments were resolved in
2% agarose gel using electrophoresis and then visualized by
staining with ethidium bromide.
Sample preparation and protein
extraction
Tissue culture flasks measuring 75 cm2
were used for seeding HuCCA-1 cells and the cells were cultured at
37°C, 5% CO2 for 24 h. Apigenin was then added to the
cells at final concentration of 200 µM, 90% inhibition,
IC90, for 48 h. Since apigenin treatment causes cell
detachment, the floating cells were collected from the medium by
centrifugation at 778 × g for 10 min at 4°C and washed with 0.25 M
sucrose-containing protease inhibitor cocktail (Sigma-Aldrich;
Merck KGaA). The adherent cells were harvested by trypsinization
and washed twice with 0.25 M sucrose, scraped in the same sucrose
solution and centrifuged at 778 × g for 10 min at 4°C. The two
samples were resuspended in 100 µl lysis buffer containing 7 M
urea, 2 M thiourea, 4% CHAPS, 2% dithiothreitol (DTT), 2% ampholine
pH 3–10 and a protease inhibitor cocktail, sonicated on ice and
centrifuged at 13,800 × g for 10 min at 4°C. The supernatants were
saved and the concentration of proteins was determined using the
Bio-Rad Protein Assay (Bio-Rad Laboratories, Inc., Hercules, CA,
USA).
Two-dimensional gel
electrophoresis
The samples were prepared by leaving them overnight
in gel rehydration of nonlinear pH 3–10, 70-mm Immobiline DryStrip
gels (IPG; GE Healthcare, Chalfont, UK). An Ettan IPGphor system
(GE Healthcare) was used for running the first dimension
isoelectric focusing at 6,500 Vh. The IPG strips were equilibrated
in two steps of equilibration buffer as previously described
(10). For running the
second-dimension electrophoresis, 12.5% SDS-PAGE was prepared, the
IPG strips were placed in the Hoefer minigels and electrophoresis
was performed at 20 mA for 2 h. Coomassie Brilliant Blue R-250
(0.1%) in 40% methanol and 10% acetic acid was used as the staining
solution.
Gel scanning and image analysis
The gels were scanned using ImageScanner II (GE
Healthcare) and analyzed using ImageMaster 2D platinum software
(version 7.0; GE Healthcare) for differential analysis.
In-gel digestion
The triplicate washing step was performed by adding
50 µl 0.1 M NH4HCO3 in 50% acetonitrile (ACN)
in excised gel spots and incubating for 20 min at 30°C. The gel
pieces were dried completely in SpeedVac (Labconco, Kansas City,
MO, USA). The gel pieces were reduced and alkylated in 1X buffer
solution, 0.1 M NH4HCO3, 10 mM DTT and 1 mM
EDTA, and incubated at 60°C for 45 min. The buffer solution was
replaced with freshly prepared 100 mM iodoacetamide in 0.1 M
NH4HCO3 solution. The reaction mixture was
incubated in the dark at room temperature for 30 min. The gel
pieces were washed three times using 50% ACN in water and were
dried completely. The trypsin (Promega Corporation, Madison, WI,
USA) was aliquoted (1 µg trypsin/10 µl 1% acetic acid) and stored
at −20°C. The digestion buffer, 0.05 M Tris-HCl, 10% ACN, 1 mM
CaCl2, pH 8.5, was prepared. The tryptic digestion was
performed by adding 50 µl digestion buffer and 1 µl prepared
trypsin into the gel pieces. The reaction mixture was incubated at
37°C overnight. The digestion buffer was removed and saved. The gel
pieces were then added to 60 µl 2% freshly prepared trifluoroacetic
acid and incubated at 60°C for 30 min for peptide extraction. The
saved digestion buffer and the final extract were then pooled and
dried by SpeedVac.
Protein identification by liquid
chromatography (LC) tandem mass spectrometry (MS/MS)
The Q-TOF mass spectrometer (Micromass UK, Ltd.,
Manchester, UK) equipped with a Z-spray ion source operating in the
nanoelectrospray mode was used. The analysis by LC was carried out
using a capillary LC system (Waters Corporation, Milford, MA, USA).
The instrument in MS/MS mode was calibrated by Glu-fibrinopeptide.
The 75 mm id ×150 mm C18 PepMap column (LC Packings, Amsterdam, The
Netherlands) was attached to the LC system. Eluents A and B were
prepared as follows: Eluent A, 0.1% formic acid in 97% water and 3%
ACN and eluent B, 0.1% formic acid in 97% ACN and 3% water. The
gradient for peptide separation was 0 min 7% B, 35 min 50% B, 45
min 80% B, 49 min 80% B, 50 min 7% B and 60 min 7% B. ProteinLynx
Global SERVER™ (version 2.2; Waters Corporation) screening
Swiss-Prot and NCBI (https://www.ncbi.nlm.nih.gov/) was employed for
database search. The MASCOT (http://www.matrixscience.com) search tool available on
the Matrix Science site screening and NCBInr was also used to
confirm certain proteins.
Western blot analysis
The untreated and apigenin treated HuCCA-1 cells
were scraped separately and sonicated in an in-house 1X
radioimmunoprecipitation assay (RIPA) buffer (150 mM NaCl, 1%
Triton X-100, 0.5% sodium deoxycholate, 0.1% SDS, 50 mM Tris pH 8.0
and 1 mM EDTA) to extract the proteins. Protein lysates (20 µg)
were subsequently loaded in each lane. Proteins separation was
performed by 12.5% SDS-PAGE and transferred onto
FluoroTrans® polyvinylidene difluoride membranes (Pall
Corporation, Port Washington, NY, USA). Subsequent to blocking with
5% nonfat dried milk in TBS-Tween 20 (TBST), 10 mM Tris, pH 7.6,
150 mM NaCl, 0.1% Tween 20, at room temperature for 1 h, the
membranes were washed with TBST and incubated with the following
primary antibodies: Mouse monoclonal cytokeratin 7 (CK7; cat. no.
MAB3554; dilution, 1:2,000; Merck KGaA); mouse monoclonal
cytokeratin 8 (CK8; cat. no. MAB3414; dilution, 1:2,000; Merck
KGaA); mouse monoclonal cytokeratin 18 (CK18; cat. no. MAB3236;
dilution, 1:2,000; Merck KGaA); mouse monoclonal cytokeratin 19
(CK19; cat. no. MAB3238; dilution, 1:2,000; Merck KGaA); mouse
monoclonal S100-A6 (cat. no. ab55680; dilution, 1:250; Abcam,
Cambridge, UK); rabbit polyclonal S100-A11 (cat. no. 10237–1-AP;
dilution, 1:250; Proteintech, Chicago, IL, USA); rabbit monoclonal
S100-P (cat. no. ab133554; dilution, 1:1,000; Abcam); mouse
monoclonal heterogeneous nuclear ribonucleoprotein A2/B1 (hnRNP
A2/B1; cat. no. ab6102; dilution, 1:2,000; Abcam); rabbit
polyclonal heterogeneous nuclear ribonucleoprotein H (hnRNP H; cat.
no. ab10374; dilution, 1:5,000; Abcam); mouse monoclonal annexin A1
(cat. no. MAB3773; dilution, 1:2,000; Merck KGaA); mouse monoclonal
annexin A2 (cat. no. ab54771; dilution, 1:20,000; Abcam); rabbit
polyclonal annexin A3 (cat. no. ab33068; dilution, 1:2,000; Abcam);
mouse monoclonal peroxiredoxin-1 (cat. no. ab58252; dilution,
1:2,000; Abcam); mouse monoclonal prostaglandin E synthase 3
(PTGES3; cat. no. WH0010728M1; dilution, 1:500; Sigma-Aldrich;
Merck KGaA); or rabbit monoclonal GAPDH (cat. no. ab75834;
dilution, 1:10,000; Abcam) at 4°C overnight. The membranes were
then washed with TBST and incubated with horseradish
peroxidase-conjugated anti-mouse or anti-rabbit antibodies (Dako;
Agilent technologies, Inc., Santa Clara, CA, USA) at room
temperature for 1 h. Following washing with TBST, membranes were
visualized by using an enhanced chemiluminescence Western blotting
detection kit (Advansta, Menlo Park, CA, USA) and an ImageQuant LAS
4000 mini (GE Healthcare). A total of three experiments were
performed for each antibody.
Statistical analysis
The mean values and standard deviations of
differential expression between treated and untreated cells were
calculated. The significance of differences was analyzed by
two-tailed unpaired Student's t tests, and P<0.05 was considered
to indicate a statistically significant difference.
Results
Apigenin inhibited the growth of
HuCCA-1 cells
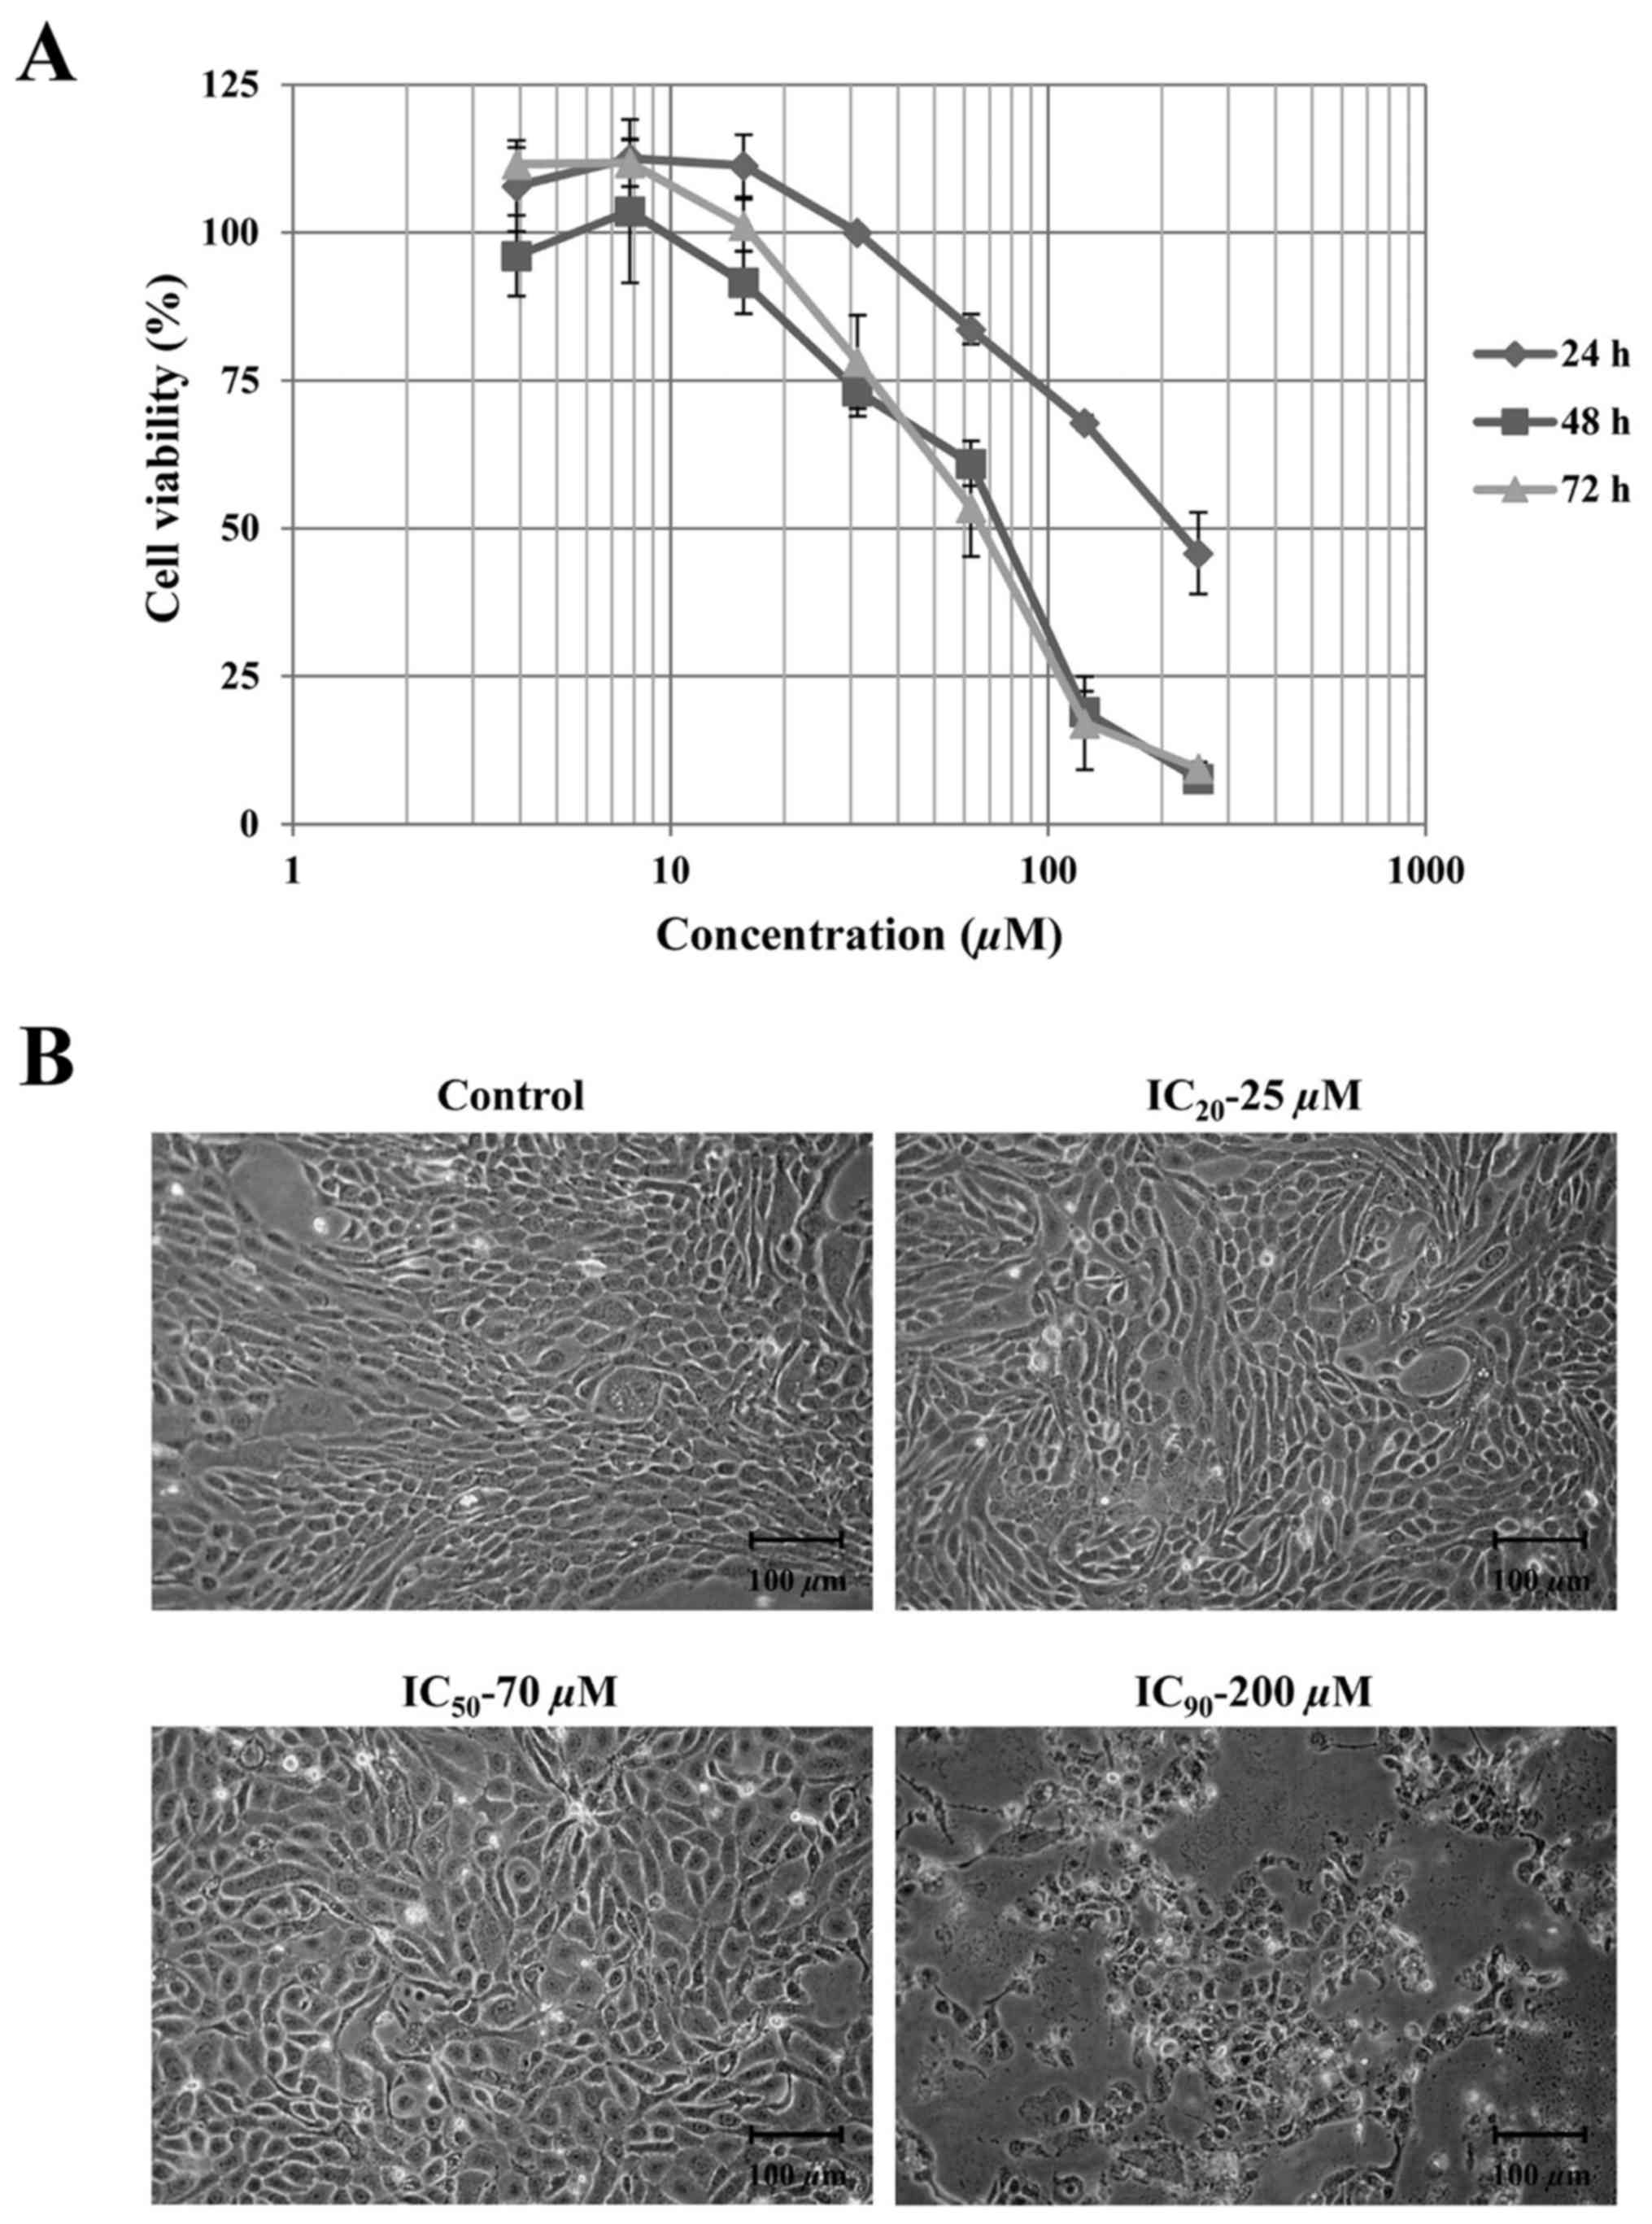
The MTT assay was performed to investigate the
growth inhibition and assess the cytotoxic effect of apigenin.
HuCCA-1 cells were treated with various concentrations of apigenin
ranging from 1–250 µM at different times. The results in Fig. 1A illustrate the dose- and
time-dependent inhibition of cell growth by apigenin. Since cell
morphology changes were being observed at 48 h subsequent to
treatment as demonstrated in Fig. 1B,
the results at this time point were chosen to estimate the value of
concentrations that will cause IC20, IC50 and
IC90. The values of IC20, IC50 and
IC90 of apigenin after 48 h treatment were 25, 75 and
200 µM, respectively. After 48 h incubation, the morphology changes
were clearly observed in treated cells at concentrations up to 200
µM compared with the control. The treated cells appeared to lack
regular shape with boundaries resembling loosely adhered cells.
Apigenin induced apoptosis in HuCCA-1
cells
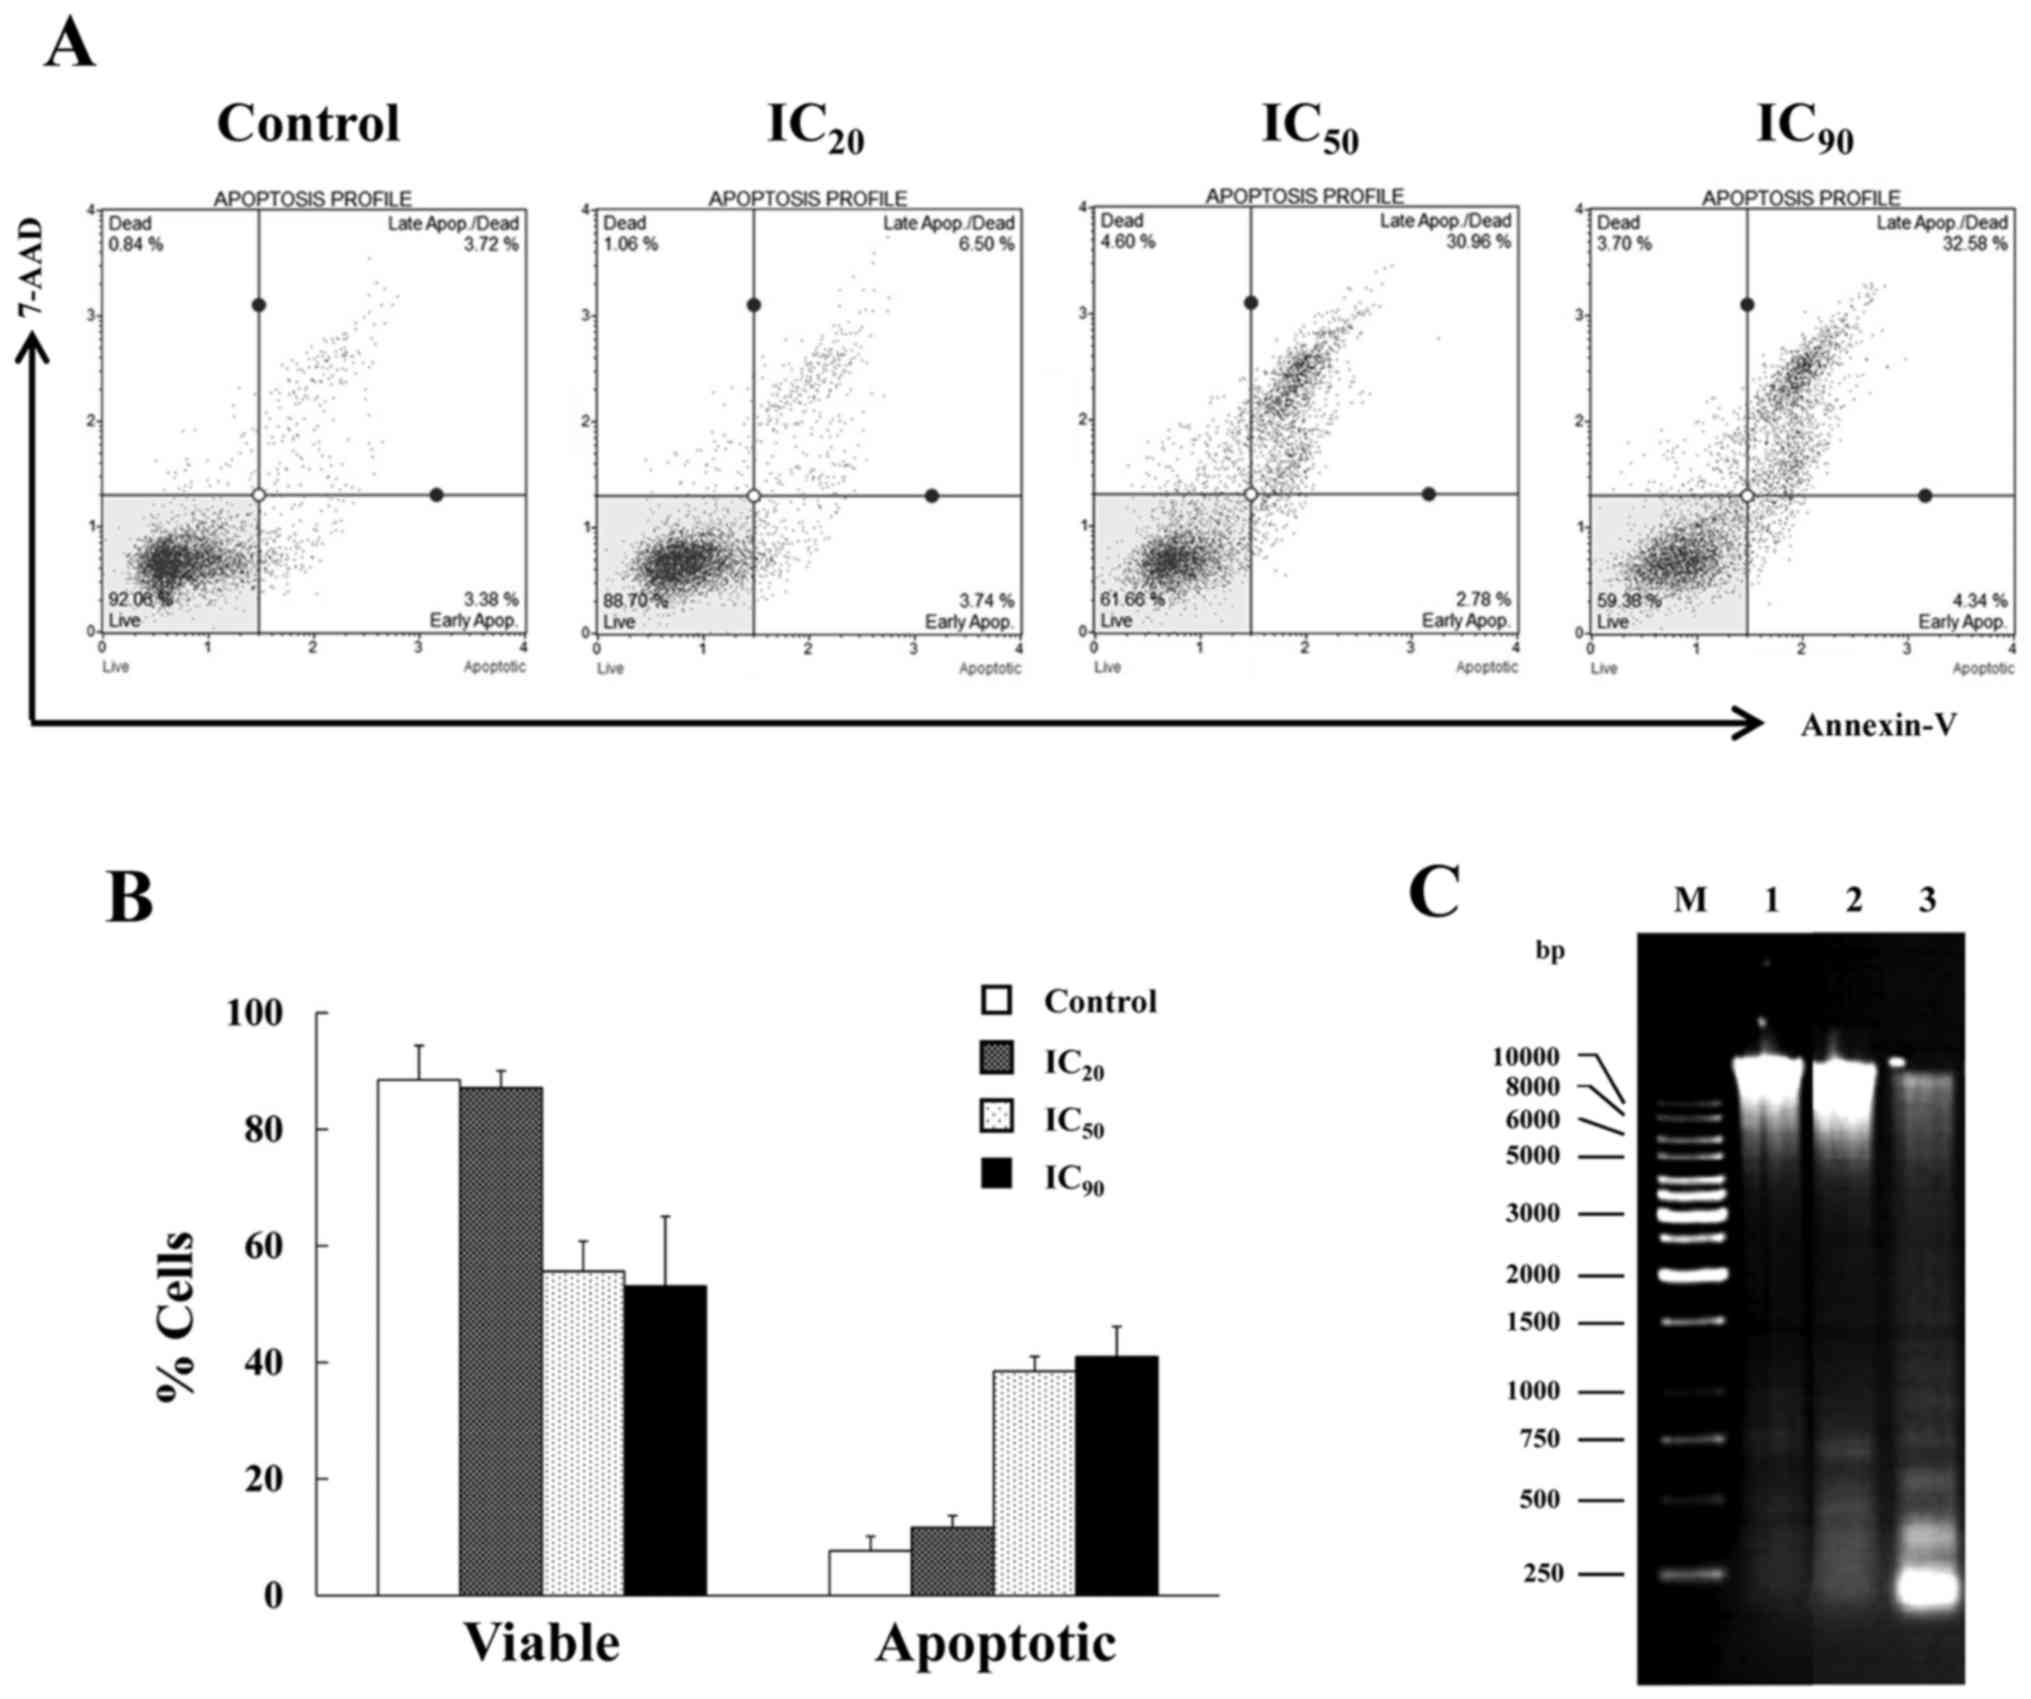
To examine whether apigenin induced apoptotic cell
death in HuCCA-1 cells, two different methods were used to detect
apoptosis, flow cytometric analysis of phosphatidylserine (PS)
externalization and DNA fragmentation assays. When cells undergo
apoptosis, an early event is PS externalization on the cell
surface, which are detected by Annexin-V staining. Subsequent to
the progression to late stage of apoptosis, the membrane integrity
of the cells is lost, allowing penetration of membrane-impermeant
dyes such as 7-aminoactinomycin D (7-AAD) and propidium iodide.
Mode of cell death in apigenin-treated HuCCA-1 cells was analyzed.
The cells were treated with increasing concentration from
IC20, 25 µM, IC50, 75 µM and IC90,
200 µM of apigenin compared with the untreated control for 48 h.
Subsequent to the treatment, the cells that were positive for
Annexin-V and 7-AAD staining with stages of early and late
apoptosis were detected (Fig. 2A).
The percentage of total apoptotic cell populations, early and late
apoptosis, increased corresponding to the higher concentration of
apigenin. The highest proportion of apoptotic cells was ~41%, when
cells were treated with apigenin at a concentration of
IC90 (Fig. 2B).
Additionally, another key feature of apoptosis, DNA
fragmentation with a ladder pattern, was also investigated. The
HuCCA-1 cells were treated with IC90, 200 µM, apigenin
for 48 h, and subsequently analyzed for DNA fragmentation. As
demonstrated in Fig. 2C, the ladder
pattern of DNA fragmentation was observed in floating cells whilst
the attached cells exhibited no visible DNA laddering. Taken
together, the results of flow cytometric analysis and DNA
fragmentation assay consistently indicated that apigenin induced
apoptosis in HuCCA-1 cells.
Differential expression of proteins in
HuCCA-1 when treated with apigenin
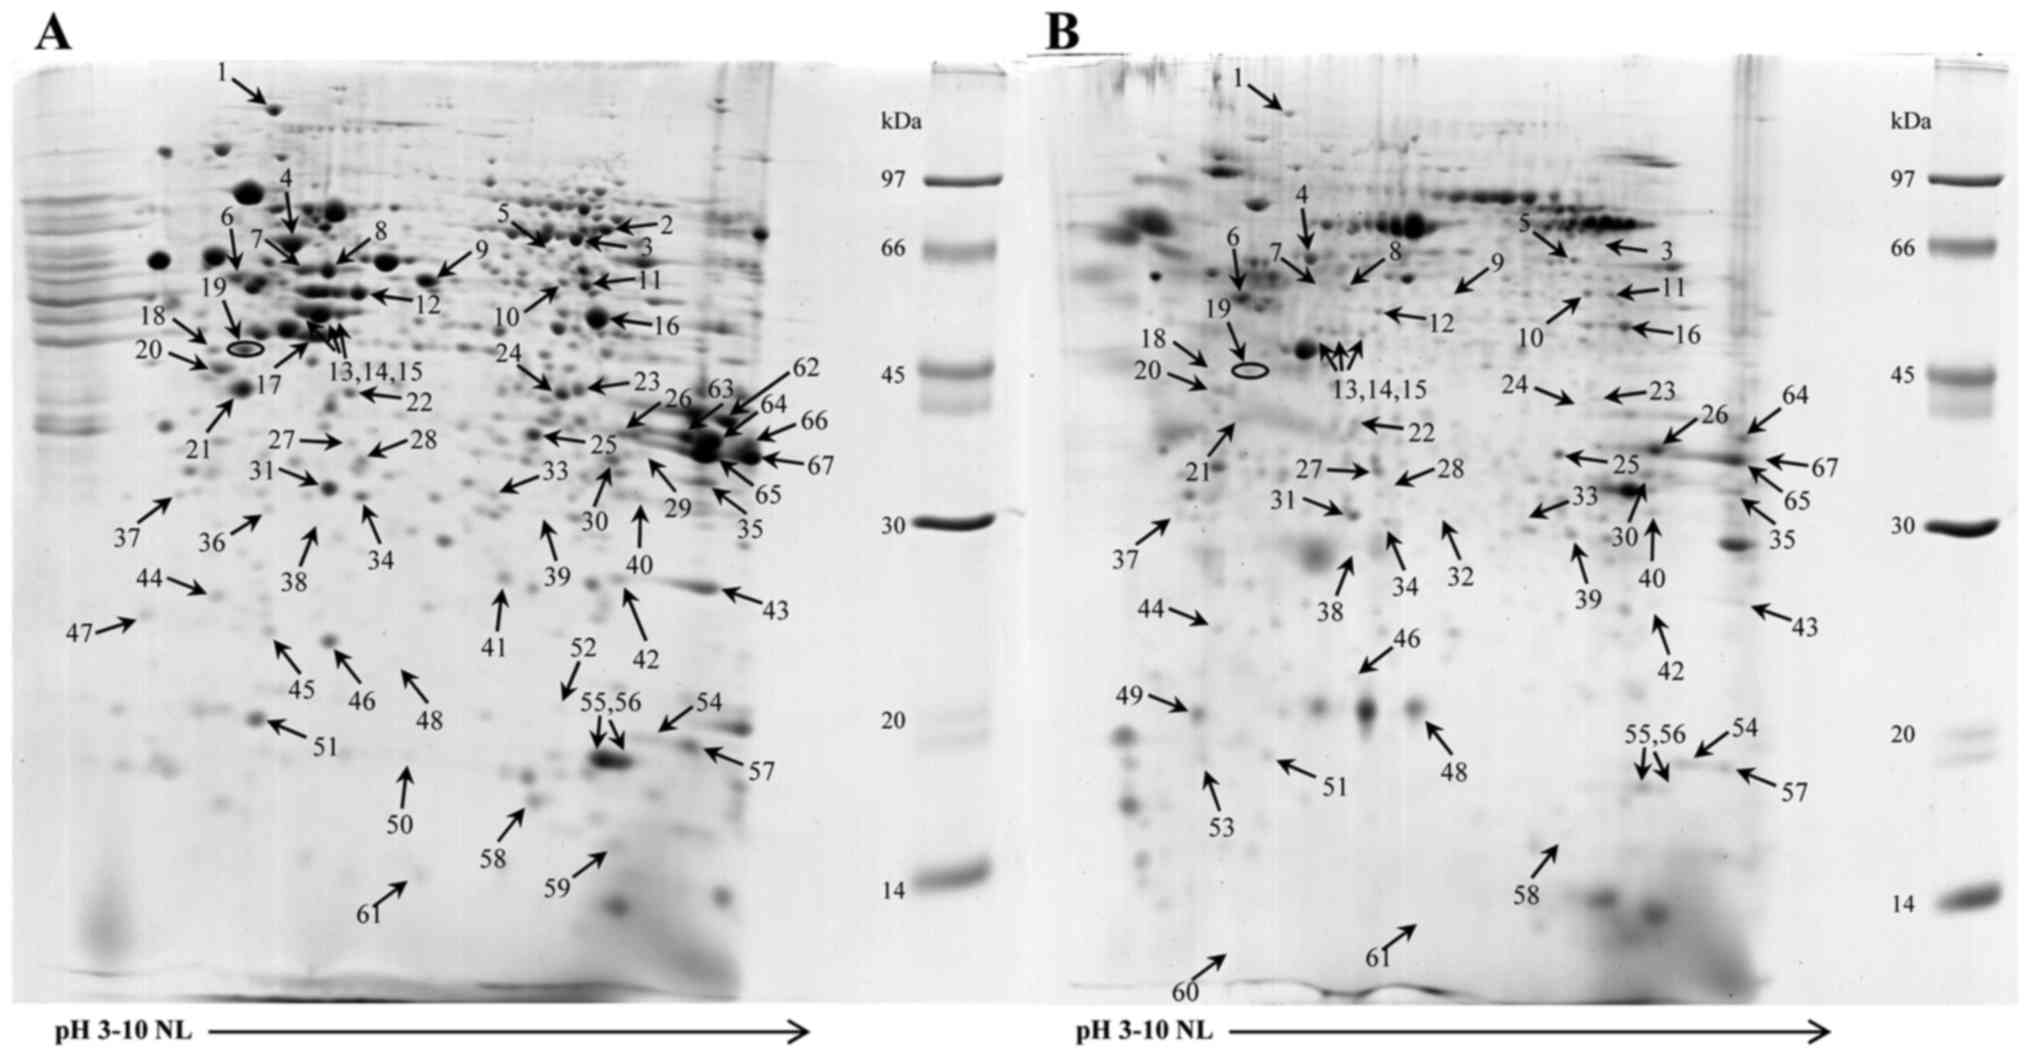
From the DNA fragmentation of apigenin-treated
HuCCA-1 cells, apoptosis was clearly demonstrated in the floating
cells. Thus, the levels of protein expression in the untreated and
apigenin-treated cells floating and adherent cells were compared
using proteomic techniques. Only the floating cells demonstrated
differential protein expression when compared with the untreated
cells by 2-DE. Fig. 3A and B
illustrates the 2-DE patterns of the untreated and floating cells
treated with 200 µM apigenin, 90% inhibition, IC90, for
48 h. A total of sixty-seven proteins were revealed to exhibit
differential expression and were identified by comparison to the
proteins previously examined in the reference map of HuCCA-1
(11) and using LC/MS/MS as
summarized in Table I. These proteins
were categorized by their functions as follow: Metabolism,
cytoskeletal/mobility, protein synthesis and degradation, signal
transduction, chaperone/stress response, protection and
detoxification, transport/binding proteins, cell cycle, ion
channels and DNA replication/gene regulation. The fold changes of
proteins were calculated by ImageMaster program and included in
Table I.
 | Table I.Differentially expressed proteins of
HuCCA-1 following apigenin treatment. |
Table I.
Differentially expressed proteins of
HuCCA-1 following apigenin treatment.
| Spot no. | Accession no. | Protein names | Theoretical
pI/MW | Function | Fold
Changea |
|---|
| 1 | Q9Y4L1 | Hypoxia
up-regulated protein 1 | 5.21/111.3 | Chaperone/stress
response | −2.04±0.17b |
| 2 | Q16822 | Phosphoenolpyruvate
carboxykinase [GTP], mitochondrial | 7.40/70.6 | Metabolism | ND |
| 3 | P31939 | Bifunctional purine
biosynthesis protein PURH | 6.26/64.6 | Metabolism |
−16.21±0.35d |
| 4 | P10809 | 60 kDa heat shock
protein, mitochondrial | 5.55/61.0 | Chaperone/stress
response | −2.12±0.48b |
| 5 | P31948 |
Stress-induced-phosphoprotein 1 | 6.76/62.6 | Chaperone/stress
response |
+1.58±0.03c |
| 6 | P07437 | Tubulin beta
chain | 4.59/49.6 |
Cytoskeleton/mobility | +2.19±0.39c |
| 7 | P08729 | Keratin, type II
cytoskeletal 7 | 5.46/51.2 |
Cytoskeleton/mobility |
−2.51±0.13c |
| 8 | P08729 | Keratin, type II
cytoskeletal 7 | 5.46/51.2 |
Cytoskeleton/mobility | −5.33±0.41c |
| 9 | P31943 | Heterogeneous
nuclear ribonucleoprotein H | 6.21/49.2 | Protein synthesis
and degradation |
−26.66±0.51c |
| 10 | Q16658 | Fascin | 7.28/54.4 |
Cytoskeleton/mobility | −1.22±0.02c |
| 11 | P43490 | Nicotinamide
phosphoribosyltransferase | 7.12/55.5 | Metabolism |
−2.77±0.14b |
| 12 | P05787 | Keratin, type II
cytoskeletal 8 | 5.52/53.5 |
Cytoskeleton/mobility | −6.94±0.42d |
| 13 | P05787 | Keratin, type II
cytoskeletal 8 | 5.52/53.5 |
Cytoskeleton/mobility |
−2.82±0.18b |
| 13 | P05783 | Keratin, type I
cytoskeletal 18 | 5.42/47.9 |
Cytoskeleton/mobility | −2.82±0.18b |
| 14 | P05787 | Keratin, type II
cytoskeletal 8 | 5.52/53.5 |
Cytoskeleton/mobility |
−21.08±0.90c |
| 14 | P05783 | Keratin, type I
cytoskeletal 18 | 5.42/47.9 |
Cytoskeleton/mobility | −21.08±0.90c |
| 15 | P05787 | Keratin, type II
cytoskeletal 8 | 5.58/53.5 |
Cytoskeleton/mobility |
−3.48±0.17c |
| 15 | P05783 | Keratin, type I
cytoskeletal 18 | 5.42/47.9 |
Cytoskeleton/mobility | −3.48±0.17c |
| 16 | P06733 | Alpha-enolase | 7.54/47.0 | Metabolism |
−4.79±0.68c |
| 17 | P08727 | Keratin, type I
cytoskeletal 19 | 5.09/44.1 |
Cytoskeleton/mobility | ND |
| 18 | P08865 | 40S ribosomal
protein SA | 4.59/32.8 | Protein synthesis
and degradation | −1.81±0.04b |
| 19 | P07910 | Heterogeneous
nuclear ribonucleoproteins C1/C2 | 4.99/33.6 | Protein synthesis
and degradation |
−2.01±0.12c |
| 20 | P06748 | Nucleophosmin | 4.71/30.9 | Protein synthesis
and degradation | −1.63±0.16b |
| 21 | P07910 | Heterogeneous
nuclear ribonucleoproteins C1/C2 | 4.99/33.6 | Protein synthesis
and degradation |
−4.64±0.49b |
| 22 | P05388 | 60S acidic
ribosomal protein P0 | 5.60/34.3 | Protein synthesis
and degradation | −1.42±0.03b |
| 23 | Q15365 | Poly(rC)-binding
protein 1 | 7.11/37.5 | Protein synthesis
and degradation |
−5.59±0.14b |
| 24 | O00154 | Cytosolic acyl
coenzyme A thioester hydrolase | 7.27/37.4 | Metabolism | −19.00±0.27d |
| 25 | P04083 | Annexin A1 | 7.00/38.6 | Signal
transduction |
−2.05±0.14c |
| 26 | P07355 | Annexin A2 | 8.04/38.4 | Signal
transduction | +3.89±0.48b |
| 27 | P12429 | Annexin A3 | 5.82/36.4 | Signal
transduction |
+4.63±0.12b |
| 28 | Q06323 | Proteasome
activator complex subunit 1 | 5.98/28.7 | Cell cycle | −5.84±0.10b |
| 29 | P04406 |
Glyceraldehyde-3-phosphate
dehydrogenase | 8.79/35.9 | Metabolism | ND |
| 30 | P04406 |
Glyceraldehyde-3-phosphate
dehydrogenase | 8.79/35.9 | Metabolism |
−1.12±0.02b |
| 31 | P35232 | Prohibitin | 5.57/29.8 | DNA
replication/gene regulation | −1.22±0.06b |
| 32 | P02545 | Lamin A/C | 6.13/53.2 |
Cytoskeleton/mobility | D |
| 33 |
P48556 | 26S
proteasome non-ATPase regulatory subunit 8 | 7.16/30.0 | Protein
synthesis and degradation | −3.17±0.05b |
| 34 | Q06830 |
Peroxiredoxin-1 | 8.52/22.1 | Protection and
detoxification |
−2.41±0.09b |
| 35 | P21796 | Voltage-dependent
anion-selective channel protein 1 | 8.85/30.6 | Ion channels | −1.35±0.09b |
| 36 | P43487 | Ran-specific
GTPase-activating protein | 5.27/23.3 | Transport/binding
proteins | ND |
| 37 | P28066 | Proteasome subunit
alpha type-5 | 4.54/26.4 | Protein synthesis
and degradation |
+1.82±0.03b |
| 38 | Q9BV44 | THUMP
domain-containing protein 3 | 5.97/57.0 | Protein synthesis
and degradation | −2.45±0.03b |
| 39 | P05783 | Keratin, type I
cytoskeletal 18 | 5.42/47.9 |
Cytoskeleton/mobility |
+9.17±0.15b |
| 40 | P25789 | Proteasome subunit
alpha type-4 | 8.04/29.5 | Protein synthesis
and degradation | −2.13±0.07c |
| 41 | P62333 | 26S protease
regulatory subunit 10B | 7.09/44.2 | Protein synthesis
and degradation | ND |
| 42 | Q15056 | Eukaryotic
translation initiation factor 4H | 7.33/27.4 | Protein synthesis
and degradation |
−3.62±0.10b |
| 43 | Q06830 |
Peroxiredoxin-1 | 8.52/22.1 | Protection and
detoxification | −6.52±0.41c |
| 44 | P13693 |
Translationally-controlled tumor
protein | 4.84/19.6 | Transport/binding
proteins |
−2.11±0.07b |
| 45 | O75947 | ATP synthase
subunit d, mitochondrial | 5.26/18.3 | Metabolism | −1.31±0.02b |
| 46 | P32119 |
Peroxiredoxin-2 | 5.86/21.9 | Protection and
detoxification |
−3.20±0.11b |
| 47 | Q15185 | Prostaglandin E
synthase 3 | 4.30/18.7 | Chaperone/stress
response | ND |
| 48 | O00746 | Nucleoside
diphosphate kinase, mitochondrial | 9.21/17.3 | Metabolism | +12.27±0.35b |
| 49 | P05783 | Keratin, type I
cytoskeletal 18 | 5.42/47.9 |
Cytoskeleton/mobility | D |
| 50 | P16949 | Stathmin | 5.96/17.2 |
Cytoskeleton/mobility | ND |
| 51 | Q93020 | GTP-binding
regulatory | 5.30/22.1 | Signal transduction
protein Gi alpha-2 chain |
−3.64±0.18b |
| 52 | P23528 | Cofilin-1 | 8.22/18.5 |
Cytoskeleton/mobility | ND |
| 53 | P08727 | Keratin, type I
cytoskeletal 19 | 5.09/44.1 |
Cytoskeleton/mobility | D |
| 54 | P23528 | Cofilin-1 | 8.22/18.5 |
Cytoskeleton/mobility | +2.46±0.13b |
| 55 | P62937 | Peptidyl-prolyl
cis-trans isomerase A | 8.18/17.9 | Signal
transduction |
−4.24±0.66c |
| 56 | P62937 | Peptidyl-prolyl
cis-trans isomerase A | 8.18/17.9 | Signal
transduction | −10.17±0.46d |
| 57 | P22392 | Nucleoside
diphosphate kinase B | 8.52/17.3 | Metabolism |
−1.83±0.13b |
| 58 | P25398 | 40S ribosomal
protein S12 | 6.30/14.5 | Protein synthesis
and degradation | −2.35±0.10b |
| 59 | Q9UII2 | ATPase inhibitor,
mitochondrial | 9.34/12.2 | Metabolism | ND |
| 60 | P06703 | Protein
S100-A6 | 5.32/10.2 |
Cytoskeleton/mobility | D |
| 61 | P31949 | Protein
S100-A11 | 7.27/11.7 |
Cytoskeleton/mobility |
+4.13±0.12b |
| 62 | P04075 |
Fructose-bisphosphate aldolase A | 8.06/39.4 | Metabolism | ND |
| 63 | Q04828 | Aldo-keto reductase
family 1 member C1 | 8.25/36.8 | Protection and
detoxification | ND |
| 64 | P22626 | Heterogeneous
nuclear ribonucleoproteins A2/B1 | 9.12/37.4 | Protein synthesis
and degradation |
−4.56±0.75b |
| 65 | P04406 |
Glyceraldehyde-3-phosphate
dehydrogenase | 8.79/35.9 | Metabolism | −1.46±0.40b |
| 66 | P22626 | Heterogeneous
nuclear ribonucleoproteins A2/B1 | 9.12/37.4 | Protein synthesis
and degradation | ND |
| 67 | P04406 |
Glyceraldehyde-3-phosphate
dehydrogenase | 8.79/35.9 | Metabolism |
−7.70±0.92c |
The expression levels of twelve proteins were not
measured in HuCCA-1 cell lysate subsequent to apigenin treatment.
These proteins are involved in metabolism, cytoskeletal/mobility,
protein synthesis and degradation, chaperone/stress response,
protection and detoxification and transport/binding. These proteins
are phosphoenolpyruvate carboxykinase (GTP; Table I, spot no. 2), GAPDH (Table I, spot no. 29), ATPase inhibitor
(Table I, spot no. 59) and
fructose-bisphosphate aldolase A (Table
I, spot no. 62), CK19 (Table I,
spot no. 17), stathmin (Table I, spot
no. 50), cofilin-1 (Table I, spot no.
52), 26S protease regulatory subunit 10B (Table I, spot no. 41), hnRNP A2/B1 (Table I, spot no. 66), PTGES3 (Table I, spot no. 47), aldo-keto reductase
family1 member C1 (Table I, spot no.
63) and ran-specific GTPase-activating protein (Table I, spot no. 36). The expression of four
proteins was identified subsequent to treatment of the cells with
apigenin. The proteins are associated with cytoskeleton/mobility,
which are lamin A/C (Table I, spot
no. 32), CK18 (Table I, spot no. 49),
CK19 (Table I, spot no. 53) and
protein S100-A6 (Table I, spot no.
60). A total of five downregulated proteins demonstrated
>15-fold lower expression when comparing the 2-DE patterns of
treated and untreated cells. They are cytosolic acyl coenzymeA
thioester hydrolase (Table I, spot
no. 24), bifunctional purine biosynthesis protein PURH (Table I, spot no. 3), CK8 (Table I, spot no. 14), CK18 (Table I, spot no. 14) and hnRNP H (Table I, spot no. 9). A total of seven
downregulated proteins demonstrated lower expression in the range
of 5- to 15-fold, which are GADPH (Table
I, spot no. 67), cytokeratin 8 (Table
I, spot no. 12), cytokeratin 7 (Table
I, spot no. 8), poly (rC)-binding protein 1 (Table I, spot no. 23), peptidyl-prolyl
cis-trans isomerase A (Table I, spot
no. 56), peroxiredoxin-1 (Table I,
spot no. 43) and proteasome activator complex subunit 1 (Table I, spot no. 28).
For proteins involved in cytoskeleton/mobility
function, significant changes were revealed in expression in CK7,
CK8, CK18, CK19, S100-A6 and S100-A11 (Table I, spot no. 61). The CK8 and CK18
proteins were identified in spots 13, 14 and 15 whose intensities
decreased upon treatment with apigenin. Notably, two novel spots
belonging to CK18 at a molecular weight (MW) 29.9 kDa (Table I, spot no. 39) and MW 21.5 kDa
(Table I, spot no. 49) appeared
subsequent to treatment. For CK19, there was a disappearance of
spot no. 17 (Table I, MW 48 kDa) and
an appearance of a low MW spot (Table
I, spot no. 53) at 19.2 kDa in the floating cells. S100-A6
demonstrated expression only subsequent to treatment and S100-A11
increased by ~four-fold subsequent to apigenin treatment.
Immunodetection of differential
protein expression when treated with apigenin
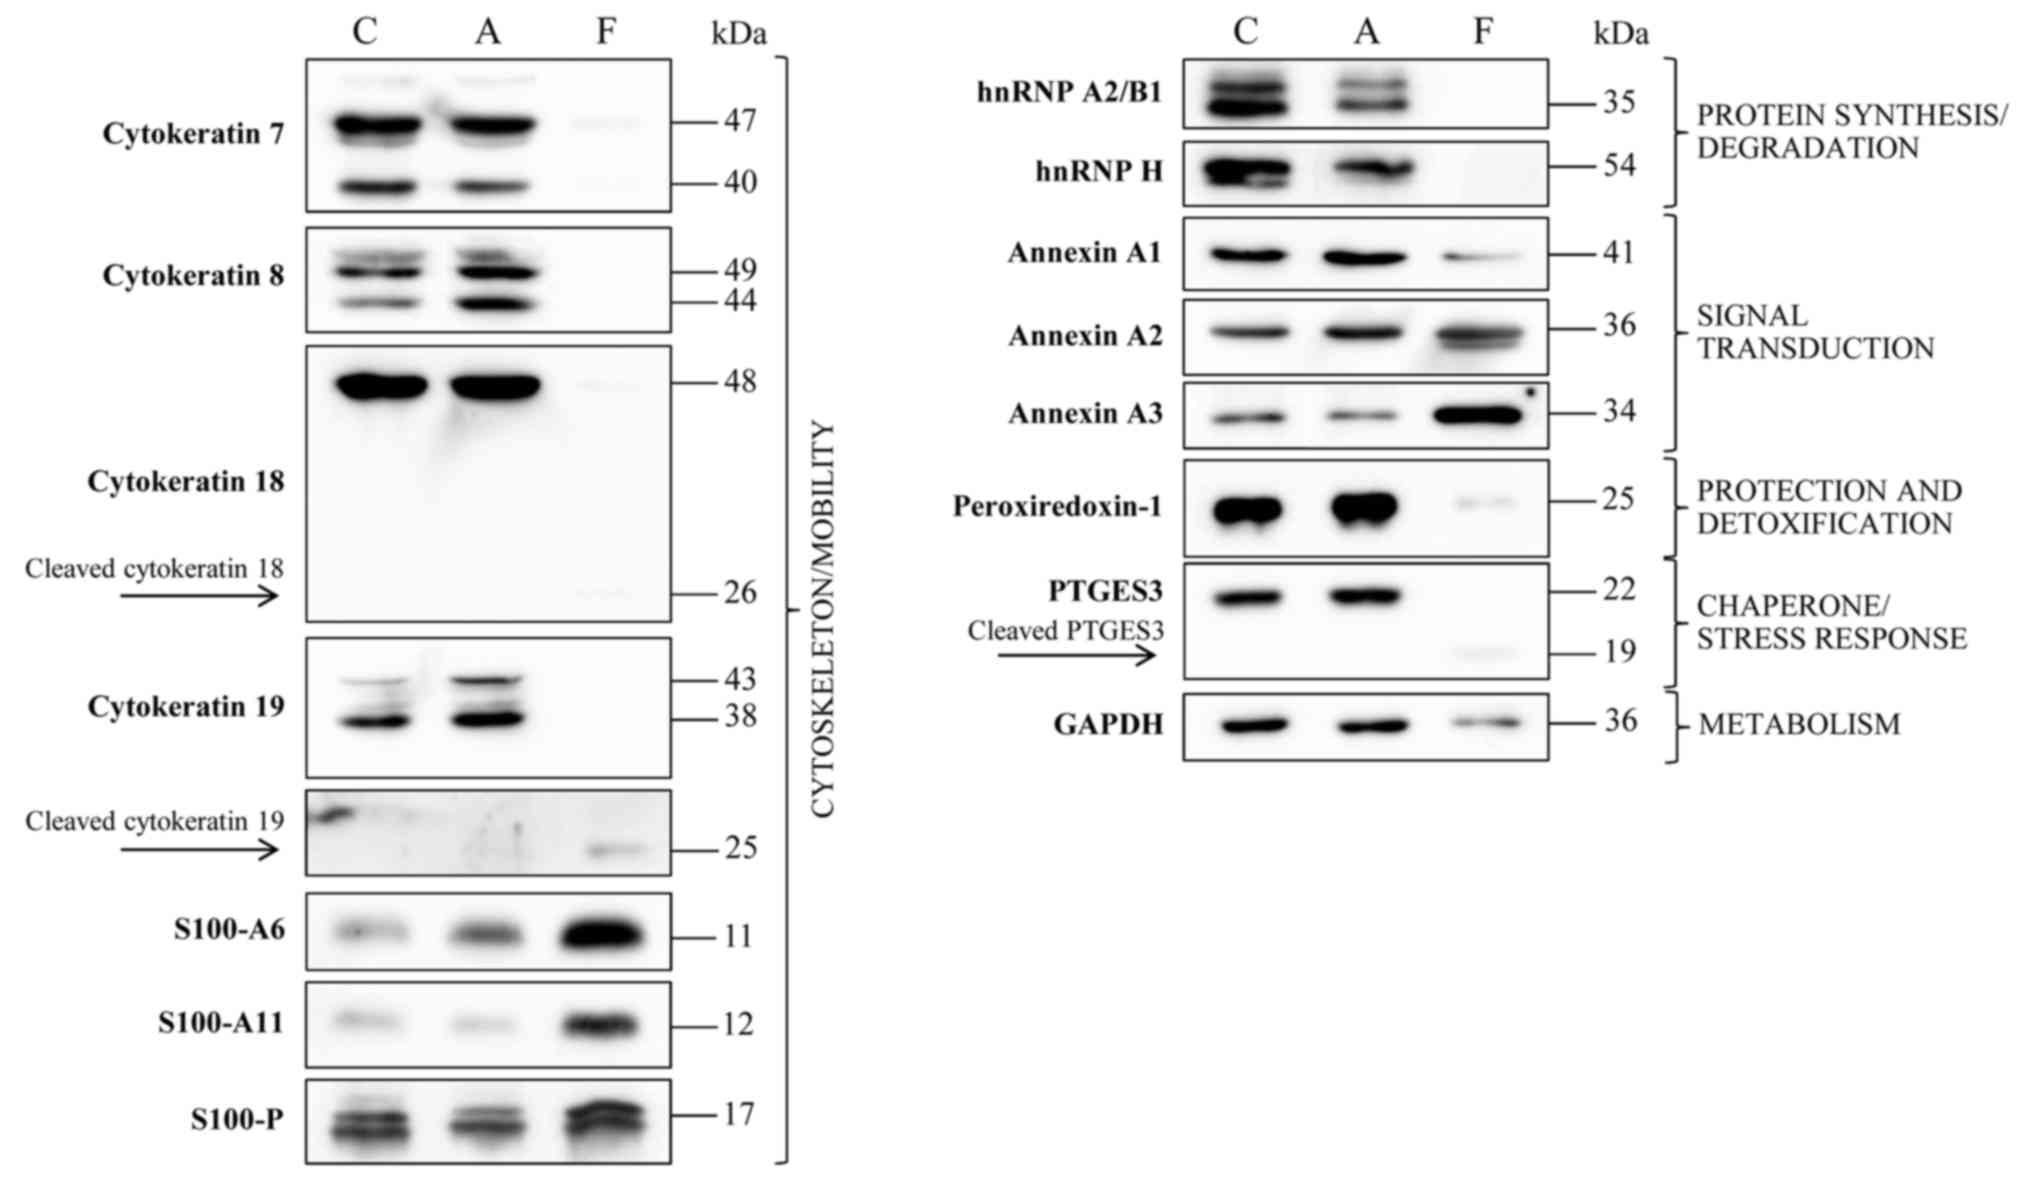
Immunodetection was used to verify the presence of
certain proteins from adherent and floating cells subsequent to
treatment with apigenin compared with untreated cells, as
demonstrated in Fig. 4. The results
confirmed the disappearance of hnRNP A2/B1, hnRNP H and PTGES3 in
floating cells subsequent to treatment. Upon treatment, the
proteins involved in cytoskeleton/mobility function, CK7, CK8, CK18
and CK19, disappeared in the floating cells, whilst they remain
unchanged in the attached cells. In contrast, S100-A6 demonstrated
expression only subsequent to treatment, whereas S100-A11
expression was markedly increased subsequent to treatment,
consistent with 2-DE data. The expression of S100-P was decreased
in attached cells subsequent to treatment.
Discussion
Cholangiocarcinoma is a malignant tumor derived from
bile duct epithelium, with high incidence in northeast Thailand
(6). The proteomic and secretomic
maps of HuCCA-1 cell line, a Thai human cholangiocarcinoma cell
line were described by our laboratory (11). The cell line has been used for
screening the cytotoxic activities of Thai medicinal plants and
proteomic profiling upon treatment with pomiferin, a prenylated
isoflavone from Derris malaccensis (24).
Apigenin is a promising nutraceutical, a food or
part of a food that may elicit health benefits. Numerous reports of
the effect of apigenin treatment on different human cancer cell
lines have demonstrated an inhibition of cell growth via apoptosis
and cell cycle arrest (25,26) The present study investigated the
effect of apigenin on a Thai cholangiocarcinoma HuCCA-1 cell line.
Dose response curves after 24, 48 and 72 h of treatment revealed
inhibitory concentrations at IC50 of apigenin for
HuCCA-1 cells to be 220, 75 and 68 µM at 24, 48 and 72 h,
respectively. Since marked changes of morphology were observed in
treated cells at 200 µM apigenin, 90% inhibition, IC90,
subsequent to a 48-h incubation, this treatment condition was used
for additional study.
Apoptosis, or programmed cell death, leads to DNA
fragmentation, cytoskeletal reorganization, plasma membrane
blebbing, nuclear condensation and loss of cell adhesion. Induction
of apoptosis by apigenin in HuCCA-1 cells was demonstrated by flow
cytometric analysis and confirmed by DNA fragmentation assays. The
cleavage of chromosomal DNA by cellular nucleases into
oligonucleosomal size fragments is a characteristic feature of
apoptosis. Agarose gel electrophoresis demonstrated that the DNA
ladder pattern, indicating DNA fragmentation, was identified only
with floating cells and not with attached cells. This confirms that
the later stages of apoptosis are exhibited in HuCCA-1 cells
treated with apigenin. Typically, apoptosis occurs through the
activation of specific caspases including caspase-3 (27), leading to cleavage of CK18, as
demonstrated in the present study by proteomics and confirmed by
western blot, consistent with previous studies (28–30). In
parallel with CK18 cleavage, active caspase-3 also cleaves an
inhibitor of cellular nuclease, DNA Fragmentation Factor, allowing
the active nuclease move to the nucleus and induces DNA
fragmentation during apoptosis (31).
In the present study, the treatment of HuCCA-1 cells
with apigenin demonstrated various types of protein alterations,
namely changes in protein expression and/or cleavage. The proteins
with roles in cytoskeleton/mobility revealed cleavage, and
therefore this supports the presence of caspase activities during
apoptosis.
The results of the present study revealed that
subsequent to treatment with apigenin, the expression of S100-A6
and S100-A11 was higher in floating cells compared with attached
HuCCA-1 cells during apoptosis. These two proteins are members of
the S100 protein family and have been revealed to serve important
roles in a number of tumorigenic processes, including apoptosis,
cell differentiation, cell growth and cell cycle. The upregulation
of S100-A6 has been demonstrated to enhance apoptosis and decrease
cell viability by affecting caspase-3 activity in hepatocellular
carcinoma cells (32). S100-A11 was
identified to be involved in cell differentiation, cell cycle, cell
growth and cell apoptosis processes. There is also evidence that
S100-A11 induced cell apoptosis by involving certain parts of the
translocation of apoptosis-inducing factor from the cytoplasm to
nuclei (33). The expression of
S100-P was also detected in HuCCA-1 cells. The S100-P has been
demonstrated to serve many roles including tumorigenesis,
proliferation, apoptosis and metastasis in numerous types of cancer
including cholangiocarcinoma (34–36). The
level of S100-P in floating apoptotic cells remains unchanged
subsequent to the apigenin treatment but the expression was
decreased in the attached cells, compared with control. These
results suggest that, in addition to apoptosis induction, apigenin
may also decrease the aggressiveness of non-apoptotic cancer
cells.
Proteins involved in protein synthesis and
degradation demonstrated low or no expression subsequent to
apigenin treatment, including 26S protease regulatory subunit 10B,
hnRNP H and hnRNP A2/B1. In particular, the 26S protease regulatory
subunit 10B is a protein associated with apoptosis, and disappears
in the floating cells. The decreased activity of the 26S proteasome
and induction of cell death was observed only in breast cancer
cells and not in normal cells, treated with Murraya koenigii
leaf extract (37). The western blot
of the present study also demonstrated that expression of hnRNP H
and hnRNP A2/B1 disappeared completely subsequent to apigenin
treatment. HnRNP proteins are multifunctional, participating in
several cellular processes and composed of at least 20 major, high
abundant or core hnRNP proteins including A1, A2/B1, B2, C1 and C2
(38). HnRNP A2/B1 has been
demonstrated to be involved in splicing, mRNA stability and mRNA
transport during the progress of tumorigenesis (39). Apigenin has been identified to bind
specifically to the C-terminal glycine-rich domain of hnRNP A2,
which is suggested to prevent hnRNP A2 from forming homodimers,
resulting in alternative splicing of a number of human hnRNP A2
targets (40). HnRNP H and hnRNP
C1/C2 are also involved in controlling numerous splicing decisions.
The lower expression levels of hnRNP proteins upon treatment with
apigenin may lead to the elimination of the splicing forms which
inhibit cell death and promotion of the normal splice forms in the
cells.
Chaperone/stress response proteins including
prostaglandin E synthase 3, hypoxia upregulated protein 1 and 60
kDa heat shock protein, were revealed to be downregulated
subsequent to treatment with apigenin. However,
stress-induced-phosphoprotein 1 was upregulated. Molecular
chaperones are involved in protein folding, transport and assembly
(41) and function to maintain cell
survival. Elevated expression levels of heat shock proteins may
promote cancer and may lead to resistance to chemotherapy and
hyperthermia (42). It has been
suggested that heat shock proteins and their co-chaperones are
involved in the regulation of apoptosis by caspase activation
(43). Stress-induced-phosphoprotein
1 (STIP1) is an Hsp70/Hsp90-organizing protein, a co-chaperone that
regulates the different functions of Hsps. STIP1 has been
associated with several types of cancer (44–47).
PTGES3 or cytosolic prostaglandin E synthase is a 23 kDa
glutathione-requiring enzyme expressed in a wide variety of cells.
It is identical to co-chaperone p23 that binds to heat shock
protein 90 (Hsp90) (48). PTGES3/p23
inhibited ATPase activity to stabilize the closed conformation of
Hsp90. An increased expression of PTGES3/p23 has been demonstrated
to be involved in tumor progression and a poor prognosis in breast
cancer (49). Additionally, in acute
myelogenous leukemia, PTGES3/p23 was demonstrated to be the target
for caspase in chemotherapy-induced apoptosis. The 17 kDa product
from the cleavage of PTGES3/p23 by caspase is stable in the
apoptotic cells leading to chaperone activity of PTGES3/p23
(50). The results from the present
study indicate that PTGES3/p23 is downregulated subsequent to
treatment with apigenin, so this protein may participate in the
HuCCA-1 cellular apoptosis induced by apigenin.
In conclusion, apigenin, a nutraceutical present in
several vegetables and fruits, demonstrated the cytotoxic effect
toward HuCCA-1. Apoptotic cell death was detected using two
different methods, a flow cytometric analysis (Muse Cell Analyzer)
with Annexin-V and dead cell assay kit, and DNA fragmentation
confirmed the occurrence of early and late apoptosis. The proteins
most significantly altered subsequent to treatment with apigenin
were associated with apoptosis. The cleavage of cytokeratin 8, 18
and 19 and the high expression of S100-A6 and S100-A11 indicate
that apoptosis was induced by apigenin via a caspase-dependent
pathway. A marked reduction in the expression of hnRNP A2/B1 was
also observed, possibly with changes of splicing forms, since it
has been identified that the binding of apigenin to hnRNP A2/B1
resulted in changes of the splicing forms. The present study aimed
to contribute to the understanding of the usefulness of dietary
flavonoids such as apigenin.
Acknowledgments
The present study was supported by the Chulabhorn
Research Institute (grant no. BC 2008-02).
References
|
1
|
Kalra EK: Nutraceutical-definition and
introduction. AAPS PharmSci. 5:E252003. View Article : Google Scholar : PubMed/NCBI
|
|
2
|
Manach C, Scalbert A, Morand C, Rémésy C
and Jiménez L: Polyphenols: Food sources and bioavailability. Am J
Clin Nutr. 79:727–747. 2004.PubMed/NCBI
|
|
3
|
Birt DF, Walker B, Tibbels MG and Bresnick
E: Anti-mutagenesis and anti-promotion by apigenin, robinetin and
indole-3-carbinol. Carcinogenesis. 7:959–963. 1986. View Article : Google Scholar : PubMed/NCBI
|
|
4
|
Shukla S and Gupta S: Apigenin: A
promising molecule for cancer prevention. Pharm Res. 27:962–978.
2010. View Article : Google Scholar : PubMed/NCBI
|
|
5
|
Khan SA, Toledano MB and Taylor-Robinson
SD: Epidemiology, risk factors, and pathogenesis of
cholangiocarcinoma. HPB (Oxford). 10:77–82. 2008. View Article : Google Scholar : PubMed/NCBI
|
|
6
|
Sonakul D, Koompirochana C, Chinda K and
Stitnimakarn T: Hepatic carcinoma with opisthorchiasis. Southeast
Asian J Trop Med Public Health. 9:215–219. 1978.PubMed/NCBI
|
|
7
|
Kobayashi M, Ikeda K, Saitoh S, Suzuki F,
Tsubota A, Suzuki Y, Arase Y, Murashima N, Chayama K and Kumada H:
Incidence of primary cholangiocellular carcinoma of the liver in
japanese patients with hepatitis C virus-related cirrhosis. Cancer.
88:2471–2477. 2000. View Article : Google Scholar : PubMed/NCBI
|
|
8
|
Yamamoto S, Kubo S, Hai S, Uenishi T,
Yamamoto T, Shuto T, Takemura S, Tanaka H, Yamazaki O, Hirohashi K
and Tanaka T: Hepatitis C virus infection as a likely etiology of
intrahepatic cholangiocarcinoma. Cancer Sci. 95:592–595. 2004.
View Article : Google Scholar : PubMed/NCBI
|
|
9
|
Shaib YH, El-Serag HB, Davila JA, Morgan R
and McGlynn KA: Risk factors of intrahepatic cholangiocarcinoma in
the United States: A case-control study. Gastroenterology.
128:620–626. 2005. View Article : Google Scholar : PubMed/NCBI
|
|
10
|
Sorensen HT, Friis S, Olsen JH, Thulstrup
AM, Mellemkjaer L, Linet M, Trichopoulos D, Vilstrup H and Olsen J:
Risk of liver and other types of cancer in patients with cirrhosis:
A nationwide cohort study in Denmark. Hepatology. 28:921–925. 1998.
View Article : Google Scholar : PubMed/NCBI
|
|
11
|
Srisomsap C, Sawangareetrakul P,
Subhasitanont P, Panichakul T, Keeratichamroen S, Lirdprapamongkol
K, Chokchaichamnankit D, Sirisinha S and Svasti J: Proteomic
analysis of cholangiocarcinoma cell line. Proteomics. 4:1135–1144.
2004. View Article : Google Scholar : PubMed/NCBI
|
|
12
|
Srisomsap C, Subhasitanont P,
Sawangareetrakul P, Chokchaichamnankit D, Ngiwsara L, Chiablaem K
and Svasti J: Comparison of membrane-associated proteins in human
cholangiocarcinoma and hepatocellular carcinoma cell lines.
Proteomics Clin Appl. 1:89–106. 2007. View Article : Google Scholar : PubMed/NCBI
|
|
13
|
Elmore S: Apoptosis: A review of
programmed cell death. Toxicol Pathol. 35:495–516. 2007. View Article : Google Scholar : PubMed/NCBI
|
|
14
|
Martin SJ and Green DR: Protease
activation during apoptosis: Death by a thousand cuts? Cell.
82:349–352. 1995. View Article : Google Scholar : PubMed/NCBI
|
|
15
|
Thornberry NA and Lazebnik Y: Caspases:
Enemies within. Science. 281:1312–1316. 1998. View Article : Google Scholar : PubMed/NCBI
|
|
16
|
Jaattela M: Escaping cell death: Survival
proteins in cancer. Exp Cell Res. 248:30–43. 1999. View Article : Google Scholar : PubMed/NCBI
|
|
17
|
Levy-Strumpf N and Kimchi A: Death
associated proteins (DAPs): From gene identification to the
analysis of their apoptotic and tumor suppressive functions.
Oncogene. 17:3331–3340. 1998. View Article : Google Scholar : PubMed/NCBI
|
|
18
|
Brockstedt E, Rickers A, Kostka S,
Laubersheimer A, Dörken B, Wittmann-Liebold B, Bommert K and Otto
A: Identification of apoptosis-associated proteins in a human
Burkitt lymphoma cell line. Cleavage of heterogeneous nuclear
ribonucleoprotein A1 by caspase 3. J Biol Chem. 273:28057–28064.
1998. View Article : Google Scholar : PubMed/NCBI
|
|
19
|
Prasad SC, Soldatenkov VA, Kuettel MR,
Thraves PJ, Zou X and Dritschilo A: Protein changes associated with
ionizing radiation-induced apoptosis in human prostate epithelial
tumor cells. Electrophoresis. 20:1065–1074. 1999. View Article : Google Scholar : PubMed/NCBI
|
|
20
|
Gupta S, Afaq F and Mukhtar H: Selective
growth-inhibitory, cell-cycle deregulatory and apoptotic response
of apigenin in normal versus human prostate carcinoma cells.
Biochem Biophys Res Commun. 287:914–920. 2001. View Article : Google Scholar : PubMed/NCBI
|
|
21
|
Choi EJ and Kim GH: Apigenin induces
apoptosis through a mitochondria/caspase-pathway in human breast
cancer MDA-MB-453 cells. J Clin Biochem Nutr. 44:260–265. 2009.
View Article : Google Scholar : PubMed/NCBI
|
|
22
|
Xu Y, Xin Y, Diao Y, Lu C, Fu J, Luo L and
Yin Z: Synergistic effects of apigenin and paclitaxel on apoptosis
of cancer cells. PLoS One. 6:e291692011. View Article : Google Scholar : PubMed/NCBI
|
|
23
|
Khan A, Gillis K, Clor J and Tyagarajan K:
Simplified evaluation of apoptosis using the Muse cell analyzer.
Postepy Biochem. 58:492–496. 2012.PubMed/NCBI
|
|
24
|
Svasti J, Srisomsap C, Subhasitanont P,
Keeratichamroen S, Chokchaichamnankit D, Ngiwsara L, Chimnoi N,
Pisutjaroenpong S, Techasakul S and Chen ST: Proteomic profiling of
cholangiocarcinoma cell line treated with pomiferin from Derris
malaccensis. Proteomics. 5:4504–4509. 2005. View Article : Google Scholar : PubMed/NCBI
|
|
25
|
Ruela-de-Sousa RR, Fuhler GM, Blom N,
Ferreira CV, Aoyama H and Peppelenbosch MP: Cytotoxicity of
apigenin on leukemia cell lines: Implications for prevention and
therapy. Cell Death Dis. 1:e192010. View Article : Google Scholar : PubMed/NCBI
|
|
26
|
Vargo MA, Voss OH, Poustka F, Cardounel
AJ, Grotewold E and Doseff AI: Apigenin-induced-apoptosis is
mediated by the activation of PKCdelta and caspases in leukemia
cells. Biochem Pharmacol. 72:681–692. 2006. View Article : Google Scholar : PubMed/NCBI
|
|
27
|
Creagh EM, Conroy H and Martin SJ:
Caspase-activation pathways in apoptosis and immunity. Immunol Rev.
193:10–21. 2003. View Article : Google Scholar : PubMed/NCBI
|
|
28
|
Caulin C, Salvesen GS and Oshima RG:
Caspase cleavage of keratin 18 and reorganization of intermediate
filaments during epithelial cell apoptosis. J Cell Biol.
138:1379–1394. 1997. View Article : Google Scholar : PubMed/NCBI
|
|
29
|
Leers MP, Kolgen W, Björklund V, Bergman
T, Tribbick G, Persson B, Björklund P, Ramaekers FC, Björklund B,
Nap M, et al: Immunocytochemical detection and mapping of a
cytokeratin 18 neo-epitope exposed during early apoptosis. J
Pathol. 187:567–572. 1999. View Article : Google Scholar : PubMed/NCBI
|
|
30
|
Schutte B, Henfling M, Kölgen W, Bouman M,
Meex S, Leers MP, Nap M, Björklund V, Björklund P, Björklund B, et
al: Keratin 8/18 breakdown and reorganization during apoptosis. Exp
Cell Res. 297:11–26. 2004. View Article : Google Scholar : PubMed/NCBI
|
|
31
|
Mitamura S, Ikawa H, Mizuno N, Kaziro Y
and Itoh H: Cytosolic nuclease activated by caspase-3 and inhibited
by DFF-45. Biochem Biophys Res Commun. 243:480–484. 1998.
View Article : Google Scholar : PubMed/NCBI
|
|
32
|
Joo JH, Yoon SY, Kim JH, Paik SG, Min SR,
Lim JS, Choe IS, Choi I and Kim JW: S100A6 (calcyclin) enhances the
sensitivity to apoptosis via the upregulation of caspase-3 activity
in Hep3B cells. J Cell Biochem. 103:1183–1197. 2008. View Article : Google Scholar : PubMed/NCBI
|
|
33
|
Makino E, Sakaguchi M, Iwatsuki K and Huh
NH: Introduction of an N-terminal peptide of S100C/A11 into human
cells induces apoptotic cell death. J Mol Med (Berl). 82:612–620.
2004. View Article : Google Scholar : PubMed/NCBI
|
|
34
|
Hamada S, Satoh K, Hirota M, Kanno A,
Ishida K, Umino J, Ito H, Kikuta K, Kume K, Masamune A, et al:
Calcium-binding protein S100P is a novel diagnostic marker of
cholangiocarcinoma. Cancer Sci. 102:150–156. 2011. View Article : Google Scholar : PubMed/NCBI
|
|
35
|
Nakanuma Y and Sato Y: Hilar
cholangiocarcinoma is pathologically similar to pancreatic duct
adenocarcinoma: Suggestions of similar background and development.
J Hepatobiliary Pancreat Sci. 21:441–447. 2014. View Article : Google Scholar : PubMed/NCBI
|
|
36
|
Wu Z, Boonmars T, Nagano I, Boonjaraspinyo
S, Srinontong P, Ratasuwan P, Narong K, Nielsen PS and Maekawa Y:
Significance of S100P as a biomarker in diagnosis, prognosis and
therapy of opisthorchiasis-associated cholangiocarcinoma. Int J
Cancer. 138:396–408. 2016. View Article : Google Scholar : PubMed/NCBI
|
|
37
|
Noolu B, Ajumeera R, Chauhan A, Nagalla B,
Manchala R and Ismail A: Murraya koenigii leaf extract inhibits
proteasome activity and induces cell death in breast cancer cells.
BMC Complement Altern Med. 13:72013. View Article : Google Scholar : PubMed/NCBI
|
|
38
|
Beyer AL, Christensen ME, Walker BW and
LeStourgeon WM: Identification and characterization of the
packaging proteins of core 40S hnRNP particles. Cell. 11:127–138.
1977. View Article : Google Scholar : PubMed/NCBI
|
|
39
|
Cooper TA, Wan L and Dreyfuss G: RNA and
disease. Cell. 136:777–793. 2009. View Article : Google Scholar : PubMed/NCBI
|
|
40
|
Arango D, Morohashi K, Yilmaz A, Kuramochi
K, Parihar A, Brahimaj B, Grotewold E and Doseff AI: Molecular
basis for the action of a dietary flavonoid revealed by the
comprehensive identification of apigenin human targets. Proc Natl
Acad Sci USA. 110:E2153–E2162. 2013. View Article : Google Scholar : PubMed/NCBI
|
|
41
|
Lindquist S and Craig EA: The heat-shock
proteins. Annu Rev Genet. 22:631–677. 1988. View Article : Google Scholar : PubMed/NCBI
|
|
42
|
Calderwood SK and Ciocca DR: Heat shock
proteins: Stress proteins with Janus-like properties in cancer. Int
J Hyperthermia. 24:31–39. 2008. View Article : Google Scholar : PubMed/NCBI
|
|
43
|
Takayama S, Reed JC and Homma S:
Heat-shock proteins as regulators of apoptosis. Oncogene.
22:9041–9047. 2003. View Article : Google Scholar : PubMed/NCBI
|
|
44
|
Kubota H, Yamamoto S, Itoh E, Abe Y,
Nakamura A, Izumi Y, Okada H, Iida M, Nanjo H, Itoh H and Yamamoto
Y: Increased expression of co-chaperone HOP with HSP90 and HSC70
and complex formation in human colonic carcinoma. Cell Stress
Chaperones. 15:1003–1011. 2010. View Article : Google Scholar : PubMed/NCBI
|
|
45
|
Sun W, Xing B, Sun Y, Du X, Lu M, Hao C,
Lu Z, Mi W, Wu S, Wei H, et al: Proteome analysis of hepatocellular
carcinoma by two-dimensional difference gel electrophoresis: Novel
protein markers in hepatocellular carcinoma tissues. Mol Cell
Proteomics. 6:1798–1808. 2007. View Article : Google Scholar : PubMed/NCBI
|
|
46
|
Erlich RB, Kahn SA, Lima FR, Muras AG,
Martins RA, Linden R, Chiarini LB, Martins VR and Moura Neto V:
STI1 promotes glioma proliferation through MAPK and PI3K pathways.
Glia. 55:1690–1698. 2007. View Article : Google Scholar : PubMed/NCBI
|
|
47
|
Wang TH, Chao A, Tsai CL, Chang CL, Chen
SH, Lee YS, Chen JK, Lin YJ, Chang PY, Wang CJ, et al:
Stress-induced phosphoprotein 1 as a secreted biomarker for human
ovarian cancer promotes cancer cell proliferation. Mol Cell
Proteomics. 9:1873–1884. 2010. View Article : Google Scholar : PubMed/NCBI
|
|
48
|
Tanioka T, Nakatani Y, Semmyo N, Murakami
M and Kudo I: Molecular identification of cytosolic prostaglandin
E2 synthase that is functionally coupled with cyclooxygenase-1 in
immediate prostaglandin E2 biosynthesis. J Biol Chem.
275:32775–32782. 2000. View Article : Google Scholar : PubMed/NCBI
|
|
49
|
Simpson NE, Lambert WM, Watkins R,
Giashuddin S, Huang SJ, Oxelmark E, Arju R, Hochman T, Goldberg JD,
Schneider RJ, et al: High levels of Hsp90 cochaperone p23 promote
tumor progression and poor prognosis in breast cancer by increasing
lymph node metastases and drug resistance. Cancer Res.
70:8446–8456. 2010. View Article : Google Scholar : PubMed/NCBI
|
|
50
|
Gausdal G, Gjertsen BT, Fladmark KE, Demol
H, Vandekerckhove J and Doskeland SO: Caspase-dependent,
geldanamycin-enhanced cleavage of co-chaperone p23 in leukemic
apoptosis. Leukemia. 18:1989–1996. 2004. View Article : Google Scholar : PubMed/NCBI
|