Introduction
Multiple myeloma (MM) is a cancer of the plasma
cells within the bone marrow (BM), which caused ~79,000 mortalities
in 2013 (1). It has been widely
accepted that MM arises from monoclonal gammopathy of undetermined
significance (MGUS), which is a pre-malignant condition that can be
present for several years prior to the development of MM (2). As MM is incurable in the vast majority
of patients (3), there is an urgent
requirement for novel therapies. Intervening at the MGUS stage may
aid to prevent the progression of MGUS to MM (4,5).
Therefore, a thorough understanding of the molecular pathogenesis
of MM and MGUS is urgently required to guide interventions that
target the precursor state (MGUS) and MM itself.
Kubiczkova et al (6) revealed the identity of five microRNAs
(miRNAs/miRs) that were deregulated in the circulating serum of
patients with MM and MGUS, compared with that of healthy subjects.
Shvartsur et al (7) suggested
that Raf-1 kinase inhibitor protein-associated genes could be
implicated in MM and MGUS using a bioinformatics approach. Amend
et al (8) provided in
vivo evidence that the absence of SAM domain, SH3 domain and
nuclear localization signals 1 may be associated with genetic
susceptibility to MGUS in mice. Furthermore, there is evidence that
a dysregulated cyclin D/retinoblastoma signaling pathway is
involved in the molecular pathogenesis of MM and MGUS (9,10). The
nuclear factor-κB (NF-κB) signaling pathway serves an important
role in the mechanism of MM pathogenesis (11). Despite these advances, the molecular
mechanisms behind the transformation of MUGS into MM have not been
fully elucidated.
McNee et al (12) observed that the citrullination of
histone H3 promotes interleukin-6 (IL-6) production by BM
mesenchymal stem cells, resulting in pro-malignancy signaling in
patients with MGUS and MM. However, the genes and pathways involved
in MM and MGUS have not been fully delineated. Therefore, the
present study reports a secondary analysis of the microarray
dataset GSE80608 (12).
Differentially expressed genes (DEGs) in MM, MGUS and control
subjects were identified, and a protein-protein interaction (PPI)
network was built to analyze the interactions between genes. A gene
co-expression network was then built to analyze the co-expression
of these DEGs in MGUS and MM. Kyoto Encyclopedia of Genes and
Genomes (KEGG) pathway-enrichment analysis was performed to reveal
the signaling pathways that may be involved in MGUS and MM. The
data may provide indications of the genes and pathways that
determine the progression of MGUS to MM.
Materials and methods
Microarray dataset preprocessing
The present study was a secondary study on the
GSE80608 microarray dataset, obtained from the National Center for
Biotechnology Information Gene Expression Omnibus (http://www.ncbi.nlm.nih.gov/geo/) (13) and based on the Affymetrix Human Exon
1.0 ST Array platform (Affymetrix; Thermo Fisher Scientific, Inc.,
Waltham, MA, USA). The dataset consisted of 10 control BM samples,
10 BM samples from the iliac crest of 10 patients with MGUS and 10
BM samples from the iliac crest of 10 patients with MM.
With the aid of oligo software (version 5.1;
National Biosciences, Inc., Plymouth, Minn., USA), the raw data
were subjected to data preprocessing, including background
correction, data normalization and calculation of probe expression
values. By using huex10sttranscriptcluster.db (14) and annotate (15) software in R (16), each probe was mapped to its
corresponding gene symbol.
DEGs screening
DEGs were screened between MGUS and control, and
between MM and control samples, using the LIMMA package in R
(17). A strict cutoff was set at a
false discovery rate <0.05 and fold change (|log2FC|)
≥1.5.
Venn diagram analysis and KEGG pathway
enrichment analysis
DEGs in MGUS or MM were analyzed using a Venn
diagram (18), which revealed the
number of the common upregulated DEGs, common downregulated DEGs
and contra-regulated DEGs between MGUS and MM in a Venn
diagram.
KEGG pathway enrichment (19) analysis was performed for the
identified DEGs using DAVID software (20). KEGG pathways with a gene count ≥2 and
P<0.05 were considered to indicate a statistically significant
difference.
Analysis of a PPI network
A PPI network (PPI score=0.7) was constructed with
the identified DEGs using the STRING online tool (21) to analyze the interactions between the
DEGs. In the PPI network, a node denoted a gene and a link between
two nodes denoted the interaction between the two genes. The number
of interactions between one gene and other genes in the network was
represented by the ‘degree’ value. The topological parameters of
the nodes in the PPI network were analyzed using the Cytoscape
CytoNCA application (22), and
included degree, betweenness (23),
closeness (24) and subgraph
(25).
Gene co-expression analysis
A gene co-expression network was built to analyze
the co-expression of the DEGs in MGUS and MM. The co-expression
coefficient between two genes was calculated based on the Pearson's
correlation coefficient. The P-value was calculated using the
Z-score (26). Significant
co-expressed gene pairs were determined to have a co-expression
coefficient >0.85 and P<0.05. KEGG pathway enrichment
analysis was then conducted for the co-expressed genes.
Analysis of disease-related miRNA and
target genes
MM-associated miRNAs were downloaded from the
miR2Disease database (27), which
included 17 miRNAs that were associated with MM. On the basis of
these miRNAs, target genes were predicted using miRwalk2.0
(28). The miRNA-target gene
interaction pairs were obtained from the validated target module in
miRwalk2.0, which had been validated previously (28). Finally, the differentially expressed
target genes were selected.
Results
Identification and Venn diagram
analysis of DEGs
The present study identified 387 DEGs between MGUS
and control samples, and 463 DEGs between MM and control samples.
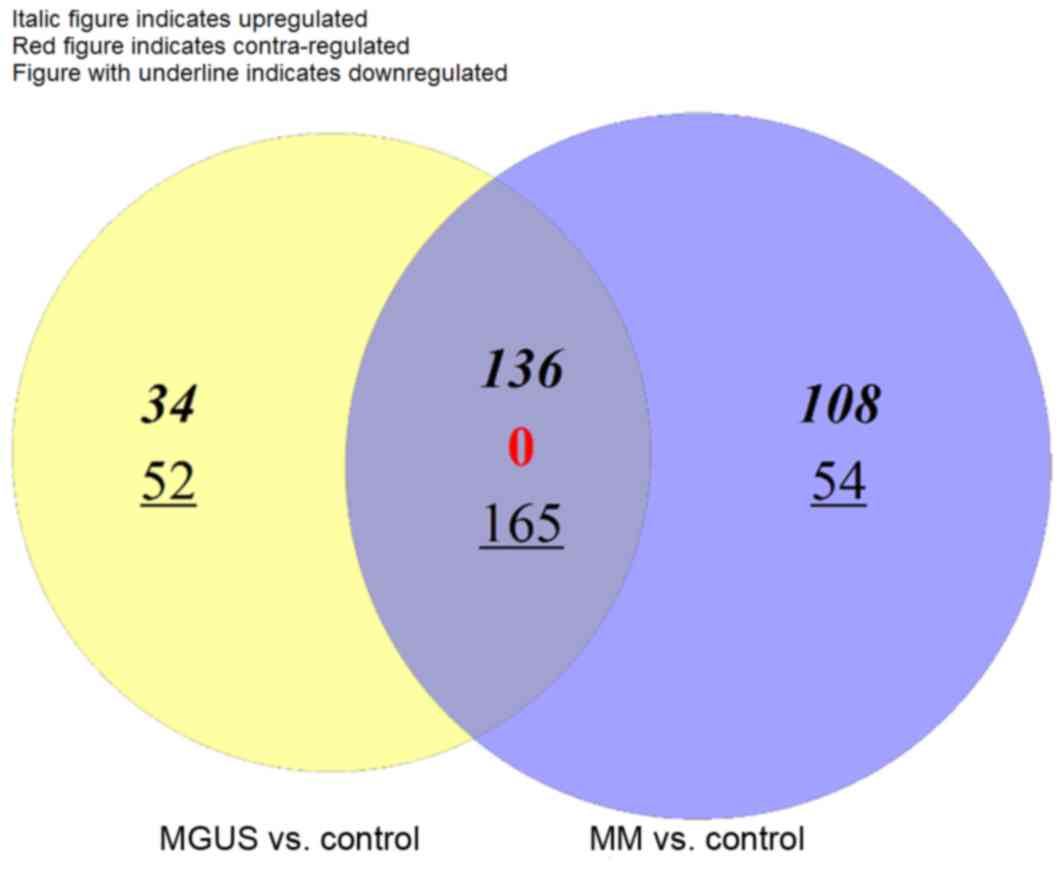
Venn diagram analysis revealed that there were 136 common
upregulated DEGs, 165 common downregulated DEGs and no
contra-regulated DEGs between MGUS and MM (Fig. 1). MGUS had 34 specific upregulated
DEGs and 52 specific downregulated DEGs, whereas MM had 108
specific upregulated DEGs and 54 specific downregulated DEGs. A
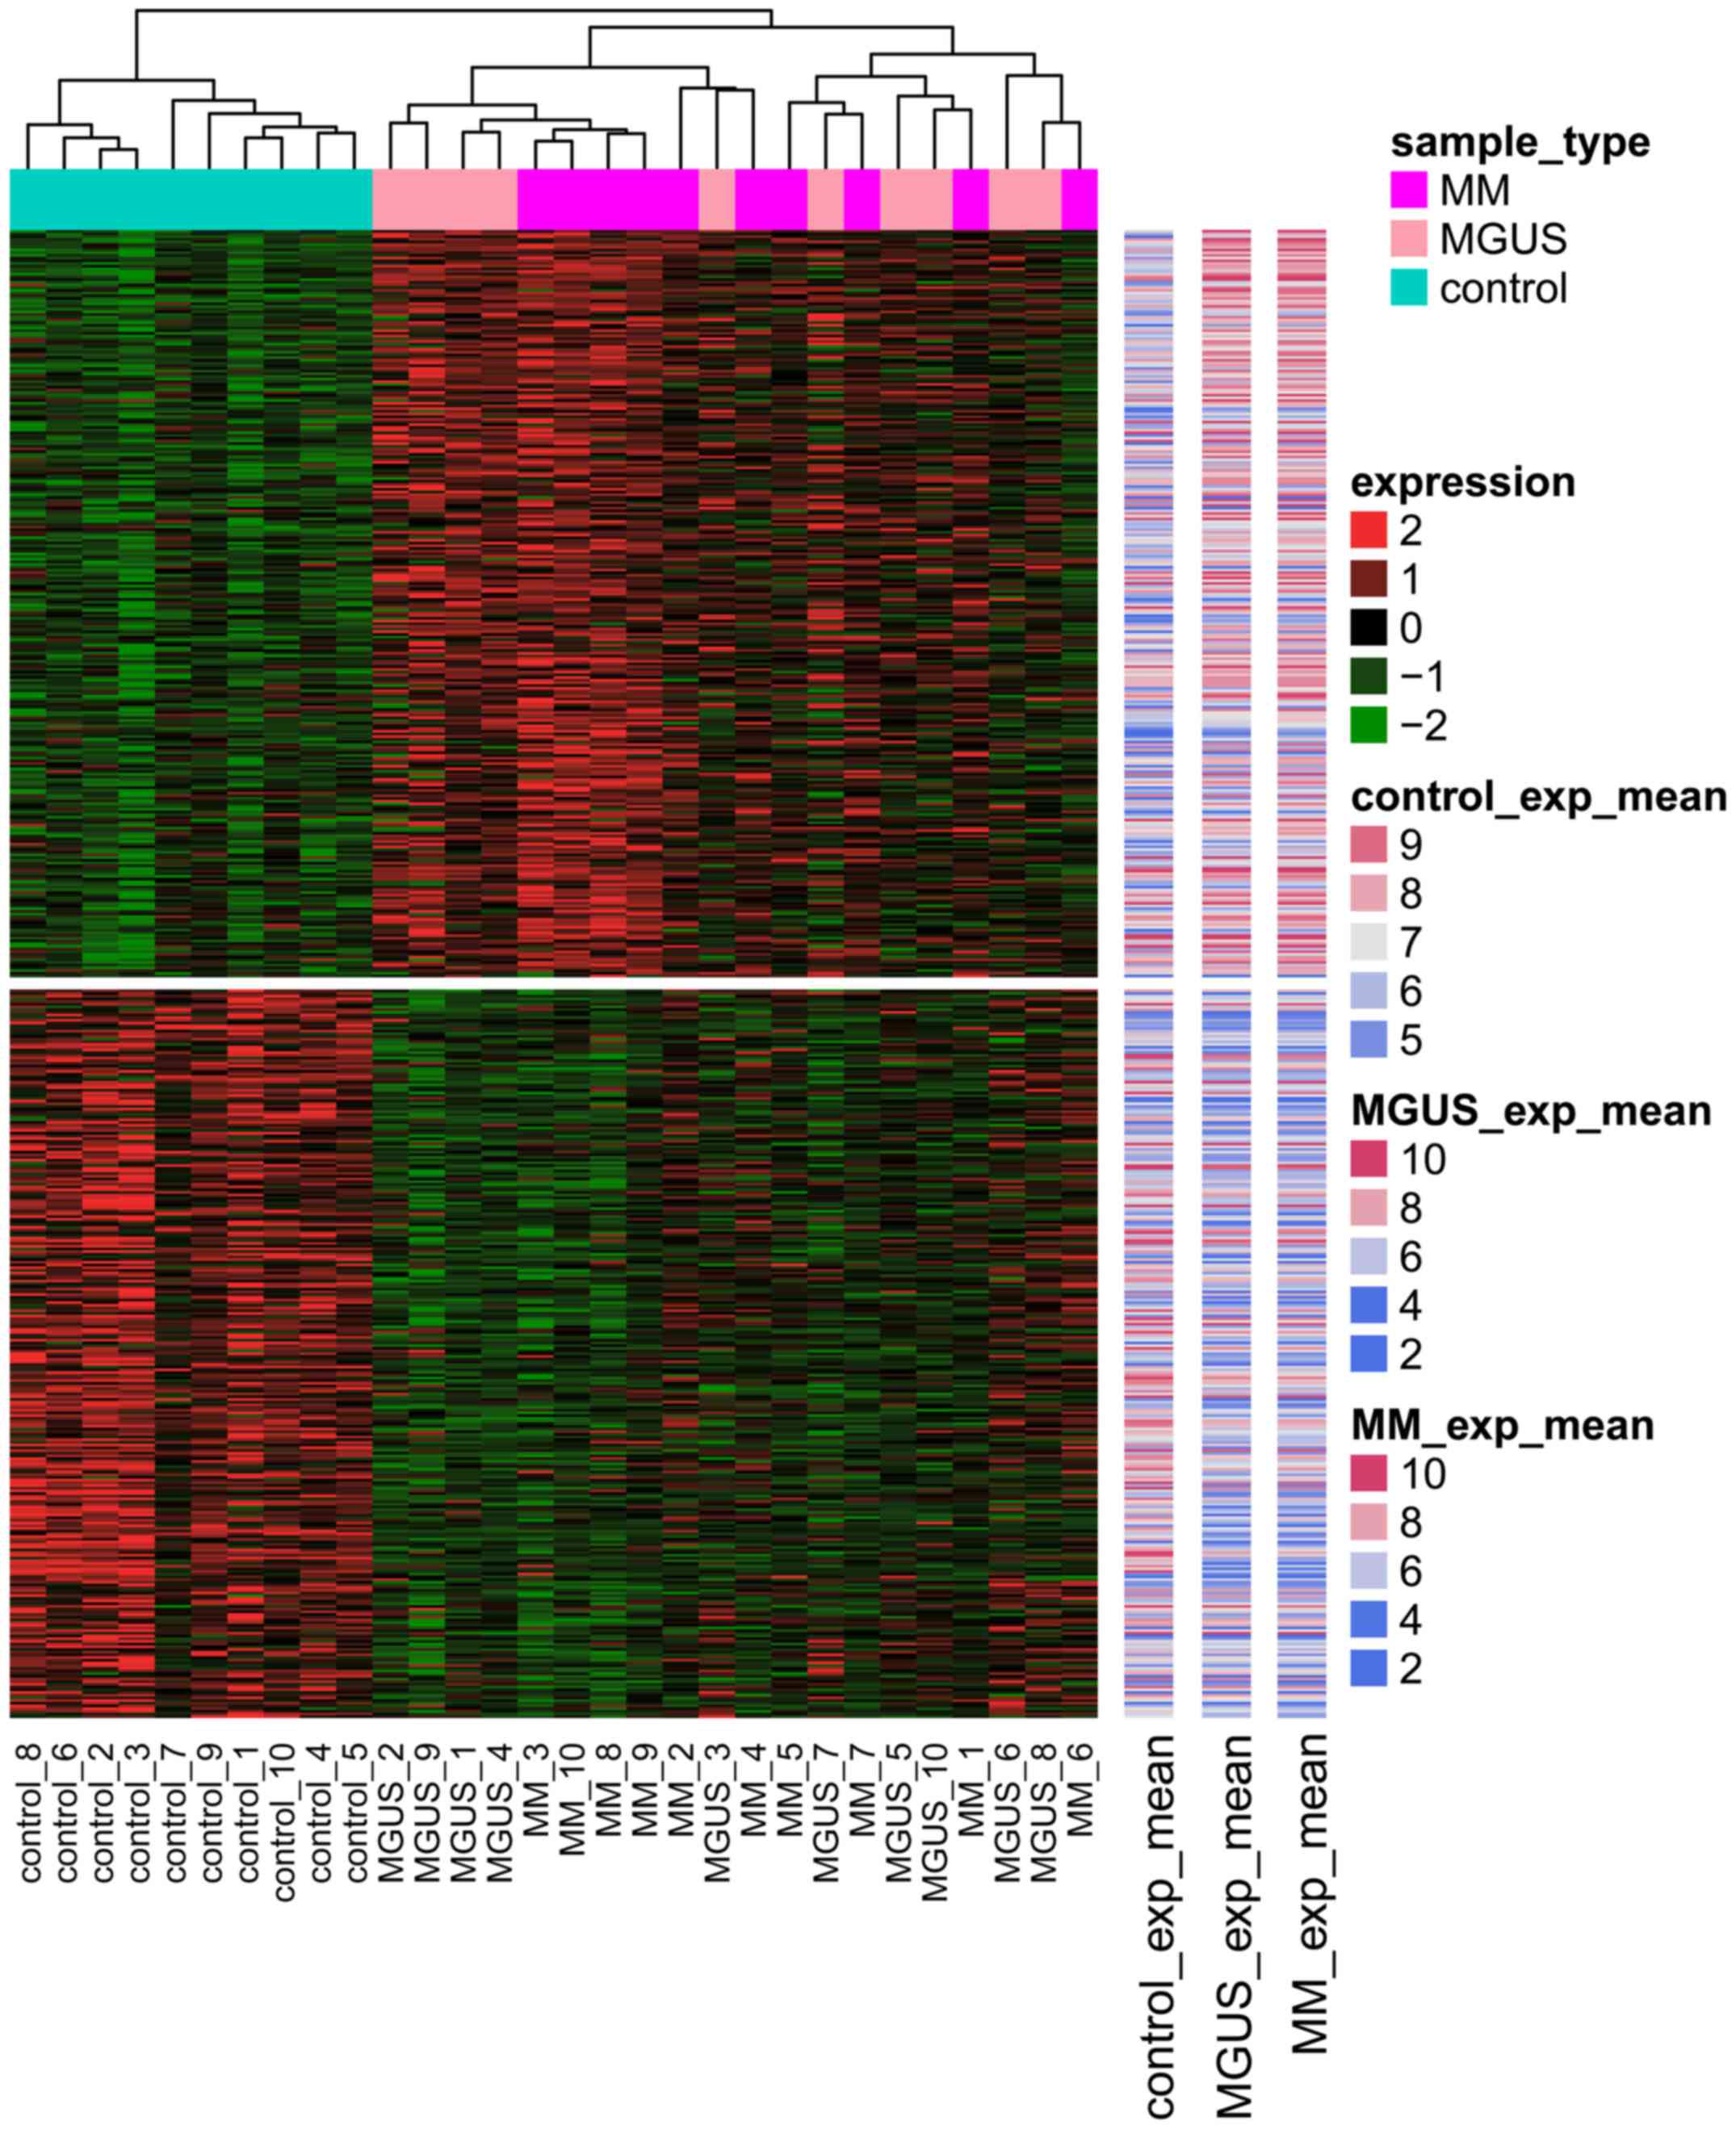
heat map revealed that DEG expression in the control samples was
markedly different from that in MM and MGUS samples (Fig. 2).
KEGG pathway enrichment analysis
KEGG pathway enrichment analysis (Table I) revealed that the common upregulated
DEGs were significantly enriched in five pathways, including the
Rap1 signaling pathway and the regulation of actin cytoskeleton
pathway. The common downregulated DEGs were significantly
associated with the complement and coagulation cascades, including
cluster of differentiation 55 (CD55), thrombomodulin (THBD),
mannan-binding lectin serine protease 1 (MASP1), complement factor
B (CFB), coagulation factor III (F3), complement component 1 (C1)R,
C1S and coagulation factor II receptor (F2R). Furthermore, common
downregulated DEGs were significantly associated with axon
guidance, ATP-binding cassette transporters, Staphylococcus
aureus infection response and steroid hormone biosynthesis
pathways. MM-specific upregulated DEGs were significantly
associated with the regulation of actin cytoskeleton pathway.
 | Table I.Significant Kyoto Encyclopedia of
Genes and Genomes pathways of DEGs. |
Table I.
Significant Kyoto Encyclopedia of
Genes and Genomes pathways of DEGs.
| DEGs | Pathway | P-value | Genes |
|---|
| Common upregulated
DEGs | hsa04360: Axon
guidance |
8.43×10⁻⁴ | PLXNA3, SEMA7A,
MET, NTN4, SEMA3A, CXCL12, EPHA3 |
|
| hsa04514: Cell
adhesion molecules |
8.17×10⁻³ | NRXN3, ICAM2, CD4,
ITGB2, NECTIN3, PDCD1LG2 |
|
| hsa05200: Pathways
in cancer |
2.16×10⁻² | FGF5, PLCB4, PGF,
SLC2A1, MET, BDKRB1, ITGA3, FGF1, CXCL12 |
|
| hsa04015: Rap1
signaling pathway |
3.75×10⁻² | FGF5, PLCB4, PGF,
MET, ITGB2, FGF1 |
|
| hsa04810:
Regulation of actin cytoskeleton |
3.82×10⁻² | FGF5, SCIN, BDKRB1,
ITGB2, ITGA3, FGF1 |
| Common
downregulated DEGs | hsa04610:
Complement and coagulation cascades |
7.15×10⁻⁶ | CD55, THBD, MASP1,
CFB, F3, C1R, C1S, F2R |
|
| hsa04360: Axon
guidance |
1.09×10⁻² | EPHA4, SEMA6D,
NTNG1, EFNA5, UNC5D, SLIT3 |
|
| hsa02010: ABC
transporters |
1.11×10⁻² | ABCA8, ABCC9,
ABCA9, ABCA6 |
|
| hsa05150:
Staphylococcus aureus infection |
1.65×10⁻² | MASP1, CFB, C1R,
C1S |
|
| hsa00140: Steroid
hormone biosynthesis |
2.32×10⁻² | AKR1C3, AKR1C2,
HSD11B1, AKR1C1 |
| MM-specific
upregulated DEGs | hsa04810:
Regulation of actin cytoskeleton |
4.79×10⁻² | RAC2, MRAS, ITGA8,
DIAPH3, ITGA7 |
| MGUS-specific
downregulated DEGs | hsa05410:
Hypertrophic cardiomyopathy |
1.91×10⁻² | SGCD, IGF1,
CACNA2D3 |
|
| hsa05414: Dilated
cardiomyopathy |
2.20×10⁻² | SGCD, IGF1,
CACNA2D3 |
PPI network
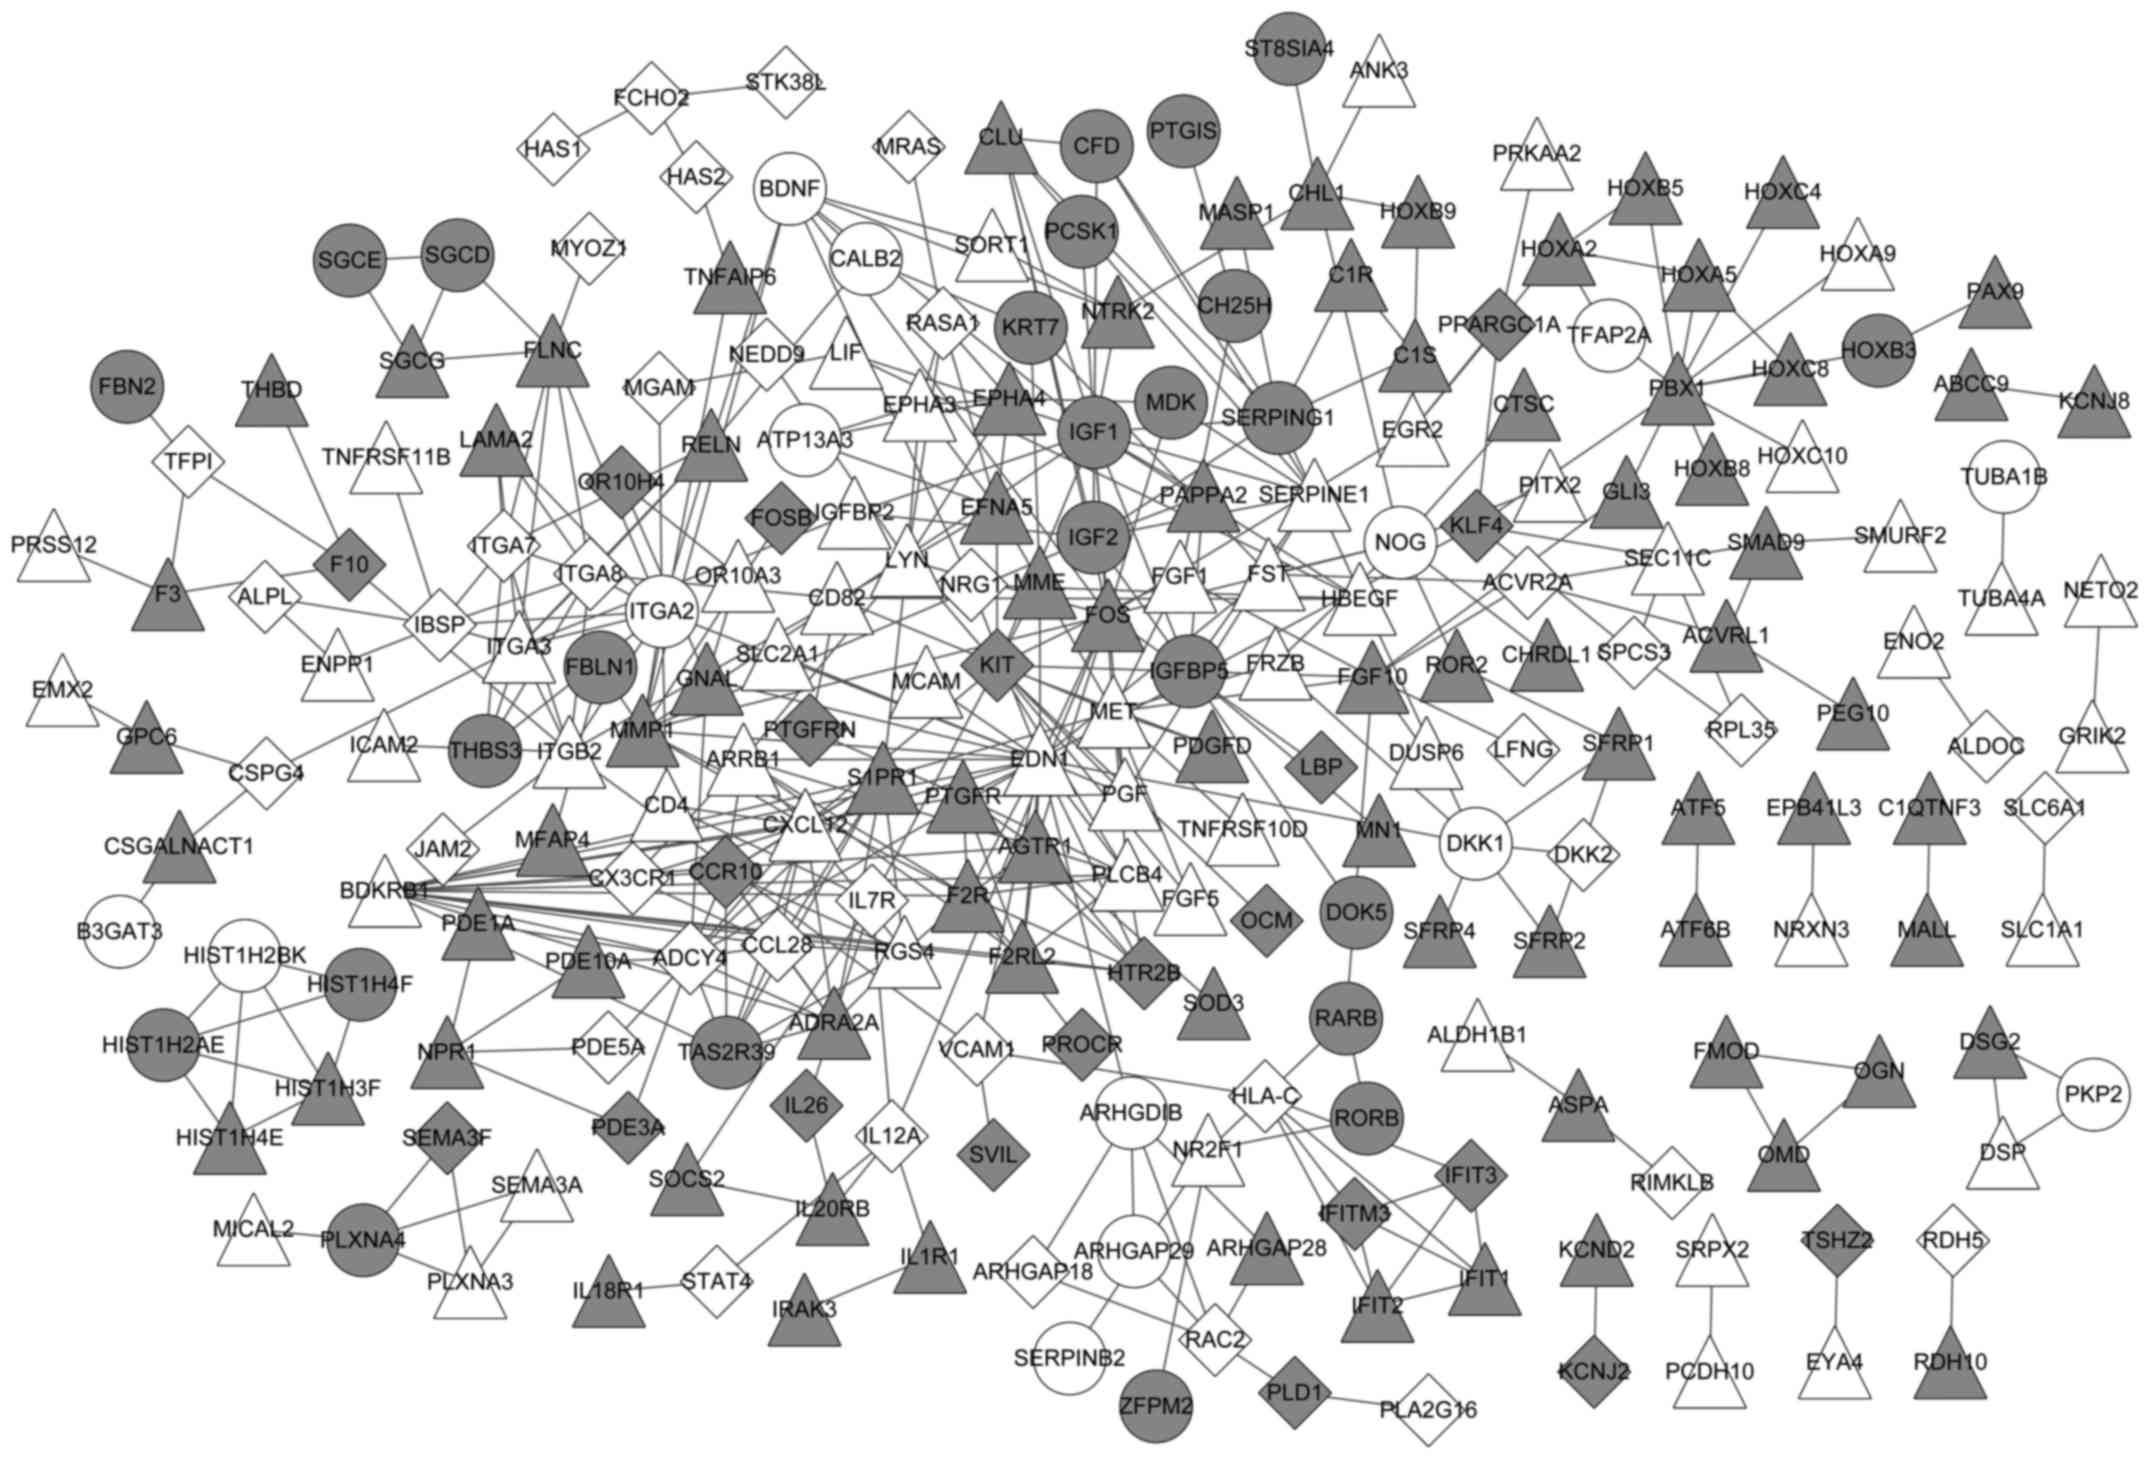
A PPI network was built with the DEGs in MM and MGUS
(Fig. 3). The network included 233
nodes and 435 gene pairs. Of these genes, 39 were MGUS-specific, 59
were MM-specific and 125 were common between MGUS and MM.
In the PPI network, the top 20 genes (nodes) were
selected, based on their values of degree, betweenness, closeness
and subgraph, to be the important nodes in the PPI network
(Table II). Of the top 20 genes,
endothelin 1 (EDN1), C-X-C motif chemokine ligand 12, adenylate
cyclase 4, matrix metallopeptidase 1, insulin like growth factor 1
and Finkel-Biskis-Jinkins osteosarcoma oncogene were common between
MGUS and MM.
| Table II.Degree, betweenness, closeness and
subgraph of the top 20 nodes in the protein-protein interaction
network. |
Table II.
Degree, betweenness, closeness and
subgraph of the top 20 nodes in the protein-protein interaction
network.
| Node, gene | Subgraph | Degree | Betweenness | Closeness |
|---|
| BDKRB1 | 1,515.014801 | 15 |
|
2.18×10⁻² |
| EDN1 | 1,337.5355 | 24 | 14,298.21 |
2.20×10⁻² |
| CXCL12 | 1,014.57958 | 14 | 1,799.90 |
2.18×10⁻² |
| ADCY4 |
691.12317 |
|
|
|
| F2R |
687.05615 | 11 |
|
2.18×10⁻² |
| CCR10 |
641.9886599 | 9 |
|
|
| S1PR1 |
633.8678 | 10 |
|
|
| CCL28 |
597.2848528 | 9 |
|
|
| AGTR1 |
580.683 | 10 |
|
2.18×10⁻² |
| ADRA2A |
559.71972 |
|
|
|
| TAS2R39 |
559.718772 |
|
|
|
| RGS4 |
542.425323 |
|
|
|
| F2RL2 |
511.2666327 |
|
|
|
| PLCB4 |
510.37097 | 9 |
|
2.18×10⁻² |
| PTGFR |
486.30338 |
|
|
|
| HTR2B |
432.8887689 |
|
|
|
| ARRB1 |
363.97263 |
|
|
|
| MMP1 |
248.22731 | 11 | 4,609.06 |
2.19×10⁻² |
| IGF1 |
233.1976220 | 17 | 4,473.53 |
|
| FOS |
213.7347773 | 13 | 6,338.76 |
2.19×10⁻² |
| ADCY4 |
| 13 | 2,133.74 |
2.18×10⁻² |
| KIT |
| 13 | 4,026.67 |
2.18×10⁻² |
| ITGA2 |
| 12 | 5,403.44 |
2.19×10⁻² |
| MET |
| 12 | 3,152.53 |
2.18×10⁻² |
| PBX1 |
| 11 | 3,496.13 |
|
| ITGA8 |
| 10 |
|
|
| LYN |
| 10 | 3,282.67 |
2.18×10⁻² |
| ITGA3 |
| 10 | 2,372.76 |
|
| KLF4 |
|
| 4,272.19 |
|
| ITGB2 |
|
| 3,974.00 |
|
| FGF10 |
|
| 3,904.25 |
|
| VCAM1 |
|
| 2,679.60 |
|
| NOG |
|
| 2,237.87 |
|
| ARHGDIB |
|
| 2,199.00 |
|
| IL12A |
|
| 1,979.33 |
|
| F10 |
|
| 1,848.00 |
|
| FST |
|
|
|
2.17×10⁻² |
| BDNF |
|
|
|
2.18×10⁻² |
| ARRB1 |
|
|
|
2.18×10⁻² |
| MME |
|
|
|
2.18×10⁻² |
| DKK1 |
|
|
|
2.18×10⁻² |
| PGF |
|
|
|
2.19×10⁻² |
| IGF1 |
|
|
|
2.19×10⁻² |
Analysis of a gene co-expression
network
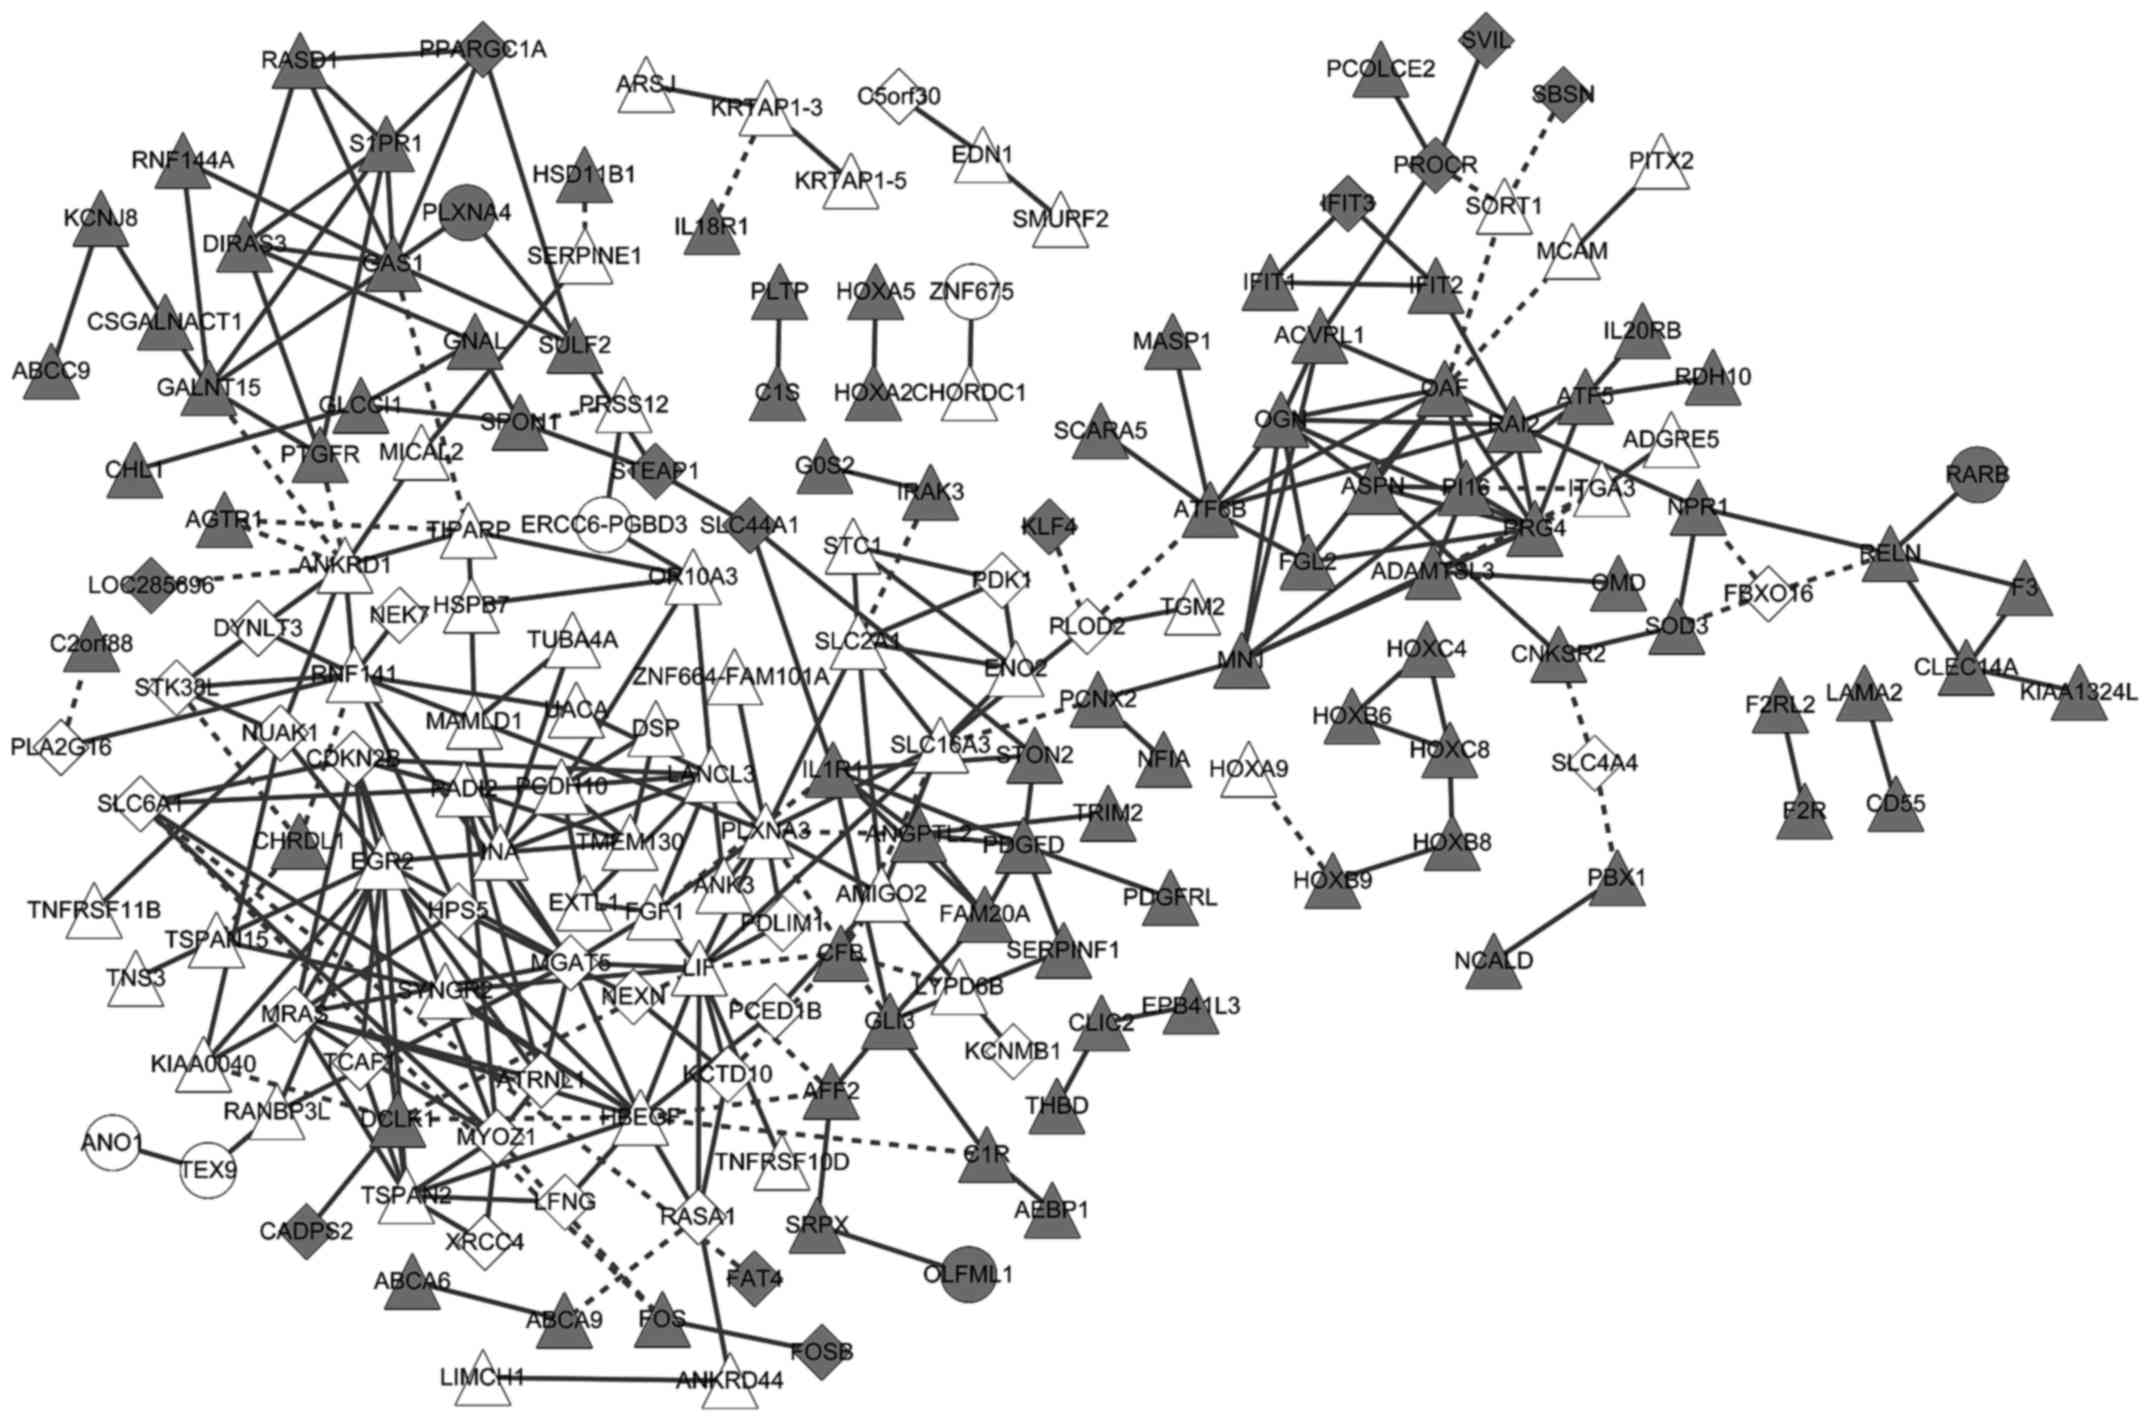
The gene co-expression network included 312
co-expressed gene pairs, 186 MM- or MGUS-specific genes, and 141
genes common to MM and MGUS. The co-expressed genes exhibited
consistent changes in MM and MGUS (Fig.
4). These co-expressed genes were significantly associated with
the complement and coagulation cascades pathway, tumor necrosis
factor (TNF) signaling pathway, S. aureus infection pathway,
hypoxia-inducible factor-1 (HIF-1) signaling pathway and pathways
in cancer (Table III).
| Table III.Significantly enriched pathways of
genes in the gene co-expression network. |
Table III.
Significantly enriched pathways of
genes in the gene co-expression network.
| Pathway | P-value | Genes |
|---|
| hsa04610:
Complement and coagulation cascades |
8.11×10⁻⁷ | CD55, THBD, MASP1,
CFB, F3, SERPINE1, C1R, C1S, F2R |
| hsa05150:
Staphylococcus aureus infection | 0.019029 | MASP1, CFB, C1R,
C1S |
| hsa04066: HIF-1
signaling pathway | 0.023618 | PDK1, EDN1, SLC2A1,
SERPINE1, ENO2 |
| hsa04668: TNF
signaling pathway | 0.029493 | LIF, IL18R1, FOS,
EDN1, ATF6B |
| hsa05200: Pathways
in cancer | 0.030231 | LAMA2, AGTR1, FOS,
CDKN2B, SLC2A1, ITGA3, RARB, FGF1, GLI3, F2R |
Analysis of a miRNAs-gene network
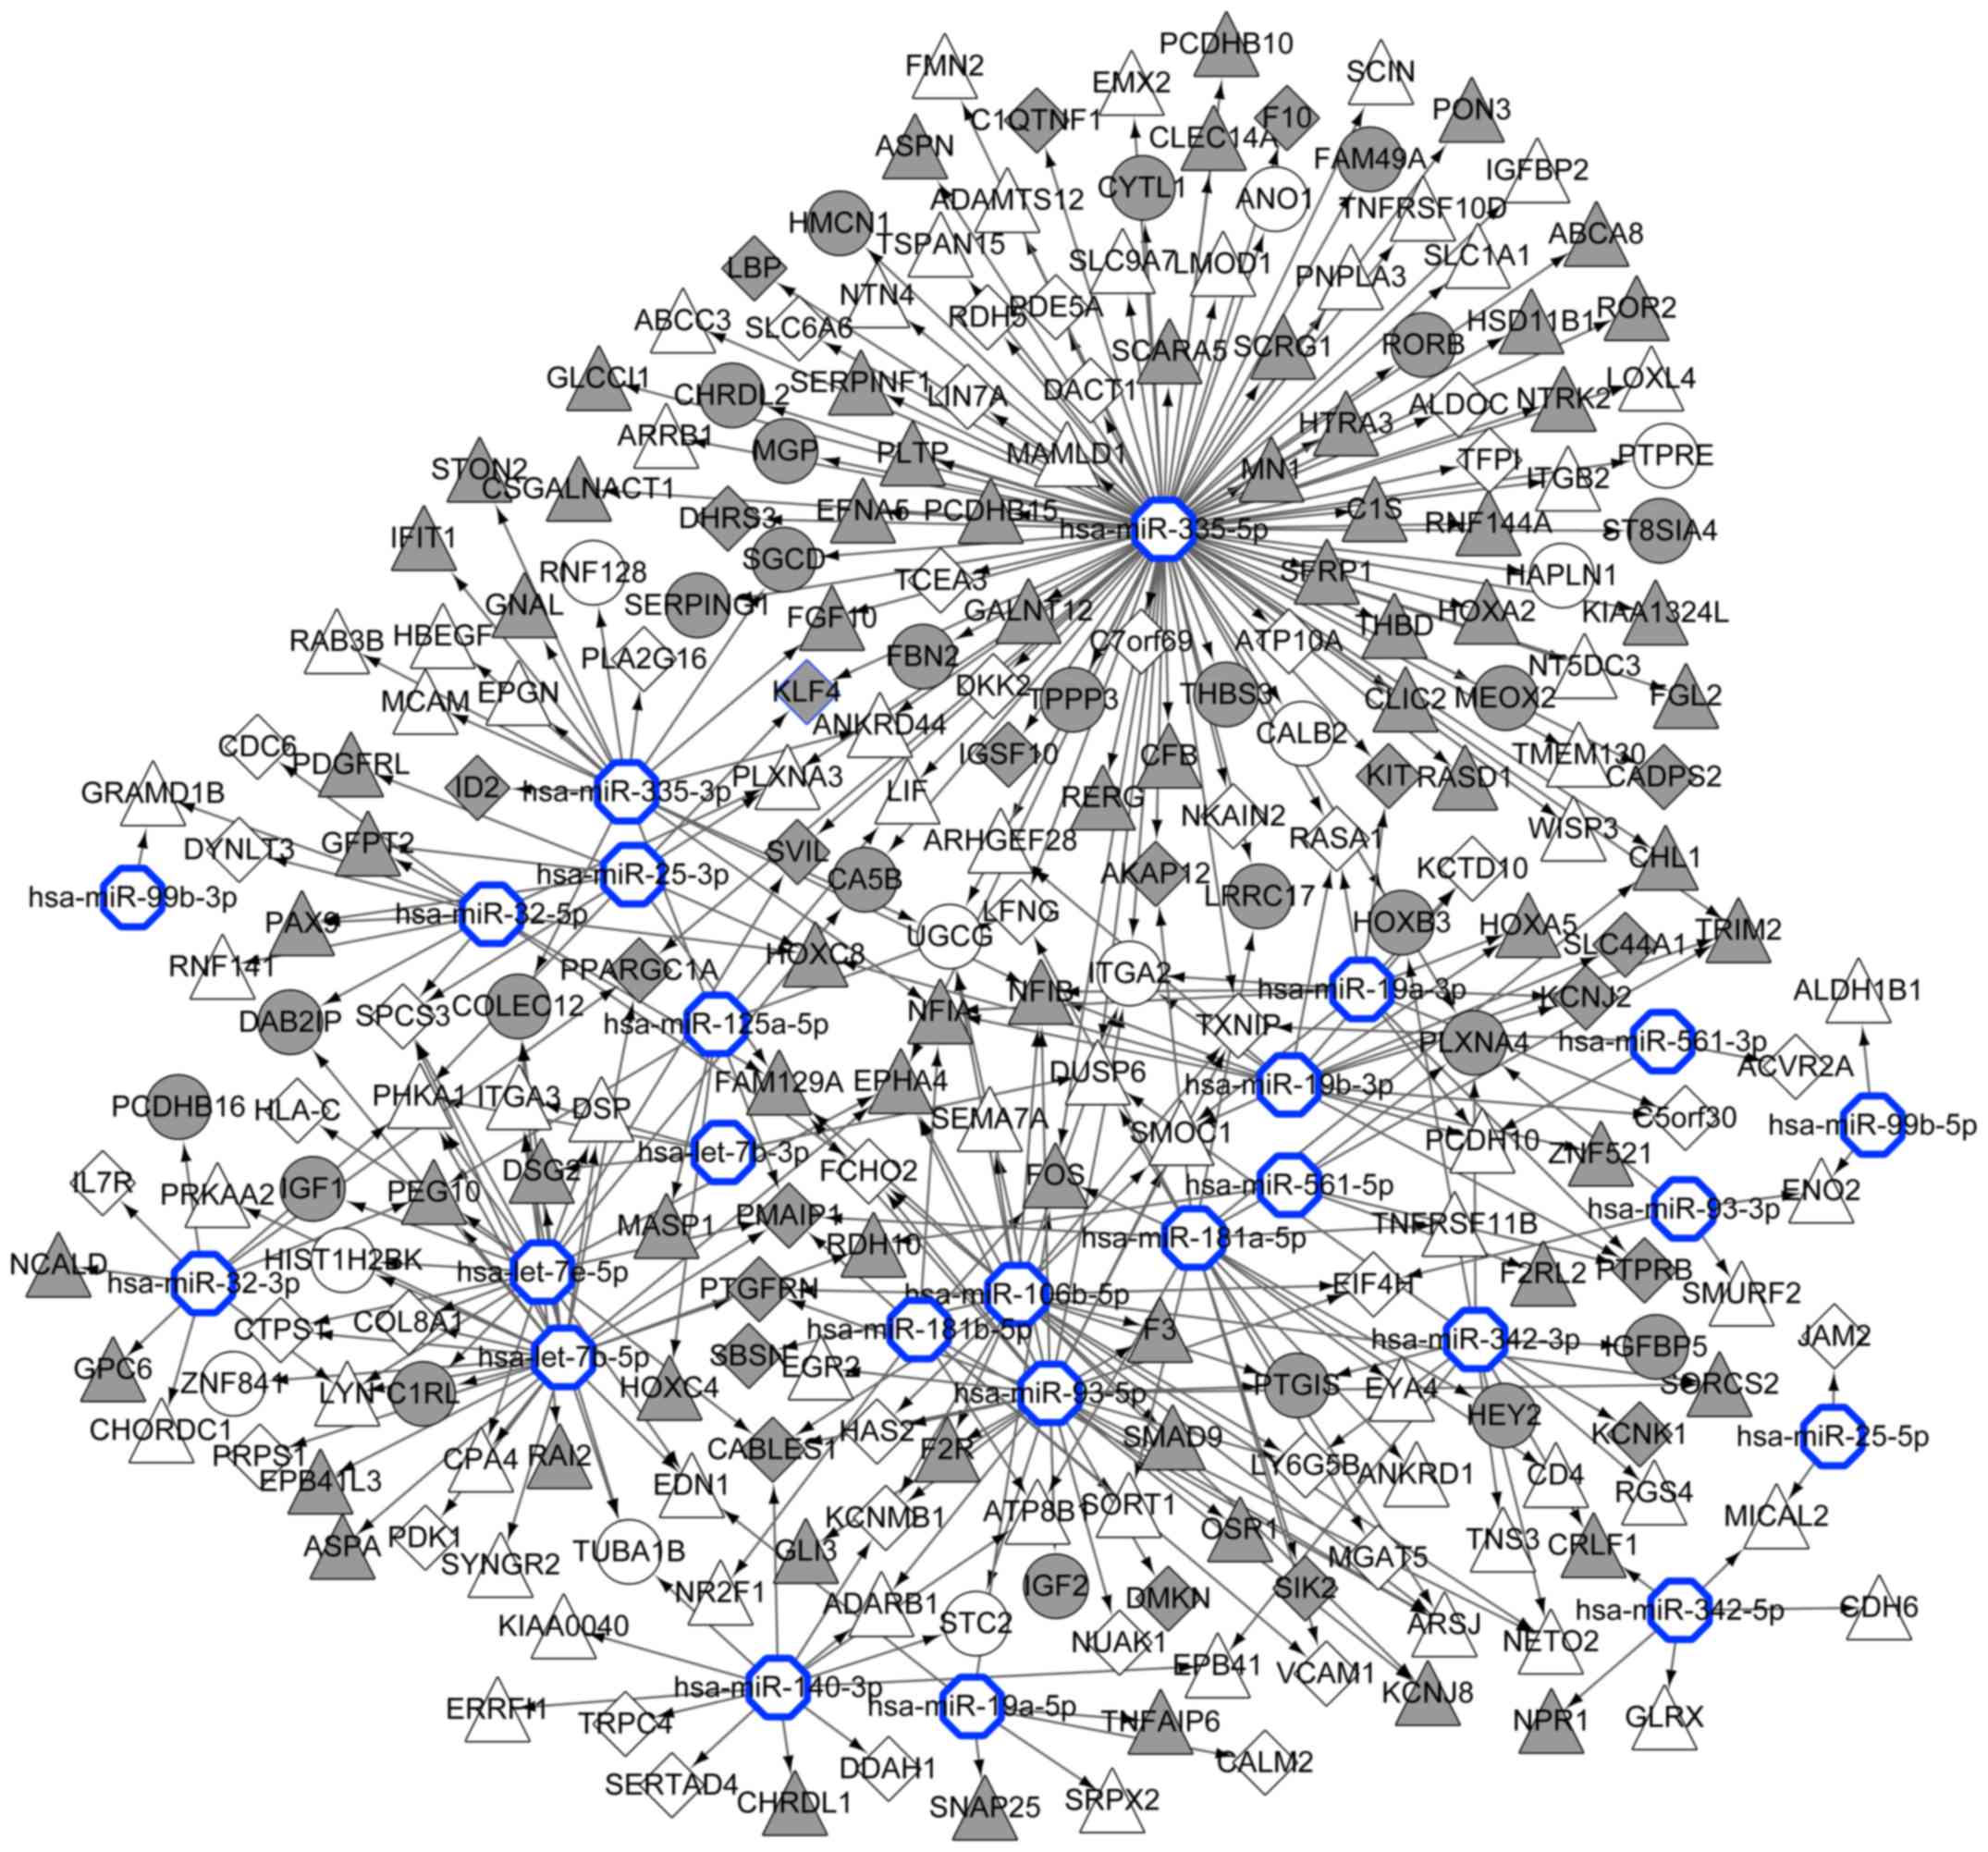
A total of 16 MM-associated miRNAs were obtained
from the miR2Disease database: miR-99b, miR-93, miR-561, miR-342,
miR-335, miR-32, miR-25, miR-19b, miR-19a, miR-181b, miR-181a,
miR-140-3p, miR-125a-5p, miR-106b, let-7e and let-7b. Fig. 5 shows a miRNA-gene network, featuring
the associations between the 16 miRNAs and their target genes.
Discussion
MGUS is premalignant plasma-cell proliferative
condition that consistently precedes MM (29). The current study identified that
common downregulated DEGs, including CD55, THBD, MASP1, CFB, F3,
C1R, C1S and F2R, were significantly enriched in complement and
coagulation cascades pathway. CD55 encodes complement
decay-accelerating factor, which regulates the complement system on
the cell surface (30). THBD encodes
thrombomodulin, which participates in the anticoagulant pathway.
MASP1 is an enzyme involved in the lectin pathway of the complement
system (31). CFB, F3, C1R, C1S and
F2R are components of the complement or coagulation system
(32). Crowely et al (33) suggested that patients with MGUS have
an intermediate coagulation profile, between that of patients with
myeloma and that of healthy controls. There is evidence that MM is
associated with an increased risk of venous thromboembolism
(34). These findings indicate that
these downregulated complement and coagulation genes may be
involved in the development of MM and MGUS through the regulation
of the complement and coagulation cascade pathways.
HIFs are transcription factors that respond to
hypoxia; the HIF signaling pathway mediates the effects of hypoxia
on the cell (35). It has been
suggested that a hypoxic BM environment serves a role in the
pathogenesis of MM (36,37). Azab et al (38) provided evidence that hypoxia promotes
the dissemination of MM. In concordance with these findings, the
current study noticed that the HIF-1 signaling pathway was
significantly enriched for co-expressed genes. This enrichment
indicates that the HIF-1 signaling pathway may have a role in the
development of MM and MGUS. Furthermore, suppression of HIF-1
decreases the expression of the anti-apoptotic protein survivin,
strengthening the sensitivity of MM cells to melphalan (39). HIF-1 inhibition may be a promising
therapeutic strategy for treating MM and premalignant MGUS.
Lee et al (40)
reported that TNF expression is significantly increased in patients
with active MM and regulates IL-6 production. Previous studies have
demonstrated that the NF-κB pathway, which is downstream of TNF, is
involved in MM (11,41). In the present study, the TNF signaling
pathway was significantly enriched by co-expressed genes. EDN1, a
common DEG between MGUS and MM and an important node in the PPI
network, was significantly enriched in the TNF and HIF-1 signaling
pathways. EDN1 is a potent vasoconstrictor produced by vascular
endothelial cells, whose expression is stimulated by hypoxia
(42). These findings indicate that
END1 could serve an important role in premalignant MGUS and MM by
influencing the TNF and HIF-1 signaling pathways.
The present study additionally investigated a
miRNA-gene regulatory network. In the miRNA-gene regulatory
network, END1 was regulated by let-7e-5p, let-7b-5p, and
miR-19a-5p, suggesting that the role of EDN1 in premalignant MGUS
and MM may be affected by these miRNAs. Similarly, Kubiczkova et
al (6) revealed that circulating
serum levels of let-7e are deregulated in MM and MGUS compared with
those in healthy subjects.
The present study has certain limitations. Firstly,
the study samples are limited. It is a secondary study on the
microarray dataset GSE80608, meaning that the number of samples in
the study cannot be increased. Secondly, the study only used
bioinformatics approaches, meaning that experimental data are
necessary to validate these findings in further studies.
The present study suggests that the complement and
coagulation-associated genes EDN1, let-7e, let-7b, miR-19a, along
with the complement and coagulation, and the TNF and HIF-1
signaling pathways, may be involved in the molecular mechanism of
MM and MGUS pathogenesis. Further experiments are warranted to
verify the findings of the current study.
Acknowledgements
The present study was supported by grants from the
National Natural Science Foundation of China (no. 81400168); the
Guangzhou Health Care and Cooperative Innovation Major Project (no.
201400000003-1); the Science and Technology Planning Project of
Guangdong Province, China (no. 2014A020209047 and 2015A020210068);
the Foundation of Guangdong Traditional Chinese Medicine (no.
20131104); the Foundation of Guangdong Medicine (no. A2013128 and
A2017266); the Foundation of Technological Support of Xinjiang
Uygur Autonomous Region (no. 201491185); and the Foundation of
Guangdong Second Provincial General Hospital (grant nos.
YY2014-002, YQ2015-004/005/012/016, 2016-011/013 and 2017001).
References
|
1
|
GBD 2013 Mortality and Causes of Death
Collaborators: Global, regional, and national levels of age-sex
specific all-cause and cause-specific mortality for 240 causes of
death, 1990–2013: A systematic analysis for the Global Burden of
Disease Study. Lancet. 385:117–171. 2015. View Article : Google Scholar : PubMed/NCBI
|
|
2
|
Landgren O, Kyle RA, Pfeiffer RM, Katzmann
JA, Caporaso NE, Hayes RB, Dispenzieri A, Kumar S, Clark RJ, Baris
D, et al: Monoclonal gammopathy of undetermined significance (MGUS)
consistently precedes multiple myeloma: A prospective study. Blood.
113:5412–5417. 2009. View Article : Google Scholar : PubMed/NCBI
|
|
3
|
Berenson JR, Matous J, Swift RA, Mapes R,
Morrison B and Yeh HS: A phase I/II study of arsenic
trioxide/bortezomib/ascorbic acid combination therapy for the
treatment of relapsed or refractory multiple myeloma. Clin Cancer
Res. 13:1762–1768. 2007. View Article : Google Scholar : PubMed/NCBI
|
|
4
|
Agarwal A and Ghobrial IM: Monoclonal
gammopathy of undetermined significance and smoldering multiple
myeloma: A review of the current understanding of epidemiology,
biology, risk stratification, and management of myeloma precursor
disease. Clin Cancer Res. 19:985–994. 2013. View Article : Google Scholar : PubMed/NCBI
|
|
5
|
Landgren O: Monoclonal gammopathy of
undetermined significance and smoldering multiple myeloma:
Biological insights and early treatment strategies. Hematology Am
Soc Hematol Educ Program. 2013:478–487. 2013.PubMed/NCBI
|
|
6
|
Kubiczkova L, Kryukov F, Slaby O,
Dementyeva E, Jarkovsky J, Nekvindova J, Radova L, Greslikova H,
Kuglik P, Vetesnikova E, et al: Circulating serum microRNAs as
novel diagnostic and prognostic biomarkers for multiple myeloma and
monoclonal gammopathy of undetermined significance. Haematologica.
99:511–518. 2014. View Article : Google Scholar : PubMed/NCBI
|
|
7
|
Shvartsur A, Chatterjee D, Chen H,
Berenson J, Garban H and Bonavida B: A bioinformatics approach
revealed a differential expression of RKIP-related genes in
pre-multiple myeloma and multiple myeloma: Clinical implications.
Blood. 126:53092015.
|
|
8
|
Amend S, Liang C, Serie D, Vachon CM, Lu
L, Vij R, Colditz GA, Weilbaecher KN and Tomasson MH: Deletion of
samsn1 underlies genetic susceptibility to Monoclonal Gammopathy of
undetermined significance (MGUS) in mice. Blood. 122:3972013.
|
|
9
|
Kuehl WM and Bergsagel PL: Molecular
pathogenesis of multiple myeloma and its premalignant precursor. J
Clin Invest. 122:3456–3463. 2012. View
Article : Google Scholar : PubMed/NCBI
|
|
10
|
Bergsagel PL, Kuehl WM, Zhan F, Sawyer J,
Barlogie B and Jr SJ: Cyclin D dysregulation: An early and unifying
pathogenic event in multiple myeloma. Blood. 106:296–303. 2005.
View Article : Google Scholar : PubMed/NCBI
|
|
11
|
Annunziata CM, Davis RE, Demchenko Y,
Bellamy W, Gabrea A, Zhan F, Lenz G, Hanamura I, Wright G, Xiao W,
et al: Frequent engagement of the classical and alternative
NF-kappaB pathways by diverse genetic abnormalities in multiple
myeloma. Cancer Cell. 12:115–130. 2007. View Article : Google Scholar : PubMed/NCBI
|
|
12
|
McNee G, Eales KL, Wei W, Williams DS,
Barkhuizen A, Bartlett DB, Essex S, Anandram S, Filer A, Moss PA,
et al: Citrullination of histone H3 drives IL-6 production by bone
marrow mesenchymal stem cells in MGUS and multiple myeloma.
Leukemia. 31:373–381. 2017. View Article : Google Scholar : PubMed/NCBI
|
|
13
|
Clough E and Barrett T: The gene
expression omnibus database. Methods Mol Biol. 1418:93–110. 2016.
View Article : Google Scholar : PubMed/NCBI
|
|
14
|
MacDonald JW: Huex10sttranscriptcluster.
db: Affymetrix huex10 annotation data (chip
huex10sttranscriptcluster). R package. version 8.2.0. 2017.
|
|
15
|
Gentleman R: Annotate: Annotation for
microarrays. R package. version 1.54.0. 2017.
|
|
16
|
R Development Core Team: R: A language and
environment for statistical computingR Foundation for Statistical
Computing. Vienna, Austria: 2017
|
|
17
|
Smyth GK; Gentleman R, Carey V, Dudoit S,
Irizarry R and Huber W: Limma: Linear models for microarray
dataBioinformatics and Computational Biology Solutions Using R and
Bioconductor. Springer; New York: pp. 397–420. 2005, View Article : Google Scholar
|
|
18
|
Chen H and Boutros PC: VennDiagram: A
package for the generation of highly-customizable Venn and Euler
diagrams in R. Bmc Bioinformatics. 12:352011. View Article : Google Scholar : PubMed/NCBI
|
|
19
|
Kanehisa M, Goto S, Sato Y, Furumichi M
and Tanabe M: KEGG for Integration and Interpretation of
large-scale molecular data sets. Nucleic Acids Res. 40:(Database
issue). D109–D114. 2012. View Article : Google Scholar : PubMed/NCBI
|
|
20
|
Dennis G, Sherman BT, Hosack DA, Yang J,
Gao W, Lane HC and Lempicki RA: DAVID: Database for annotation,
visualization, and integrated discovery. Genome Biol. 4:P32003.
View Article : Google Scholar : PubMed/NCBI
|
|
21
|
Jensen LJ, Kuhn M, Stark M, Chaffron S,
Creevey C, Muller J, Doerks T, Julien P, Roth A, Simonovic M, et
al: STRING 8-a global view on proteins and their functional
interactions in 630 organisms. Nucleic Acids Res. 37:(Database
issue). D412–D416. 2009. View Article : Google Scholar : PubMed/NCBI
|
|
22
|
Tang Y, Li M, Wang J, Pan Y and Wu FX:
CytoNCA: A cytoscape plugin for centrality analysis and evaluation
of protein interaction networks. Biosystems. 127:67–72. 2015.
View Article : Google Scholar : PubMed/NCBI
|
|
23
|
Goh KI, Oh E, Kahng B and Kim D:
Betweenness centrality correlation in social networks. Phys Rev E
Stat Nonlin Soft Matter Phys. 67:0171012003. View Article : Google Scholar : PubMed/NCBI
|
|
24
|
Du Y, Gao C, Chen X, Hu Y, Sadiq R and
Deng Y: A new closeness centrality measure via effective distance
in complex networks. Chaos. 25:0331122015. View Article : Google Scholar : PubMed/NCBI
|
|
25
|
Estrada E and Rodríguezvelázquez JA:
Subgraph centrality in complex networks. Phys Rev E Stat Nonlin
Soft Matter Phys. 71:0561032005. View Article : Google Scholar : PubMed/NCBI
|
|
26
|
Liang M, Zhang F, Jin G and Zhu J:
FastGCN: A GPU accelerated tool for fast gene co-expression
networks. PloS One. 10:e01167762015. View Article : Google Scholar : PubMed/NCBI
|
|
27
|
Jiang Q, Wang Y, Hao Y, Juan L, Teng M,
Zhang X, Li M, Wang G and Liu Y: miR2Disease: A manually curated
database for microRNA deregulation in human disease. Nucleic Acids
Res. 37:(Suppl 1). D98–D104. 2009. View Article : Google Scholar : PubMed/NCBI
|
|
28
|
Dweep H and Gretz N: miRWalk2.0: A
comprehensive atlas of microRNA-target interactions. Nat Methods.
12:6972015. View Article : Google Scholar : PubMed/NCBI
|
|
29
|
Weiss BM, Abadie J, Verma P, Howard RS and
Kuehl WM: A monoclonal gammopathy precedes multiple myeloma in most
patients. Blood. 113:5418–5422. 2009. View Article : Google Scholar : PubMed/NCBI
|
|
30
|
Spendlove I, Ramage JM, Bradley R, Harris
C and Durrant LG: Complement decay accelerating factor (DAF)/CD55
in cancer. Cancer Immunol Immunother. 55:987–995. 2006. View Article : Google Scholar : PubMed/NCBI
|
|
31
|
Matsushita M, Thiel S, Jensenius JC, Terai
I and Fujita T: Proteolytic activities of two types of
mannose-binding lectin-associated serine protease. J Immunol.
165:2637–2642. 2000. View Article : Google Scholar : PubMed/NCBI
|
|
32
|
Markiewski MM, Nilsson B, Ekdahl KN,
Mollnes TE and Lambris JD: Complement and coagulation: Strangers or
partners in crime? Trends Immunol. 28:184–192. 2007. View Article : Google Scholar : PubMed/NCBI
|
|
33
|
Crowely MP, Quinn S, Coleman E, Eustace
JA, Gilligan OM and O'Shea SI: Differing coagulation profiles of
patients with monoclonal gammopathy of undetermined significance
and multiple myeloma. J Thromb Thrombolysis. 39:245–249. 2015.
View Article : Google Scholar : PubMed/NCBI
|
|
34
|
De Stefano V, Za T and Rossi E: Venous
thromboembolism in multiple myeloma. Semin Thromb Hemost.
40:338–347. 2014. View Article : Google Scholar : PubMed/NCBI
|
|
35
|
Kaelin WG Jr and Ratcliffe PJ: Oxygen
sensing by metazoans: The central role of the HIF hydroxylase
pathway. Mol Cell. 30:393–402. 2008. View Article : Google Scholar : PubMed/NCBI
|
|
36
|
Martin SK, Diamond P, Gronthos S, Peet DJ
and Zannettino AC: The emerging role of hypoxia, HIF-1 and HIF-2 in
multiple myeloma. Leukemia. 25:1533–1542. 2011. View Article : Google Scholar : PubMed/NCBI
|
|
37
|
Asosingh K, De Raeve H, de Ridder M,
Storme GA, Willems A, Van Riet I, Van Camp B and Vanderkerken K:
Role of the hypoxic bone marrow microenvironment in 5T2 MM murine
myeloma tumor progression. Haematologica. 90:810–817.
2005.PubMed/NCBI
|
|
38
|
Azab AK, Hu J, Quang P, Azab F,
Pitsillides C, Awwad R, Thompson B, Maiso P, Sun JD, Hart CP, et
al: Hypoxia promotes dissemination of multiple myeloma through
acquisition of epithelial to mesenchymal transition-like features.
Blood. 119:5782–5794. 2012. View Article : Google Scholar : PubMed/NCBI
|
|
39
|
Hu Y, Kirito K, Yoshida K, Mitsumori T,
Nakajima K, Nozaki Y, Hamanaka S, Nagashima T, Kunitama M, Sakoe K
and Komatsu N: Inhibition of hypoxia-inducible factor-1 function
enhances the sensitivity of multiple myeloma cells to melphalan.
Mol Cancer Ther. 8:2329–2338. 2009. View Article : Google Scholar : PubMed/NCBI
|
|
40
|
Lee C, Oh JI, Park J, Choi JH, Bae EK, Lee
HJ, Jung WJ, Lee DS, Ahn KS and Yoon SS: TNF α mediated IL-6
secretion is regulated by JAK/STAT pathway but Not by MEK
phosphorylation and AKT phosphorylation in U266 multiple myeloma
cells. Biomed Res Int. 2013:5801352013. View Article : Google Scholar : PubMed/NCBI
|
|
41
|
Mitsiades CS, Mitsiades N, Poulaki V,
Schlossman R, Akiyama M, Chauhan D, Hideshima T, Treon SP, Munshi
NC, Richardson PG and Anderson KC: Activation of NF-kappaB and
upregulation of intracellular anti-apoptotic proteins via the
IGF-1/Akt signaling in human multiple myeloma cells: Therapeutic
implications. Oncogene. 21:5673–5683. 2002. View Article : Google Scholar : PubMed/NCBI
|
|
42
|
Elton TS, Oparil S, Taylor GR, Hicks PH,
Yang RH, Jin H and Chen YF: Normobaric hypoxia stimulates
endothelin-1 gene expression in the rat. Am J Physiol.
263:R1260–1264. 1992.PubMed/NCBI
|