Introduction
Cholangiocarcinoma (CCA) develops in the biliary
epithelial cells and varies in prevalence geographically with the
highest incidence rates in southeast Asia (1). The incidence of intrahepatic CCA in the
year 2012 was highest in northeastern Thailand, particularly in
Khon Kaen (44.3/100,000 males and 17.6/100,000 females) (2) where its occurrence was associated with
the high prevalence of carcinogenic liver fluke, Opisthorchis
viverrini, infection (3,4).
Primary bile acids, which are synthesized in the
liver, are converted into secondary and tertiary bile acids by
intestinal bacterial flora. These three types of bile acid have
varying functions during carcinogenesis (5). A decrease in the ratio of
glycine-conjugated bile acids and taurine-conjugated bile acids has
been observed in patients with CCA (6). During the development of CCA,
deoxycholic acid (DCA) activates epidermal growth factor receptor,
which has been demonstrated to stimulate pro-survival and
pro-proliferative signaling pathways, including the
phosphoinositide 3-kinase signaling pathway, via complex underlying
mechanisms (7). By contrast,
tauroursodeoxycholate inhibits human CCA tumor growth via calcium
protein kinase Cα and the mitogen activated protein
kinase-dependent signaling pathways (8).
Due to the variation in the physicochemical
properties of bile acids, including lipophilicity and polarity, the
complete and accurate separation and identification of these acids
requires the use of advanced chromatographic techniques (9,10). Serum
bile acid profiling may provide novel markers and allow early-stage
diagnosis of CCA in at risk populations, including those with a
high prevalence of Opisthorchis viverrini infection. The
present study aimed to compare the bile acid composition patterns
between patients with CCA, benign biliary disease (BBD) and normal
controls using high performance liquid chromatography (HPLC).
Materials and methods
Patient selection
Serum samples obtained from 10 patients with CCA,
(age, 48–75 years; 6 males and 4 females) and 9 patients with BBD
(age, 54–88 years; 8 males and 1 female) were selected from
registered patients at The Liver Fluke and Cholangiocarcinoma
Research Center, Srinagarind Hospital, Faculty of Medicine, Khon
Kaen University (Khon Kaen, Thailand). The sample was collected
from the patient prior to surgery. Sera were also obtained from 8
healthy controls, who received health check-ups at the office of
The Medical Technology and Physical Therapy Health Service, Faculty
of Associated Medical Sciences, Khon Kaen University. All serum
samples were collected from January 2006 to March 2013 for the
retrospective study.
The present study was approved by the Ethics
Committee for Human Research (approval no. HE561280), Khon Kaen
University (Khon Kaen, Thailand).
Total serum bile acid (TSBA)
evaluation
TSBA levels in 3 µl serum samples were determined
using the Total Bile Acids assay kit (Diazyme Laboratories, Poway,
CA, USA), following the enzyme cycling method as described in the
manufacturer's protocol. This analysis was performed using the
Beckman Synchron CX4 Clinical Chemistry Analyzer (Beckman Coulter,
Inc., Brea, CA, USA) and the results were presented as µmol/l.
Bile acid standards
Bile acid standards were as follows: Primary bile
acid [cholic acid; chenodeoxycholic acid (CDCA)]; secondary bile
acid [DCA; lithocholic acid (LCA)]; tertiary bile acid
[ursodeoxycholic acid (UDCA)]. In addition, conjugated bile acid
standards with taurine [taurocholic acid (TCA); taurodeoxycholic
acid] or glycine [glycocholic acid (GCA); glycodeoxycholic acid]
were used. All bile acid standards gallic acid were purchased from
Sigma-Aldrich (Merck KGaA, Darmstadt, Germany). Gallic acid was
used as the internal standard for HPLC analysis of all bile acids
in the serum samples, with the exception of the standard
compounds.
Solid phase extraction of bile
acids
Bile acids were extracted using the solid phase
extraction method previously described by Humbert et al
(11) and Steiner et al
(12) with minor modifications. A
total of 100 µl of each serum sample was mixed with 100 µl 0.4 M
ammonium carbonate buffer (pH 9.3) and 700 µl deionized water. The
serum samples were incubated at 60°C for 30 min and centrifuged at
4,000 × g for 15 min at room temperature. For the solid phase
extraction, 50 mg Sep-Pak C18 Vac cartridges (Waters Corporation,
Milford, MA, USA) were activated by pre-washing with 2 ml 100%
methanol, 2 ml deionized water and 2 ml 0.1 M ammonium carbonate
buffer (pH 9.3). Subsequently, the supernatant from the centrifuged
serum tube was loaded onto the cartridge. The cartridge was washed
once with 2 ml deionized water, and the bound bile acids were
eluted in 3 ml methanol. The methanol fraction was collected and
dried under a nitrogen stream at 50°C.
HPLC analysis
Gallic acid solution was prepared by mixing equal
volumes of 1.25 mM gallic acid in methanol and 0.03 M ammonium
acetate buffer (pH 3.5). A 100 µl gallic acid solution was used to
dissolve the dried serum samples. The solutions were subsequently
mixed and centrifuged at 13,400 × g for 10 min at 10°C. The
supernatant was collected and passed through nylon syringe filters
(pore size, 0.22 µm; diameter, 13 mm; Bonna-Agela Technologies,
Inc., Wilmington, DE, USA). A total of 20 µl of each filtered serum
sample was injected into the HPLC system (reverse phase
chromatography), which consisted of a Spherisorb® ODS2 80 Å column
(5 µm; 4.6×250 mm; Waters Corporation), an HPLC pump (model 515;
Waters Corporation) and an evaporative light scattering detector
(model 2424; Waters Corporation). Chromatographic separation was
performed with gradient elution at a flow rate of 1.0 ml/min at
room temperature. The first mobile phase was absolute methanol and
the second was 0.03 M ammonium acetate buffer (pH 3.5). The mobile
phase gradient elutions were programmed at the following time
points: 0, 35, 45, 45.5 and 55 min. The percentages of mobile phase
1 and phase 2 were 60:40, 100:0, 100:0, 60:40 and 60:40% at each
time point, respectively. For all the experiments, evaporative
light scattering detector parameters were set as follows: Gain at
2, gas pressure at 25 psi, nebulizer temperature at 30°C and drift
tube temperature at 80°C.
HPLC interpretation
To elucidate the bile acid composition patterns in
each group, HPLC chromatograms were interpreted using two steps.
The retention time of each peak, obtained from the serum samples,
was compared with the synthetic bile acid standards. The peaks with
a retention time equal to the standards were considered to be the
corresponding bile acid compound. Subsequently, the retention times
of peaks that were not associated with the standards, were
calculated as the percentage of relative migration by comparison
with the longest retention time of the standards.
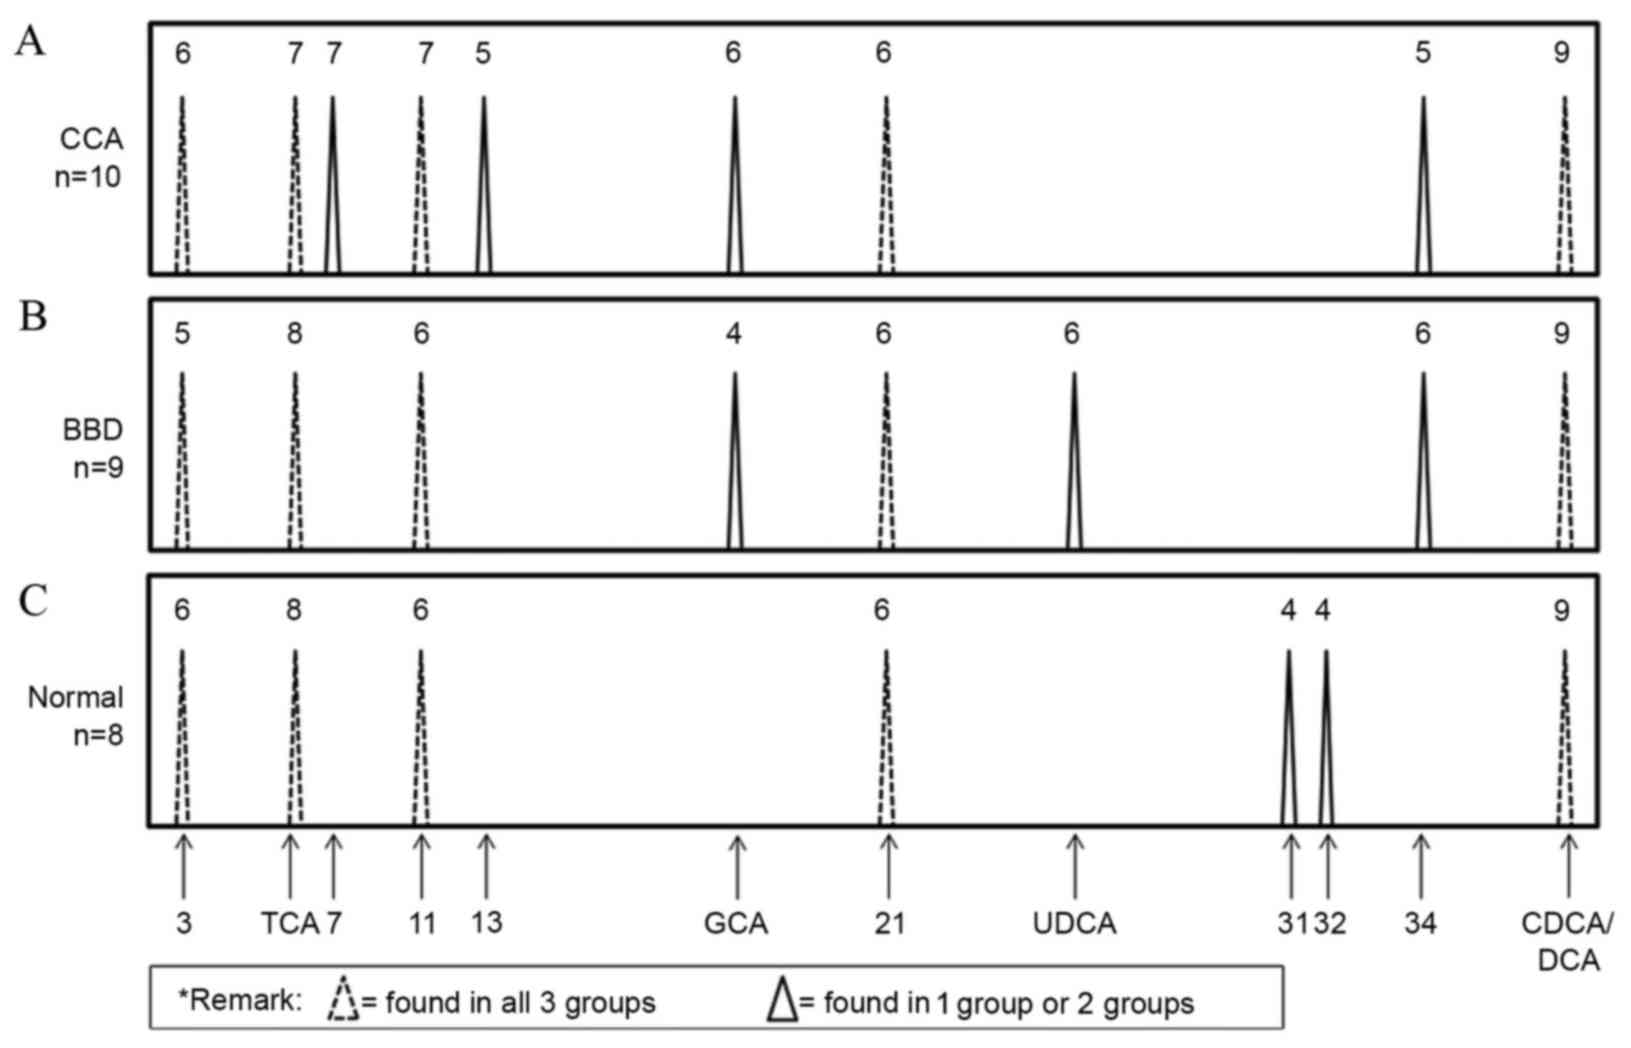
The bile acid composition patterns were generated
using the following criteria: Any peak with a retention time equal
to the corresponding bile acid standard, or any relative retention
time that identified at ≥5/10 (50%) cases in the CCA group, 5/9
(55%) cases in the BBD group and at ≥4/8 (50%) cases in the normal
group, was plotted on the time line axis. Each time point was
assigned a cardinal number to allow comparison of the bile acid
composition pattern of individual patients in each group. The
presence or absence of the assigned number among CCA, BBD and
normal control groups was further analyzed to produce a model flow
chart to aid differential diagnosis between the three groups.
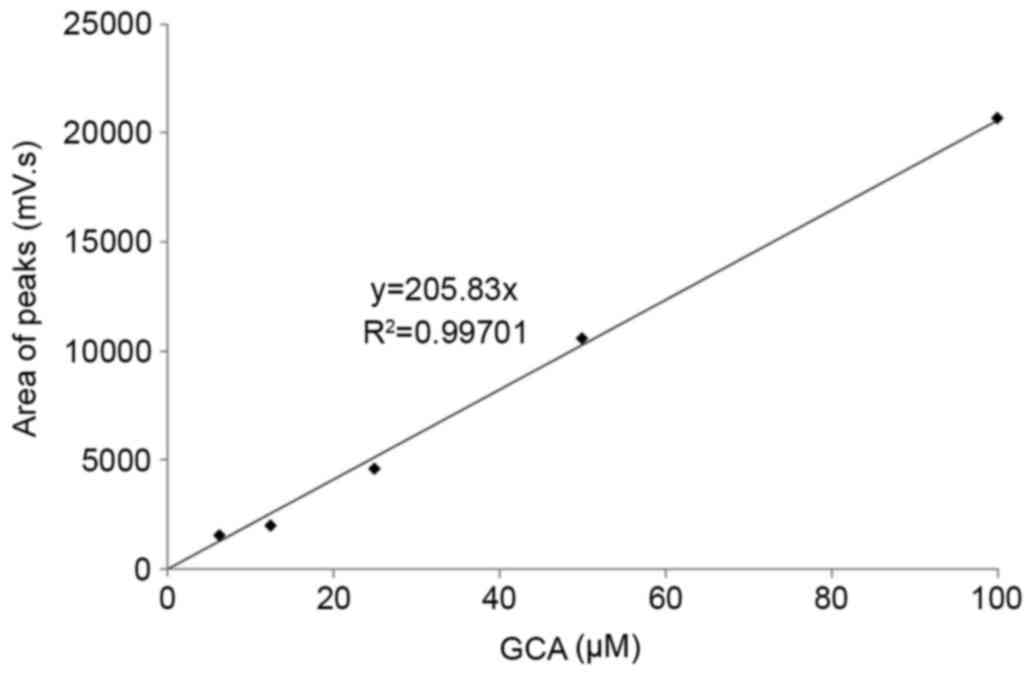
GCA standard curve
The GCA standard curve was prepared by plotting the
coordinates of the concentrations of GCA on the x-axis, and the
areas under the curve obtained from HPLC peaks on the y-axis
(Fig. 1). The standard curve was
produced from the linear regression equation y=205.83×, and the
correlation coefficient (r2) was 0.997 by using
Microsoft Excel 2010 software (Microsoft Corporation, Redmond, WA,
USA). Concentrations of GCA in the serum samples were calculated
using the standard curve. The concentrations of TSBA and GCA, and
the ratio of GCA to TSBA, were subsequently compared between the
CCA and BBD groups. The GraphPad Prism software (version 5.0;
GraphPad Software Inc., CA, USA) was used for statistical analyses.
The different values between the two independent sample groups were
analyzed using Mann-Whitney U test. P<0.05 was considered to
indicate a statistically significant difference.
Results
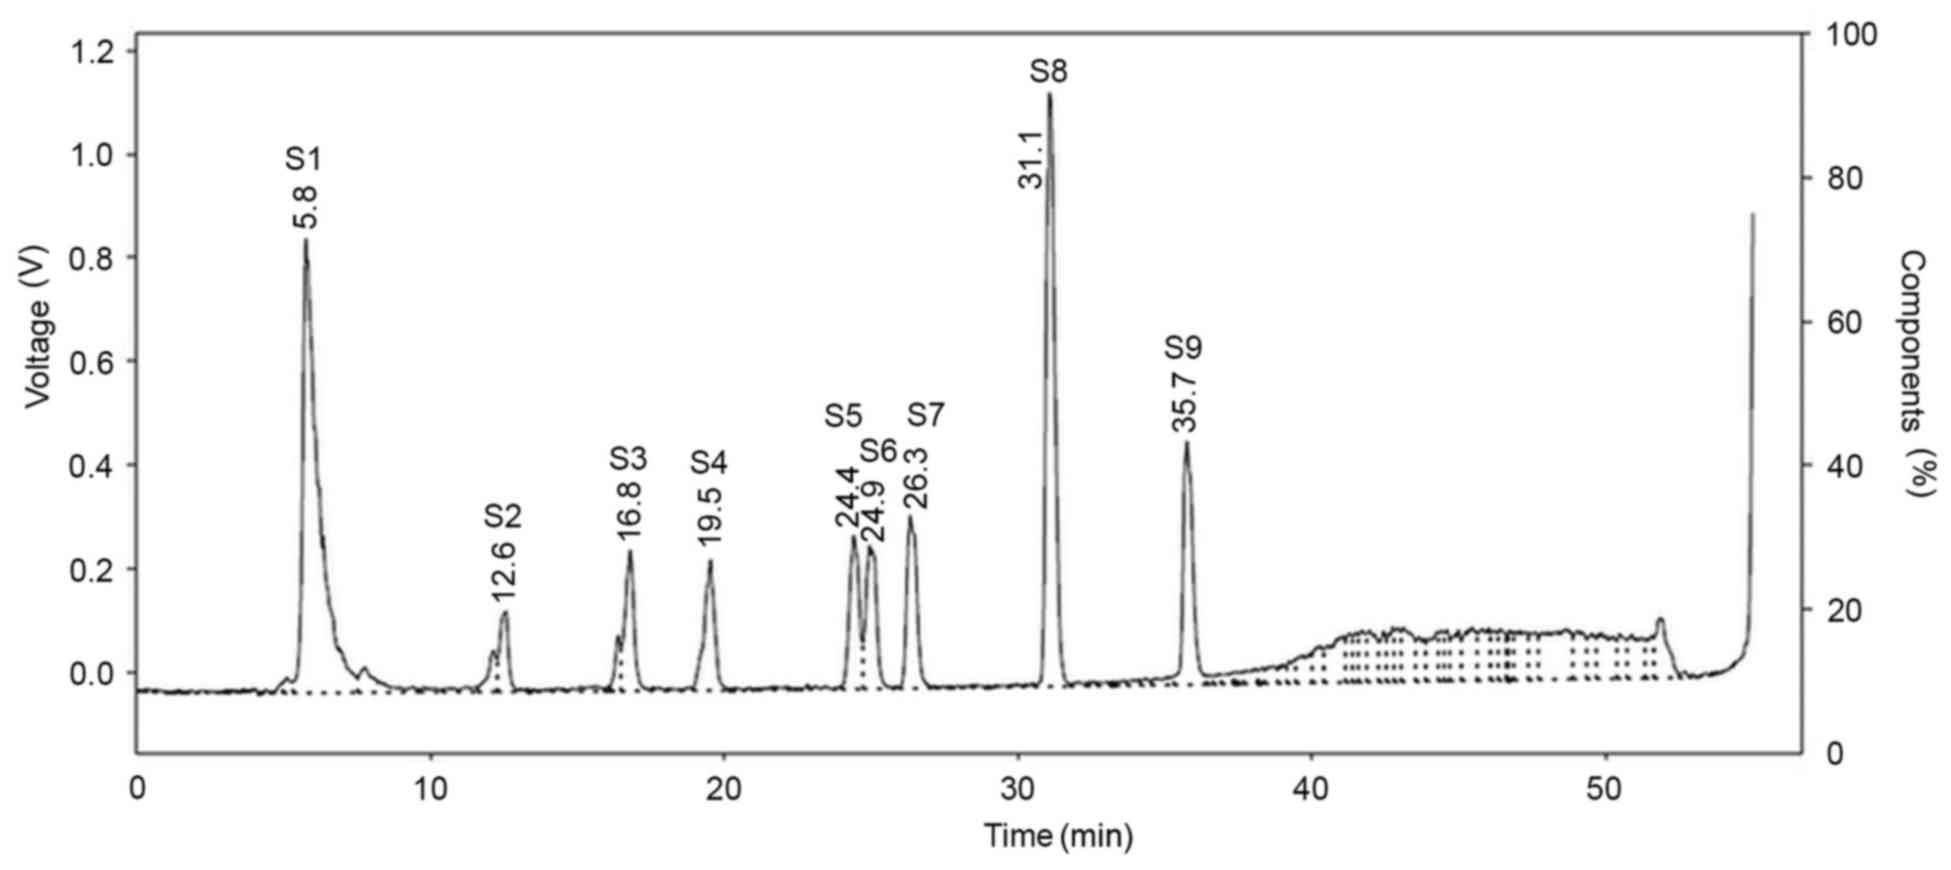
HPLC chromatogram of bile acid
standards
The HPLC chromatograms of nine bile acid standards
and gallic acid as an internal control are presented in Fig. 2, with retention times summarized in
Table I. Although 10 standard bile
acids were analyzed using HPLC, only 9 overall peaks were observed
on the chromatogram, as CDCA and DCA were not able to be separated
and were co-eluted due to having the same retention time (31.1
min).
 | Table I.Retention times of bile acid standards
as detected by high-performance liquid chromatography. |
Table I.
Retention times of bile acid standards
as detected by high-performance liquid chromatography.
| No. | Bile acid
standard | Retention time,
min |
|---|
| S1 | Gallic acid | 5.8 |
| S2 | TCA | 12.6 |
| S3 | TDCA | 16.8 |
| S4 | GCA | 19.5 |
| S5 | GDCA | 24.4 |
| S6 | UDCA | 24.9 |
| S7 | CA | 26.3 |
| S8 | CDCA/DCA | 31.1 |
| S9 | LCA | 35.7 |
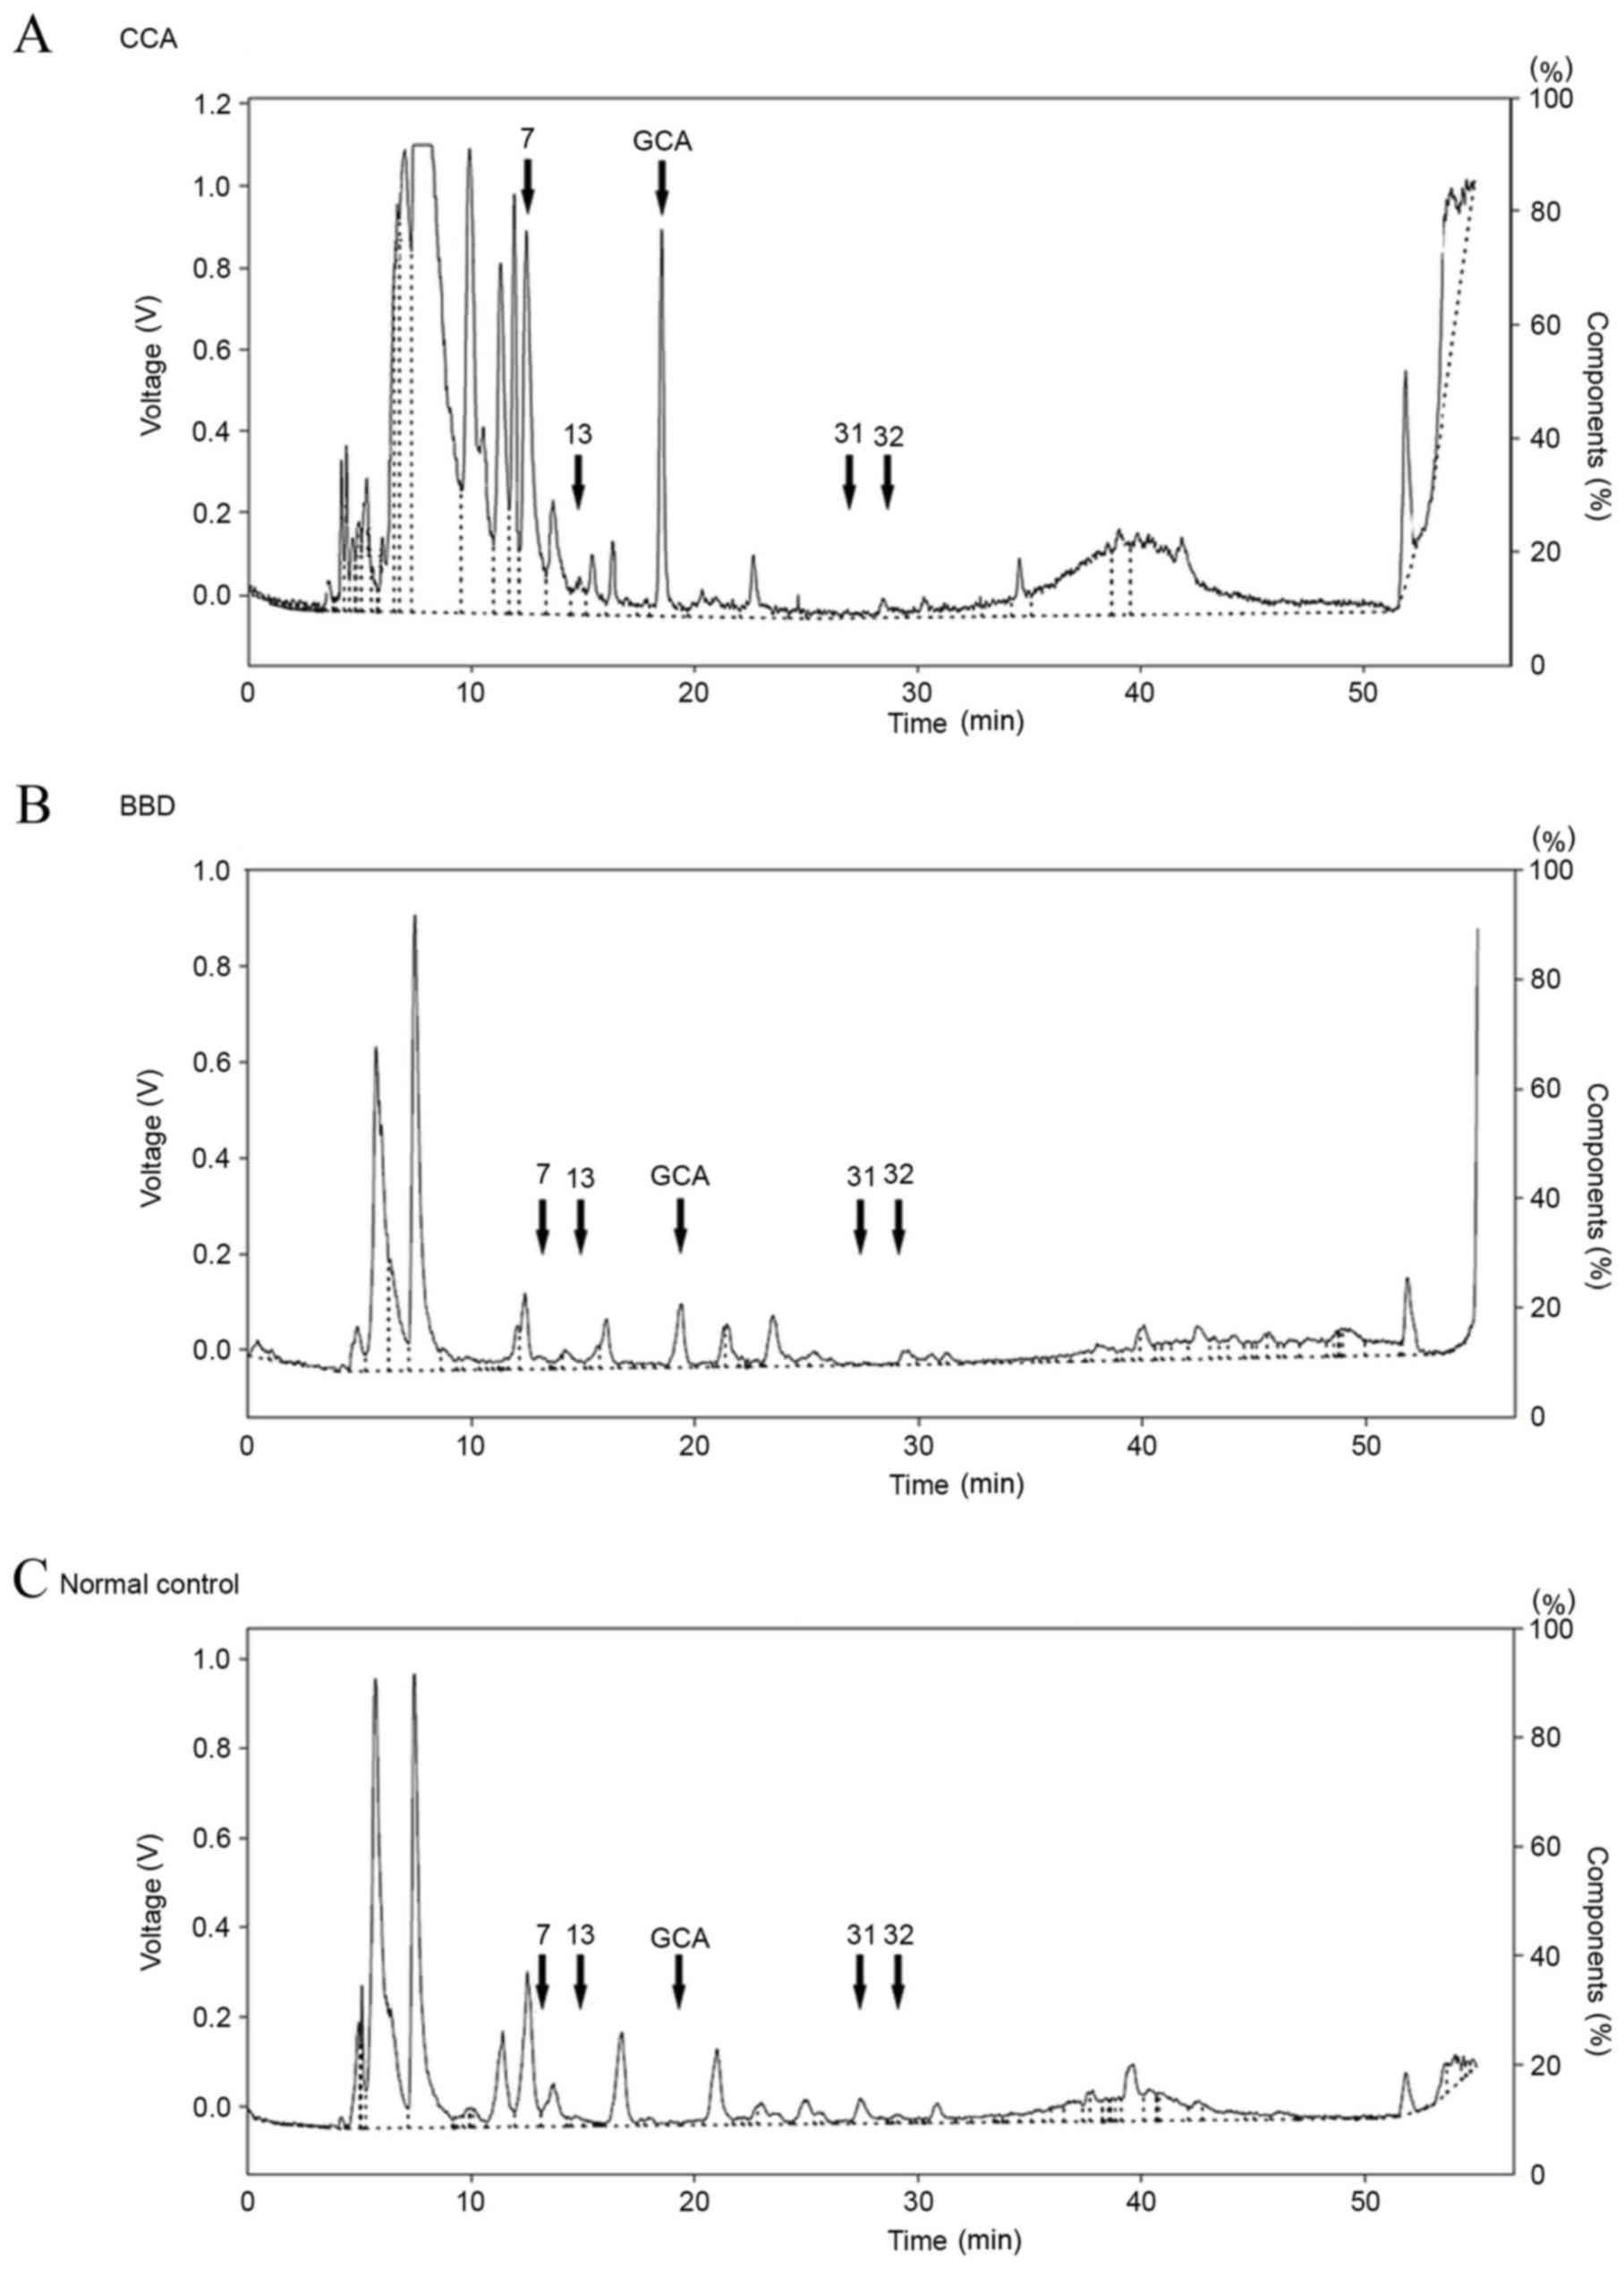
HPLC chromatogram of serum
samples
The representative HPLC profiles of bile acids in
the sera of patients with CCA and BBD, as well as normal control
groups, are presented in Fig. 3. A
total of 34 peaks were identified, including 9 peaks corresponding
to the standard bile acids, in the HPLC profiles of all the serum
samples. These were assigned peak numbers 1–34. Subsequently, the
bile acid composition patterns of the CCA, BBD and normal control
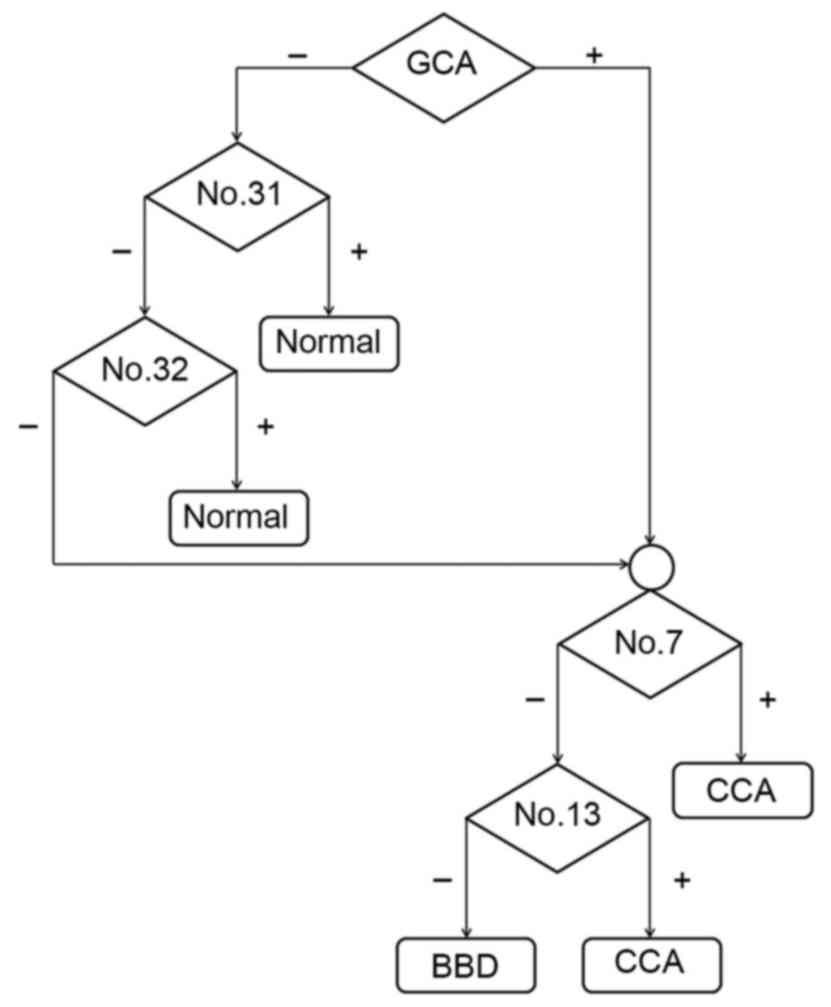
groups were examined. As presented in Fig. 4, GCA and three unknown peaks (nos. 7,
13 and 34) were identified in the CCA group. In addition, GCA, UDCA
and one unknown peak (no. 34) were identified in the BBD group.
Notably, GCA and unknown peak no. 34 were found in the CCA and BBD
groups but not in the control group. Two unknown peaks (nos. 31 and
32) were unique to the control group. As the GCA peak was distinct
in the CCA and BBD patient groups, but not in the control group,
GCA was selected to distinguish between the disease groups and the
normal group at the first stage. A flow chart (Fig. 5) was produced using these results in
order to provide a diagnostic guideline. Based on this, the
diagnostic values of the bile acid pattern analysis were 70, 78 and
100% for the CCA, BBD and normal patient groups, respectively.
GCA quantification
As aforementioned, the GCA peak was observed in the
CCA and BBD groups, but not in normal controls. Therefore, the GCA
peak was selected to quantify the serum GCA levels using the
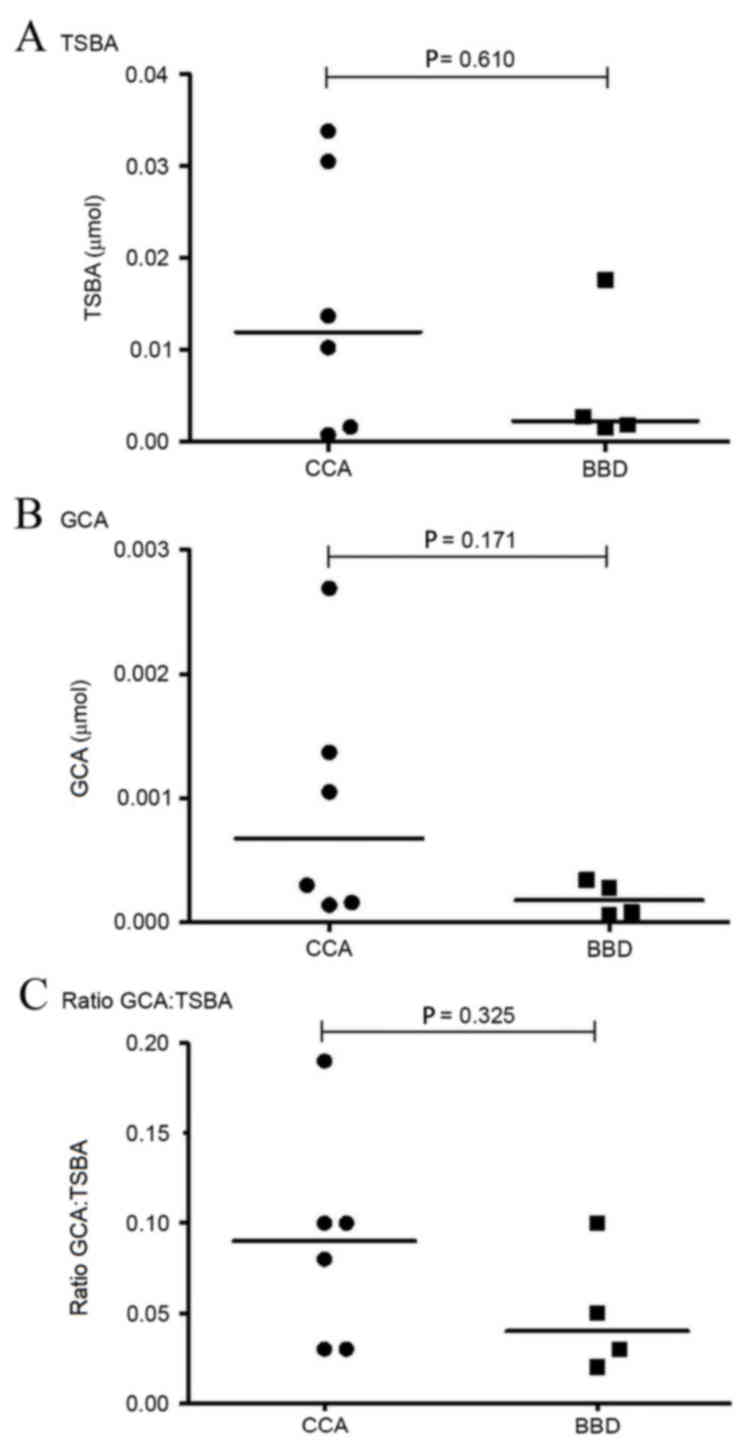
standard curve (Fig. 1). A comparison
of the levels of TSBA and GCA, and of the GCA:TSBA ratio, between
the CCA and BBD groups is presented in Fig. 6. TSBA and GCA levels in the CCA group
were revealed to be higher than those observed in the BBD group
(Fig. 6A and B). The ratio of
GCA:TSBA presented in Fig. 6C is also
higher in the CCA group, as compared with the BBD group.
Discussion
Through the use of HPLC separation, GCA was detected
in the sera of patients with CCA and BBD, but not in the control
group. Furthermore, while statistically significant differences
were not observed (P=0.171), the GCA levels in the CCA group tended
to be higher, compared with those of the BBD group. These results
were concordant with Changbumrung et al (6), in that TSBA and the levels of conjugated
bile acids, including GCA, glycochenodeoxycholic acid (GCDCA), TCA
and taurochenodeoxycholic acid (TCDCA) in the sera of patients with
CCA and hepatocellular carcinoma (HCC) were higher, compared with
those observed in healthy controls. In addition to CCA and HCC, GCA
and other bile acids exhibit elevated levels in the sera of
patients with various hepatobiliary diseases (hepatitis virus
infection, alcoholic liver disease, primary biliary cirrhosis,
biliary tract stones and primary sclerosing cholangitis), and
demonstrate variable bile acid composition patterns (12,13).
Patients receiving UDCA as a treatment for biliary tract diseases
exhibit high levels of GCA, TCA, GCDCA and TCDCA levels (13). Furthermore, high levels of GCA, TCA
and GCDCA have been observed in patients with alcoholic liver
disease, whereas patients with non-alcoholic fatty liver disease
exhibit high levels of CA, GCA and GCDCA (13). In addition, a previous study
demonstrated that GCA expression is upregulated in the urine
samples of patients with liver cancer (14).
HPLC is a convenient and reliable technique for
routine bile acid composition analysis (15). Serum bile acid profiles of healthy
subjects and patients with various hepatobiliary diseases exhibit
variation in the composition of conjugated bile acids (15). In the current study, serum bile acid
profiles varied between patients with CCA, BBD and healthy
subjects, with unknown peaks (nos. 7 and 13) observed in the sera
of patients with CCA but not BBD. As the unique peaks identified in
sera from patients with CCA did not correspond to the bile acid
standards, their chemical composition requires further elucidation.
In addition, the UDCA peak was only observed in the sera of
patients with BBD. This may be due to the therapeutic agents used
for BBD, as UDCA is frequently used to treat chronic cholestatic
diseases (16,17).
In conclusion, determination of the bile acid
composition patterns in patient serum samples using HPLC may aid
the diagnosis of CCA, and GCA may provide a novel marker for this
disease. Further metabolomics and investigation of the mechanisms
underlying the involvement of GCA in the pathophysiology of CCA and
carcinogenesis of the bile duct are required. In order to provide a
comprehensive evaluation of the diagnostic potential of bile acid
composition profiles and GCA levels, large-scale studies are
required.
Acknowledgements
The authors of the present study would like to thank
The Centre for Research and Development of Medical Diagnostic
Laboratories, Faculty of Associated Medical Sciences, Khon Kaen
University (Khon Kaen, Thailand) for providing technical support
with the instruments used in the present study. The authors would
also like to thank The Liver Flukes and Cholangiocarcinoma Research
Center, Faculty of Medicine, Khon Kaen University for providing
sera samples from patients with CCA. In addition, the authors would
like to thank Miss Roongpet Tangrassameeprasert (Department of
Biochemistry, Faculty of Medicine, Khon Kaen University) for
technical support with the HPLC analyses and Professor Yukifumi
Nawa Academic Affairs, Faculty of Medicine, Khon Kaen University
for manuscript editing. The present study was supported by the
Publication Clinic of Research Affairs, Khon Kaen University.
References
|
1
|
Blechacz BR and Gores GJ:
Cholangiocarcinoma. Clin Liver Dis. 12:131–150, ix. 2008.
View Article : Google Scholar : PubMed/NCBI
|
|
2
|
Wiangnon S, Suwanrungruang K and Kamsa-Ard
S: Cholangiocarcinoma in Khon Kaen Province. Srinagarind Med J. 27
suppl:(Cholangiocarcinoma). S326–S330. 2012.
|
|
3
|
Sripa B, Bethony JM, Sithithaworn P,
Kaewkes S, Mairiang E, Loukas A, Mulvenna J, Laha T, Hotez PJ and
Brindley PJ: Opisthorchiasis and Opisthorchis-associated
cholangiocarcinoma in Thailand and Laos. Acta Trop. 120 Suppl
1:S158–S168. 2011. View Article : Google Scholar : PubMed/NCBI
|
|
4
|
Sripa B, Kaewkes S, Sithithaworn P,
Mairiang E, Laha T, Smout M, Pairojkul C, Bhudhisawasdi V, Tesana
S, Thinkamrop B, et al: Liver fluke induces cholangiocarcinoma.
PLoS Med. 4:e2012007. View Article : Google Scholar : PubMed/NCBI
|
|
5
|
Debruyne PR, Bruyneel EA, Li X, Zimber A,
Gespach C and Mareel MM: The role of bile acids in carcinogenesis.
Mutat Res 480–481. 1–369. 2001.
|
|
6
|
Changbumrung S, Tungtrongchitr R, Migasena
P and Chamroenngan S: Serum unconjugated primary and secondary bile
acids in patients with cholangiocarcinoma and hepatocellular
carcinoma. J Med Assoc Thai. 73:81–90. 1990.PubMed/NCBI
|
|
7
|
Werneburg NW, Yoon JH, Higuchi H and Gores
GJ: Bile acids activate EGF receptor via a TGF-alpha-dependent
mechanism in human cholangiocyte cell lines. Am J Physiol
Gastrointest Liver Physiol. 285:G31–G36. 2003. View Article : Google Scholar : PubMed/NCBI
|
|
8
|
Alpini G, Kanno N, Phinizy JL, Glaser S,
Francis H, Taffetani S and LeSage G: Tauroursodeoxycholate inhibits
human cholangiocarcinoma growth via Ca2+−, PKC-, and MAPK-dependent
pathways. Am J Physiol Gastrointest Liver Physiol. 286:G973–G982.
2004. View Article : Google Scholar : PubMed/NCBI
|
|
9
|
Scalia S and Games DE: Determination of
free bile acids in pharmaceutical preparations by packed column
supercritical fluid chromatography. J Pharm Sci. 82:44–47. 1993.
View Article : Google Scholar : PubMed/NCBI
|
|
10
|
Roda A, Piazza F and Baraldini M:
Separation techniques for bile salts analysis. J Chromatogr B
Biomed Sci Appl. 717:263–278. 1998. View Article : Google Scholar : PubMed/NCBI
|
|
11
|
Humbert L, Maubert MA, Wolf C, Duboc H,
Mahé M, Farabos D, Seksik P, Mallet JM, Trugnan G, Masliah J and
Rainteau D: Bile acid profiling in human biological samples:
Comparison of extraction procedures and application to normal and
cholestatic patients. J Chromatogr B Analyt Technol Biomed Life
Sci. 899:135–145. 2012. View Article : Google Scholar : PubMed/NCBI
|
|
12
|
Steiner C, von Eckardstein A and Rentsch
KM: Quantification of the 15 major human bile acids and their
precursor 7α-hydroxy-4-cholesten-3-one in serum by liquid
chromatography-tandem mass spectrometry. J Chromatogr B Analyt
Technol Biomed Life Sci. 878:2870–2880. 2010. View Article : Google Scholar : PubMed/NCBI
|
|
13
|
Sugita T, Amano K, Nakano M, Masubuchi N,
Sugihara M and Matsuura T: Analysis of the serum bile acid
composition for differential diagnosis in patients with liver
disease. Gastroenterol Res Pract. 2015:7174312015. View Article : Google Scholar : PubMed/NCBI
|
|
14
|
Zhang A, Sun H, Yan G, Han Y, Ye Y and
Wang X: Urinary metabolic profiling identifies a key role for
glycocholic acid in human liver cancer by ultra-performance
liquid-chromatography coupled with high-definition mass
spectrometry. Clin Chim Acta. 418:86–90. 2013. View Article : Google Scholar : PubMed/NCBI
|
|
15
|
Lee BL, New AL and Ong CN: Comparative
analysis of conjugated bile acids in human serum using
high-performance liquid chromatography and capillary
electrophoresis. J Chromatogr B Biomed Sci Appl. 704:35–42. 1997.
View Article : Google Scholar : PubMed/NCBI
|
|
16
|
Olsson R: Ursodeoxycholic acid in the
treatment of chronic cholestatic liver disease. Documented delay in
disease progress inspires hope. Lakartidningen. 99:1325–1330.
2002.(In Swedish).
|
|
17
|
Poupon R, Chazouillères O and Poupon RE:
Chronic cholestatic diseases. J Hepatol. 32 1 Suppl:S129–S140.
2000. View Article : Google Scholar
|