Introduction
Prostate cancer (PC) is the most prevalent
urological cancer and has become the leading cause of
cancer-related mortality among males in many countries. Patients
with PC are often treated via surgery, radiotherapy and androgen
deprivation therapy (1). Manipulation
of the immune system represents a promising approach to controlling
advanced and metastatic PC; examples of immunotherapeutic and
immunomodulatory agents include sipuleucel-T, ipilimumab,
tasquinimod, Prostvac®-VF, and GVAX (2,3). However,
despite these clinical advances, the underlying mechanisms are
complex and remain elusive, and therapies that provide long-term
survival are still required. Therefore, further studies are
necessary to increase understanding of the characteristics of the
immunological microenvironment. The identities, traits, functional
status, distribution, kinetics, and interactions of inflammatory
cells in the prostate and in PC must be fully characterized in
order to improve and combine the current promising immunotherapies
(4).
T cells serve a central role in the immunological
microenvironment. The T-cell receptor (TCR), a molecule found on
the surface of T cells, is responsible for recognizing fragments of
antigens in the form of peptides bound to major histocompatibility
complex (MHC) molecules (5). The
human adaptive immune system harbors a vast array of TCRs that
target a wide variety of pathogens, collectively referred to as the
TCR repertoire. Generally, each T cell encodes a single unique TCR
(5,6).
TCRs consist of two chains, most often an α and a β chain, and each
chain comprises a variable region (V region), consistent region (C
region), transmembrane domain and cytoplasmic domain. The V region
of the α and β chains contains three hypervariable
complementarity-determining regions (CDRs), namely CDR1, CDR2 and
CDR3, of which CDR3 is the most variable and directly determines
the antigen-binding specificity of the TCR. The structural
diversity of TCRs and their chains is generated by somatic random
recombination of V, diversity (D) and joining (J) gene segments,
including the contribution of non-germline, non-templated (N)
nucleotides, which are added in a manner independent of the
template at the V-(D)-J joints (7).
The number of distinct TCRs has been estimated to be
~2.5×10⁷ in a normal adult, making the repertoire
particularly difficult to analyze. Profiling the TCR repertoire by
next-generation sequencing (NGS) is a relatively new method of
analyzing the adaptive immune system response by elucidating the
relative abundance and diversity of T-cell clones, which makes
possible the study of TCR repertoire diversity and selection
mechanisms at a greater depth than in the past (8–10). More
recent study has focused on clone tracking, repertoire properties,
and the identification of public clones using TCR sequencing
technology (11,12). Common TCR ‘signatures’ raised against
specific antigens could provide important diagnostic biomarkers
(13).
In the present study, NGS was used to characterize
the complex alterations in the TCR β-chain repertoire between
paired sequential samples from cancer tissues and paracancer
tissues. The CDRs of TCRs were subjected to amplification by
multiplex-PCR followed by NGS to explore the different TCR
repertoires between the cancer and paracancer tissues, with
millions of TCR reads obtained for each sample. Such large-scale
sequencing of the TCR repertoire in PC may reform our perception of
the immune system. Furthermore, a deeper understanding of the TCR
repertoire in PC may improve our knowledge of the characteristics
of the immunological microenvironment, which may potentially lead
to the development of more effective targeted therapies in order to
better control the disease course and minimize treatment-related
adverse events.
Materials and methods
Clinical samples
Cancer and paracancer tissues from five patients
with PC were collected at the Second Clinical Medical College of
Jinan University (Shenzhen People's Hospital, Guangdong, China).
The patients enrolled in the group were required to have a
confirmed pathological diagnosis of PC without metastasis. The
patient cohort had a mean Gleason score of 7.40±1.34 (range, 6–9),
a mean age of 68.80±9.23 years (range, 58–78 years) (Table I). All patients provided written
informed consent.
 | Table I.Clinical information for the
samples. |
Table I.
Clinical information for the
samples.
| Sample | Age (years) | Gleason score | IHC | Diagnosis |
|---|
| 1 | 58 | 6 | P504S(+), P63(−),
34βE12(−) | Prostate cancer, no
metastasis |
| 2 | 72 | 9 | – | Prostate cancer, no
metastasis |
| 3 | 60 | 6 | P504S(+), P63(−),
34βE12(−) | Prostate cancer, no
metastasis |
| 4 | 78 | 8 | CK(−), P504S(−),
3βE12(−) | Prostate cancer, no
metastasis |
| 5 | 76 | 8 | AR(+), CK(+),
CK20(−), 34βE12(−), P504S(+) P63(−), CD56(−), CDX2(−), CgA(−),
Syn(−) | Prostate cancer, no
metastasis |
DNA extraction and mixing
For extraction of total genomic DNA, 5–10 cancer and
paracancer tissue sections were obtained from each patient, and DNA
was extracted using standard methods. Briefly, dewaxing was
performed with xylene, followed by overnight proteinase K
digestion. A QIAamp DNA Mini kit (Qiagen, Hilden, Germany) was
further used for DNA extraction following the manufacturer's
instructions. DNA quality was evaluated by electrophoresis on 0.8%
agarose gels, and the quality of the template DNA was assessed by
Qubit™ dsDNA High Sensitivity Assay. DNA samples from the cancer
tissues of five patients were mixed together in a 1:1:1:1:1 ratio
according to DNA concentration (Qubit value), and this mixture was
relabeled as one PC sample. Similarly, DNA from the paracancer
tissues of the five patients was mixed together in a 1:1:1:1:1
ratio according to DNA concentration, and the mixture was relabeled
as one prostate paracancer sample.
Multiplex-PCR amplification of TCR-β
CDR3 regions
The human TCR-β sequences were downloaded from IMGT
(http://www.imgt.org/) (14). A relative conserved region in frame
region 3, upstream of CDR3, was selected for the putative forward
primer region. A cluster of primers corresponding to the majority
of the V gene family sequence was selected. Similarly, reverse
primers corresponding to the J gene family were designed (14,15). In
total, 30 forward primers and 13 reverse primers were used for
multiplex PCR to amplify the rearranged TCR-β CDR3 regions. The
reaction mixtures (50 µl total) comprised 2 µl pooled TCR-β
variable gene (TRBV; 10 µM), 2 µl pooled TCR-β joining gene (TRBJ;
10 µM), 25 µl 2X Qiagen Multiplex PCR Master Mix, 5 µl 5X
Q-solution, 500 ng template DNA (10 µl) and 6 µl H2O.
The PCR conditions comprised 95°C for 15 min; followed by 25 cycles
of 94°C for 15 sec and 60°C for 3 min; followed by a final
extension for 10 min at 72°C. The PCR products were purified by
AMPure XP beads to remove primer sequences (Beckman Coulter, Inc.,
Brea, CA, USA). A second round of PCR was performed to add a
sequencing index to each sample. In this round, each reaction
mixture (50 µl total) consisted of 13.5 µl H2O, 0.5 µl
2X Q5 DNA polymerase, 10 µl 5X Q5 buffer, 1 µl dNTPs (10 mM), 1 µl
P1 (10 µM), 23 µl DNA, and 1 µl index (10 µM). The PCR conditions
comprised 98°C for 1 min; followed by 25 cycles of 98°C for 20 sec,
65°C for 30 sec and 72°C for 30 sec; and a final extension for 5
min at 72°C. The library was separated on an agarose gel, and the
target region was isolated and cleaned by QIAquick Gel Extraction
kits (Qiagen).
NGS and data analysis
The library was quantitated using the Agilent 2100
Bioanalyzer instrument (Agilent DNA 1000 reagents) and real-time
quantitative PCR (TaqMan probes), and sequenced by Illumina MiSeq.
Briefly, the adaptor reads and low quality reads were filtered from
the raw data, and the clean data was used in further alignments.
Subsequently, the clean data was aligned to the human IGH database
and analyzed by the online IMGT/HighV-QUEST tool. The data included
V, D and J assignment, CDR3 length distribution, clustering and
other analyses (16).
Results
Summary of sequencing
A total of five patients with PC were recruited for
the present study, and 5–10 cancer and paracancer pathological
sections were obtained from each patient for DNA extraction. The PC
and paracancer DNA samples were created by pooling DNA from the PC
and paracancer tissues, respectively, of the five patients. We used
a combination of multiplex-PCR, Illumina MiSeq sequencing and IMGT
(ImMunoGeneTics)/HighV-QUEST to investigate TCR repertoire features
in PC and prostate paracancer samples at sequence-level resolution.
In total, 641,209 reads were obtained for the pooled cancer sample
and 377,706 reads were obtained for the pooled paracancer sample.
After filtering, including the removal of contamination as well as
adaptor sequences and low-quality reads, the data were aligned to
the human Texas Cancer Research Biobank database. The numbers of
mapping immune sequence reads were 627,234 and 372,660 for the
cancer and paracancer samples, respectively. Among them, the
productive sequence reads totaled 446,108 and 301,203, and the
in-frame sequence reads totaled 457,951 and 312,270 for the cancer
and paracancer samples, respectively. The CDR3 sequences were
identified by their conserved motif. The abundance of each CDR3
clone and the number of distinct CDR3 clone species were
calculated: There were 435,110 total CDR3 sequences for the cancer
sample and 295,793 for the paracancer sample, with unique CDR3
amino acid (aa) sequences totaling 10,433 and 19,948, respectively
(Table II).
| Table II.TCRB sequence statistics. |
Table II.
TCRB sequence statistics.
| Data type | Cancer sample | Paracancer
sample |
|---|
| Total reads
number | 641,209 | 377,706 |
| Immune sequences
number | 627,234 | 372,660 |
| Unknown sequences
number | 13,975 | 5,046 |
| Productive sequences
number | 446,108 | 301,203 |
| Non-productive
sequences number | 181,126 | 71,457 |
| In-frame sequences
number | 457,951 | 312,270 |
| Out-of-frame
sequences number | 164,464 | 58,365 |
| Total CDR3 sequences
number | 435,110 | 295,793 |
| Unique CDR3 nt
sequences number | 13,214 | 23,093 |
| Unique CDR3 aa
sequences number | 10,433 | 19,948 |
Highly expanded clones (HECs) and TCR
repertoire diversity
In order to obtain an accurate and comprehensive
description of TCR repertoire diversity in the PC and paracancer
samples, the expression level of each clone was calculated
according to the identity of each sequence after alignment, and the
degree of expansion of each clone was based on the frequency of
each unique CDR3 sequence. TCR clones with a frequency >0.5% of
the total reads in a sample were defined as HECs. In the cancer
sample, 26 clones were HECs, with a HEC ratio of 0.34.
Comparatively, in the paracancer sample, only 8 clones were defined
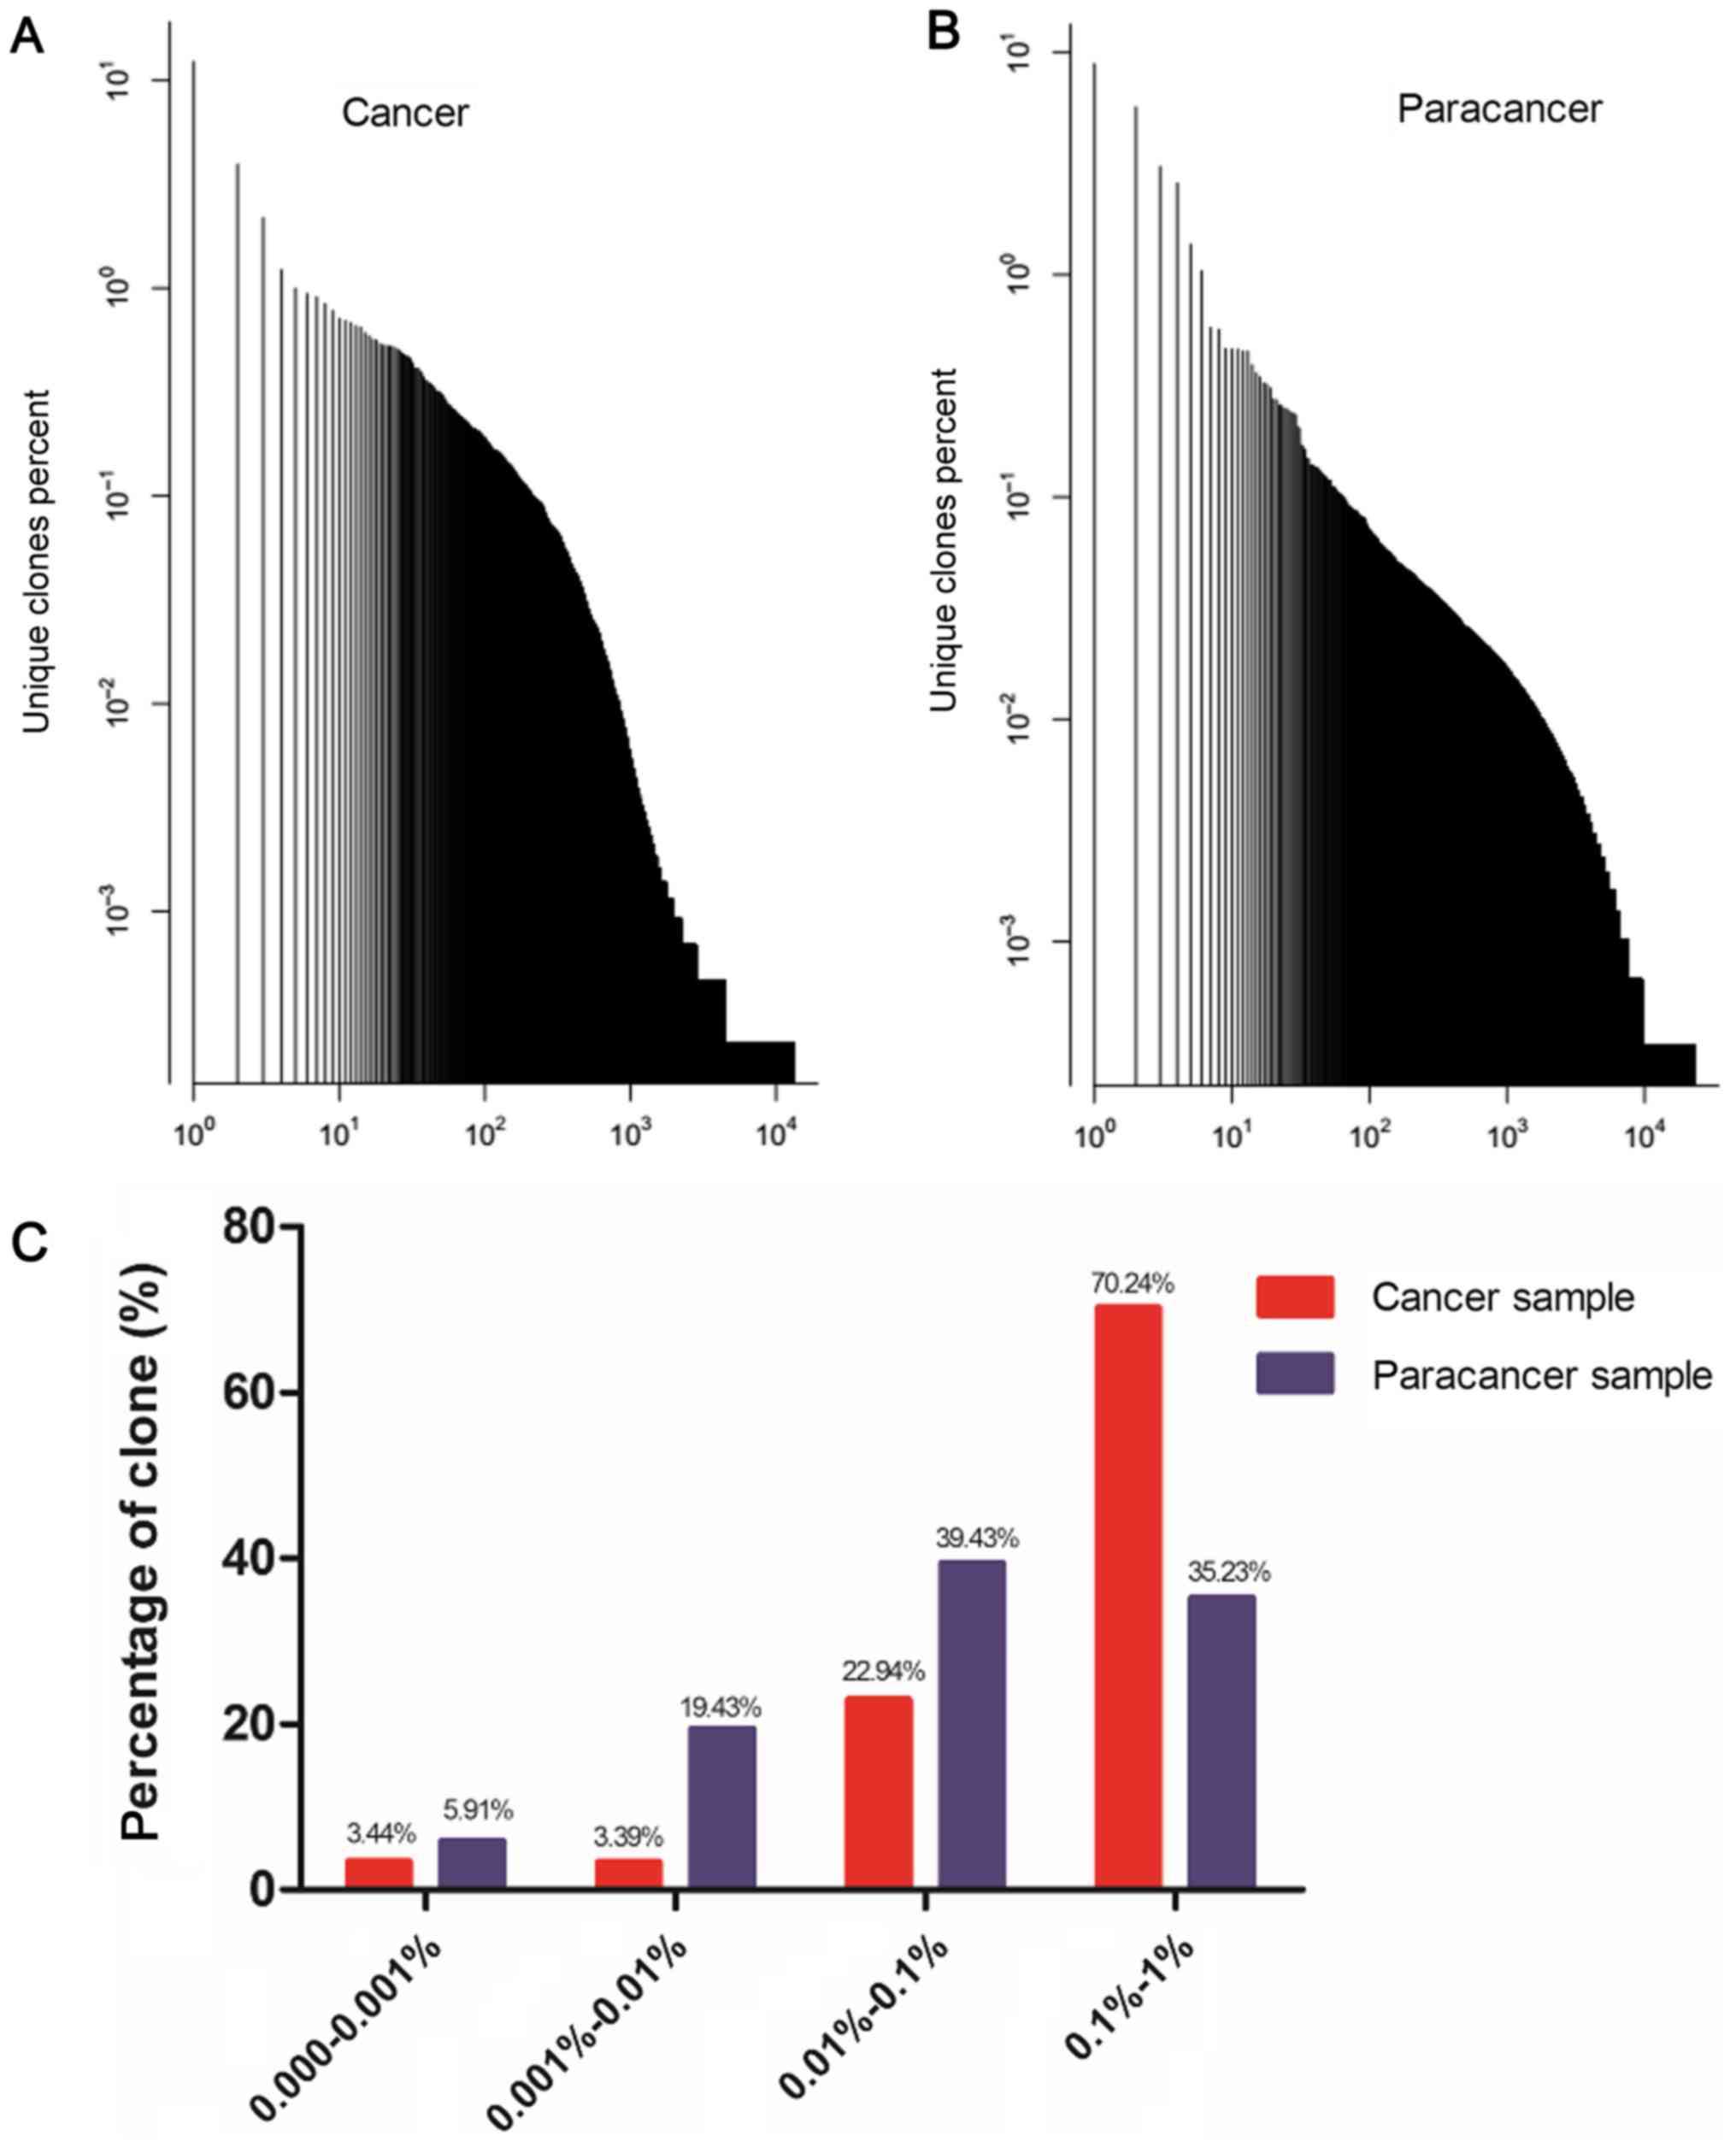
as HECs, with a HEC ratio of 0.24 (Table III). A plot of the frequency
distribution of the TCR repertoire in cancer and paracancer samples
is shown in Fig. 1A and B. A majority
of the TCR clones were present at low frequencies, with fewer
sequences occurring at much higher frequencies in the cancer and
paracancer samples. The percentages of clones with different
degrees of clone expression (based on the number of reads for that
clone out of the total number of reads in the sample) were further
calculated. In the cancer sample, clones with a degree of
expression of 0.1–1% accounted for 70.24% of the T cell sequences
present, while clones with a degree of expression of 0.01–0.1%
accounted for 22.94%. In the paracancer sample, clones with an
expression degree of 0.01–0.1% accounted for the highest percentage
(39.43%), while clones with an expression degree of 0.1–1%
accounted for 35.23% (Fig. 1C).
Therefore, the TCR repertoire in the PC sample had more HECs
(expression degree >0.5%), a higher HEC ratio, and greater
percentage of higher degree (>0.1%) clones compared with the
prostate paracancer sample.
| Table III.HEC and diversity in cancer and
paracancer sample. |
Table III.
HEC and diversity in cancer and
paracancer sample.
| Data type | Cancer sample | Paracancer
sample |
|---|
| HEC number | 26 | 8 |
| HEC ratio | 0.34 | 0.24 |
| Shannon entropy | 0.46 | 0.59 |
In addition, we applied a normalized Shannon entropy
index to quantify the TCR diversity of the cancer and paracancer
samples. The normalized Shannon entropy index ranges from 0 to 1,
in which 1 indicates the highest degree of diversity and 0
indicates no diversity. The normalized entropy of the cancer sample
was found to be less than that of the paracancer sample (0.46 vs.
0.59). These results suggest that the TCR repertoire of cancer
tissue has a much more skewed clonotype composition than that of
paracancer tissue.
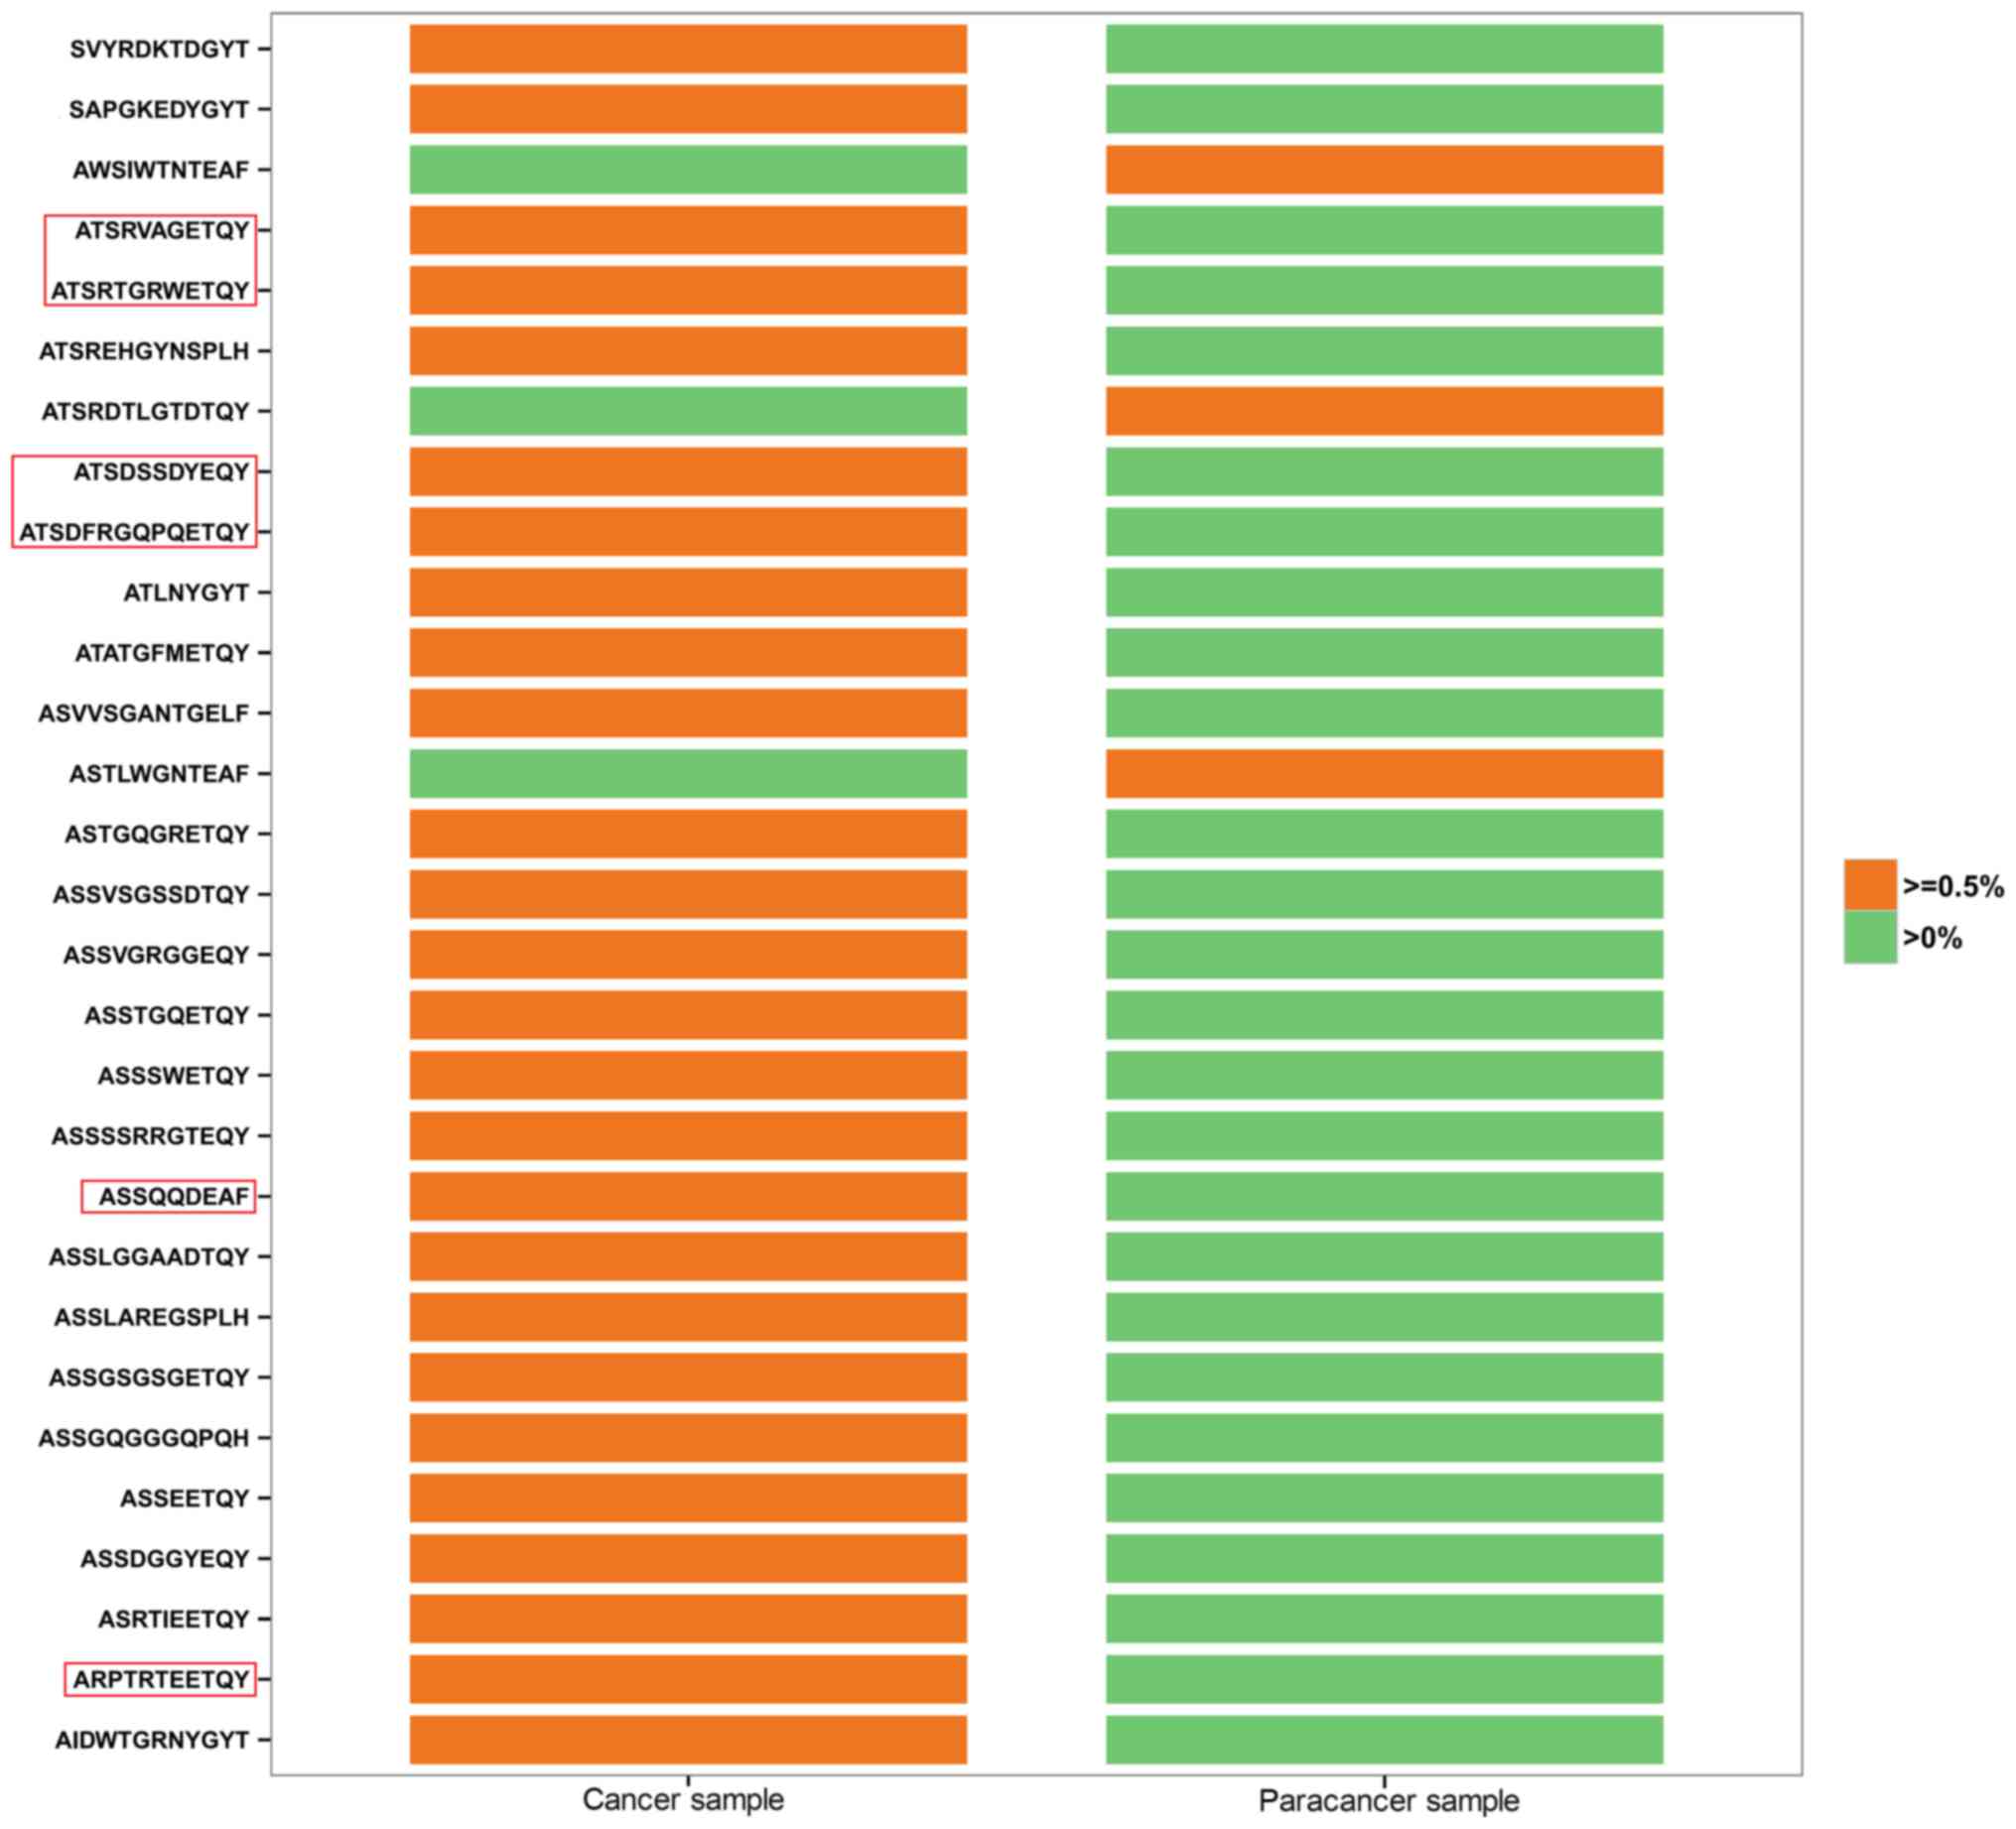
Shared TCR clones in cancer and
paracancer samples
The shared (or public) T cells among healthy
individuals and those with disease are of great interest to
researchers. We further investigated the clones common to both the
PC and the paracancer samples, in which HEC clones were analyzed in
depth. All 26 HECs in the cancer sample had low expression
(<0.5%) in the paracancer sample (Fig.
2). By contrast, 3 of the 8 HECs in the paracancer sample were
expressed at a low level (<0.5%) in the cancer sample, whereas
the other 5 HECs were not expressed at all (Fig. 2). In Fig.
2, HEC aa sequences accounting for >1% of the cancer sample
are labeled with a red frame. ATSRVAGETQY (1.008 vs. 0.002%),
ATSRTGRWETQY (3.985 vs. 0.007%), ATSDSSDYEQY (12.464 vs. 0.027%),
ATSDFRGQPQETQY (2.205 vs. 0.06%), ASSQQDEAF (1.109 vs. 0.002%), and
ARPTRTEETQY (1.263 vs. 0.002%) were found to vary markedly between
the two samples in terms of their degree of expression.
Identification of prostate-specific HECs may accelerate the
screening process for possible new autoantigens, which is critical
to increase understanding of the TCR repertoire in PC tissues.
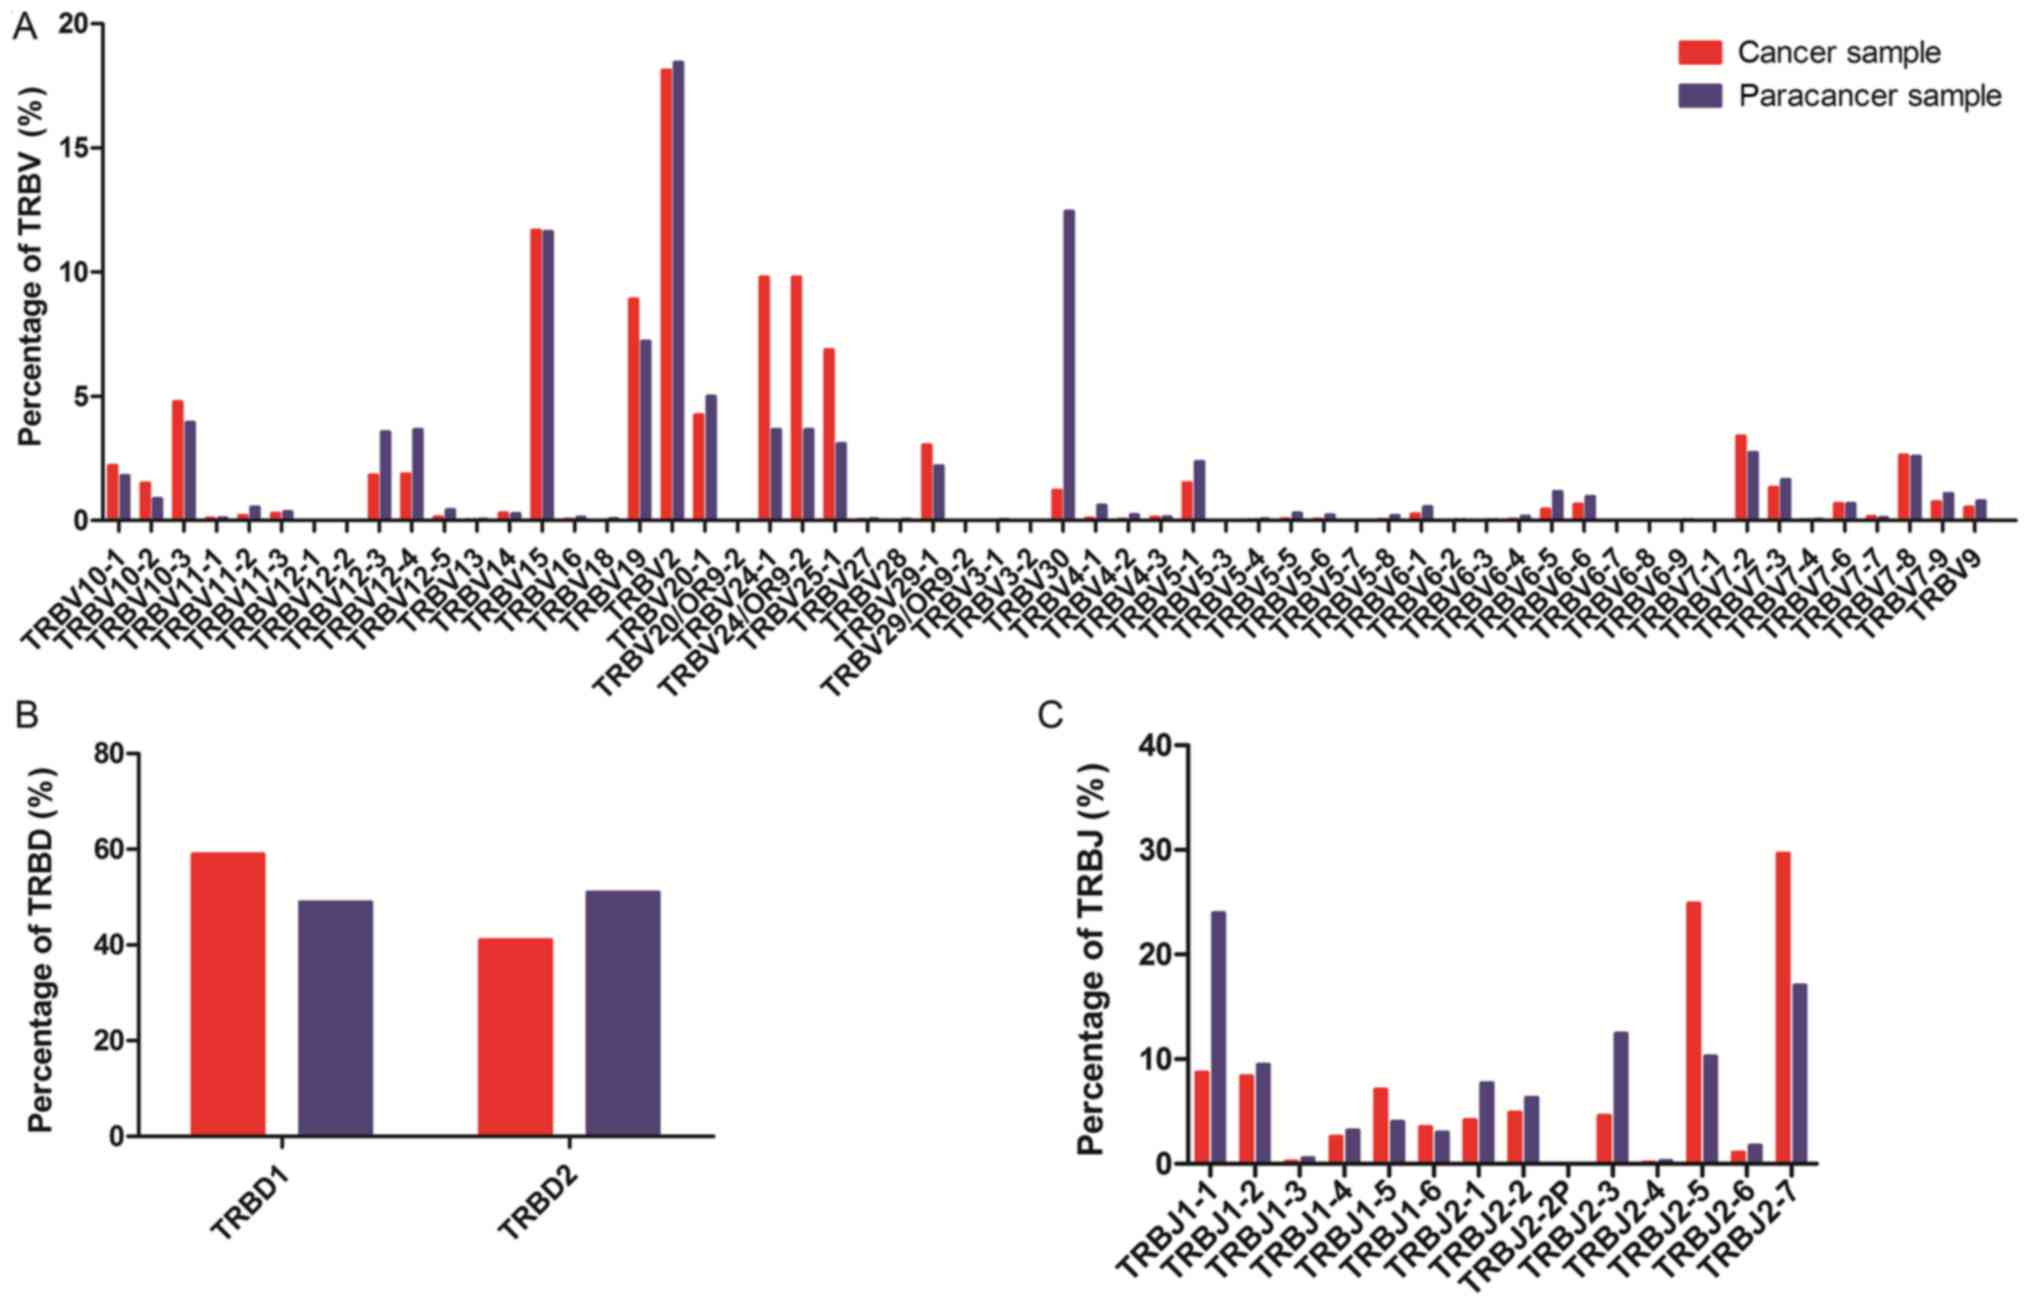
Comparison of TRBV, TRBD and TRBJ
repertoires
To determine whether any disease-specific
differences exist in the TRBV, TRBD and TRBJ repertoires, the
expression levels of the respective TRBV, TRBD and TRBJ repertoires
in cancer and paracancer samples were compared. In total, 58 TRBV
segments, 2 TRBD segments and 14 TRBJ segments were included. For
the 58 TRBV segments, the gene expression level of TRBV2 was
highest in both the cancer and paracancer samples. The usage ratios
of TRBV2 (18.12 vs. 18.43%), TRBV15 (11.68 vs. 11.63%), and TRBV7-8
(2.64 vs. 2.58%) in the TCRs were similar (±10%) between the cancer
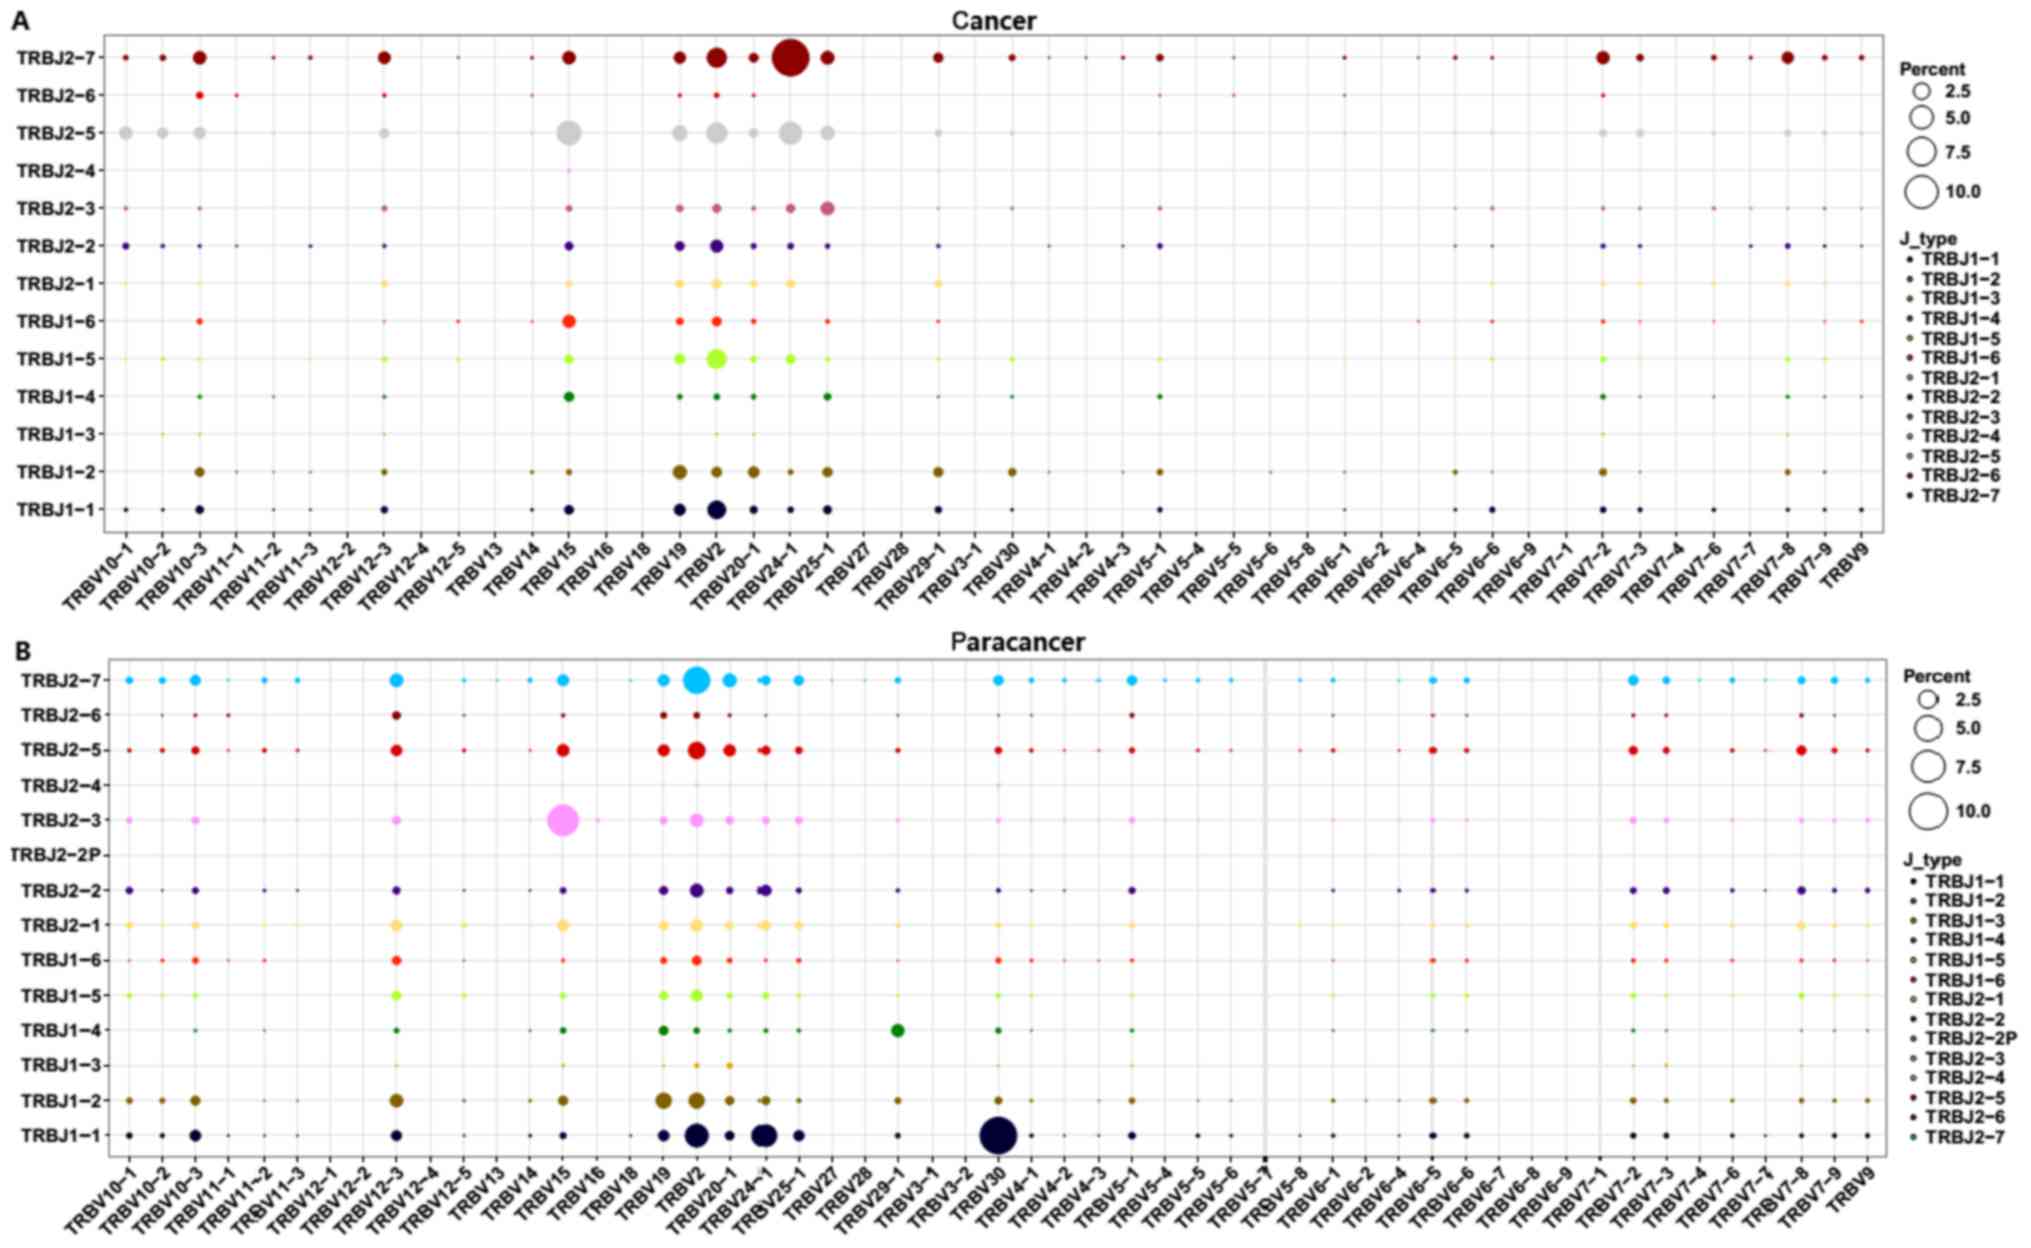
and paracancer samples (Fig. 3). For
the other distinct TRBV sequences, the usage ratios of each TRBV
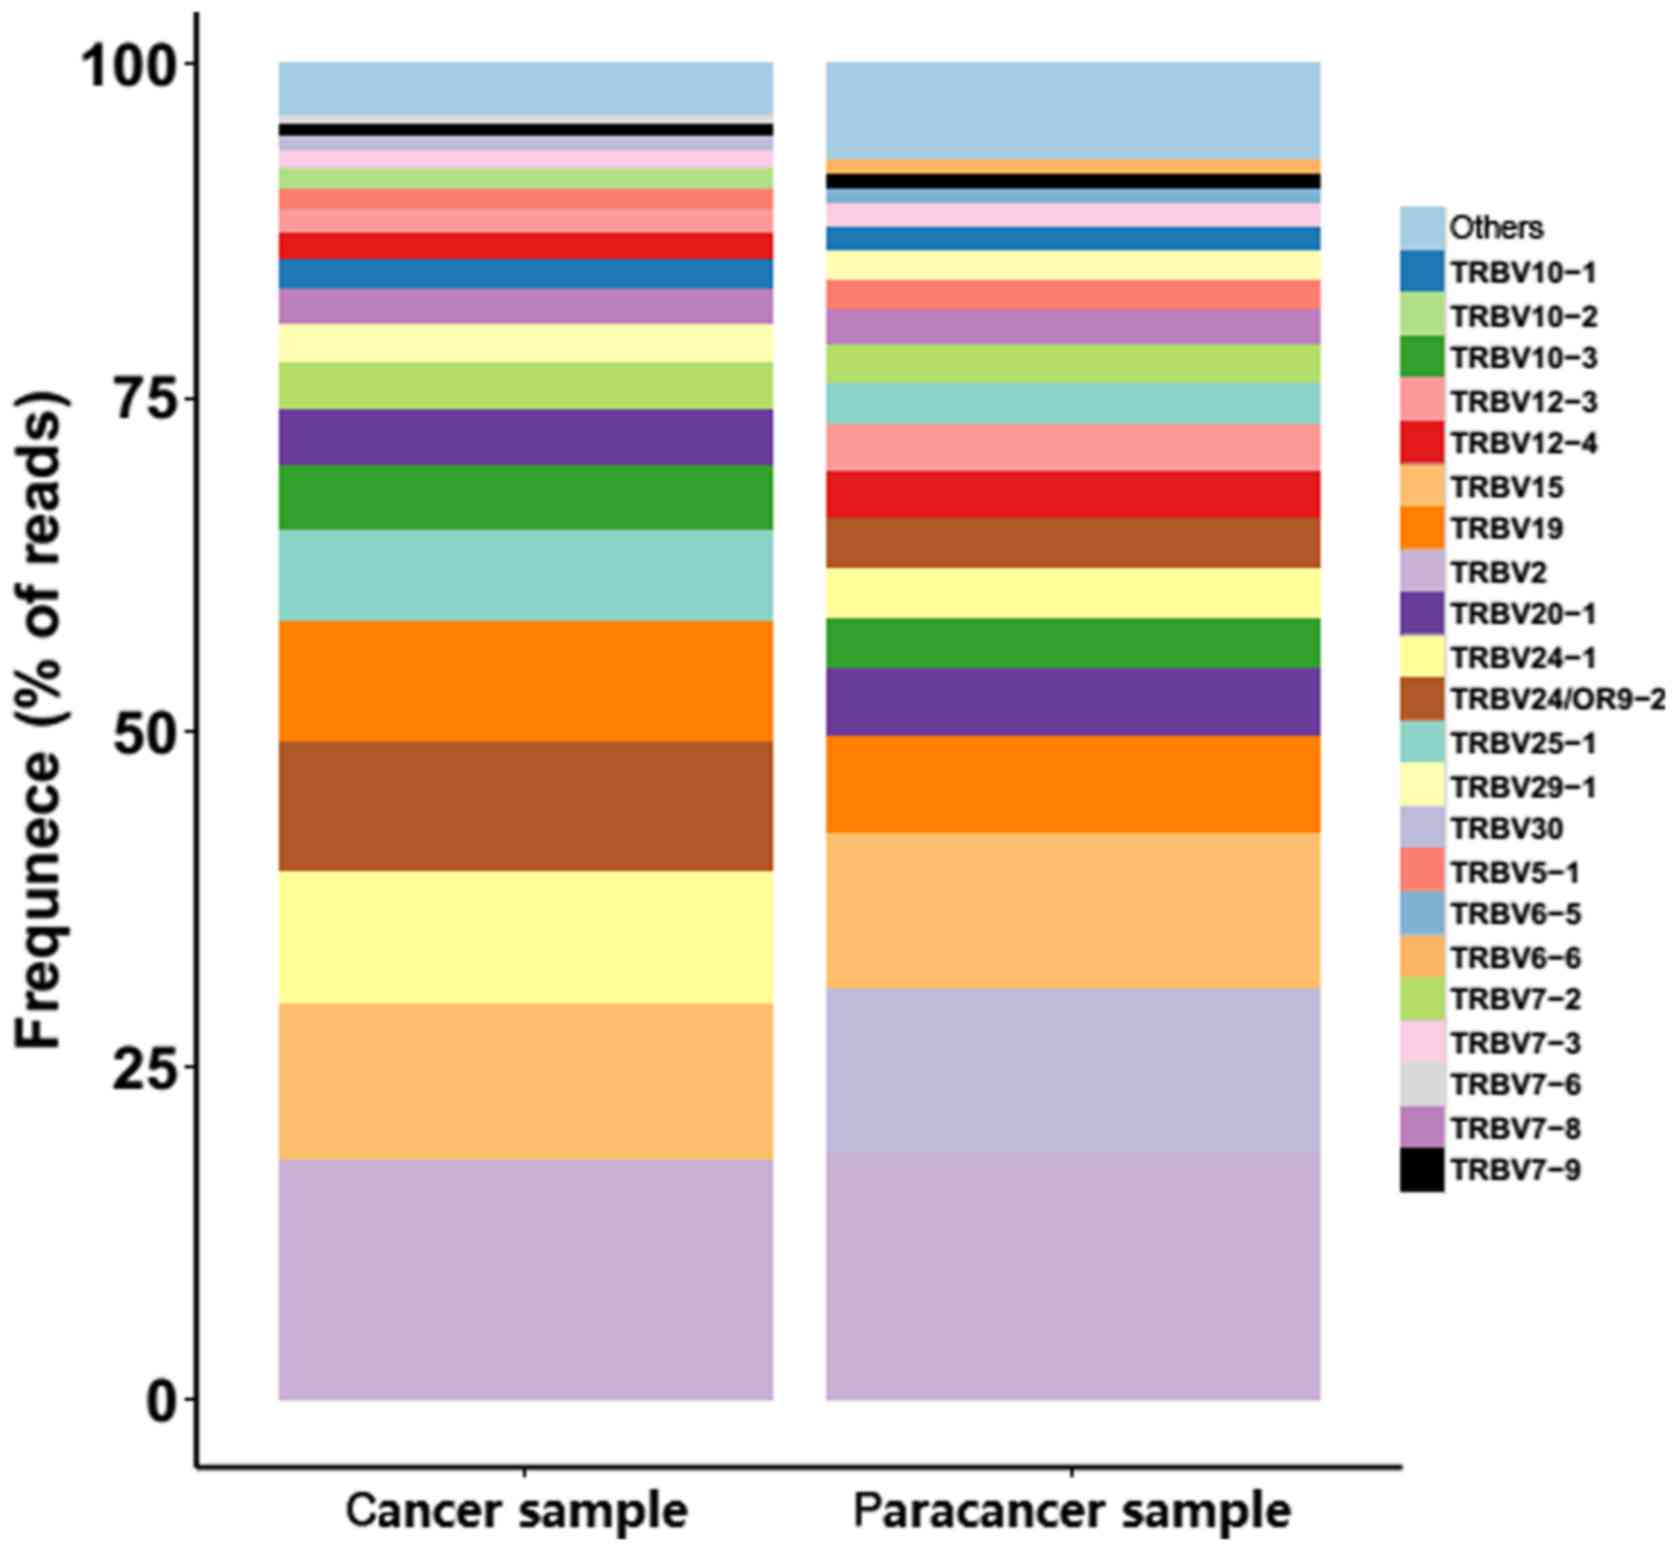
gene exhibited extreme variation. The frequencies of the top 20 V
gene family in the PC and paracancer samples are shown in Fig. 4. The majority of the top 20 V gene
family in the cancer sample could also be found in the paracancer
sample, with the exception of TRBV10-2 (1.5%) and TRBV7-6 (0.68%),
whereas TRBV6-5 (1.16%) and TRBV6-6 (0.98%) were specific to the
paracancer sample (Fig. 4). As for
the 2 TRBD segments, TRBD1 seemed to be more frequent in the cancer
sample compared with the paracancer sample. Furthermore, the usage
ratio of each TRBJ gene exhibited extreme variation in the cancer
and paracancer samples. The usage ratios of this set of TRBJ genes
ranged from 0.13% (for TRBJ2-4) to 29.65% (for TRBJ2-7) in the
cancer sample, and from 0.27% (for TRBJ2-4) to 23.95% (for TRBJ1-1)
in the paracancer sample. These data suggest that there may be
clone expansion in specific V and J genes in the PC sample.
Subsequently, V-J combinations frequencies for each
sample were obtained (Fig. 5). In
total, 9 V-J gene pairings [TRBV11-1-TRBJ1-3 (0.02%),
TRBV13-TRBJ1-3 (0.02%), TRBV13-TRBJ1-6 (0.07%), TRBV6-9-TRBJ2-3
(0.07%), TRBV6-9-TRBJ2-6 (0.02%), TRBV7-4-TRBJ2-4 (0.02%),
TRBV7-7-TRBJ1-3 (0.02%), TRBV7-7-TRBJ1-4 (0.02%), and
TRBV7-7-TRBJ2-6 (0.05%)] were present specifically in the cancer
sample at a low frequency (Fig. 5).
The other high expression V-J gene pairings (expression degree
>1%) are listed in Table IV. The
TRBV15-TRBJ2-5, TRBV2-TRBJ2-5, TRBV2-TRBJ2-7, TRBV2-TRBJ1-1,
TRBV19-TRBJ1-2, TRBV2-TRBJ2-2, and TRBV12-3-TRBJ2-7 V-J gene
pairings (>1%) were overlapping in the PC and paracancer
samples. On the contrary, other V-J gene pairings exhibited marked
variation between the PC and paracancer samples. For example, the
TRBV24-1-TRBJ2-7 pairing was highest in the cancer sample (12.43%),
with low expression in the paracancer sample (<1%);
TRBV30-TRBJ1-1 was highest in the paracancer sample (10.05%), with
low expression in the cancer sample (<1%). These data indicated
that particular V-J gene pairings were dominant and specific to the
PC tissues.
| Table IV.V-J paring usage (>1%) in prostate
cancer and paracancer samples. |
Table IV.
V-J paring usage (>1%) in prostate
cancer and paracancer samples.
| V-J pairing in
cancer sample | Usage in cancer
sample (%) | V-J pairing in
paracancer sample | Usage in paracancer
sample (%) |
|---|
| TRBV24-1 | TRBJ2-7 | 12.43 | TRBV30 | TRBJ1-1 | 10.05 |
| TRBV15 | TRBJ2-5 | 5.48 | TRBV15 | TRBJ2-3 | 7.11 |
| TRBV24-1 | TRBJ2-5 | 4.66 | TRBV2 | TRBJ2-7 | 5.22 |
| TRBV2 | TRBJ2-5 | 3.79 | TRBV2 | TRBJ1-1 | 3.95 |
| TRBV2 | TRBJ2-7 | 3.45 | TRBV24-1 | TRBJ1-1 | 3.59 |
| TRBV2 | TRBJ1-5 | 3.33 | TRBV2 | TRBJ2-5 | 2.04 |
| TRBV2 | TRBJ1-1 | 2.86 | TRBV19 | TRBJ1-2 | 1.73 |
| TRBV19 | TRBJ2-5 | 1.90 | TRBV2 | TRBJ1-2 | 1.71 |
| TRBV25-1 | TRBJ2-5 | 1.65 | TRBV20-1 | TRBJ2-7 | 1.27 |
| TRBV19 | TRBJ1-2 | 1.61 | TRBV2 | TRBJ2-3 | 1.22 |
| TRBV25-1 | TRBJ2-7 | 1.52 | TRBV2 | TRBJ2-2 | 1.21 |
| TRBV25-1 | TRBJ2-3 | 1.50 | TRBV12-3 | TRBJ2-7 | 1.20 |
| TRBV10-1 | TRBJ2-5 | 1.45 | TRBV12-3 | TRBJ1-2 | 1.16 |
| TRBV15 | TRBJ2-7 | 1.42 | TRBV29-1 | TRBJ1-4 | 1.13 |
| TRBV10-3 | TRBJ2-7 | 1.42 | TRBV15 | TRBJ2-5 | 1.01 |
| TRBV15 | TRBJ1-6 | 1.39 | TRBV2 | TRBJ2-1 | 1.00 |
| TRBV7-2 | TRBJ2-7 | 1.39 |
|
|
|
| TRBV2 | TRBJ2-2 | 1.35 |
|
|
|
| TRBV12-3 | TRBJ2-7 | 1.29 |
|
|
|
| TRBV7-8 | TRBJ2-7 | 1.17 |
|
|
|
| TRBV10-3 | TRBJ2-5 | 1.15 |
|
|
|
| TRBV19 | TRBJ2-7 | 1.15 |
|
|
|
| TRBV19 | TRBJ1-1 | 1.07 |
|
|
|
| TRBV20-1 | TRBJ1-2 | 1.02 |
|
|
|
Discussion
The immunological treatment of PC has been proposed
due to the association between the immunological microenvironment
of the primary tumor and the patient outcome (4). Arap et al found that the
intratumoral absence or presence of T cells and regulatory T cells
(Tregs) is functionally relevant and may have an impact on the
clinical course of PC (17). T cells
serve an important role in adaptive immunity, recognizing MHC-bound
peptides via TCRs on the T-cell surface. The CDR3 region of TCRs is
responsible for the unique molecular structure that allows the
diversity of a T-cell population. In the present study, we used a
novel NGS protocol to investigate the TCR repertoire in PC and
prostate paracancer samples at the sequence level. In total,
641,209 reads for the cancer sample and 377,706 reads for the
paracancer sample were obtained, providing extensive information on
the TCR repertoire in PC.
Among the 435,110 total CDR3 sequences acquired for
the cancer sample and 295,793 for the paracancer sample, TCR clones
with a frequency >0.5% of the total number of reads in a sample
were defined as HECs. The TCR repertoire in the PC sample had more
HECs (>0.5%), a higher HEC ratio, and a greater percentage of
higher degree (>0.1%) clones than the prostate paracancer
sample. Furthermore, Shannon entropy was utilized to investigate
the immunological diversity in patients with PC; this method was
introduced by Claude Shannon as part of information theory, and is
the mostly widely used method as it integrates the number of
different species as well as the relative proportion of each
species (18). Our results suggested
that the entire TCR repertoire of the pooled cancer tissue sample
had a markedly more skewed clonotype composition than that of the
paracancer sample. Numerous previous studies have assessed the
association between specific immune cells and PC (3,4), most of
which investigated CD3+, CD4+ or
CD8+ cells, revealing pro-tumorigenic activities in the
prostatectomy or biopsy tissues of patients with PC (4). Research has also focused on the presence
of immunosuppressive immune cells, such as Tregs
(19–21), myeloid-derived suppressor cells
(22,23), and T helper 17 cells (21), in prostate tissue, which were found to
be suggestive of more aggressive disease. However, notably few
studies were able to equate this with clinical prognosis. In the
present study, we concentrated on only the TCR repertoire in paired
cancer and paracancer tissues from patients with PC. The amount of
different T cell subsets was not well distinguished, and the
repertoire of different T cell subsets in PC tissue requires
further research.
Prostate-associated antigens, such as
prostate-specific antigen, prostate-specific membrane antigen,
prostate stem-cell antigen, and prostatic acid phosphatase, which
are weak or non-immunogenic self-antigens (3), have been used as a screening approach
for PC. In the current study, we further investigated the shared
clones in PC and paracancer samples, in which HEC clones were
analyzed in depth. ATSRVAGETQY (1.008 vs. 0.002%), ATSRTGRWETQY
(3.985 vs. 0.007%), ATSDSSDYEQY (12.464 vs. 0.027%), ATSDFRGQPQETQY
(2.205 vs. 0.06%), ASSQQDEAF (1.109 vs. 0.002%), and ARPTRTEETQY
(1.263 vs. 0.002%) were found to vary markedly between the two
samples. Identification of PC-specific HECs may accelerate the
screening process for possible new autoantigens.
While this study have some limitations. In our
present study, the peripheral blood of the same patients haven't
been collected in time and the data can not be included. For
further sample collection, the peripheral blood sample will be
included to give us more information. An ideal tumorigenesis model
evaluate normal and tumoral tissue, the normal tissues are too hard
to be collected for clinical sample collection. We confirmed that
the paracancer tissue samples were taken from non-malignant
surrounding tissue of prostate tumor of the same patients. And the
paracancer tissues were confirmed by pathological detection without
cancer cells, which we thought the most close to the normal tissue.
The TCR in precancerouse tissue, cancer tissue and metastatic
tissue could be better explaining the effect of immunologic system
on PC aggression and progression. The mice model will also included
in our further study to better understand the role of TCR impact on
progression to prostate cancer. This is a descriptive and
preliminary study in a very small group of patient, while we used a
novel NGS protocol to investigate the TCR repertoire in PC and
prostate paracancer samples at the sequence level for the first
time. In total, 641,209 reads for the cancer sample and 377,706
reads for the paracancer sample were obtained, providing extensive
information on the TCR repertoire in PC. A more comprehensive study
is needed to evaluate the clinical impact of the information, where
more samples will be included.
In conclusion, the present study demonstrated a
successful approach to profiling an entire TCR repertoire at
sequence-level resolution, providing knowledge of the
characteristics of the immunological microenvironment in PC
tissues. We hope that this will lead to the generation of more
effective targeted therapies, which could have benefits for
controlling the disease course and minimizing treatment-related
adverse events in PC.
Acknowledgements
This study was supported by grants from the Science
and Technology Plan of Shenzhen (no. JCYJ20140416095712714),
Technology Plan of Shenzhen, Guangdong (no. JCYJ20160422150329190),
China Postdoctoral Science Foundation Grant (no. 2017M610575),
Shenzhen Pingshan new district health research project (no. 201613)
and Guangdong-Hong Kong Technology Cooperation Funding Scheme
(TCFS) 2015–2016, under the Innovation and Technology Fund (ITF)
(no. GHP/003/16GD).
References
|
1
|
Kgatle MM, Kalla AA, Islam MM, Sathekge M
and Moorad R: Prostate cancer: Epigenetic alterations, risk factors
and therapy. Prostate Cancer. 2016:56538622016. View Article : Google Scholar : PubMed/NCBI
|
|
2
|
Silvestri I, Cattarino S, Giantulli S,
Nazzari C, Collalti G and Sciarra A: A perspective of immunotherapy
for prostate cancer. Cancers (Basel). 8:E642016. View Article : Google Scholar : PubMed/NCBI
|
|
3
|
Thakur A, Vaishampayan U and Lum LG:
Immunotherapy and immune evasion in prostate cancer. Cancers.
5:569–590. 2013. View Article : Google Scholar : PubMed/NCBI
|
|
4
|
Strasner A and Karin M: Immune
infiltration and prostate cancer. Front Oncol. 5:1282015.
View Article : Google Scholar : PubMed/NCBI
|
|
5
|
Hogquist KA, Jameson SC, Heath WR, Howard
JL, Bevan MJ and Carbone FR: T cell receptor antagonist peptides
induce positive selection. Cell. 76:17–27. 1994. View Article : Google Scholar : PubMed/NCBI
|
|
6
|
Dudley DJ: The immune system in health and
disease. Baillieres Clin Obstet Gynaecol. 6:393–416. 1992.
View Article : Google Scholar : PubMed/NCBI
|
|
7
|
Risitano AM, Maciejewski JP, Green S,
Plasilova M, Zeng W and Young NS: In-vivo dominant immune responses
in aplastic anaemia: Molecular tracking of putatively pathogenetic
T-cell clones by TCR beta-CDR3 sequencing. Lancet. 364:355–364.
2004. View Article : Google Scholar : PubMed/NCBI
|
|
8
|
Calis JJ and Rosenberg BR: Characterizing
immune repertoires by high throughput sequencing: Strategies and
applications. Trends Immunol. 35:581–590. 2014. View Article : Google Scholar : PubMed/NCBI
|
|
9
|
Chen J, Zhang D, Yan W, Yang D and Shen B:
Translational bioinformatics for diagnostic and prognostic
prediction of prostate cancer in the next-generation sequencing
era. Biomed Res Int. 2013:9015782013.PubMed/NCBI
|
|
10
|
Serrati S, De Summa S, Pilato B, Petriella
D, Lacalamita R, Tommasi S and Pinto R: Next-generation sequencing:
Advances and applications in cancer diagnosis. Onco Targets Ther.
9:7355–7365. 2016. View Article : Google Scholar : PubMed/NCBI
|
|
11
|
Robins H: Immunosequencing: Applications
of immune repertoire deep sequencing. Curr Opin Immunol.
25:646–652. 2013. View Article : Google Scholar : PubMed/NCBI
|
|
12
|
Hou XL, Wang L, Ding YL, Xie Q and Diao
HY: Current status and recent advances of next generation
sequencing techniques in immunological repertoire. Genes Immun.
17:153–164. 2016. View Article : Google Scholar : PubMed/NCBI
|
|
13
|
Mirshahidi S, Ferris LC and Sadegh-Nasseri
S: The magnitude of TCR engagement is a critical predictor of T
cell anergy or activation. J Immunol. 172:5346–5355. 2004.
View Article : Google Scholar : PubMed/NCBI
|
|
14
|
Lefranc MP: Immunoglobulin and T cell
receptor genes: IMGT (®) and the birth and rise of
immunoinformatics. Front Immunol. 5:222014. View Article : Google Scholar : PubMed/NCBI
|
|
15
|
Hou X, Lu C, Chen S, Xie Q, Cui G, Chen J,
Chen Z, Wu Z, Ding Y, Ye P, et al: High throughput sequencing of T
cell antigen receptors reveals a conserved TCR repertoire. Medicine
(Baltimore). 95:e28392016. View Article : Google Scholar : PubMed/NCBI
|
|
16
|
Sui W, Hou X, Zou G, Che W, Yang M, Zheng
C, Liu F, Chen P, Wei X, Lai L and Dai Y: Composition and variation
analysis of the TCR β-chain CDR3 repertoire in systemic lupus
erythematosus using high-throughput sequencing. Mol Immunol.
67:455–464. 2015. View Article : Google Scholar : PubMed/NCBI
|
|
17
|
Arap W, Trepel M, Zetter BR and Pasqualini
R: Meeting report: Innovations in prostate cancer research. Cancer
Res. 68:635–638. 2008.PubMed/NCBI
|
|
18
|
Magurran AE: Ecology: Linking species
diversity and genetic diversity. Curr Biol. 15:R597–R599. 2005.
View Article : Google Scholar : PubMed/NCBI
|
|
19
|
Ebelt K, Babaryka G, Frankenberger B,
Stief CG, Eisenmenger W, Kirchner T, Schendel DJ and Noessner E:
Prostate cancer lesions are surrounded by FOXP3+, PD-1+ and B7-H1+
lymphocyte clusters. Eur J Cancer. 45:1664–1672. 2009. View Article : Google Scholar : PubMed/NCBI
|
|
20
|
Valdman A, Jaraj SJ, Compérat E, Charlotte
F, Roupret M, Pisa P and Egevad L: Distribution of Foxp3-, CD4- and
CD8-positive lymphocytic cells in benign and malignant prostate
tissue. APMIS. 118:360–365. 2010. View Article : Google Scholar : PubMed/NCBI
|
|
21
|
Derhovanessian E, Adams V, Hähnel K,
Groeger A, Pandha H, Ward S and Pawelec G: Pretreatment frequency
of circulating IL-17+CD4+ T-cells, but not Tregs, correlates with
clinical response to whole-cell vaccination in prostate cancer
patients. Int J Cancer. 125:1372–1379. 2009. View Article : Google Scholar : PubMed/NCBI
|
|
22
|
Garcia AJ, Ruscetti M, Arenzana TL, Tran
LM, Bianci-Frias D, Sybert E, Priceman SJ, Wu L, Nelson PS, Smale
ST and Wu H: Pten null prostate epithelium promotes localized
myeloid-derived suppressor cell expansion and immune suppression
during tumor initiation and progression. Mol Cell Biol.
34:2017–2028. 2014. View Article : Google Scholar : PubMed/NCBI
|
|
23
|
Di Mitri D, Toso A, Chen JJ, Sarti M,
Pinton S, Jost TR, D'Antuono R, Montani E, Garcia-Escudero R,
Guccini I, et al: Tumour-infiltrating Gr-1+ myeloid cells
antagonize senescence in cancer. Nature. 515:134–137. 2014.
View Article : Google Scholar : PubMed/NCBI
|