Introduction
Breast cancer is one of the most common malignancies
globally and a major cause of cancer-associated mortality in women
(1). Cisplatin (DDP) is the first
line chemotherapeutic drug for solid tumor types, including breast
cancer. However, DDP resistance is one of the current challenges
facing the management of breast cancer patients. DDP primarily acts
to form complexes with mitochondrial DNA (mtDNA), leading to
mitochondria damage and concomitant cell death through the
intrinsic apoptosis pathway (2,3).
Furthermore, DDP reduces mtDNA copies and increases the sensitivity
of tumor cells to chemotherapy (4).
Thus, dysregulation of mtDNA copy number and gene expression may be
associated with the progression and prognosis of breast cancer
following DDP treatment.
Mitochondrial transcription factor A (TFAM) drives
the transcription and replication of mtDNA and is involved in the
regulation of mtDNA copies and the maintenance and repair of
mitochondrial genes (5). Therefore,
TFAM is important in terms of the functional integrity of the
mitochondrial respiratory chain and the maintenance of balance
between anti-oxidation and oxidation (5). Nuclear respiratory factor-1 (Nrf1) may
bind to the promoter of the TFAM gene to regulate TFAM expression,
and may be involved the biogenesis and adenosine triphosphate (ATP)
production in mitochondria (6,7).
NRF1 and TFAM expression has been demonstrated to be
associated with the clinical features of certain tumor types,
including esophageal squamous cell carcinoma, colorectal, liver and
bladder cancer (8–11). NRF1 and TFAM mRNA and
protein expression have been demonstrated to be positive in
patients with breast cancer compared with adjacent normal patients
or in MCF-7, MDA-MB-231 and MDA-MB-453 cell lines compared with a
control Hs578T cell line (12,13), but
NRF1 and TFAM expression patterns in breast cancer
and adjacent normal tissues, as well as their clinical
significance, remain unclear. In the present study, breast cancer
tissues and adjacent normal tissues were collected from patients,
and immunohistochemistry array analysis of Nrf1 and TFAM protein
expression was performed. The results of the present study
demonstrated that Nrf1 and TFAM protein expression was increased in
the cancer cells of patients with different types of breast cancer,
and patients who were positive for Nrf1 and TFAM had a decreased
long-term survival rate compared with patients who were
negative.
Materials and methods
Patients
All patients with primary breast cancer who had
undergone initial surgery at the First Affiliated Hospital of The
Second Military Medical University (Changhai Hospital, Shanghai,
China) between January 2009 and June 2010 were screened for
enrolment in the present study by reviewing electronic charts.
Patients who presented with other primary tumor sites or who
received preoperative radiotherapy or chemotherapy were excluded. A
total of 388 patients were enrolled in the present study and 336
patients with complete clinical information were included for
further analysis. The following variables were recorded: Patient
age at diagnosis, menopausal status, largest tumor diameter, number
of lymph node metastases, tumor-node-metastasis stage (TNM, NCCN
Guidelines, Breast Cancer Version 3.2014) (14) and histologic grade.
Clinicopathological characteristics for these patients are detailed
in Table I. All tissue specimens used
in the present study were obtained with written informed consent
from the patients, and the Ethics Committee of Changhai Hospital
granted approval for this measure and the research protocol.
 | Table I.Clinical characteristics of patients
enrolled in the present study. |
Table I.
Clinical characteristics of patients
enrolled in the present study.
| Clinicopathological
variable | Value |
|---|
| Median age, years
(range) | 53 (30–81) |
| Menopausal status
(%) |
|
|
Premenopausal | 152 (45.2) |
|
Postmenopausal | 184 (54.8) |
| TNM stage (%) |
|
| I | 104 (31.0) |
| II | 195 (58.0) |
|
III | 37 (11.0) |
| Pathological
diagnosis (%) |
|
|
Invasive ductal carcinoma | 312 (92.9) |
|
Non-invasive ductal
carcinoma | 24 (7.1) |
| Histological grade
(%) |
|
| 1 | 16 (4.8) |
| 2 | 216 (64.3) |
| 3 | 104 (30.9) |
| Erb-b2 receptor
tyrosine kinase 2 status (%) |
|
|
Negative | 280 (83.3) |
|
Positive | 56 (16.7) |
| Estrogen receptor
status (%) |
|
|
Negative | 152 (45.2) |
|
Positive | 184 (54.8) |
| Progesterone
receptor status (%) |
|
|
Negative | 198 (58.9) |
|
Positive | 138 (41.1) |
Tissue microarray (TMA) and
immunohistochemistry (IHC)
Large core TMAs were used in order to cover a larger
number of tumor cells and represent the typical pathological
changes, as described previously (15). Tissues were embedded in paraffin and
sectioned (4 µm thickness) for hematoxylin (4 min) and eosin (3
min) staining (25°C). Pathological examination was performed by an
experienced pathologist, and the region of interest was marked on
the basis of the HE staining results. Away from areas of ulceration
and necrosis, 1.5-mm diameter cylinders were punched from the
center of the excised tumor and re-embedded into a recipient
paraffin block, using a tissue-arraying instrument (Beecher
Instruments, Inc., Sun Prairie, WI, USA). The microarray sections
were randomly inspected, processed for HE staining and observed
under a light microscope for quality control. The TMA blocks were
then cut into 4-mm sections and processed for IHC.
Tissues were fixed in 4% neutral formalin at 4°C for
24 h and embedded in paraffin. Tissue sections were dewaxed and
washed with 3% hydrogen peroxide at room temperature for 15 min,
followed by further washing with double distilled water for 6 min
and PBS for 6 min. The microarray sections were put into the
microwave oven and heated until boiling in 0.01 mol/l sodium
citrate buffer solution (pH 6.0) for 5 min, repeated 2 times, then
cooled at room temperature for 20 min, before being washed in PBS.
Sections were incubated in horse serum (10%) at room temperature
for 40 min. Sections were then incubated in PBS containing 1%
bovine serum albumin (pH 7.4) overnight followed by secondary
antibody. The TFAM (K-18′ cat. no. sc19050; goat anti-human) and
Nrf1 (h-300; cat no. 33771; rabbit anti-human) antibodies (Santa
Cruz Biotechnology, Inc., Dallas, TX, USA) were used at final
dilutions of 1:100 and 1:1,000 overnight at 4°C respectively.
Immunostaining was conducted using the Dako EnVision System with
diaminobenzidine according to the manufacturer's protocol (Dako,
Glostrup, Denmark). AperioImageScope v11.2.2.752 software
(http://aperio-imagescope.software.Informer.com) was
used to capture images, which were then independently evaluated by
two experienced pathologists who were blind to the
clinicopathological factors of the patients in the present study.
Any discrepancy was resolved by consulting a third pathologist.
Semi-quantitative criteria
A semi-quantitative evaluation of Nrf1 and TFAM
positive staining in IHC was performed using a previously described
method (15). Briefly, five
representative images from IHC for Nrf1 and TFAM were captured from
each section at a high magnification (×200). The staining intensity
compared with the background and the percentage of positive cells
were determined in a blind manner. The percentage of positive cells
was divided into five grades (percentage scores): 0, <10; 1,
10–25; 2, 26–50; 3, 51–75; and 4, >75%. The intensity of
staining was divided into four grades (intensity scores): 0, no
staining; 1, light brown; 2, brown; and 3, dark brown. The total
scores (percentage score × intensity score) ranged from 0 to 12,
and were divided into low expression (0–2) or high expression
(3–12)
groups.
Clinicopathological parameters and
their classifications
Estrogen receptor (ER) and progesterone receptor
(PR) status were classified thus: Cells positive for ER and PR had
immunoreactivity in the nuclei with or without cytoplasmic staining
in IHC. The nucleus was a major site where immunoreactivity existed
for ER and PR, and cells with only cytoplasmic immunoreactivity
were regarded as negative for ER or PR. ER and PR expression was
determined according to the percentage of positive cells: Negative,
≤10%; positive, >10%.
Erb-b2 receptor tyrosine kinase 2 (HER2) protein
expression was assessed by IHC. Cells were regarded as positive for
HER2 when 3+ was noted in IHC or 2+ was present in IHC and
simultaneous positive staining was observed in fluorescence in
situ hybridization (FISH) (16).
FISH analysis was performed using the PathVysion HER-2 probe kit
(Abbott Pharmaceutical Co. Ltd., Lake Bluff, IL, USA). There were
two fluorescent-labelled probes: LSI (locus-specific identifier)
HER-2 specific for the HER-2 gene locus (17q11) and CEP (chromosome
enumeration probe) 17 specific for the α satellite DNA sequence at
the centromeric region of chromosome 17. Paraffin sections of 3–4
mm thickness using a microtome were cut and were floated in a
protein-free water bath at 40°C. The sections were mounted on
poly-L-Lysine coated slides and allowed to dry. The slides were
kept overnight at 56°C. The slides were deparaffinized in xylene at
room temperature for 20 min and dehydrated in 100% ethanol for 15
min at room temperature and air dried. The slides were treated with
pretreatment solution (sodium thiocyanite) and protease solution
for 15 min, and were dehydrated with 70, 80 and 100% alcohol for 5
min each and air dried. The probe was denatured at 80°C for 5 min,
applied to the cover slip and placed in humidified chamber for
overnight incubation. Post-hybridization washes were given with
0.4% sodium saline citrate 40 at 37°C. Following removal of the
cover slips the slides were dipped in post-hybridization buffer for
18 sec, dried completely in darkness and 10 µl DAPI was applied.
The slides were screened under a fluorescent microscope (Olympus
Corporation, Tokyo, Japan) using appropriate filters (DAPI, FITC,
TRITC dual and triple band pass filters). Signals were counted in
at least 200 cells for both the HER-2/neu gene and chromosome 17
centromere signals under oil immersion at ×1,000 magnification
using recommended filters. Results are expressed as the ratio of
HER-2/neu signal (orange) to centromere 17 signal (green) and the
readings were read as follows; the expected ratio 1–1.8 indicates
no gene amplification (negative), a ratio of >2.2 as HER-2/neu
gene amplification (positive), and a ratio between 1.8 and 2.2 as
equivocal cases. The polysomy 17 was also recorded in the cells as
four spec green signals as moderate polysomy and >4 spec green
signals as high polysomy.
Menopause was defined when one of following
conditions was present: i) patients received bilateral
oophorectomy; ii) patients were ≥60 years old; iii) patients were
<60 years old, but follicle-stimulating hormone (FSH) and
estradiol levels were in the postmenopausal range. The menopause
could not be determined in patients who were receiving luteinizing
hormone-releasing hormone agonists or antagonists, and amenorrhea
was not enough to determine menopause in premenopausal women
receiving adjunctive chemotherapy. Under these conditions, repeated
measurements of FSH and/or estradiol were required to determine
whether there was a menopausal status in these patients.
Histological grading was based on the
semiquantitative evaluation of three morphologic features
(percentage of tubule formation, degree of nuclear pleomorphism,
and accurate mitotic count in a defined field area) with a 3-point
grading system (1, good, to 3, poor). The numerical score assigned
to each feature was used in the compilation of an overall grade:
Scores 3–5, grade 1; scores 6–7, grade 2; scores 8–9, grade 3
(17).
The number of involved lymph nodes was scored thus:
1 involved lymph node, 1; 1–3 lymph nodes, 2; 4–9 lymph nodes, 3;
≥10 lymph nodes, 4.
Statistical analysis
SPSS 19.0 software (IBM Corp., Armonk, NY, USA) and
GraphPad software (version 5.01; GraphPad Software, Inc., La Jolla,
CA, USA) were used for statistical analysis and image processing,
respectively. The protein expression of Nrf1 and TFAM in breast
cancer tissues were compared with adjacent normal tissues using the
Wilcoxon rank sum test. Associations between Nrf1 and TFAM
expression and clinicopathological features were assessed using
Pearson's χ2 test. Multivariate analysis was performed
using logistic regression. Overall survival (OS) was measured from
the date of diagnosis until mortality or the last follow-up.
Patients alive were censored at the time of last contact. OS rates
were estimated using the Kaplan-Meier method and compared using the
log-rank test. The Cox proportional hazards regression model was
performed for univariate and multivariate survival analysis.
P<0.05 was considered to indicate a statistically significant
difference.
Results
Nrf1 and TFAM expression in breast
cancer and adjacent normal tissues
Nrf1 and TFAM protein expression was measured in 336
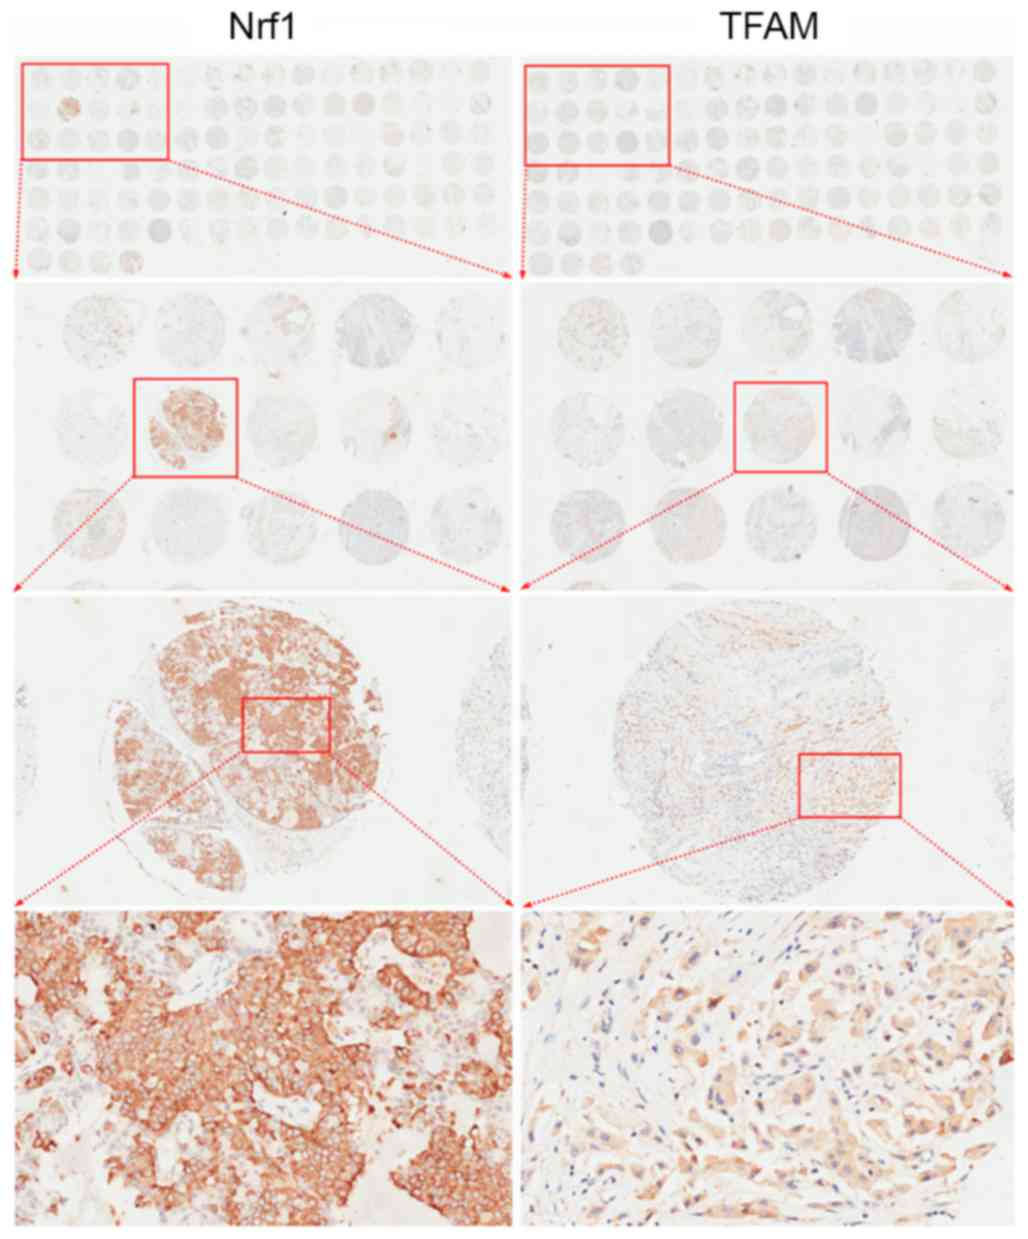
patients with TMAs. Fig. 1 presents
the arrangement of representative TMAs and images captured at
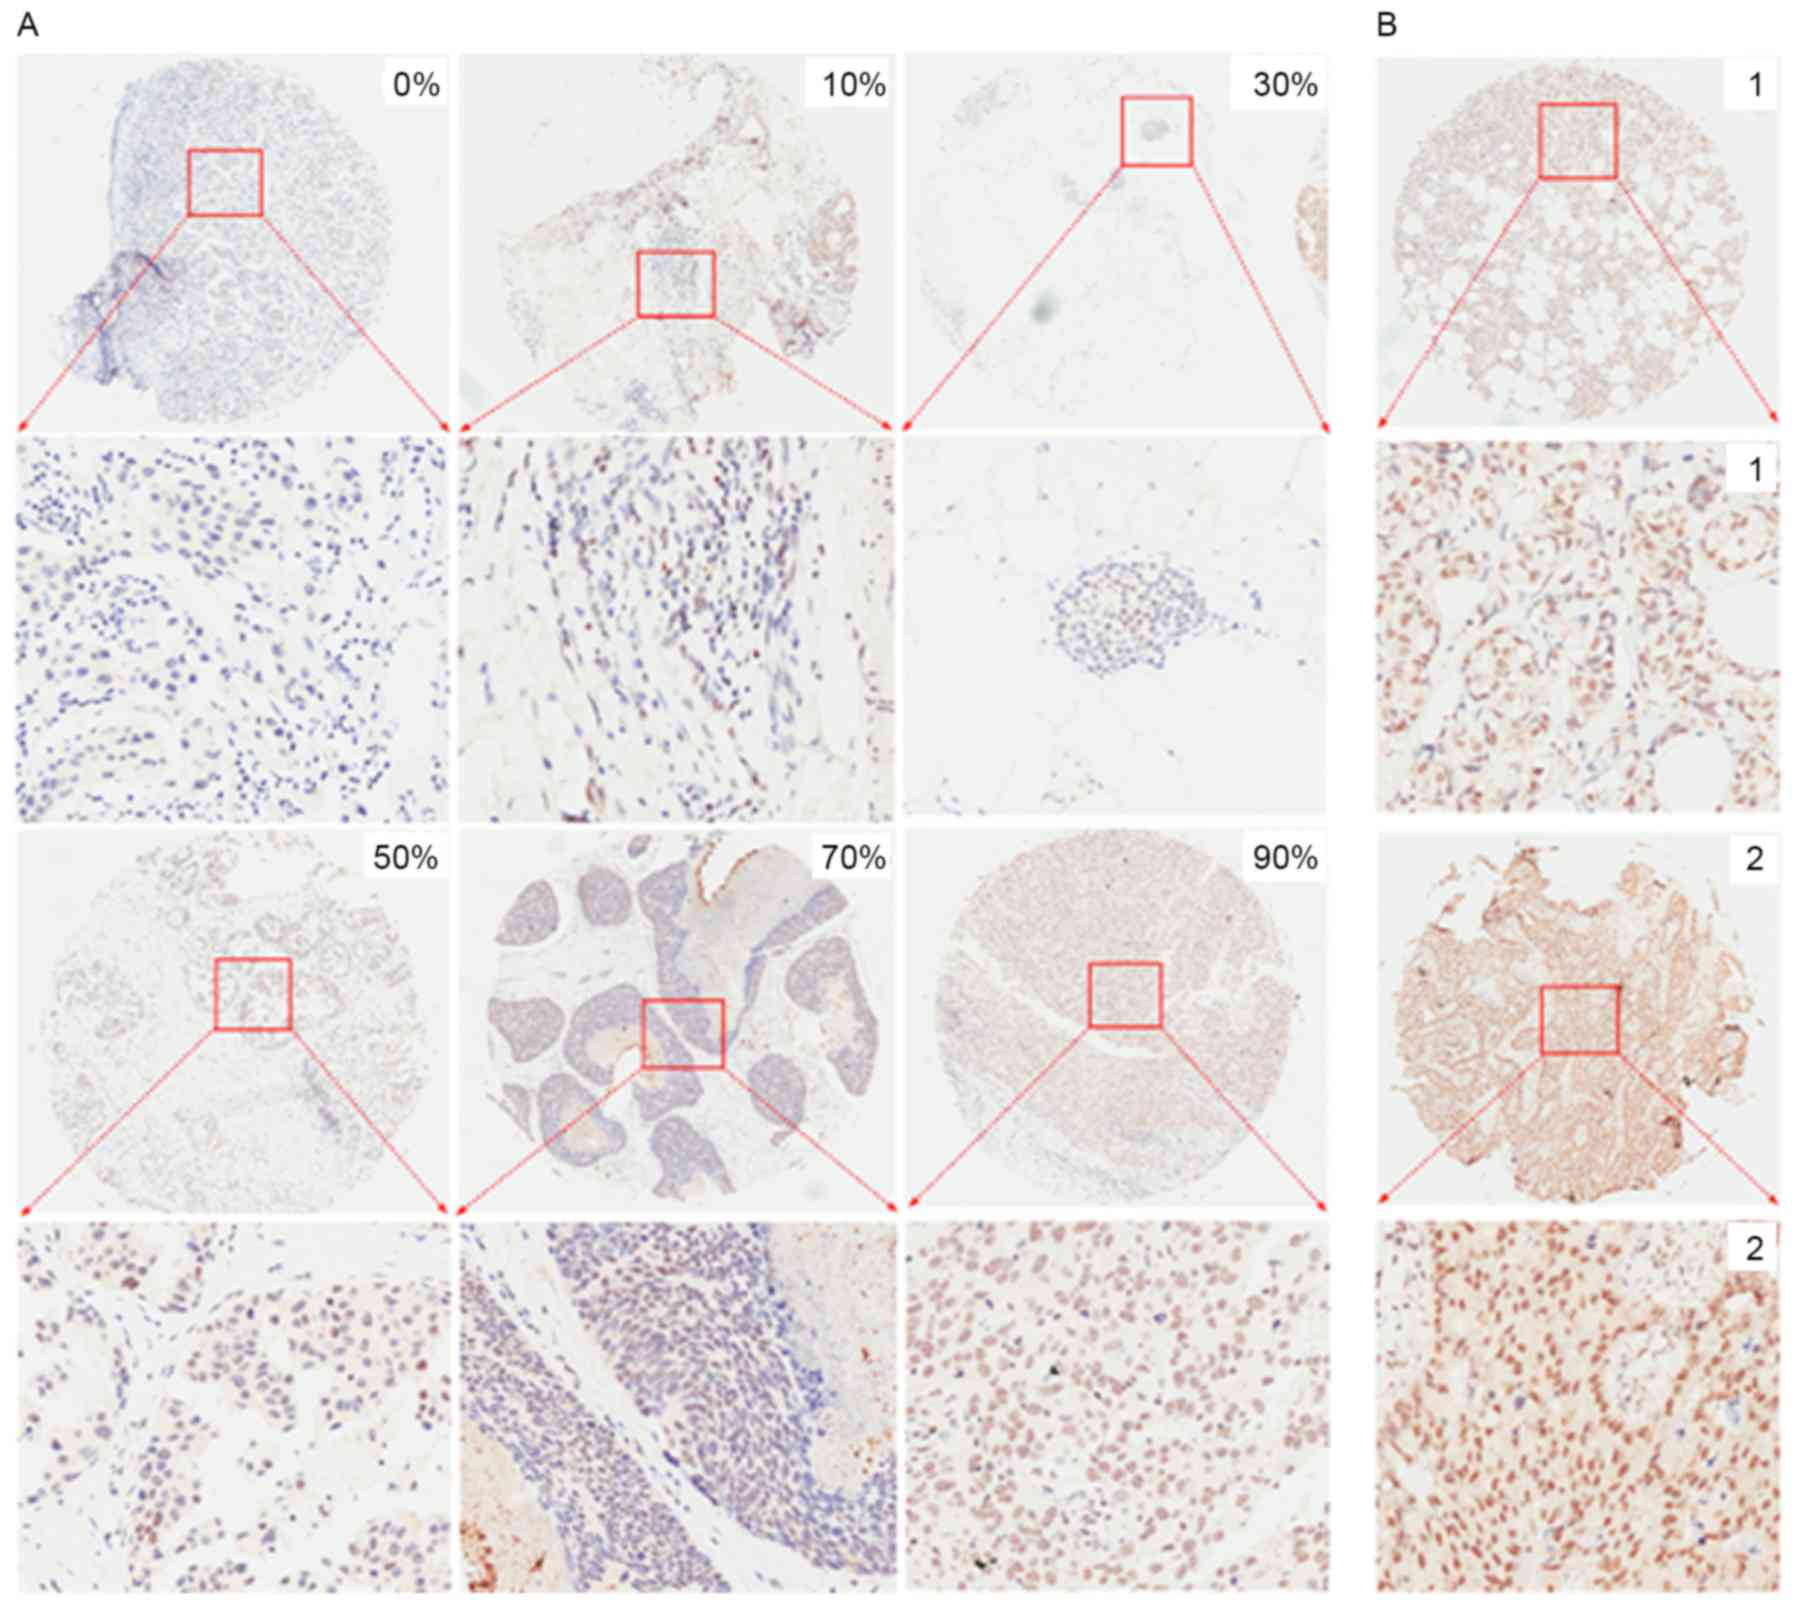
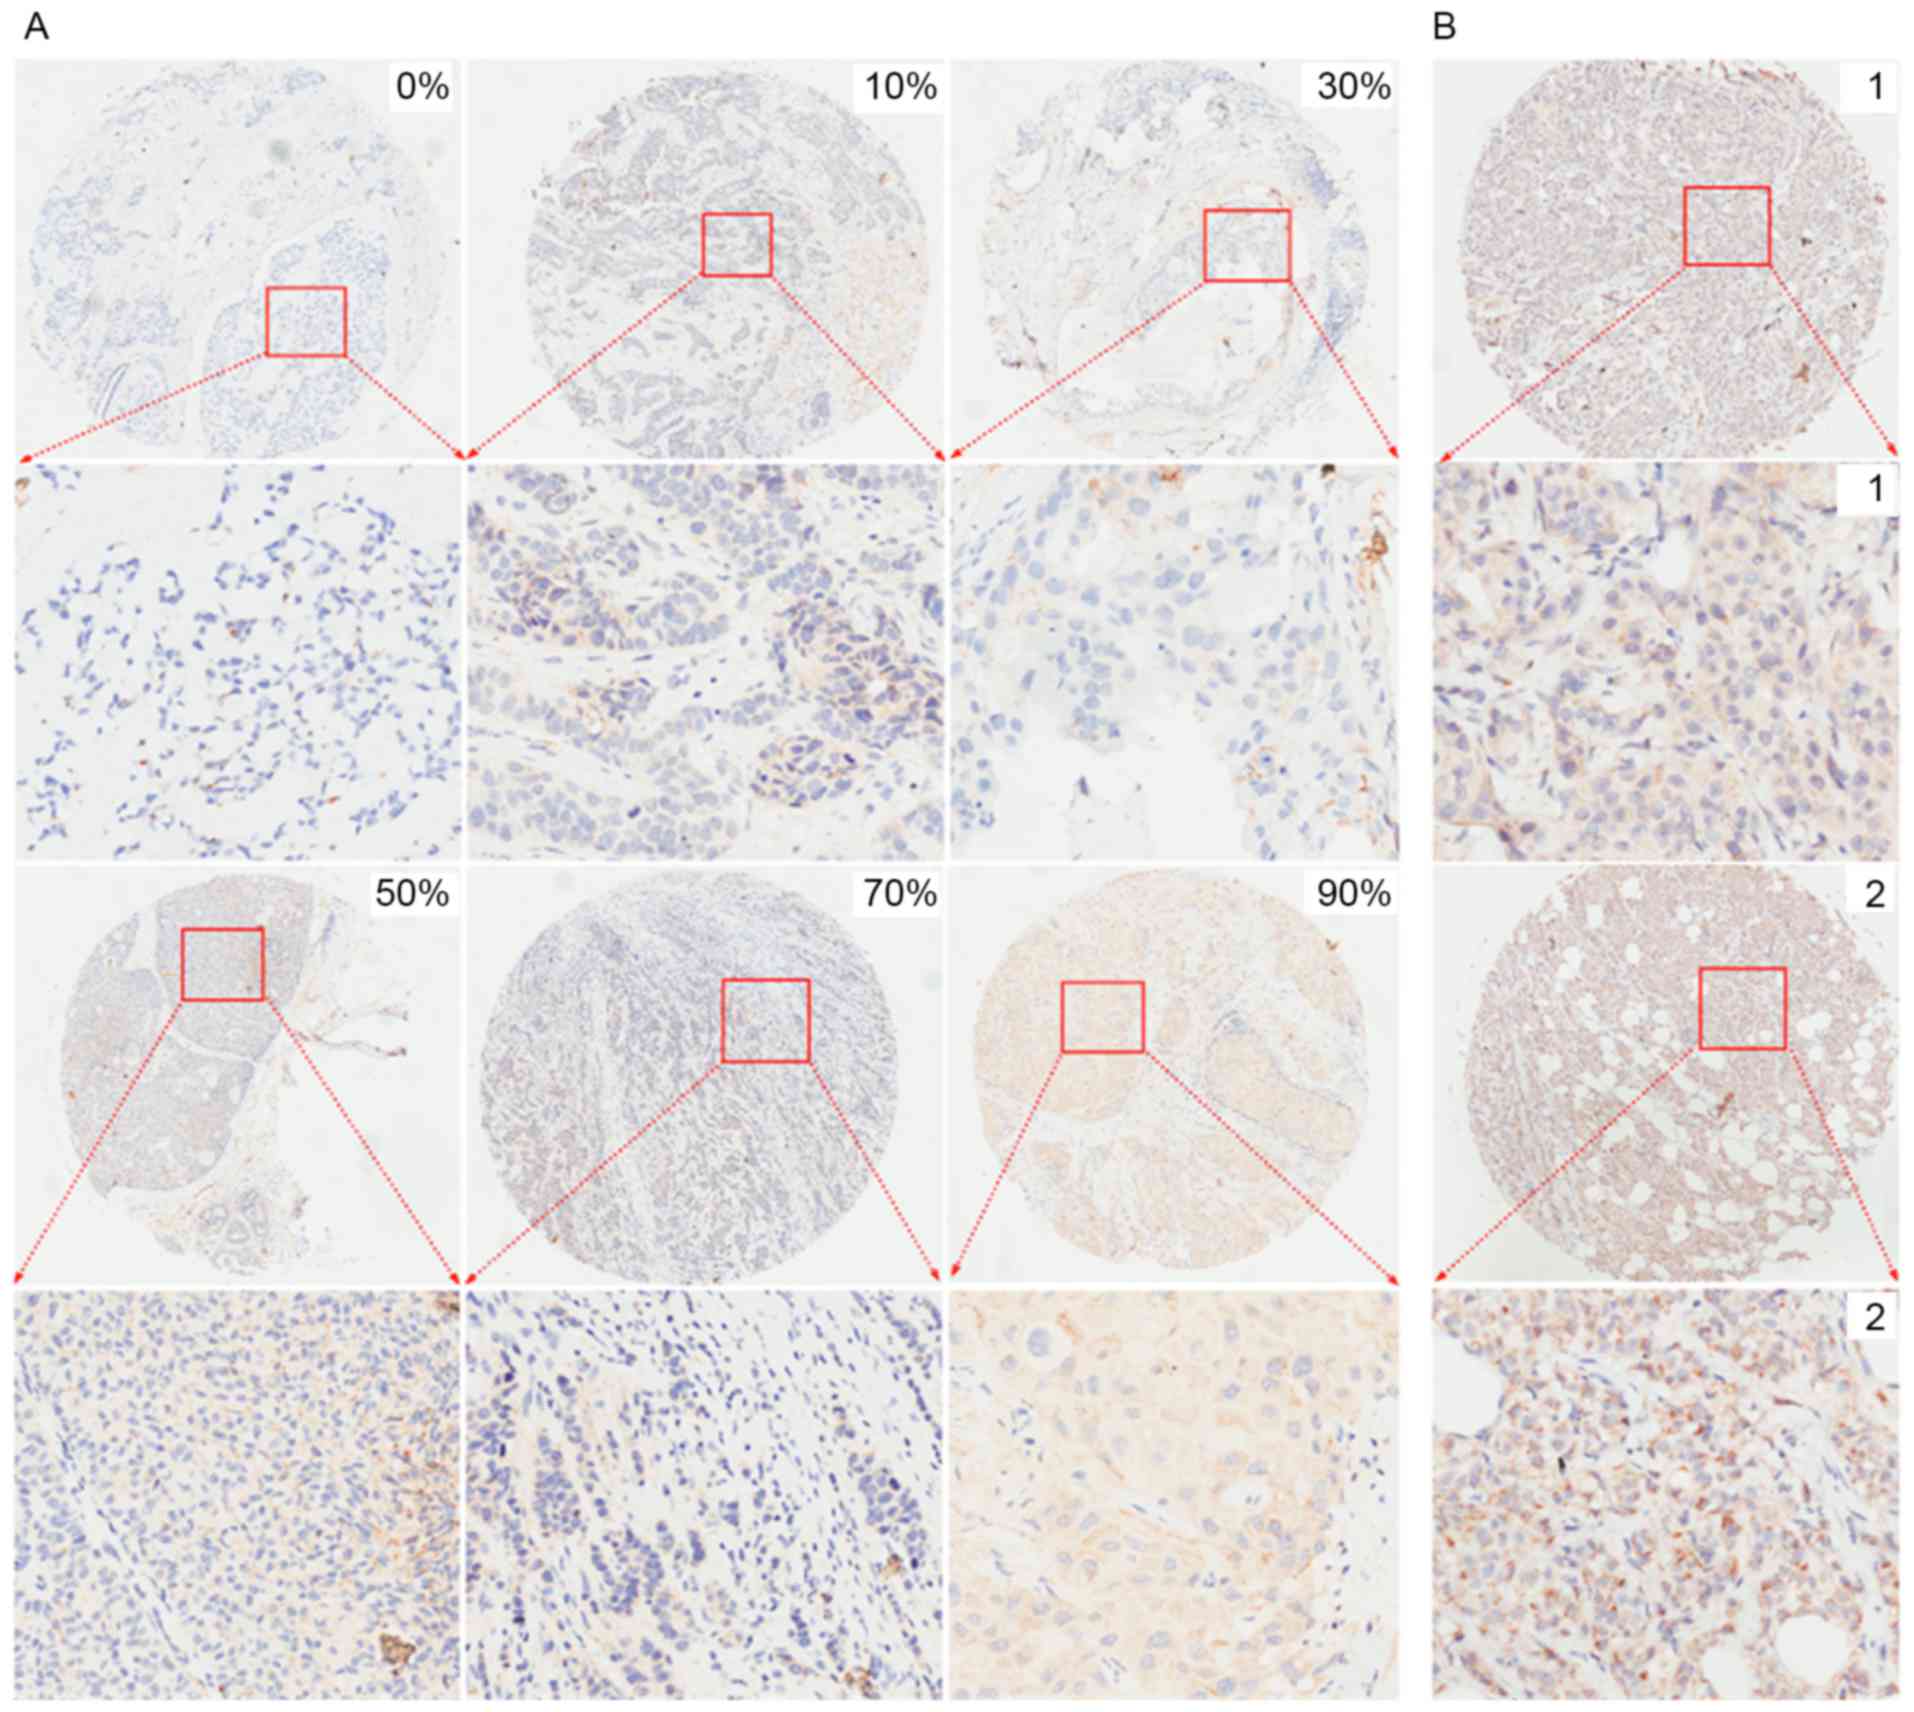
different magnifications following IHC analysis. Representative
images with different percentages of positive cells and different
staining intensities captured following immunohistochemistry for
Nrf1 and TFAM are presented in Figs.
2 and 3, respectively. For
sections without positive cells (0%), the staining intensity was
also classified as 0. The majority of Nrf1-positive cells had brown
staining in the nuclei (Fig. 2) with
only a fraction of cancer cells expressing Nrf1 in the cytoplasm
(Fig. 1) or in the nuclei and
cytoplasm (data not shown). TFAM expression was observed in the
cytoplasm of breast cancer cells (Fig.
3).
The association between Nrf1 and TFAM expression was
evaluated in 336 patients. Paired χ2 tests revealed that
Nrf1 and TFAM expression were not significantly associated
(κ=0.057, P=0.258). The positive rate of Nrf1 expression was
significantly increased compared with TFAM in breast cancer cells
(75.3% compared with 57.1%; P<0.001). Nrf1 binds to the promoter
of TFAM to initiate TFAM expression (6,7). The
results of the present study demonstrated that the alteration of
Nrf1 expression was not parallel to that of TFAM in breast cancer
cells, suggesting that, besides Nrf1, there are additional
mechanisms regulating TFAM expression.
Nrf1 and TFAM expression is increased
in breast cancer tissues compared with adjacent normal tissues
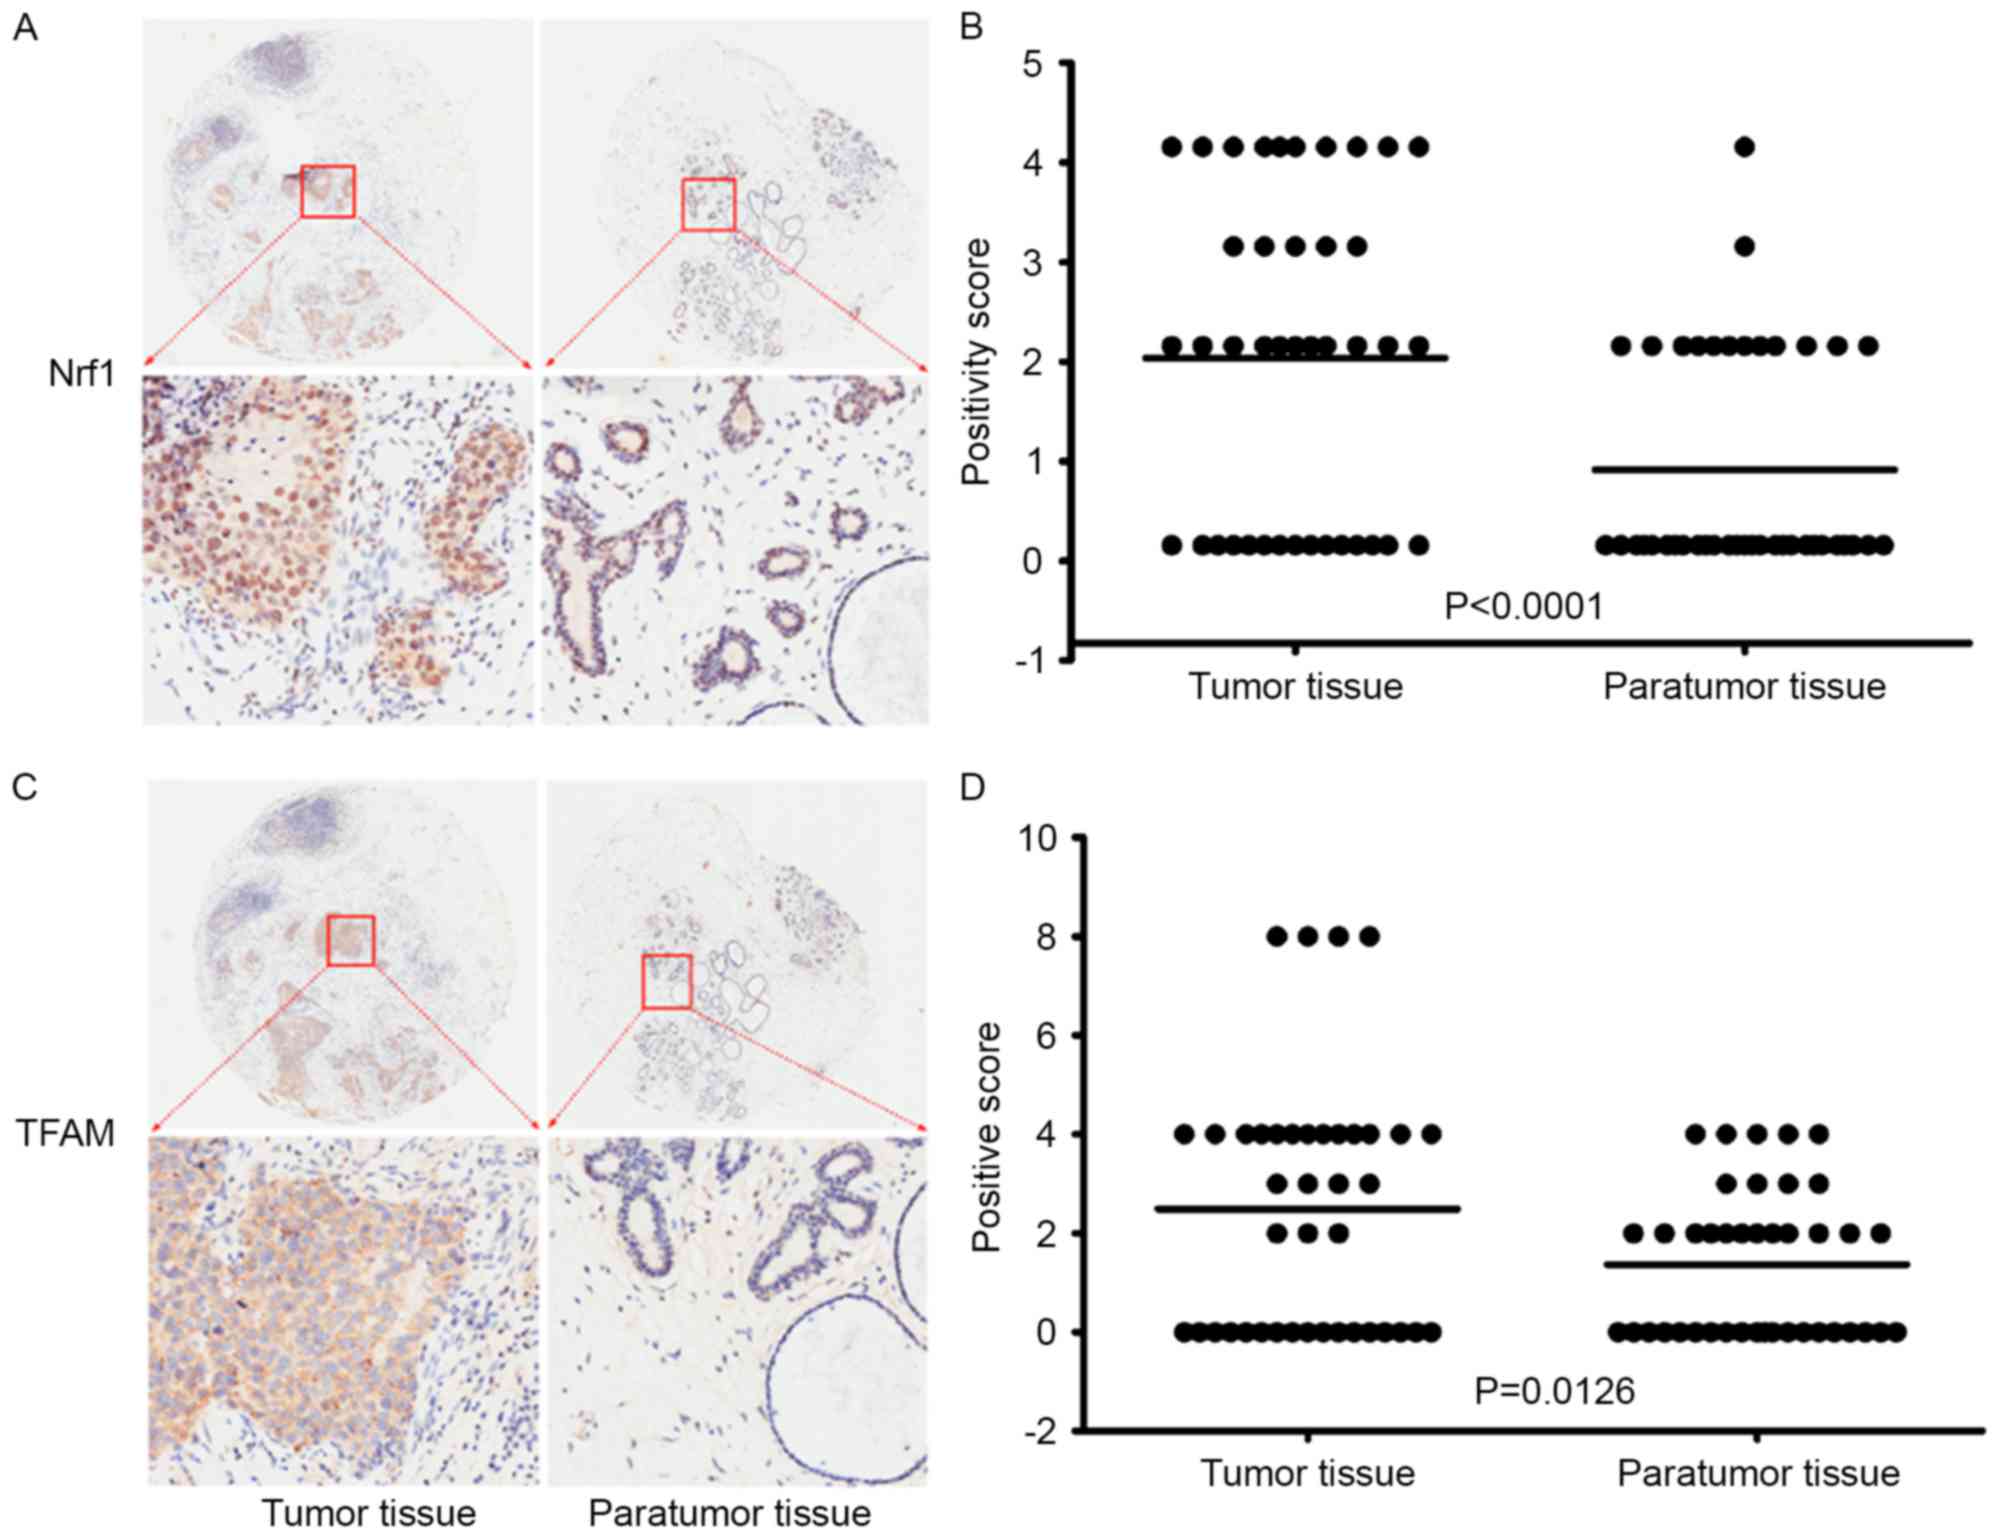
To investigate the involvement of Nrf1 and TFAM in
the occurrence and development of breast cancer, Nrf1 and TFAM
expression was compared in breast cancer tissues and in the
corresponding adjacent normal tissues from 41 patients (Table II). For Nrf1 positive cells, the mean
and median integrations were 1.878 [95% confidence interval (CI):
1.368–2.388] and 2.0 (25–75th percentile range: 0–3.5) in breast
cancer tissue, and 0.756 (95% CI: 0.405–1.107) and 0 (25–75th
percentile range: 0–2) in the adjacent normal tissues (Fig. 4A). Wilcoxon rank sum tests revealed
significant differences in the mean and median integrations between
breast cancer and adjacent normal tissues, with more Nrf1 positive
cells being observed in the breast cancer tissue compared with
normal tissues (P<0.0001; Fig.
4B). For TFAM-positive cells, the mean and median integrations
were 2.488 (95% CI: 1.686–3.290) and 3.0 (25–75th percentile range:
0–4) in the breast cancer tissue, and 1.366 (95% CI: 0.899–1.833)
and 2.0 (25–75th percentile range: 0–2) in the adjacent normal
tissues (Fig. 4C). Wilcoxon rank sum
tests revealed that the number of TFAM-positive cells in breast
cancer tissue was significantly higher than that in the adjacent
normal tissue (P=0.0126; Fig. 4D).
These results demonstrated that Nrf1 and TFAM protein expression
were significantly increased in breast cancer tissue compared with
adjacent normal tissues, suggesting that Nrf1 and TFAM may be
involved in the tumorigenesis of breast cancer and are potential
targets for the therapy of breast cancer.
| Table II.Clinical characteristics of the 41
patients where expression of Nrf1 and TFAM was evaluated in cancer
tissues and adjacent normal tissues. |
Table II.
Clinical characteristics of the 41
patients where expression of Nrf1 and TFAM was evaluated in cancer
tissues and adjacent normal tissues.
| Clinicopathological
variable | Value |
|---|
| Median age, years
(range) | 54 (41–76) |
| Menopausal status
(%) |
|
|
Premenopausal | 13 (31.7) |
|
Postmenopausal | 28 (68.3) |
| TNM stage (%) |
|
| I | 19 (46.3) |
| II | 18 (13.9) |
|
III | 4 (9.8) |
| Pathological
diagnosis (%) |
|
|
Invasive ductal carcinoma | 35 (85.4) |
|
Non-invasive ductal
carcinoma | 6 (14.6) |
| Histological grade
(%) |
|
| 1 | 0 (0.0) |
| 2 | 28 (68.3) |
| 3 | 13 (31.7) |
| Erb-b2 receptor
tyrosine kinase 2 status (%) |
|
|
Negative | 33 (80.5) |
|
Positive | 8 (19.5) |
| Estrogen receptor
status (%) |
|
|
Negative | 36 (87.8) |
|
Positive | 5 (12.2) |
| Progesterone
receptor status (%) |
|
|
Negative | 37 (90.2) |
|
Positive | 4 (9.8) |
Association of Nrf1 and TFAM
expression with clinicopathological features of patients with
breast cancer
Next, the associations between Nrf1 and TFAM protein
expression and the clinicopathological features of patients with
breast cancer were analyzed (Table
III). The results revealed that Nrf1 expression was
significantly associated with age, tumor size, number of metastatic
lymph nodes, tumor stage, tumor grade and HER2, ER and PR
expression status, but there was no significant association with
menopause status or pathological type of breast cancer. Patients
<45 years old had significantly increased Nrf1 expression
compared with older patients (84.7 vs. 72.7%). Nrf1 expression in
patients with a tumor size >2 cm, more metastatic lymph nodes or
breast cancer at >TNM stage II or >grade 2 was significantly
increased. Patients positive for HER2, ER and PR had markedly
higher Nrf1 expression than patients negative for these
factors.
| Table III.Associations between Nrf1 and TFAM
expression and clinicopathological features. |
Table III.
Associations between Nrf1 and TFAM
expression and clinicopathological features.
|
| Nrf1 | TFAM |
|---|
|
|
|
|
|---|
| Clinicopathological
variable | Negative | Positive |
χ2/P-value | Negative | Positive |
χ2/P-value |
|---|
| Age at diagnosis,
years |
|
| 4.376/0.036 |
|
| 0.589/0.443 |
|
≤45 | 11 | 61 |
| 28 | 44 |
|
|
>45 | 72 | 192 |
| 116 | 148 |
|
| Menopausal
status |
|
| 2.769/0.096 |
|
| 0.001/0.975 |
|
Premenopausal | 31 | 121 |
| 65 | 87 |
|
|
Postmenopausal | 52 | 132 |
| 79 | 105 |
|
| Tumor size, cm |
|
|
25.925/<0.001 |
|
|
28.329/<0.001 |
| ≤2 | 40 | 80 |
| 54 | 66 |
|
|
2–5 | 36 | 148 |
| 63 | 121 |
|
| ≥5 | 7 | 25 |
| 27 | 5 |
|
| Lymph node
metastasis |
|
| 10.763/0.005 |
|
| 5.609/0.061 |
|
0–1 | 67 | 198 |
| 106 | 159 |
|
| 2 | 16 | 30 |
| 27 | 19 |
|
|
3–4 | 0 | 25 |
| 11 | 14 |
|
|
Tumor-node-metastasis stage |
|
|
35.243/<0.001 |
|
| 3.283/0.194 |
| I | 34 | 70 |
| 43 | 61 |
|
| II | 13 | 182 |
| 80 | 115 |
|
|
III | 5 | 32 |
| 21 | 16 |
|
| Pathological
diagnosis |
|
| 2.276/0.131 |
|
|
<0.001/1.000 |
|
Invasive ductal carcinoma | 74 | 238 |
| 135 | 180 |
|
|
Non-invasive ductal
carcinoma | 9 | 15 |
| 9 | 12 |
|
| Histology
grade |
|
| 2.157/0.034 |
|
| 2.379/0.304 |
| 1 | 6 | 10 |
| 4 | 12 |
|
| 2 | 49 | 167 |
| 89 | 127 |
|
| 3 | 28 | 76 |
| 47 | 57 |
|
| Erb-b2 receptor
tyrosine kinase 2 status |
|
| 5.379/0.020 |
|
| 5.600/0.018 |
|
Negative | 76 | 204 |
| 112 | 168 |
|
|
Positive | 7 | 49 |
| 32 | 24 |
|
| Estrogen receptor
status |
|
| 10.015/0.002 |
|
|
26.675/<0.001 |
|
Negative | 50 | 102 |
| 64 | 88 |
|
|
Positive | 33 | 151 |
| 80 | 104 |
|
| Progesterone
receptor status |
|
|
13.124/<0.001 |
|
|
35.754/<0.001 |
|
Negative | 63 | 135 |
| 87 | 111 |
|
|
Positive | 20 | 118 |
| 7 | 81 |
|
TFAM expression was also associated with the tumor
size and HER2, ER and PR status. Patients positive for HER2, ER and
PR had increased TFAM expression compared with those who were not,
while patients with tumor size of >2 cm had a slight reduction
in TFAM expression. These results indicated that Nrf1 and TFAM
expression is associated with factors associated with the clinical
outcome of patients with breast cancer, and thus may serve as
important predictors for patients for breast cancer.
Association between Nrf1 and TFAM
expression and the clinical prognosis of breast cancer
To further evaluate the associations between Nrf1
and TFAM expression and the clinical prognosis of patients with
breast cancer, the relationship between Nrf1 and TFAM expression
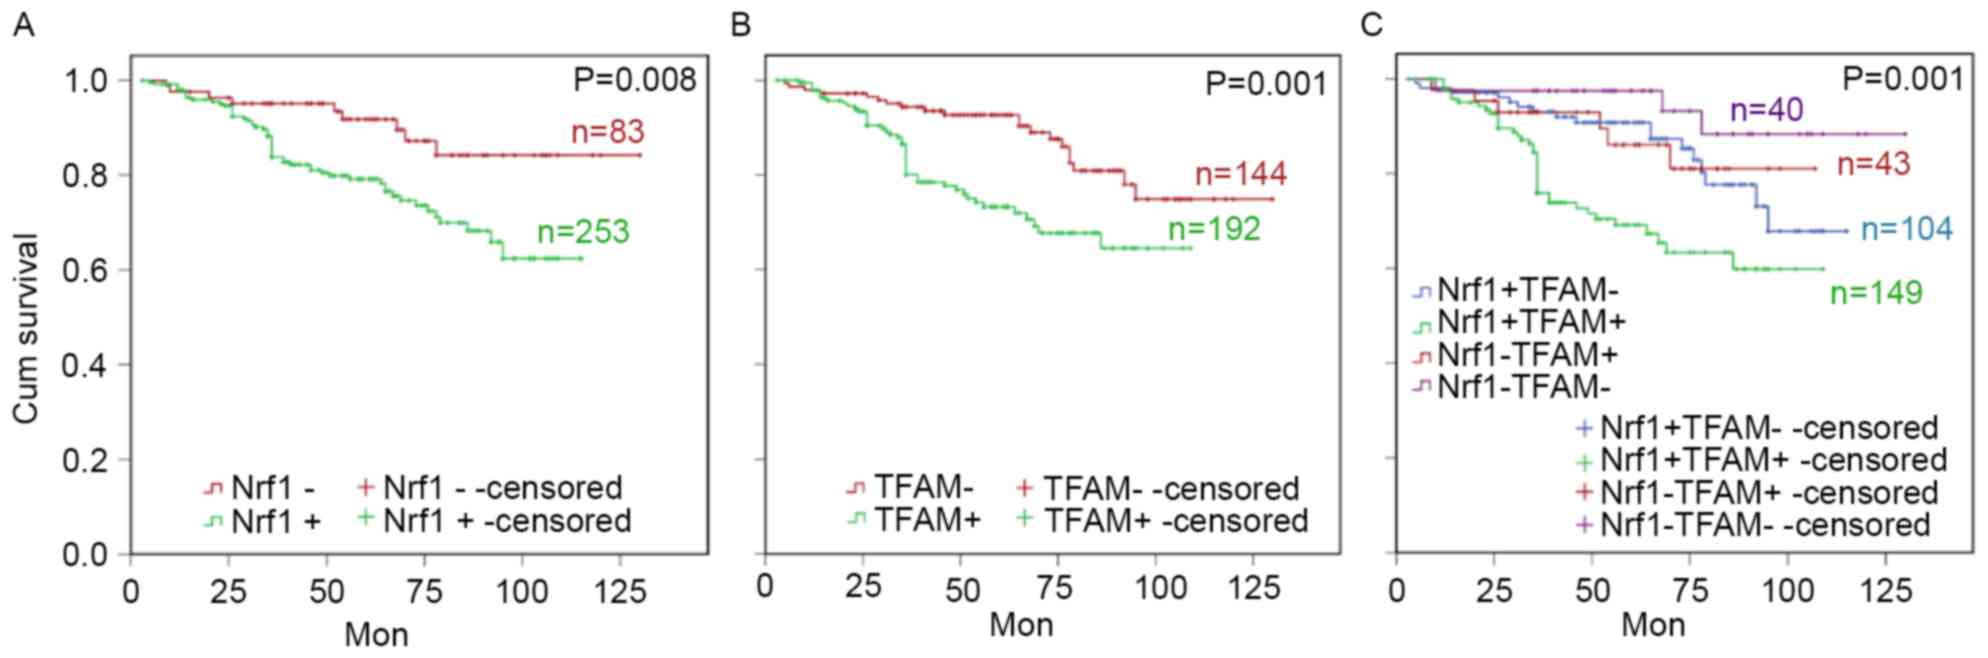
and survival time was assessed. Survival analysis revealed that
patients with breast cancer with higher Nrf1 or TFAM expression had
a poorer clinical prognosis, as demonstrated by a shorter survival
time (Fig. 5A and B). At the
predesigned time points, the expected survival time was 91.76
months (95% CI: 86.56–96.96, P=0.008) in patients positive for
Nrf1, which was significantly shorter than in Nrf1-negative
patients (117.55 months; 95% CI: 109.95–125.15). The expected
survival time was 85.56 months (95% CI: 79.78–91.35) in patients
positive for TFAM, which was significantly shorter than in
TFAM-negative patients (113.46 months; 95% CI: 106.88–120.035,
P=0.001). Furthermore, patients positive for Nrf1 and TRAM had the
shortest survival time (82.07 months, 95% CI: 75.154–88.99) and
those negative for both Nrf1 and TRAM had the longest survival time
(121.82 months, 95% CI: 113.01–130.63; P<0.001; Fig. 5C). These results revealed that Nrf1 or
TFAM-positive patients had a shorter survival time, and Nrf1 and
TRAM-double positive patients had a poorer clinical outcome. To
explore whether Nrf1 and TFAM expression was an independent
predictor of survival, univariate and multivariate analyses were
performed using the Cox proportional hazards model. As presented in
Table IV, Nrf1 expression was
independently associated with the prognosis of patients (P=0.034),
together with TFAM (P=0.048), HER2 (P=0.042), PR (P=0.039) and TNM
stages (P=0.028). These results suggest that Nrf1 and TFAM may
serve as predictors for breast cancer prognosis, and the combined
use of Nrf1 and TFAM may assist risk stratification and subsequent
therapy of breast cancer.
| Table IV.Univariate and multivariate analysis
of overall survival the enrolled 336 patients with breast
cancer. |
Table IV.
Univariate and multivariate analysis
of overall survival the enrolled 336 patients with breast
cancer.
|
| Univariate
analysis | Multivariate
analysis |
|---|
|
|
|
|
|---|
| Factor | HR | 95% CI | P-value | HR | 95% CI | P-value |
|---|
| Age | 1.119 | 0.926–1.313 | 0.854 |
|
|
|
| Menopausal | 1.959 | 0.793–3.125 | 0.485 |
|
|
|
| Histology
grade | 2.397 | 0.581–4.212 | 0.092 |
|
|
|
| TNM | 6.365 | 3.884–15.845 | 0.005 | 3.645 | 0.968–7.743 | 0.028 |
| HER2 | 3.245 | 1.263–6.235 | 0.012 | 2.026 | 0.668–5.035 | 0.042 |
| ER | 2.826 | 1.035–5.014 | 0.045 | 1.869 | 0.893–3.254 | 0.051 |
| PR | 2.956 | 1.156–5.426 | 0.031 | 1.926 | 0.998–3.547 | 0.039 |
| Nrf1 | 4.896 | 2.552–13.312 | 0.001 | 3.154 | 1.021–7.216 | 0.034 |
| TFAM | 3.936 | 0.031–0.435 | 0.009 | 2.536 | 0.649–5.268 | 0.048 |
Discussion
The mitochondrion is an important organelle in
eukaryotic cells, and is the site where intracellular oxidative
phosphorylation and ATP synthesis occur. Each mitochondrion is
estimated to contain 2–10 copies of mtDNA, which are unique
extranuclear genetic materials that self-replicate and are involved
in transcription and encoding. The synthesis and degradation of
mtDNA is very rapid, independent of the cell cycle, and is
controlled by complex regulatory mechanisms. Furthermore, mtDNA has
poor stability, its synthesis and degradation is susceptible to
exogenous factors, and the mtDNA mutation rate is 10 times greater
than that of nuclear DNA. Mitochondria are also involved in
important cellular activities including cell differentiation,
communication, apoptosis and energy metabolism, but the specific
mechanisms underlying these are still poorly understood (4). An analysis of genome-wide
transcriptional profiling data revealed that ~40 transcripts were
significantly elevated in human breast cancer cells compared with
adjacent stromal tissues, and immunohistochemistry revealed that 15
markers of mitochondrial biogenesis and/or mitochondrial
translation (including Nrf1 and TFAM) were highly expressed in
epithelial breast cancer cells (18).
In estrogen-induced breast carcinogenesis, Nrf1 expression markedly
increased in MCF-10A cells (19).
Furthermore, the mRNA and protein levels of Nrf1 and/or TFAM were
revealed to dramatically increase in different types of breast
cancer (12,13). These results indicate that Nrf1 and
TFAM expression may be associated with the occurrence and
development of breast cancer.
TFAM is encoded by a gene mapped to chromosome10q21
and belongs to the high mobility group box family. Human TFAM may
directly bind to the heavy and light chain promoters to activate
the transcription of mitochondrial genes and regulate mtDNA copies,
which is essential for the functional integrity of mitochondrial
respiratory chain (20–22). TFAM overexpression results in an
increase in mtDNA copies, while TFAM knockout resulted in a
decrease in several murine organs and tissues (22,23). Cells
with TFAM deficiency demonstrated a significant increase in cell
apoptosis (21,24). At the initial stage of p53 dependent
apoptosis, p53 may bind to TFAM to strengthen the binding of TFAM
to DDP-damaged mtDNA, which may contribute to the maintenance and
repair of mtDNA structure and regulate p53-mediated cell apoptosis
(25). Yoshida et al (26) confirmed that TFAM preferentially
recognized DDP-damaged DNA. These results suggest that TFAM may
protect mtDNA against DDP-induced damage and promote repair of the
damaged mtDNA, implying that a high TFAM expression may contribute
to the resistance of cancer cells to DDP-based chemotherapy,
thereby influencing the clinical outcome.
The proximal promoter of the TFAM gene
contains the binding sites of specificity protein 1 (SP1), Nrf1 and
nuclear respiratory factor-2 (Nrf2). Nrf1 binding is a determinant
for the bioactivity of TFAM. Mutation or methylation of the Nrf1
binding site on the TFAM gene may significantly reduce
TFAM transcription, while Nrf1 phosphorylation may stimulate
it. Furthermore, SP1 and Nrf2-induced TFAM transcription
also requires Nrf1 binding (27,28). Thus,
Nrf1 is functionally associated with TFAM and is regarded as
an important regulator of TFAM. Nrf1, together with TFAM,
may regulate the expression of a variety of mitochondrial
functional proteins, including those involved in oxidative
phosphorylation, complex I–V, mtDNA transcription and replication,
protein import and assembly, ion channels, shuttle and translation
(29). Thus, evaluation of Nrf1 and
TFAM expression in breast cancer and adjacent normal tissues, and
their predictive value, will assist in the identification of novel
targets for the individualized therapy of breast cancer, the risk
stratification of breast cancer, and the improvement of clinical
therapeutic efficacy and prognosis of patients with breast
cancer.
In the present study, Nrf1 and TFAM expression was
assessed in breast cancer tissues and adjacent normal tissues of
336 patients by immunohistochemistry, and the associations with
clinicopathological features were further evaluated in these
patients. The results of the present study revealed that Nrf1 and
TFAM expression was significantly higher in breast cancer tissue
compared with adjacent normal tissues, suggesting that high
expression of Nrf1 and TFAM may contribute to the high energy
metabolism of breast cancer cells. In estrogen-induced breast
carcinogenesis in MCF-10A cells, Nrf1 expression markedly
increased, further supporting the conclusion that Nrf1 and TFAM are
involved in the tumorigenesis of breast cancer (18). However, further investigation revealed
that the Nrf1-positive rate was higher than the TFAM-positive rate
in breast cancer tissues. This may be explained by the fact that
Nrf1-induced transcription of TFAM is associated with not
only Nrf1 expression levels, but also Nrf1 phosphorylation and
methylation (27,28).
Statistical analysis revealed that high expression
of Nrf1 and TFAM was associated with several clinicopathological
features associated with the prognosis of breast cancer. Patients
with increased Nrf1 or TFAM expression had a shorter survival time,
and survival was shortest in patients positive for Nrf1 and TFAM.
Considering that Nrf1 is able to regulate TFAM expression,
Nrf1 may effectively activate TFAM and its downstream signaling
pathway in patients positive for Nf1 and TFAM. Cancer cells in
these patients may have a more active energy metabolism, increased
proliferation and invasion, and elevated resistance to routine
radiotherapy or chemotherapy, resulting in a poorer clinical
prognosis. The significant associations with HER2, ER, PR
expression status and Nf1 or TFAM expression indicates that HER2,
ER and PR may be involved in the protective mechanism of TFAM
against DDP-mediated mtDNA damage. More mechanistic studies,
however, are required to further clarify the potential associations
between expression of these proteins and their function in the
etiology of breast cancers.
In summary, to the best of our knowledge, the
results of the present study are the first to provide clinical
evidence that Nrf1 and/or TFAM expression significantly increase in
breast cancer compared with adjacent normal tissues. In addition,
patients positive for Nrf1 or TFAM have a relatively poor clinical
prognosis, and those positive for Nrf1 and TFAM have the shortest
survival time. These results suggest that Nrf1 and/or TFAM
expression may be useful as a parameter for the determination of
individualized therapy and the prognosis of breast cancer, and Nrf1
and TFAM may be novel targets for the development of targeted
therapies to reduce the resistance of breast cancer cells to
chemotherapeutics.
Acknowledgements
The present study was supported by the Natural
Science Foundation of Shanghai Science and Technology Commission
(grant no. 14ZR1408800) and the National Natural Science Foundation
of China (grant no. 81102249).
Glossary
Abbreviations
Abbreviations:
|
DDP
|
cisplatin
|
|
TFAM
|
mitochondrial transcription factor
A
|
|
Nrf1
|
nuclear respiratory factor-1
|
|
TMA
|
tissue microarray
|
|
IHC
|
immunohistochemistry
|
|
OS
|
overall survival
|
|
ATP
|
adenosine triphosphate
|
References
|
1
|
Siegel RL, Miller KD and Jemal A: Cancer
statistics, 2015. CA Cancer J Clin. 65:5–29. 2015. View Article : Google Scholar : PubMed/NCBI
|
|
2
|
Renatus M, Stennicke HR, Scott FL,
Liddington RC and Salvesen GS: Dimer formation drives the
activation of the cell death protease caspase 9. Proc Natl Acad Sci
USA. 98:pp. 14250–14255. 2001; View Article : Google Scholar : PubMed/NCBI
|
|
3
|
Acehan D, Jiang X, Morgan DG, Heuser JE,
Wang X and Akey CW: Three-dimensional structure of the apoptosome:
Implications for assembly, procaspase-9 binding and activation. Mol
Cell. 9:423–432. 2002. View Article : Google Scholar : PubMed/NCBI
|
|
4
|
Mei H, Sun S, Bai Y, Chen Y, Chai R and Li
H: Reduced mtDNA copy number increases the sensitivity of tumor
cells to chemotherapeutic drugs. Cell Death Dis. 6:e17102015.
View Article : Google Scholar : PubMed/NCBI
|
|
5
|
Jornayvaz FR and Shulman GI: Regulation of
mitochondrial biogenesis. Essays Biochem. 47:69–84. 2010.
View Article : Google Scholar : PubMed/NCBI
|
|
6
|
van Tienen FH, Lindsey PJ, van der Kallen
CJ and Smeets HJ: Prolonged Nrf1 overexpression triggers adipocyte
inflammation and insulin resistance. J Cell Biochem. 111:1575–1585.
2010. View Article : Google Scholar : PubMed/NCBI
|
|
7
|
Benner C, Konovalov S, Mackintosh C, Hutt
KR, Stunnenberg R and Garcia-Bassets I: Decoding a signature-based
model of transcription cofactor recruitment dictated by cardinal
cis-regulatory elements in proximal promoter regions. PLoS Genet.
9:e10039062013. View Article : Google Scholar : PubMed/NCBI
|
|
8
|
Lin CS, Lee HT, Lee SY, Shen YA, Wang LS,
Chen YJ and Wei YH: High mitochondrial DNA copy number and
bioenergetic function are associated with tumor invasion of
esophageal squamous cell carcinoma cell lines. Int J Mol Sci.
13:11228–11246. 2012. View Article : Google Scholar : PubMed/NCBI
|
|
9
|
Guo J, Zheng L and Liu W, Wang X, Wang Z,
Wang Z, French AJ, Kang D, Chen L, Thibodeau SN and Liu W: Frequent
truncating mutation of TFAM induces mitochondrial DNA depletion and
apoptotic resistance in microsatellite-unstable colorectal cancer.
Cancer Res. 71:2978–2987. 2011. View Article : Google Scholar : PubMed/NCBI
|
|
10
|
Vadrot N, Ghanem S, Braut F, Gavrilescu L,
Pilard N, Mansouri A, Moreau R and Reyl-Desmars F: Mitochondrial
DNA maintenance is regulated in human hepatoma cells by glycogen
synthase kinase 3β and p53 in response to tumor necrosis factor α.
PLoS One. 7:e408792012. View Article : Google Scholar : PubMed/NCBI
|
|
11
|
Mo M, Peng F, Wang L, Peng L, Lan G and Yu
S: Roles of mitochondrial transcription factor A and
microRNA-590-3p in the development of bladder cancer. Oncol Lett.
6:617–623. 2013.PubMed/NCBI
|
|
12
|
Yao J, Zhou E, Wang Y, Xu F, Zhang D and
Zhong D: microRNA-200a inhibits cell proliferation by targeting
mitochondrial transcription factor A in breast cancer. DNA Cell
Biol. 33:291–300. 2014. View Article : Google Scholar : PubMed/NCBI
|
|
13
|
Fuchinoue F, Hirotani Y, Nakanishi Y,
Yamaguchi H, Nishimaki H, Noda H, Tang XY, Iizuka M, Amano S,
Sugitani M, et al: Overexpression of PGC1α and accumulation of p62
in apocrine carcinoma of the breast. Pathol Int. 65:19–26. 2015.
View Article : Google Scholar : PubMed/NCBI
|
|
14
|
Gradishar WJ, Anderson BO, Blair SL,
Burstein HJ, Cyr A, Elias AD, Farrar WB, Forero A, Giordano SH and
Goldstein LJ: NCCN Clinical Practice Guidelines in Oncology: Breast
Cancer, Version 3.2014. J Natl Compr Canc Netw. 12:542–590. 2014.
View Article : Google Scholar : PubMed/NCBI
|
|
15
|
Hu J, Wang N and Wang YJ: XRCC3 and RAD51
expression are associated with clinical factors in breast cancer.
PLoS One. 8:e721042013. View Article : Google Scholar : PubMed/NCBI
|
|
16
|
Wolff AC, Hammond ME, Hicks DG, Dowsett M,
McShane LM, Allison KH, Allred DC, Bartlett JM, Bilous M,
Fitzgibbons P, et al: Recommendations for human epidermal growth
factor receptor 2 testing in breast cancer: American Society of
Clinical Oncology/College of American Pathologists clinical
practice guideline update. J Clin Oncol. 31:3997–4013. 2013.
View Article : Google Scholar : PubMed/NCBI
|
|
17
|
Singletary SE, Allred C, Ashley P, Bassett
LW, Berry D, Bland KI, Borgen PI, Clark G, Edge SB, Hayes DF, et
al: Revision of the American Joint Committee on cancer staging
system for breast cancer. J Clin Oncol. 20:3628–3636. 2002.
View Article : Google Scholar : PubMed/NCBI
|
|
18
|
Sotgia F, Whitaker-Menezes D,
Martinez-Outschoorn UE, Salem AF, Tsirigos A, Lamb R, Sneddon S,
Hulit J, Howell A and Lisanti MP: Mitochondria ‘fuel’ breast cancer
metabolism: Fifteen markers of mitochondrial biogenesis label
epithelial cancer cells, but are excluded from adjacent stromal
cells. Cell Cycle. 11:4390–4401. 2012. View
Article : Google Scholar : PubMed/NCBI
|
|
19
|
Chatterjee A, Ronghe A, Singh B, Bhat NK,
Chen J and Bhat HK: Natural antioxidants exhibit chemopreventive
characteristics through the regulation of CNC b-Zip transcription
factors in estrogen-induced breast carcinogenesis. J Biochem Mol
Toxicol. 28:529–538. 2014. View Article : Google Scholar : PubMed/NCBI
|
|
20
|
Kang D, Kim SH and Hamasaki N:
Mitochondrial transcription factor A (TFAM): Roles in maintenance
of mtDNA and cellular functions. Mitochondrion. 7:39–44. 2007.
View Article : Google Scholar : PubMed/NCBI
|
|
21
|
Larsson NG, Wang J, Wilhelmsson H, Oldfors
A, Rustin P, Lewandoski M, Barsh GS and Clayton DA: Mitochondrial
transcription factor A is necessary for mtDNA maintenance and
embryogenesis in mice. Nat Genet. 18:231–236. 1998. View Article : Google Scholar : PubMed/NCBI
|
|
22
|
Ekstrand MI, Falkenberg M, Rantanen A,
Park CB, Gaspari M, Hultenby K, Rustin P, Gustafsson CM and Larsson
NG: Mitochondrial transcription factor A regulates mtDNA copy
number in mammals. Hum Mol Genet. 13:935–944. 2004. View Article : Google Scholar : PubMed/NCBI
|
|
23
|
Pohjoismäki JL, Wanrooij S, Hyvärinen AK,
Goffart S, Holt IJ, Spelbrink JN and Jacobs HT: Alterations to the
expression level of mitochondrial transcription factor A TFAM,
modify the mode of mitochondrial DNA replication in cultured human
cells. Nucleic Acids Res. 34:5815–5828. 2006. View Article : Google Scholar : PubMed/NCBI
|
|
24
|
Wang J, Silva JP, Gustafsson CM, Rustin P
and Larsson NG: Increased in vivo apoptosis in cells lacking
mitochondrial DNA gene expression. Proc Natl Acad Sci USA. 98:pp.
4038–4043. 2001; View Article : Google Scholar : PubMed/NCBI
|
|
25
|
Choi YS, Kim S and Pak YK: Mitochondrial
transcription factor A (mtTFA) and diabetes. Diabetes Res Clin
Pract. 54 Suppl 2:S3–S9. 2001. View Article : Google Scholar : PubMed/NCBI
|
|
26
|
Yoshida Y, Izumi H, Torigoe T, Ishiguchi
H, Itoh H, Kang D and Kohno K: P53 physically interacts with
mitochondrial transcription factor A and differentially regulates
binding to damaged DNA. Cancer Res. 63:3729–3734. 2003.PubMed/NCBI
|
|
27
|
Piantadosi CA and Suliman HB:
Mitochondrial transcription factor A induction by redox activation
of nuclear respiratory factor 1. J Biol Chem. 281:324–333. 2006.
View Article : Google Scholar : PubMed/NCBI
|
|
28
|
Choi YS, Kim S, Kyu Lee H, Lee KU and Pak
YK: In vitro methylation of nuclear respiratory factor-1 binding
site suppresses the promoter activity of mitochondrial
transcription factor A. Biochem Biophys Res Commun. 314:118–122.
2004. View Article : Google Scholar : PubMed/NCBI
|
|
29
|
Kelly DP and Scarpulla RC: Transcriptional
regulatory circuits controlling mitochondrial biogenesis and
function. Genes Dev. 18:357–368. 2004. View Article : Google Scholar : PubMed/NCBI
|