Introduction
Endometrial cancer (EC) is one of the most common
invasive types of gynecologic cancer and accounts for 40% of
gynecological cancer cases worldwide in 2015 (1). High insulin levels and obesity are
independent risk factors for estrogen-related type I endometrial
endometrioid carcinomas (2). At
present, surgery combined with adjuvant progesterone therapy or
postsurgical radiotherapy is the predominant treatment strategy for
endometrial cancer (3). However,
certain patients also suffer cancer recurrence and metastasis,
rendering the prognosis poor (3). For
effective cancer prevention and treatment, it is necessary to
identify critical genetic changes that initiate endometrial cancer
and contribute to its progression (4). Previous genome-sequencing efforts have
supported a strong genetic component of endometrial cancer based on
the cBioPortal for Cancer Genomics database (http://www.cbioportal.org) and have revealed a high
frequency (≤33.3%) of tumor mutations in AT-rich interactive domain
1A (ARID1A), a key member of the mating type switching/sucrose
non-fermenting chromatin-modeling complex (5).
ARID1A is located at chromosome 1p36.11, a region
frequently deleted in human cancer and encodes a nuclear protein
associated with chromatin remodeling. ARID1A is frequently mutated
in multiple gynecologic tumors, particularly in
endometrium-associated neoplasms, including 50% of
endometriosis-associated ovarian clear cells, 30% of endometrioid
ovarian carcinomas and 20–30% of endometrial carcinomas, depending
on the histological subtype (6–8). Mutations
in the ARID1A gene usually result in a loss of expression of the
ARID1A-encoded protein. Certain ARID1A gene mutations eliminate the
expression of the ARID1A protein, producing abnormalities in
chromatin remodeling and promoting the malignancy of multiple types
of cancer. Silencing mutated ARID1A may represent an approach to
the prevention or treatment of malignant tumors.
However, previous studies have primarily provided
insight into the function of wild-type ARID1A (9,10).
Furthermore, in EC, the majority of previous studies have focused
on the loss of ARID1A expression as determined by
immunohistochemistry or gene sequencing of mutations (7–11).
Therefore, it remains unclear which signaling pathways are
influenced by ARID1A mutations and which pathway molecules are
targeted by ARID1A mutations in EC pathophysiology. Therefore, the
present study aimed to elucidate the mechanistic details
underpinning the effects of ARID1A mutations on different signaling
pathways.
Materials and methods
Cell culture
The human endometrial cancer HEC-1-A cell line was
purchased from Shanghai GeneChem Co., Ltd. (Shanghai, China). The
cells were maintained in Dulbecco's modified Eagle's medium (DMEM;
Corning Incorporated, Corning, NY, USA) supplemented with 10% fetal
bovine serum (VS500T; Ausbian; Vian-Saga Co., Ltd, Shanghai, China)
at 37°C in 5% CO2. For transfections, cells were seeded
onto a 6-well plate 24 h prior to the experiment at a cell density
of 3–5×10⁴/ml in DMEM in an atmosphere of 5%
CO2 at 37°C. Each experiment was performed in
triplicate.
Exon sequencing
ARID1A mutations in HEC-1-A cells were verified by
Sanger sequencing using a 3730XL DNA analyzer (Thermo Fisher
Scientific, Inc., Waltham, MA, USA) and specific primers targeting
exons 1212, 3969, 5281 and 5503 of the ARID1A NM_006015 CDS region
were used. The experimental workflow of the Sanger sequencing
included the following 6 steps: Isolating the DNA, performing a
polymerase chain reaction (PCR; incubate at 95°C for 10 min,
denature at 96°C for 3 sec, anneal at 58°C for 15 sec, extend at
72°C for 30 sec and final extension at 72°C for 10 min for 35
cycles with DNA polymerase (BigDYe3.1; Applied Biosystems; Thermo
Fisher Scientific, Inc.), then hold at 4°C), performing a
sequencing reaction, purifying the sequencing reaction, performing
capillary electrophoresis and analyzing the data using Applied
Biosystems sequence scanner software v2.0 (Thermo Fisher
Scientific, Inc.). PCR forward and reverse primers were designed
according to the ARID1A gene fragment downloaded from the NCBI
website (https://www.ncbi.nlm.nih.gov/nuccore/NC_000001.11?report=genbank&from=26696031&to=26782110)
and (https://www.ncbi.nlm.nih.gov/tools/primer-blast/index.cgi?LINK_LOC=BlastHomeAd).
Gene sequencing of HEC-1-A was performed using gene-specific
primers. The following PCR primers designed for exon 1212 were
amplified at 479 bp: GSPE91935-primer 1, GTTACTAGGTTGGTCTCATTGCTC
and GSPE91935-primer 2, AGCCAACAGGTCTACATTCCTGTC. The following PCR
primers designed for exon 3969 were amplified at 353 bp:
GSPE91935-primer 3, TGAAGCTATAGTGGGCTCAATCTG and GSPE91935-primer
4, CTGTTGATACATTGTAGTCTGCTG. The following PCR primers designed for
exons 5281 and 5503 were amplified at 573 bp: GSPE91935-primer 5,
TCCTTGTAGAATATTTCCGACGATG and GSPE91935-primer 6,
GTTTTTCTGGAGGTCCATCAGGTG.
Lentiviral vector production
Three short hairpin RNA (shRNA) sequences were
designed by Shanghai GeneChem Co., Ltd. The shRNA expression
cassettes were designed according to the small interfering (siRNA)
sequences. The shRNA vectors were generated by inserting annealed
oligo sequences into the digested GV248 vectors (Shanghai GeneChem
Co., Ltd.) between the Phu6 and Pubi sites. HEC-1-A cells were
infected with lentiviral vector GV248 or ARID1A-specific shRNA
(Shanghai GeneChem Co., Ltd.) particles with a GV248 plasmid (2 µl
at 1×10⁹ TU/ml, 4 µl at 5×10⁹ TU/ml and 2 µl
at 1×10⁹ TU/ml) in 6-well plates in the presence of 6
mg/ml polybrene (Genomeditech Co., Ltd., Shanghai, China) and were
then treated with 2 mg/ml puromycin (Clontech Laboratories, Inc.,
Mountainview, CA, USA) to generate stable clones. An empty vector
was used as a control. ARID1A gene expression and protein levels
were confirmed by reverse transcription-quantitative polymerase
chain reaction (RT-qPCR).
RT-qPCR
To measure the abundance of ARID1A mRNA, primers
were selected and tested at different primer concentrations. Total
RNA was extracted from EC cells using the TRIzol (Thermo Fisher
Scientific, Inc.) method. A reverse transcription kit (Promega
Corporation, Madision, WI, USA) was used to reverse transcribe the
RNA into cDNA at 42°C for 1 h. Subsequently, qPCR was performed
using SYBR-Green (DRR041B; Takara Biotechnology Co., Ltd., Dalian,
China) and fluorescence microscopy (model no. IX71; Olympus
Corporation, Tokyo, Japan), The ARID1A siRNA sequences were as
follows: 5′-GTCCCTCAAGTCTGGTCTCC-3′ and reverse,
5′-GATCTCAATCAGGCATCGTC-3′. The thermocycling conditions were as
follows: Degeneration at 95°C for 30 sec, annealing at 60°C for 30
sec and extension at 72°C for 1 min, for 40 cycles. Relative gene
expression levels were calculated using the 2−ΔΔcq
method (12) and were normalized to
the expression of GAPDH (forward, 5′-TGACTTCAACAGCGACACCCA-3′ and
reverse, 5′-CACCCTGTTGCTGTAGCCAAA).
Western blot analysis
The transfected cells were washed twice with
phosphate-buffered saline, centrifuged at 4°C, 1,000 × g for 5 min
and lysed on ice in radio immunoprecipitation assay (RIPA) lysis
buffer (WB-0071; Thermo Fisher Scientific, Inc.) containing
protease inhibitors for 30 min. Subsequently, the protein was
quantified using the bicinchoninic acid method with BCA protein
assay kit (P0010S; Beyotime Institute of Biotechnology, Haimen,
China). The protein (20 µg per lane) was subjected to SDS-PAGE
electrophoresis to separate the protein using a 5% stacking gel and
10% separating gel, prior to being transferred onto polyvinylidene
fluoride membranes. Membranes were blocked by Tris-buffered saline
containing 0.05% Tween-20 (TBST) and 5% skimmed milk for 1 h at
room temperature and were incubated overnight with one of the
following primary antibodies for 30 min at 4°C: Anti-rabbit
eukaryotic translation initiation factor 4E (EIF4E; cat. no. 2067;
dilution, 1:500; Cell Signaling Technology, Inc., Danvers, MA,
USA), anti-FOS (cat. no. 8333; dilution, 1:500; Cell Signaling
Technology, Inc.), anti-rabbit insulin receptor substrate 1 (IRS1;
cat. no. ab52167; dilution, 1:500; Abcam, Cambridge, MA, USA),
anti-rabbit phosphatidylinositol-4,5-bisphosphate 3-kinase
catalytic subunit β (PIK3CB; cat. no. ab32569; dilution, 1:500;
Abcam), anti-rabbit forkhead box protein O1 (FOXO1; cat. no. 2880;
dilution, 1:500; Cell Signaling Technology, Inc.) and anti-rabbit
insulin-like growth factor 1 receptor (IGF1R; cat. no. ab131476;
dilution, 1:500; Abcam). Following washing, the horseradish
peroxidase-conjugated goat anti-rabbit IgG secondary antibody (cat.
no. sc-2004; dilution, 1:2,000; Santa Cruz Biotechnology, Inc.,
Dallas, TX, USA) was added for 2 h at room temperature. The
anti-mouse GAPDH (cat. no. sc-32233; dilution, 1:2,000, Santa Cruz
Biotechnology, Inc.) was used as a sample loading control. Pierce™
ECL Western Blotting Substrate kit (Thermo Fisher Scientific, Inc.)
was used for enhanced chemiluminescence, and the membranes were
then placed on X-ray film (Carestream, Health, Inc., Rochester, NY,
USA). The X-ray film was placed in X-ray film imaging powder
(P61-04-1; Guanlong, Shanghai, China) for 1 min and then in X-ray
film fixing powder (Guanlong, Shanghai, China) for 2 min. The data
were normalized to GAPDH expression by densitometry. Western blot
automated quantitative analysis system Compass software (version
WS-2471; Protein Simple, San Jose, CA, USA) was used to analyze the
gradation test results. Quantitative results, including molecular
weight, signal intensity (area), % area and signal-to-noise ratio
were obtained for each immunodetected protein.
Microarray pathway analysis
(PathArray™) using Ingenuity® Pathway Analysis
(IPA®)
Human Gene Chip Prime View (cat. no. 901838;
Affymetrix; Thermo Fisher Scientific, Inc.) was used to
simultaneously investigate alternations in the activities of
canonical signaling pathways in response to ARID1A depletion. The
relative activity of each pathway was determined and normalized to
that of untreated controls. Experiments were performed in
triplicate and the values were calculated as the mean ± standard
error of the mean. The sample quality was required to meet the
following standards: NanoDrop 2000 (Thermo Fisher Scientific,
Inc.), 1.7<A260/A280<2.2; Agilent 2100 Bioanalyzer (Agilent
Technologies, Inc., Santa Clara, CA, USA), RNA integrity number
≥7.0; and 28S/18S>0.7. Expression data were normalized through
quantile normalization. All gene level files were imported into
IPA® software (v39473382; Qiagen GmbH, Hilden, Germany;
http://www.ingenuity.com) for further
analysis.
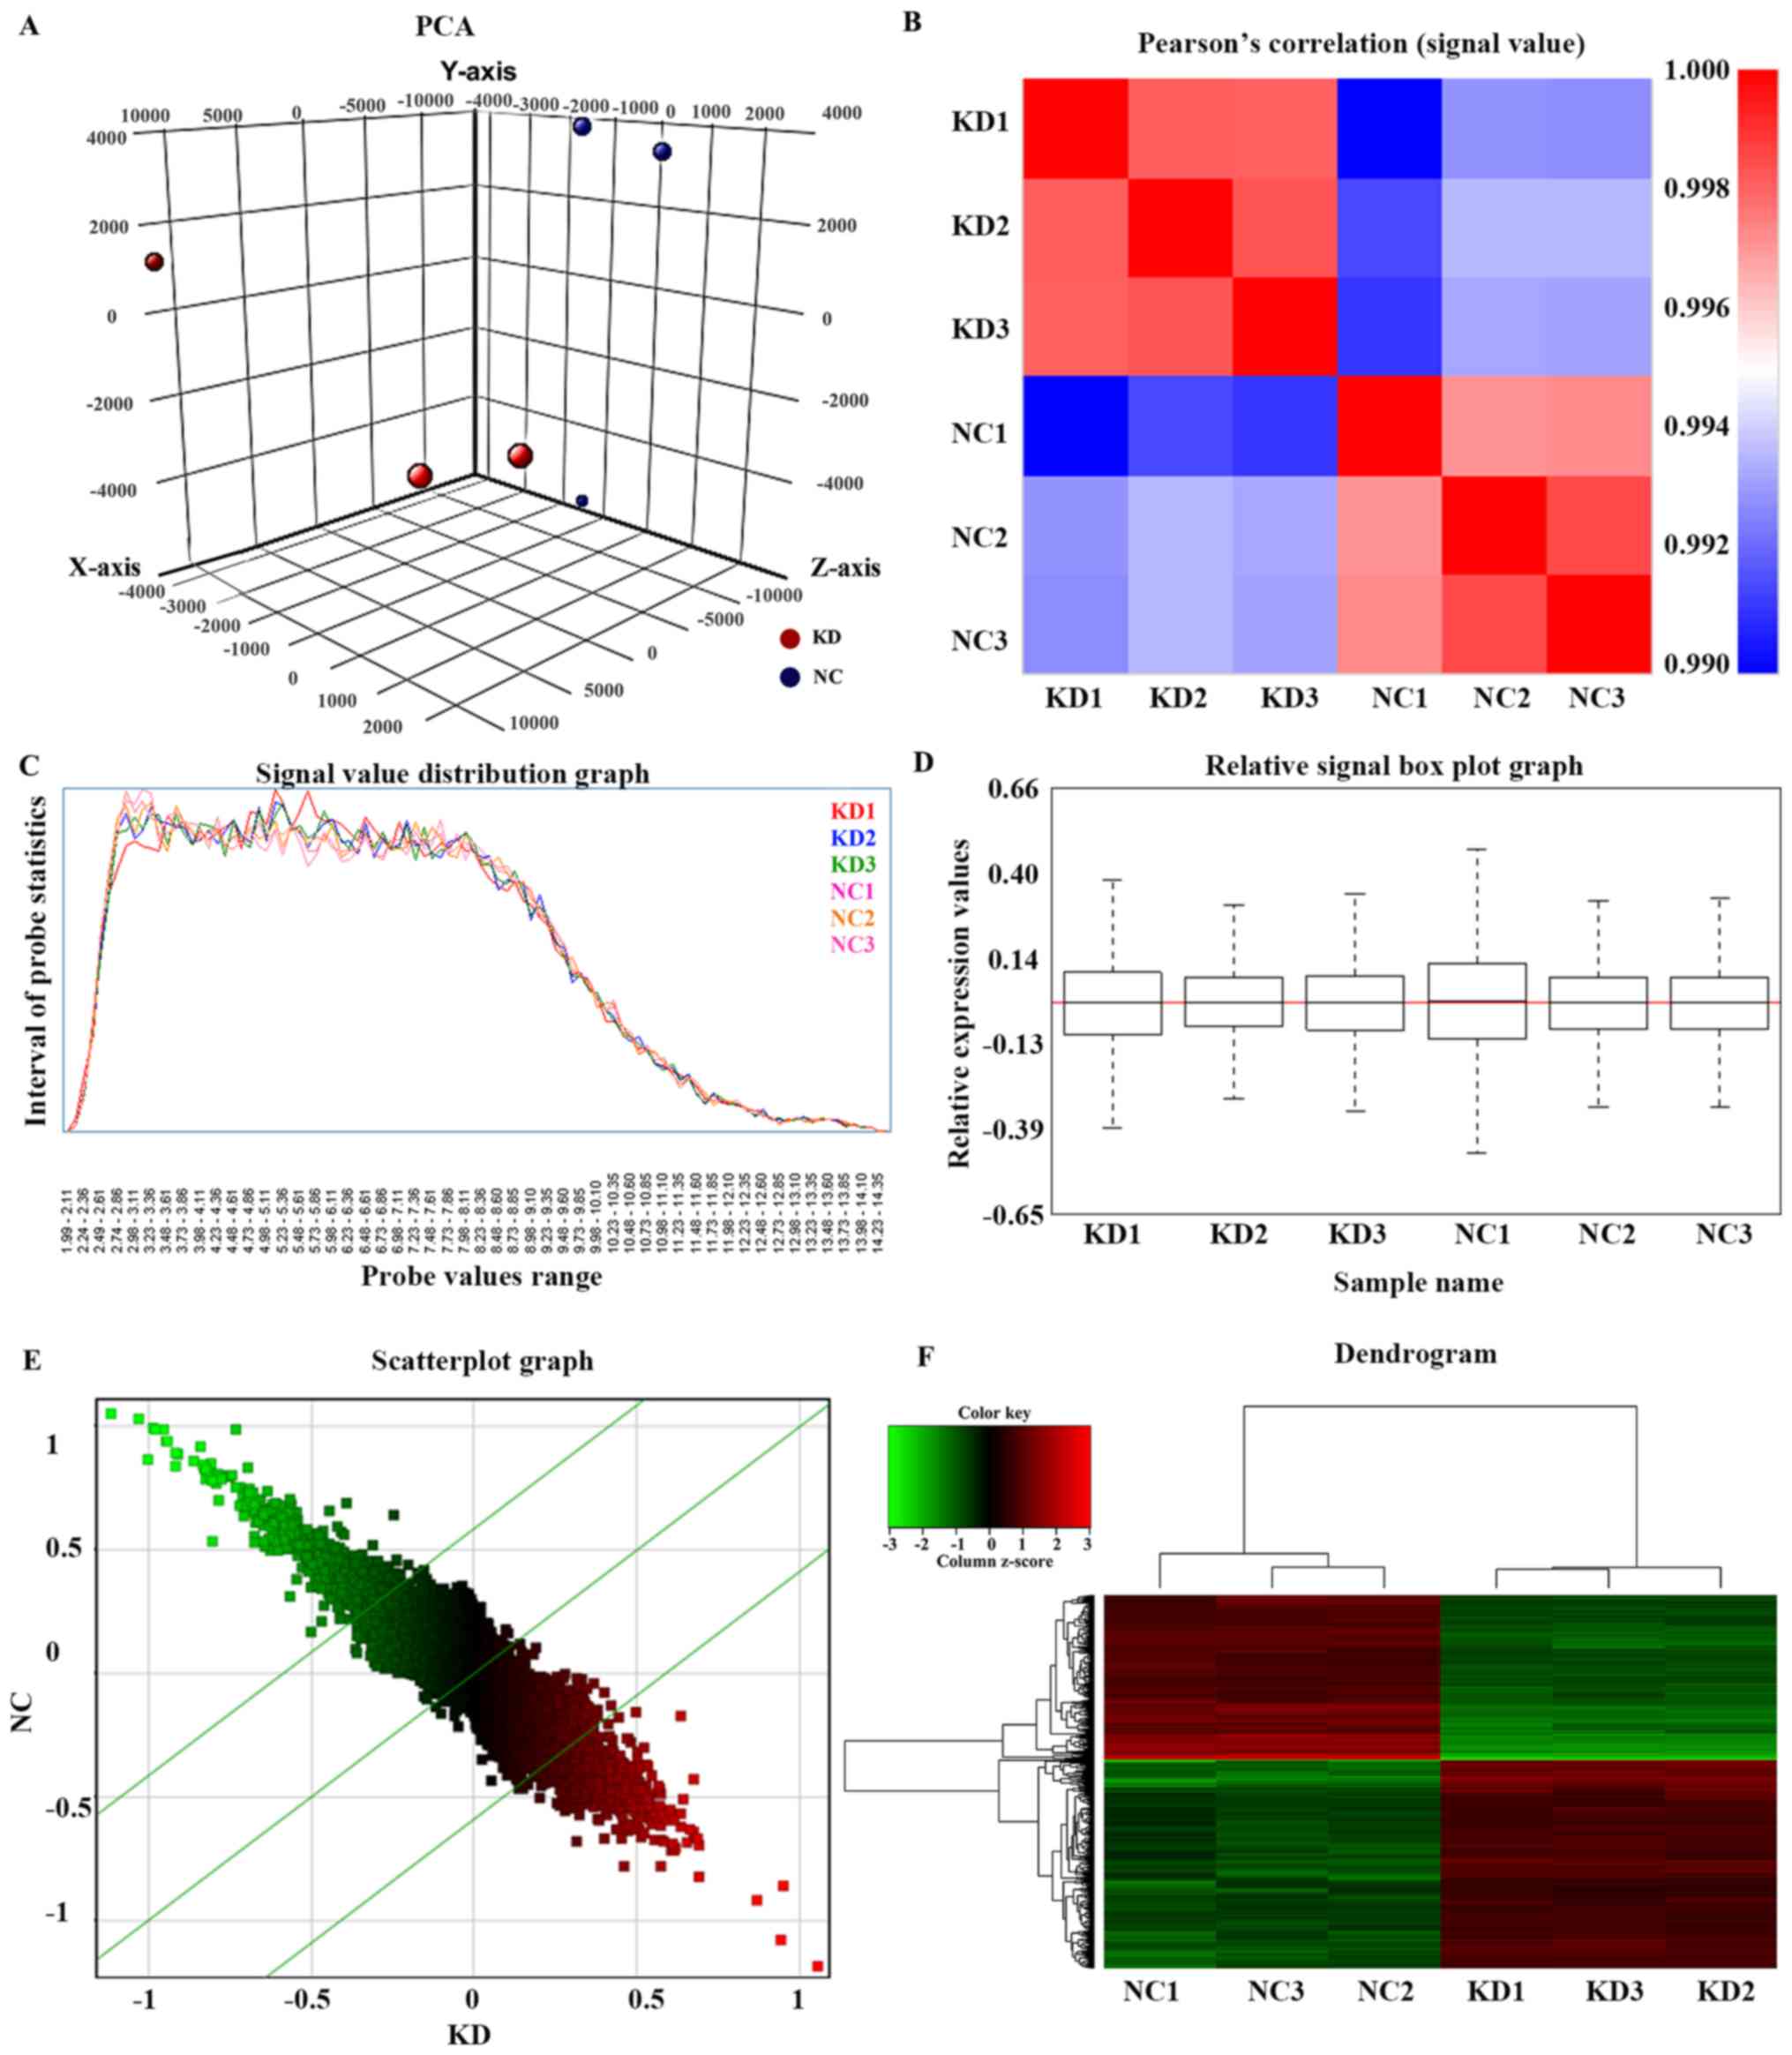
The distributions of the intensities of 6 samples
and the similarities between ARID1A-knockdown (KD) and control (NC)
groups were examined by three-dimensional principal component
analysis (Fig. 1A) and Pearson's
correlation of the signal value (Pearson's correlation coefficient
>0.95; Fig. 1B). Signal value
distribution (Fig. 1C) and relative
signal box plot graphs (Fig. 1D)
demonstrated the expression values of all microarray probe
distribution statistics and all samples in the present study were
reproducible. Scatterplot graphs (Fig.
1E) and a dendrogram (Fig. 1F)
demonstrated differences in gene expression of all microarray probe
distribution statistics between the KD and the NC group.
Differentially expressed genes between 6 samples were identified
through fold change filtering.
Statistical analysis
Statistical analysis was performed using SPSS 22.0
(IBM Corp., Armonk, NY, USA). Comparisons between two groups were
performed using Fisher's exact test, Student's t-test and one-way
analysis of variance followed by Tukey's honest significant
difference test. P<0.05 or P<0.01 was considered to indicate
a statistically significant difference. The data are presented as
the mean ± standard deviation.
Results
ARID1A mutation in the HEC-1-A cell
line and knockdown of mutated ARID1A by lentiviral shRNA
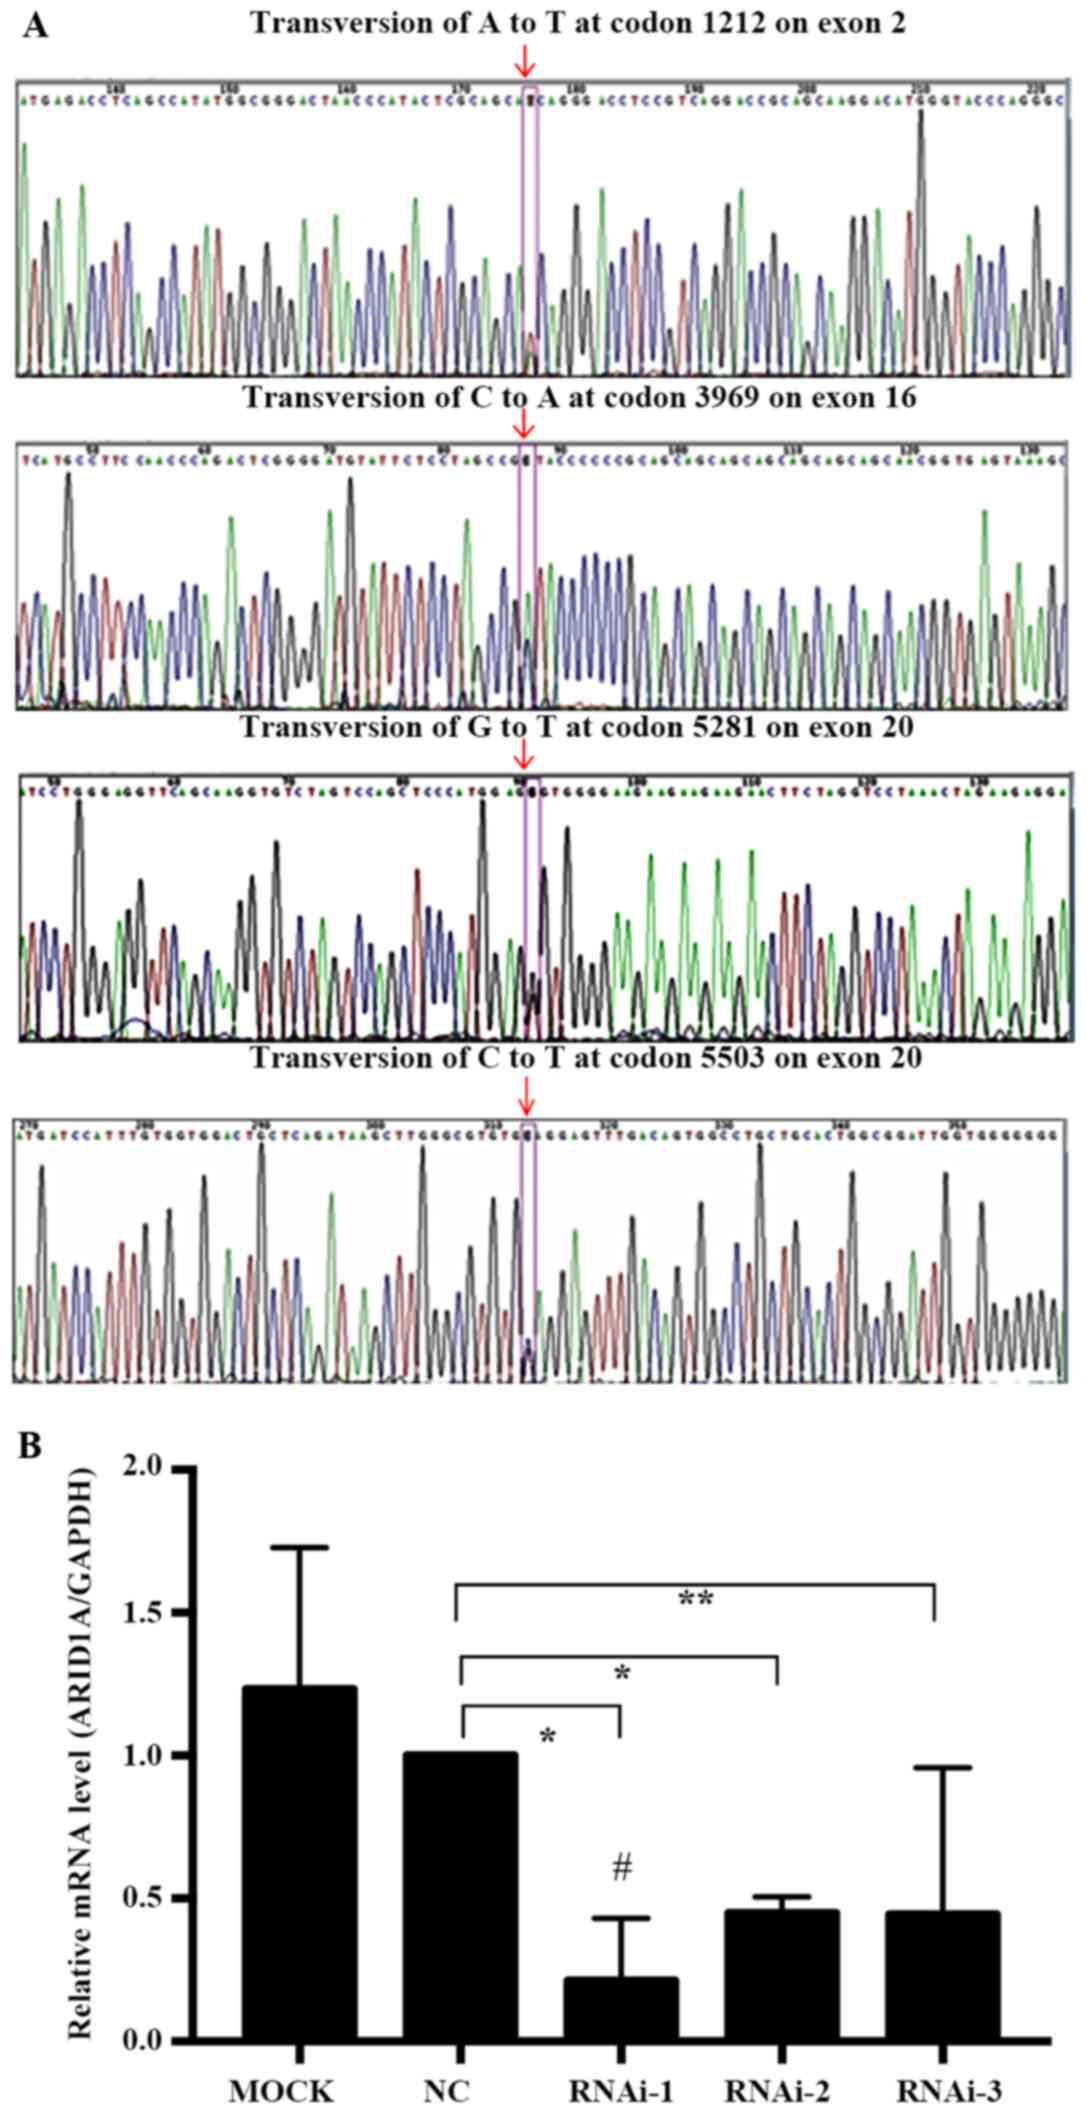
We first used exon capture sequencing to determine
the ARID1A mutation frequencies in the HEC-1-A cell line and
observed that all the ARID1A mutations were heterozygous: i)
Missense mutations, transversion of A to T at codon 1212 on exon 2
and transversion of G to T at codon 5281 on exon 20; ii) synonymous
mutations, transversion of C to A at codon 3969 on exon 16; or iii)
nonsense mutations, transversion of C to T at codon 5503 on exon 20
(Fig. 2A).
To explore the association of mutated ARID1A with
the behavior of EC cell lines, 3 pairs of ARID1A gene shRNA
interference fragments; LV-ARID1A-RNA interference (i)-24485-1
(RNAi-1), LV-ARID1A-RNAi-24486-1 (RNAi-2) and
LV-ARID1A-RNAi-24487-1 (RNAi-3), one negative control (NC) pair and
one blank control (MOCK, empty vector-transfected cells) pair were
designed and transfected into HEC-1-A cells. RT-qPCR was used to
detect the expression of ARID1A mRNA transfected with interference
fragments. ARID1A mRNA expression in HEC-1-A cells following
transfection with RNAi-1 (P=0.0042), RNAi-2 (P=0.0006) and RNAi-3
(P=0.0428) was significantly decreased compared with that in the NC
group. Three shRNA vectors suppressed ARID1A mRNA expression by
78.8, 55.0 and 55.6%, respectively, compared with that in the NC
group. RNAi-1, with an increased transfection efficiency (78.8%)
compared with the NC group, was selected for subsequent experiments
as the KD group (Fig. 2B). Since the
ARID1A gene shRNA interference fragment was designed based on codon
6795–6813, it did not fall on the mutation position as mentioned
earlier. Therefore, mutated ARID1A may have been depleted by
shARID1A knockdown plasmids in the KD group.
Gene expression profiles in response
to mutated ARID1A knockdown by microarray pathway analysis
A total of 408 canonical signaling pathways, 39
disease states and functions, 25 networks, 1,085 molecular targets,
662 upstream and 512 downstream genes were identified in
ARID1A-depleted HEC-1-A cells compared with control cells. A
Z-score/fold change ≥1.0 represented an activated signaling pathway
and disease functions, while a Z-score/fold change ≤-1.0
represented an inhibited signaling pathway and disease functions.
Furthermore, a signal Z-score/fold change ≥1.5 or ≤-1.5 and
P<0.05 indicated a significant change in signaling pathways and
disease functions between the KD and NC groups.
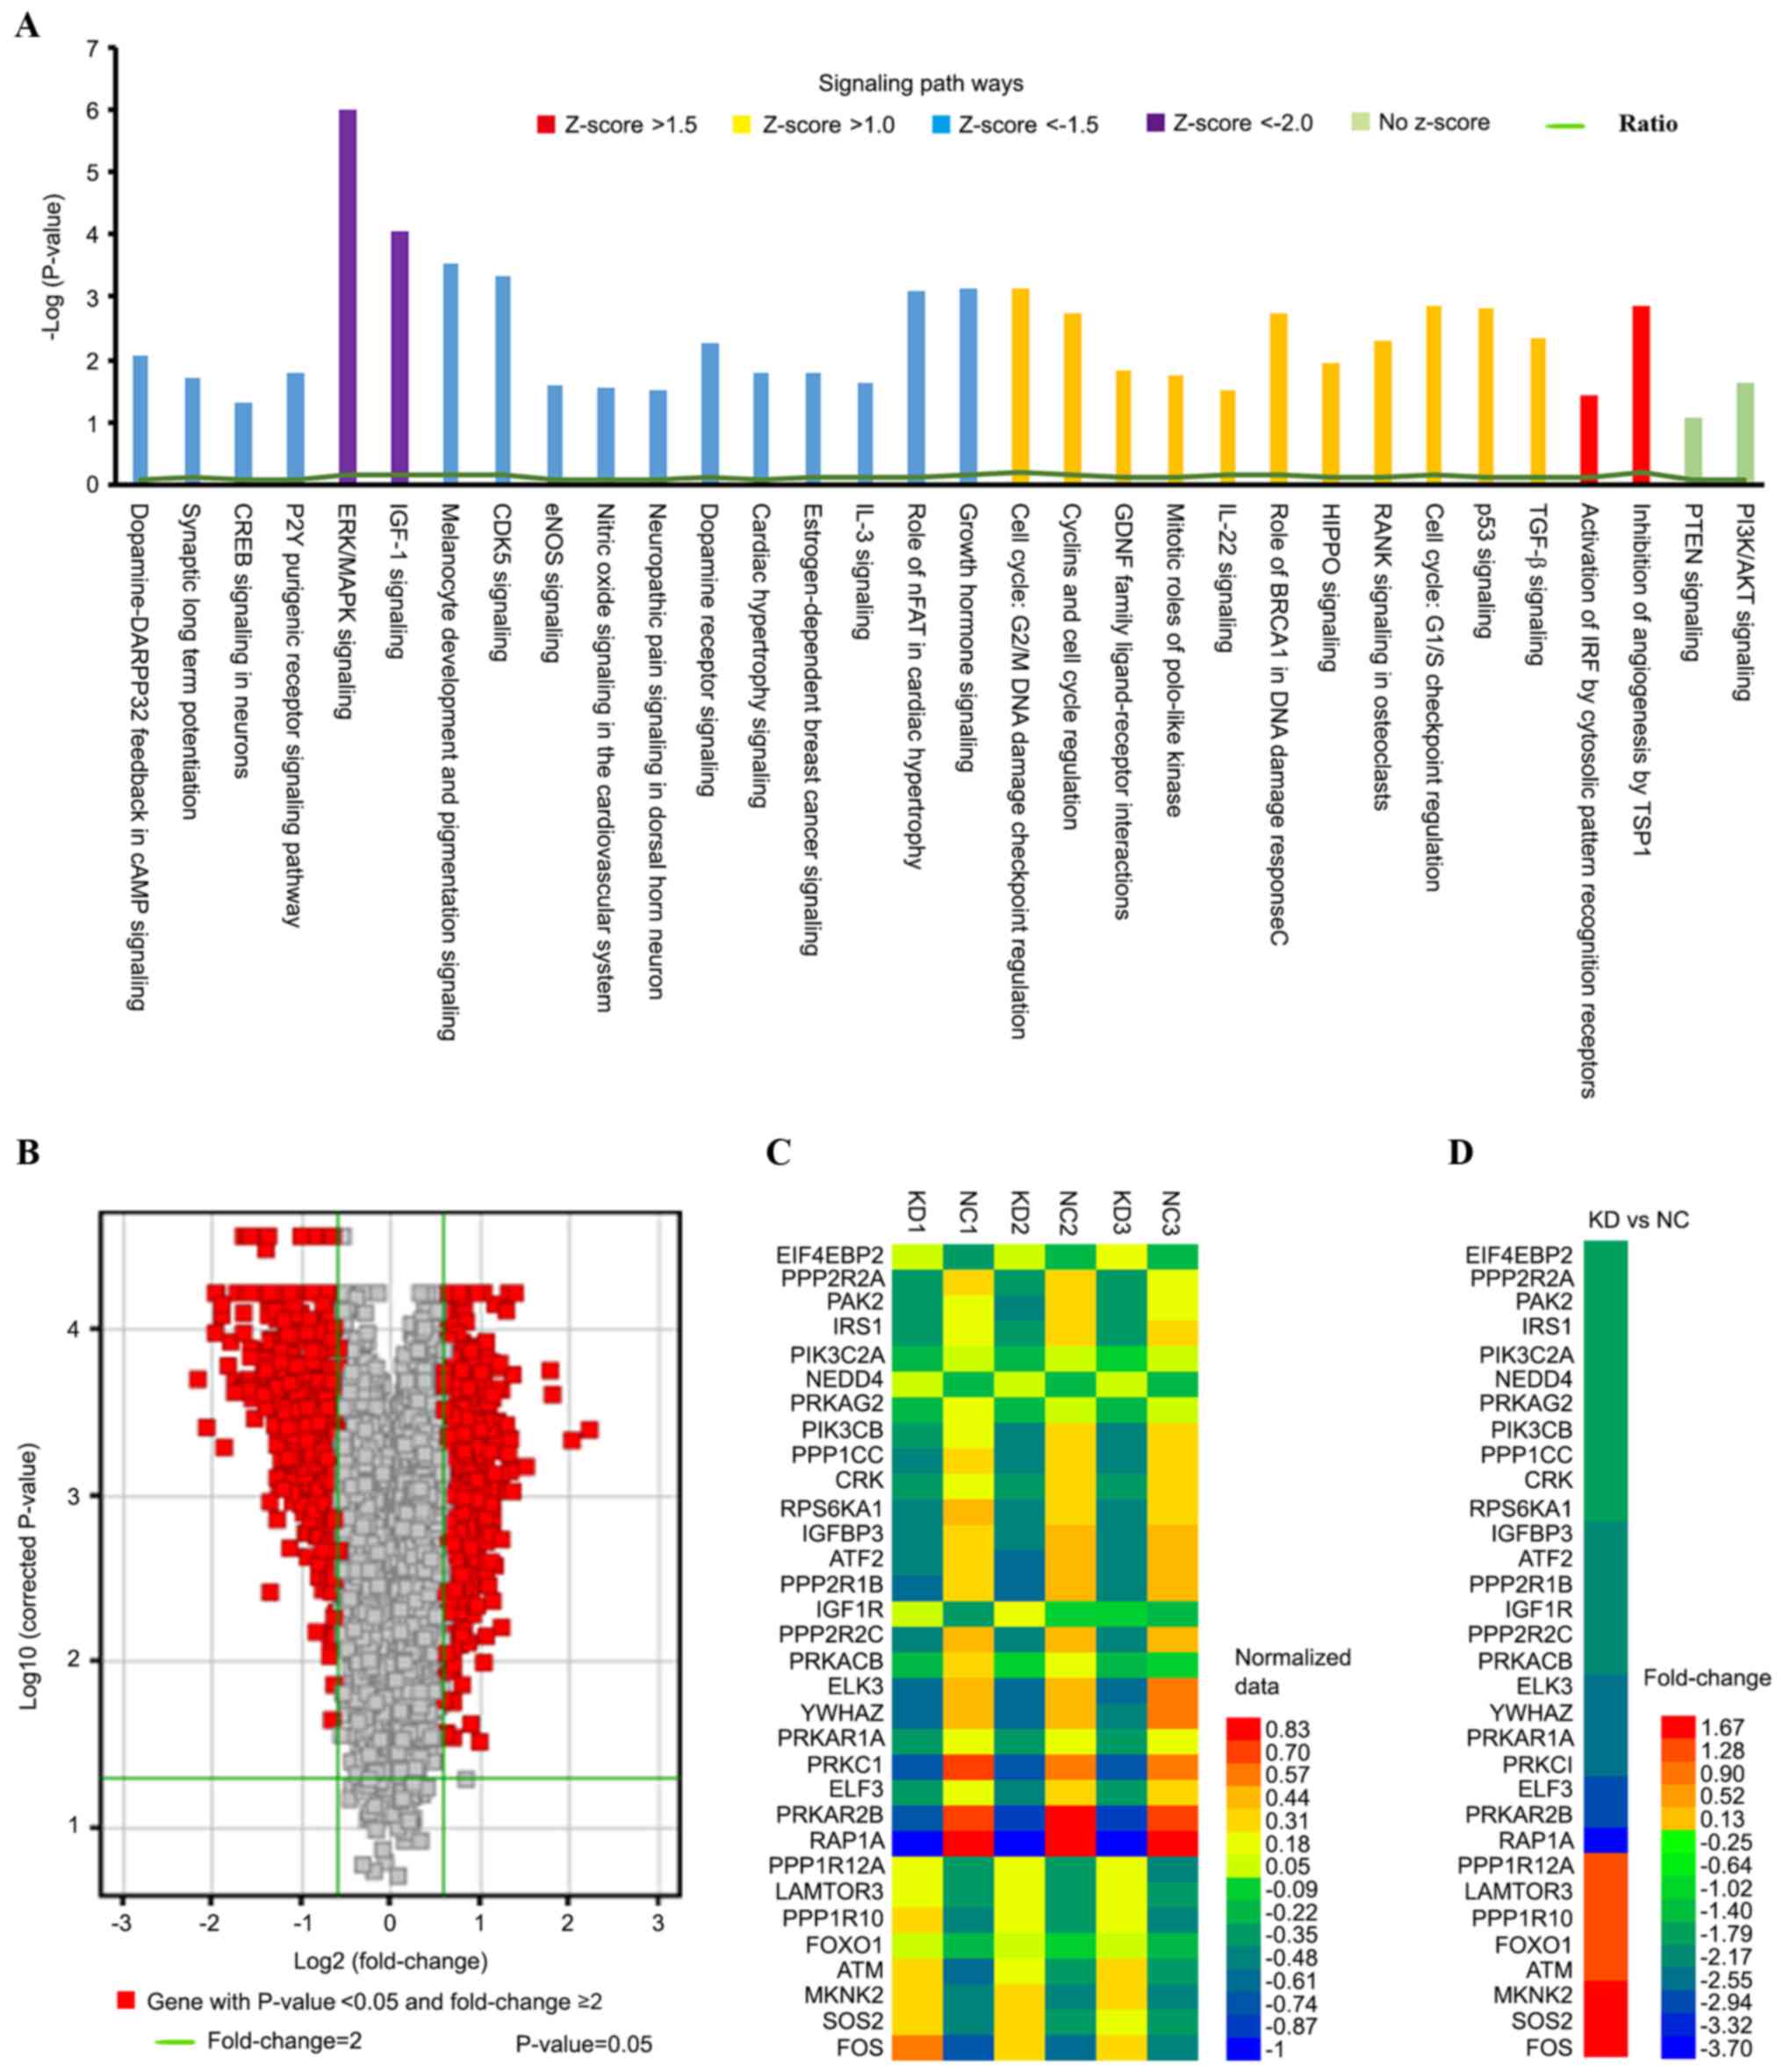
To investigate specific signaling pathways and
functional gene groups, IPA tools were used to identify 143
differentially expressed canonical pathways by defining the
enrichment P-value of the pathway using Fisher's exact test ≤0.05,
among which 17 pathways were significantly downregulated (Z-score
≤-1.5; P<0.05) and 13 were significantly upregulated (Z-score
≥1.0; P<0.05) in the KD group compared with those in the NC
group. The extracellular signal-regulated kinase
(ERK)/mitogen-activated protein kinase (MAPK;
Z-score=−2.353<-2.0; log|P-value|=6) and IGF-1 (Z-score=−2.138
<-2.0; log|P-value|=4.06) were the signaling pathways were the 2
most significantly downregulated canonical pathways. Signaling
pathways associated with ARID1A-depleted HEC-1-A cells were
sequenced by their -Log(P-value). Genes associated with the
pathways demonstrating differential expression were highlighted in
different colors depending on their -Log(P-value) (Fig. 3A). The ratios presented in Table I represent the ratio of differentially
expressed genes from a pathway to the total number of genes of that
particular pathway. The majority of these pathways were associated
with cancer development, proliferation and apoptosis. The volcano
graph (Fig. 3B) demonstrates the
distribution of differentially expressed genes by fold change
between the KD group and the NC group. Genes presented with a red
color indicate P<0.05 and fold change ≥1.5. The heat map
demonstrates the differences in 32 genes directly associated with
the ERK/MAPK and IGF-1 signaling pathways from the normalized data
of 6 experimental groups (Fig. 3C).
Microarray analysis indicated that there were 24 significantly
downregulated (fold change ≤-1.5; P<0.05) and 8 significantly
upregulated genes (fold change ≥1.5; P<0.05) in the KD group
compared with the NC group (Fig.
3D).
 | Table I.Significantly affected canonical
signaling pathways in AT-rich interactive domain-containing protein
1A-depleted HEC-1-A cells. |
Table I.
Significantly affected canonical
signaling pathways in AT-rich interactive domain-containing protein
1A-depleted HEC-1-A cells.
| Signaling
pathway | -Log(P-value) | Ratio | Z-score | Molecules |
|---|
| Extracellular
signal-regulated kinase/mitogen-activated protein kinase | 6 | 0.141 | −2.353 | PRKACB, PPP2R2A,
SOS2, CRK, EIF4E, LAMTOR3, PPP1CC, ELF3, PPP1R12A, PPP1R10,
PPP2R2C, ATM, PIK3C2A, YWHAZ, MKNK2, RAP1A, ATF2, FOS, PRKCI,
PRKAR2B, IRS1, PAK2, PRKAG2, PIK3CB, RPS6KA1, ELK3, PPP2R1B,
PRKAR1A |
| Insulin-like growth
factor 1 | 4.06 | 0.151 | −2.138 | PRKACB, NEDD4,
PIK3C2A, SOS2, YWHAZ, FOS, PRKCI, PRKAR2B, FOXO1, IRS1, IGFBP3,
PRKAG2, IGF1R, PIK3CB, PRKAR1A, ATM |
| Cyclin-dependent
kinase 5 | 3.33 | 0.141 | −2.138 | PRKACB, PPP1CC,
PRKAR2B, PPP1R10, PPP1R12A, PPP2R2A, EGR1, PRKAG2, MAPK10, LAMA1,
MAPK9, PPP2R2C, PPP2R1B, PRKAR1A |
| Inhibition of
angiogenesis by thrombospondin 1 | 2.86 | 0.206 | 2 | MAP2K4, TGFBR2,
GUCY1A3, SDC2, MAPK10, MAPK9, NOS3 |
| Activation of
interferon regulatory factor by cytosolic pattern recognition
receptors | 1.43 | 0.113 | 1.89 | MAP2K4, TANK, DDX58,
SIKE1, MAPK10, MAPK9, ATF2 |
| Dopamine-DARPP32
feedback in cAMP signaling | 2.08 | 0.0988 | −3.051 | PRKACB, GUCY1A3,
PPP2R2A, KCNJ16, CSNK1A1, ATF2, PPP1CC, PLCB4, PRKCI, PRKAR2B,
PPP1R12A, PPP1R10, PRKAG2, PPP2R2C, PPP2R1B, PRKAR1A |
| P2Y purigenic
receptor signaling pathway | 1.78 | 0.0985 | −2.496 | PRKACB, PIK3C2A,
ATF2, ITGB3, FOS, PLCB4, PRKCI, PRKAR2B, IRS1, PRKAG2, PIK3CB,
PRKAR1A, ATM |
| Synaptic long-term
potentiation | 1.72 | 0.1 | −2.887 | PRKACB, PLCB4,
PPP1CC, PRKCI, PRKAR2B, PPP1R10, PPP1R12A, PRKAG2, RPS6KA1, RAP1A,
PRKAR1A, ATF2 |
| Endothelial nitric
oxide signaling | 1.58 | 0.0903 | −2.138 | PRKACB, PIK3C2A,
GUCY1A3, HSPA1A/HSPA1B, NOS3, HSPA2, PRKCI, PRKAR2B, IRS1, PRKAG2,
PIK3CB, CASP8, PRKAR1A, ATM |
| Melanocyte
development and pigmentation signaling | 3.52 | 0.147 | −2.138 | PRKACB, PTPN6,
PIK3C2A, SOS2, CRK, ATF2, RPS6KA6, PRKAR2B, IRS1, PRKAG2, PIK3CB,
RPS6KA1, PRKAR1A, ATM |
| Neuropathic pain
signaling in dorsal horn neurons | 1.52 | 0.0965 | −2.111 | PRKACB, FOS, PLCB4,
PRKCI, PRKAR2B, PIK3C2A, IRS1, PRKAG2, PIK3CB, ATM, PRKAR1A |
| Nitric oxide
signaling in the cardiovascular system | 1.54 | 0.0973 | −2.111 | PRKACB, PRKCI,
PRKAR2B, GUCY1A3, PIK3C2A, IRS1, PRKAG2, PIK3CB, NOS3, ATM,
PRKAR1A |
Gene associated with MAPK/ERK and
IGF-1 signaling pathways and significantly affected disease states
and functions in response to mutated ARID1A knockdown
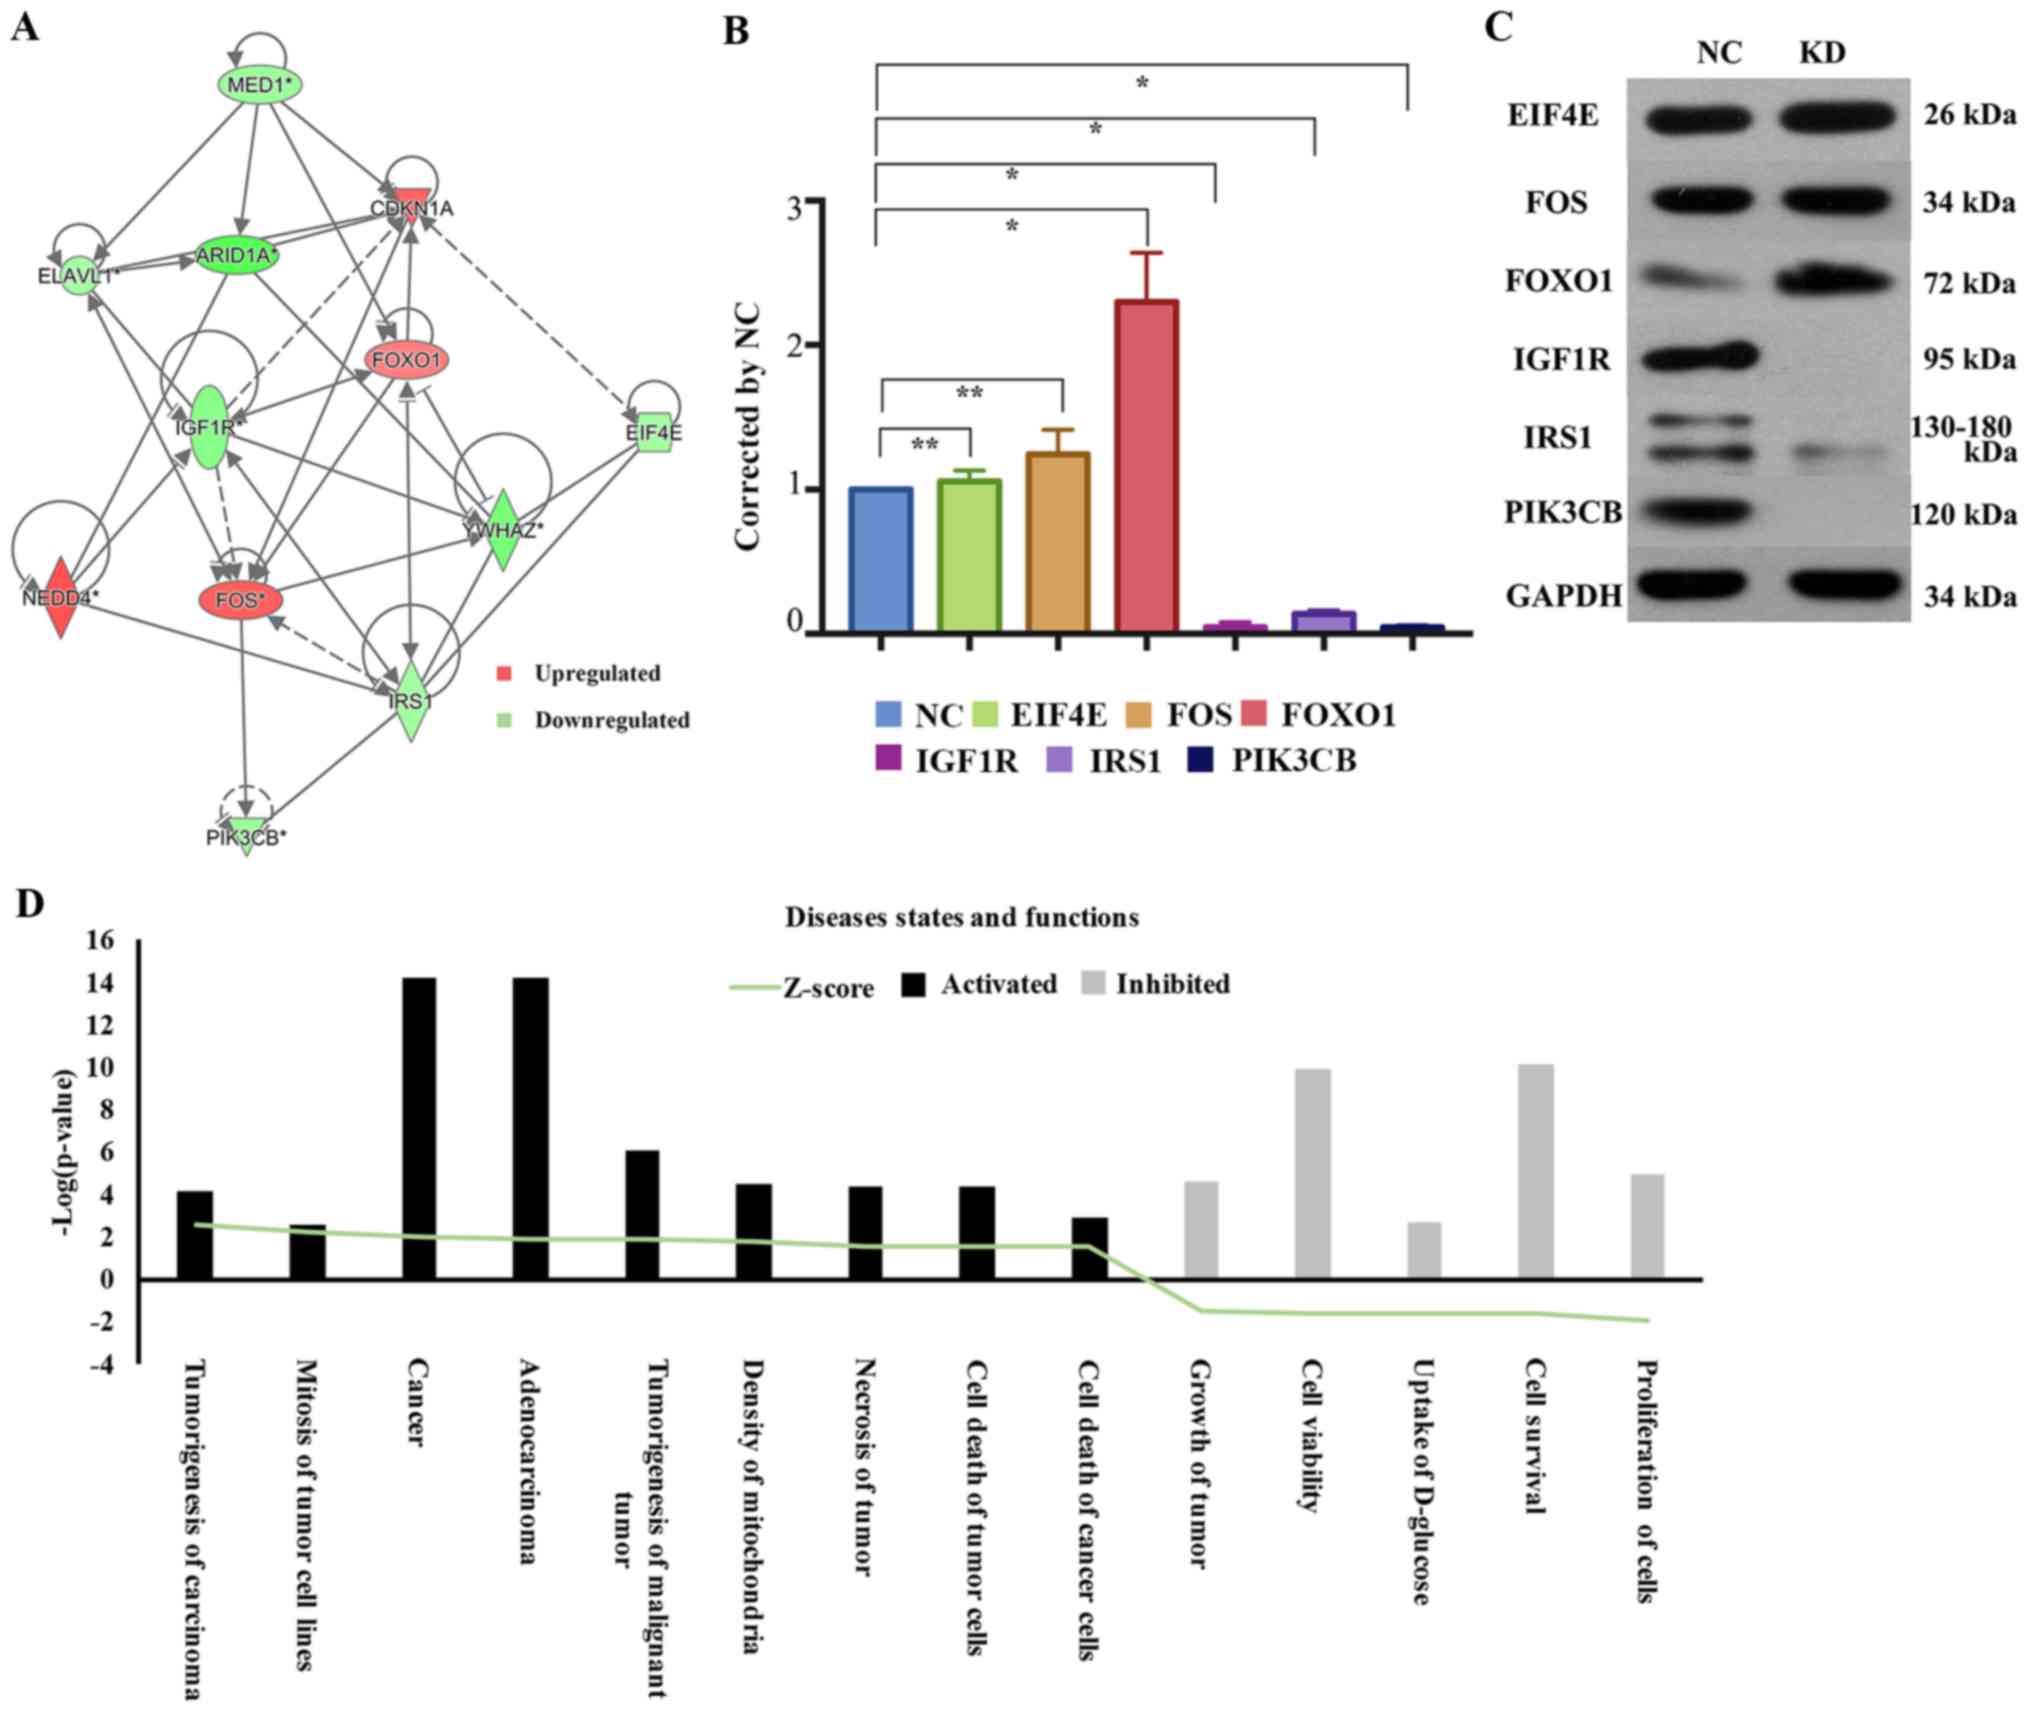
The network diagram of gene interaction analyzed by
IPA revealed interactions between ARID1A and molecules associated
with the MAPK/ERK and IGF-1 signaling pathways; EIF4E, IGF1R, IRS1
and PIK3CB were downregulated, while FOS and FOXO1 were upregulated
(Fig. 4A). To confirm these results,
western blot analysis was used to investigate alternations in the
activities of the MAPK/ERK and IGF-1 signaling pathways upon ARID1A
depletion in HEC-1-A cells. Multiple cellular processes were
potentially affected. IRS (Z-score=−1.546), PIK3CB (Z-score=−1.673)
and IGF1R (Z-score=−1.952) were significantly downregulated in
shARID1A-HEC-1-A cells compared with that in control cells.
However, ARID1A knockdown significantly elevated the level of FOXO1
(Z-score=1.588) and there were no significant differences in EIF4E
(Z-score=−1.531) or FOS (Z-score=1.975) expression in the
shARID1A-HEC-1-A cells compared with that in the control cells
(Fig. 4B and C).
 | Figure 4.Gene associated with MAPK/ERK and
IGF-1 signaling pathways and significantly affected disease states
and functions in response to mutated ARID1A knockdown. (A) Network
graph of the association between ARID1A and genes associated with
the mitogen-activated protein kinase/extracellular signal-regulated
kinase and insulin growth factor-1 signaling pathways. FOXO1 was
significantly increased; IRS1, PIK3CB and IGF1R were significantly
decreased; and EIF4E and Fos were not significantly altered by
ARID1A knockdown, compared with the control cells, as (B)
determined by western blot analysis and (C) quantified by the peak
area of triplicate experiments. GAPDH was used as a loading
control. Data are presented as mean ± standard deviation.
*P<0.01, KD vs. NC. **P<0.05. (D) Heat map of significantly
activated or inhibited diseases and functions associated with short
hairpin ARID1A-HEC-1-A cells, as determined by sequencing of the
-Log(P-value). ARID1A, AT-rich interactive domain-containing
protein 1A; FOXO1, forkhead box protein O1; IRS1, insulin receptor
substrate 1; PIK3CB, phosphatidylinositol-4,5-bisphosphate 3-kinase
catalytic subunit β; IGF1R, insulin-like growth factor 1 receptor;
EIF4E, eukaryotic translation initiation factor 4E. |
To evaluate the association of disease states and
functions with biological networks, 39 affected disease states and
functions were identified. A heat map was produced demonstrating
the association between activated or inhibited disease states or
functions and different Z-scores in the KD group compared with
those of the control group. A total of 9 disease states and
functions were significantly upregulated, including carcinoma
tumorigenesis, mitosis of tumor cell lines, cancer, adenocarcinoma,
tumorigenesis of malignant tumors, mitochondria density, tumor
necrosis, tumor cell death and cancer cell death; 5 functions were
significantly downregulated, namely cell proliferation, cell
survival, uptake of D-glucose, cell viability and tumor growth. The
affected disease states and functions graph was constructed based
on the -Log (P-value), and genes within the disease states and
functions that exhibited differential expression were highlighted
in different colors depending on their -Log (P-value) (Fig. 4D; Table
II).
| Table II.Significantly affected disease states
and functions based on -Log(P-value) in AT-rich interactive
domain-containing protein 1A-depleted HEC-1-A cells. |
Table II.
Significantly affected disease states
and functions based on -Log(P-value) in AT-rich interactive
domain-containing protein 1A-depleted HEC-1-A cells.
| Categories | Disease states and
functions | -Log(P-value) | Z-score |
|---|
| Cancer; organismal
injury and abnormalities | Tumorigenesis of
carcinoma | 4.169 | 2.577 |
| Cancer; organismal
injury and abnormalities | Cancer | 14.22 | 1.98 |
| Cancer; organismal
injury and abnormalities | Adenocarcinoma | 14.15 | 1.835 |
| Cell death and
survival | Cell survival | 10.12 | −1.678 |
| Cell death and
survival | Cell viability | 9.90 | −1.609 |
| Cancer; organismal
injury and abnormalities | Tumorigenesis of
malignant tumor | 6.104 | 1.818 |
| Cellular growth and
proliferation | Proliferation of
cells | 4.91 | −2.016 |
| Cancer; organismal
injury and abnormalities | Growth of
tumor | 4.54 | −1.52 |
| Cellular assembly
and organization | Density of
mitochondria | 4.45 | 1.746 |
| Cancer; cell death
and survival; organismal injury and abnormalities; tumor
morphology | Necrosis of
tumor | 4.32 | 1.553 |
| Cancer; cell death
and survival; organismal injury and abnormalities; tumor
morphology | Death of tumor
cells | 4.32 | 1.553 |
| Cancer; cell death
and survival; organismal injury and abnormalities; tumor
morphology | Death of cancer
cells | 2.88 | 1.52 |
| Carbohydrate
metabolism; molecular transport; small molecule biochemistry | Uptake of
D-glucose | 2.63 | −1.625 |
| Cell cycle | Mitosis of tumor
cell lines | 2.51 | 2.236 |
Discussion
In 2012, ARID1A mutations were reported to occur in
41.6% of EC cases in America (4). The
majority of cancer-associated ARID1A mutations (>97%) are
inactivating, with nonsense or frameshift, rather than silent or
missense, mutations detected throughout the gene (7). Jones et al (8) has determined that in 30% of the ovarian
clear cell carcinomas with ARID1A mutations, in wild-type and
mutant alleles, both alleles were affected, suggesting that
post-transcriptional mechanisms account for loss of ARID1A protein
in ovarian clear cell carcinomas harboring heterozygous mutations
without loss of heterozygosity (7).
In a previous study, immunohistochemistry (IHC) revealed that 27%
of ARID1A heterozygous ovarian clear cell carcinomas retained
detectable protein expression, as did 5% of tumors not found to
possess coding mutations (7). In
addition, 25% of gastric cancer cases harboring heterozygous
mutations retained ARID1A expression, as determined by IHC
(13). Therefore, mutations affecting
ARID1A expression may occur in non-coding regions of the genome not
assayed by exome sequencing techniques and epigenetic silencing may
contribute to this.
In the present study, the HEC-1-A cell line was
selected to exclude the effects of PTEN mutations and estrogen (ER)
since the HEC-1-A cell line expresses negative or low ER and
carries wild-type PTEN (14). The
present study determined heterozygous ARID1A mutations in the
HEC-1-A cell line, suggesting that biologically relevant haploin
sufficient effects were caused by loss of a single allele. Another
aim of the present study was to elucidate the mechanisms that
mediate the effects of ARID1A mutations on type I EC by performing
complemented gene- and pathway-focused studies. A microarray-based
study was performed to reveal numerous associated signaling
pathways and processes, including those associated with cell
proliferation, apoptosis and metabolism. It was hypothesized that
the MAPK/ERK and IGF-1 signaling pathways were the 2 most
significantly downregulated pathways in the mutated ARID1A-depleted
EC cell line based on the results of a microarray-based study and
IPA analysis. Thus far, few studies have been reported regarding
the mechanism of ARID1A mutations, via the MAPK/ERK and IGF-1
signaling pathways, in the development of EC.
Type I EC is commonly regarded as a metabolic
syndrome-associated tumor, characterized by insulin resistance and
associated with tumor occurrence (15,16). A
previous study demonstrated that insulin was revealed to stimulate
the proliferation and migration of EC cells and to inhibit their
apoptosis through the IGF-1 signaling pathway (17). IRS1 is an upstream component of the
MAPK/ERK and the IGF-1 signaling pathways and is associated with a
susceptibility to insulin resistance. Global activation of IGF-IR
signaling and loss of negative feedback to IRS-1 appear to be
reprogrammed in endometrial hyperplasia (18). IGF1R is overexpressed in the majority
of malignant tissues, where it binds IGF to function as an
anti-apoptotic agent by enhancing cell survival (19,20). In
the present study, downregulation of IRS1 and IGF1R was detected
upon ARID1A depletion in HEC-1-A cell lines.
However, certain patients with combined EC and
obesity do not exhibit hyperinsulinemia, implying that other
factors are also associated with the occurrence and development of
EC. IGF1 and IGF2 are strong mitogens that exert proliferative and
anti-apoptotic effects via 2 downstream signaling pathways, the
MAPK/ERK and phosphatidylinositol-4,5-bisphosphate 3-kinase
(PI3K)/protein kinase B cascades (2).
The IR, IRS1/2 and MAPK/ERK1/2 signaling pathways have all been
revealed to be highly expressed in EC (19,21). Wang
et al (21) demonstrated that
visfatin stimulated EC cell proliferation by inducing G1/S cycle
progression via activation of IR, PI3K/protein kinase B and
MAPK/ERK1/2 signaling pathways and consequent upregulation of MYC
proto-oncogene, bHLH transcription factor and cyclin D1. A previous
study involving 6 EC cell lines also revealed that the direct
mechanism involves the activation of Ras/MAPK signaling pathway
crosstalk in EC via the function of insulin, IGF-1 and ER (22).
It has been indicated that the IGF-1 and MAPK/ERK
pathways are able to interact with one another (23). The IGF-1 pathway has been revealed to
modulate cell apoptosis, while the MAPK/ERK pathway has been
implicated in cell proliferation (2).
The IGF-1R signaling pathway is initiated upon the binding of IGF-1
to its cell-surface IGF-1R to activate the MAPK/ERK signaling
pathway (24). In addition, upon
insulin-binding, the IR is activated, triggering activation of
IRS-1, which then activates the PI3K and MAPK pathways to stimulate
cell growth and proliferation and to inhibit programmed cell death
(24–26).
PI3KCβ has been revealed to be part of the upstream
gene in the MAPK/ERK and IGF-1 signaling pathways (27). FOXO1, a downstream gene in the IGF-1
signaling pathway that is usually downregulated in endometrial
tumor tissues and cell lines (28),
is able to regulate cell growth and differentiation. In the present
study, the downregulation of PIK3Cβ and the overexpression of FOXO1
was observed in ARID1A-knockdown transfected cell lines.
The present study also established that carcinoma
tumorigenesis, mitosis of tumor cell lines, tumorigenesis of
malignant tumors, tumor cell death and cancer cell death were
significantly upregulated disease states and functions according to
IPA, while the proliferation of cells, cell survival and tumor
growth were significantly downregulated.
To conclude, our biochemical microarray analysis
demonstrated 13 upregulated and 17 downregulated pathways and 14
significantly affected disease states and functions in mutated
ARID1A-depleted HEC-1-A cells. To the best of our knowledge, the
present study was also the first to demonstrate a potential
association between ARID1A mutations and EC development that
involved sequential activation of the MAPK/ERK and IGF-1 signaling
pathways through activation of IRS1, PIK3CB and IGF1R and
inhibition of FOXO1. The results of the present study provide an
opportunity to identify novel therapeutic targets based on the
proposed function for ARID1A mutations in tumor progression in EC.
However, elucidating the underlying mechanisms requires further
investigation.
Acknowledgements
The present study was supported by the Key Project
for Major Diseases of Health System of Shanghai Municipality (grant
no. 2013ZYJB0201).
References
|
1
|
Siegel RL, Miller KD and Jemal A: Cancer
statistics, 2015. CA Cancer J Clin. 65:5–29. 2015. View Article : Google Scholar : PubMed/NCBI
|
|
2
|
Wang Y, Zhu Y, Zhang L, Tian W, Hua S,
Zhao J, Zhang H and Xue F: Insulin promotes proliferation,
survival, and invasion in endometrial carcinoma by activating the
MEK/ERK pathway. Cancer Lett. 322:223–231. 2012. View Article : Google Scholar : PubMed/NCBI
|
|
3
|
de Boer SM, Powell ME, Mileshkin L,
Katsaros D, Bessette P, Haie-Meder C, Ottevanger PB, Ledermann JA,
Khaw P, Colombo A, et al: Toxicity and quality of life after
adjuvant chemoradiotherapy versus radiotherapy alone for women with
high-risk endometrial cancer (PORTEC-3): An open label,
multicentre, randomised, phase 3 trial. Lancet Oncol. 17:1114–1126.
2016. View Article : Google Scholar : PubMed/NCBI
|
|
4
|
Liang H, Cheung LW, Li J, Ju Z, Yu S,
Stemke-Hale K, Dogruluk T, Lu Y, Liu X, Gu C, et al: Whole-exome
sequencing combined with functional genomics reveals novel
candidate driver cancer genes in endometrial cancer. Genome Res.
22:2120–2129. 2012. View Article : Google Scholar : PubMed/NCBI
|
|
5
|
Mao TL, Ardighieri L, Ayhan A, Kuo KT, Wu
CH, Wang TL and Shih IeM: Loss of ARID1A expression correlates with
stages of tumor progression in uterine endometrioid carcinoma. Am J
Surg Pathol. 37:1342–1348. 2013. View Article : Google Scholar : PubMed/NCBI
|
|
6
|
Er TK, Su YF, Wu CC, Chen CC, Wang J,
Hsieh TH, Herreros-Villanueva M, Chen WT, Chen YT, Liu TC, et al:
Targeted next-generation sequencing for molecular diagnosis of
endometriosis-associated ovarian cancer. J Mol Med (Berl).
94:835–847. 2016. View Article : Google Scholar : PubMed/NCBI
|
|
7
|
Wiegand KC, Shah SP, Al-Agha OM, Zhao Y,
Tse K, Zeng T, Senz J, McConechy MK, Anglesio MS, Kalloger SE, et
al: ARID1A mutations in endometriosis-associated ovarian
carcinomas. N Engl J Med. 363:1532–1543. 2010. View Article : Google Scholar : PubMed/NCBI
|
|
8
|
Jones S, Wang TL, Shih IeM, Mao TL,
Nakayama K, Roden R, Glas R, Slamon D, Diaz LA Jr, Vogelstein B, et
al: Frequent mutations of chromatin remodeling gene ARID1A in
ovarian clear cell carcinoma. Science. 330:228–231. 2010.
View Article : Google Scholar : PubMed/NCBI
|
|
9
|
Zhai Y, Kuick R, Tipton C, Wu R, Sessine
M, Wang Z, Baker SJ, Fearon ER and Cho KR: Arid1a inactivation in
an Apc- and Pten-defective mouse ovarian cancer model enhances
epithelial differentiation and prolongs survival. J Pathol.
238:21–30. 2016. View Article : Google Scholar : PubMed/NCBI
|
|
10
|
Ayhan A, Mao TL, Seckin T, Wu CH, Guan B,
Ogawa H, Futagami M, Mizukami H, Yokoyama Y, Kurman RJ and Shih
IeM: Loss of ARID1A expression is an early molecular event in tumor
progression from ovarian endometriotic cyst to clear cell and
endometrioid carcinoma. Int J Gynecol Cancer. 22:1310–1315. 2012.
View Article : Google Scholar : PubMed/NCBI
|
|
11
|
Wu JN and Roberts CW: ARID1A mutations in
cancer: Another epigenetic tumor suppressor? Cancer Discov.
3:35–43. 2013. View Article : Google Scholar : PubMed/NCBI
|
|
12
|
Arocho A, Chen B, Ladanyi M and Pan Q:
Validation of the 2-DeltaDeltaCt calculation as an alternate method
of data analysis for quantitative PCR of BCR-ABL P210 transcripts.
Diagn Mol Pathol. 15:56–61. 2006. View Article : Google Scholar : PubMed/NCBI
|
|
13
|
Zang ZJ, Cutcutache I, Poon SL, Zhang SL,
McPherson JR, Tao J, Rajasegaran V, Heng HL, Deng N, Gan A, et al:
Exome sequencing of gastric adenocarcinoma identifies recurrent
somatic mutations in cell adhesion and chromatin remodeling genes.
Nat Genet. 44:570–574. 2012. View
Article : Google Scholar : PubMed/NCBI
|
|
14
|
Gagnon V, Mathieu I, Sexton E, Leblanc K
and Asselin E: AKT involvement in cisplatin chemoresistance of
human uterine cancer cells. Gynecol Oncol. 94:785–795. 2004.
View Article : Google Scholar : PubMed/NCBI
|
|
15
|
Trabert B, Wentzensen N, Felix AS, Yang
HP, Sherman ME and Brinton LA: Metabolic syndrome and risk of
endometrial cancer in the United States: A study in the
SEER-medicare linked database. Cancer Epidemiol Biomarkers Prev.
24:261–267. 2015. View Article : Google Scholar : PubMed/NCBI
|
|
16
|
Stocks T, Bjørge T, Ulmer H, Manjer J,
Häggström C, Nagel G, Engeland A, Johansen D, Hallmans G, Selmer R,
et al: Metabolic risk score and cancer risk: Pooled analysis of
seven cohorts. Int J Epidemiol. 44:1353–1363. 2015. View Article : Google Scholar : PubMed/NCBI
|
|
17
|
Wang Y, Hua S, Tian W, Zhang L, Zhao J,
Zhang H, Zhang W and Xue F: Mitogenic and anti-apoptotic effects of
insulin in endometrial cancer are phosphatidylinositol 3-kinase/Akt
dependent. Gynecol Oncol. 125:734–741. 2012. View Article : Google Scholar : PubMed/NCBI
|
|
18
|
McCampbell AS, Walker CL, Broaddus RR,
Cook JD and Davies PJ: Developmental reprogramming of IGF signaling
and susceptibility to endometrial hyperplasia in the rat. Lab
Invest. 88:615–626. 2008. View Article : Google Scholar : PubMed/NCBI
|
|
19
|
Le Roith D: The insulin-like growth factor
system. Exp Diabesity Res. 4:205–212. 2003. View Article : Google Scholar : PubMed/NCBI
|
|
20
|
Bruchim I, Sarfstein R, Reiss A, Flescher
E and Werner H: IGF1R tyrosine kinase inhibitor enhances the
cytotoxic effect of methyl jasmonate in endometrial cancer. Cancer
Lett. 352:214–219. 2014. View Article : Google Scholar : PubMed/NCBI
|
|
21
|
Wang Y, Gao C, Zhang Y, Gao J, Teng F,
Tian W, Yang W, Yan Y and Xue F: Visfatin stimulates endometrial
cancer cell proliferation via activation of PI3K/Akt and
MAPK/ERK1/2 signalling pathways. Gynecol Oncol. 143:168–178. 2016.
View Article : Google Scholar : PubMed/NCBI
|
|
22
|
Ogawa K, Sun C and Horii A: Exploration of
genetic alterations in human endometrial cancer and melanoma:
Distinct tumorigenic pathways that share a frequent abnormal
PI3K/AKT cascade. Oncol Rep. 14:1481–1485. 2005.PubMed/NCBI
|
|
23
|
Li Y, Jia Y, Che Q, Zhou Q, Wang K and Wan
XP: AMF/PGI-mediated tumorigenesis through MAPK-ERK signaling in
endometrial carcinoma. Oncotarget. 6:26373–26387. 2015. View Article : Google Scholar : PubMed/NCBI
|
|
24
|
Tao Y, Pinzi V, Bourhis J and Deutsch E:
Mechanisms of disease: Signaling of the insulin-like growth factor
1 receptor pathway-therapeutic perspectives in cancer. Nat Clin
Pract Oncol. 4:591–602. 2007. View Article : Google Scholar : PubMed/NCBI
|
|
25
|
Ewing GP and Goff LW: The insulin-like
growth factor signaling pathway as a target for treatment of
colorectal carcinoma. Clin Colorectal Cancer. 9:219–223. 2010.
View Article : Google Scholar : PubMed/NCBI
|
|
26
|
Tognon CE and Sorensen PH: Targeting the
insulin-like growth factor 1 receptor (IGF1R) signaling pathway for
cancer therapy. Expert Opin Ther Targets. 16:33–48. 2012.
View Article : Google Scholar : PubMed/NCBI
|
|
27
|
Campbell M, Allen WE, Sawyer C,
Vanhasebroeck B and Trimble ER: Glucose-potentiated chemotaxis in
human vascular smooth muscle is dependent on cross-talk between the
PI3K and MAPK signaling pathways. Circ Res. 95:380–388. 2004.
View Article : Google Scholar : PubMed/NCBI
|
|
28
|
Ward EC, Hoekstra AV, Blok LJ,
Hanifi-Moghaddam P, Lurain JR, Singh DK, Buttin BM, Schink JC and
Kim JJ: The regulation and function of the forkhead transcription
factor, Forkhead box O1, is dependent on the progesterone receptor
in endometrial carcinoma. Endocrinology. 149:1942–1950. 2008.
View Article : Google Scholar : PubMed/NCBI
|