Introduction
Lung cancer is the leading cause of
cancer-associated mortalities worldwide, with ~1.6 million new
cases each year (1). Non-small cell
lung cancer (NSCLC) accounts for ~85% of all lung cancer cases,
which consists of three major histological subtypes, including
adenocarcinoma, squamous cell carcinoma and large cell carcinoma
(2). Due to a lack of methods for
detection of NSCLC that are suitable for the general population,
NSCLC is typically diagnosed at late stages of the disease where
metastasis is present (3). Therefore,
it is of great importance to elucidate the molecular mechanisms
underlying the pathogenesis of NSCLC and identify effective
biomarkers for early diagnosis and prognosis.
Microarray technology is a high-throughput platform
used to analysis gene expression and has been broadly used to
obtain gene alteration during tumorigenesis and identify prognostic
biomarkers in patients with cancer (4–6). However,
genes identified by one cohort may be difficult to be confirmed in
other cohorts (7). Therefore, in
order to address this problem, it is necessary to validate genes in
several individual studies.
In the present study, the aim was to identify the
potential genes that serve as diagnostic and prognostic biomarkers
for patients with NSCLC through retrieving the microarray data from
public databases and comprehensive bioinformatics analysis. Gene
expression profiles between tumor and adjacent normal tissues were
illustrated, and differentially expressed genes (DEGs) based on the
GSE19804 dataset were identified. By combining functional pathway
and protein-protein interaction (PPI) analyses, five hub genes were
selected, including cell division cycle 20 (CDC20),
centromere protein F (CENPF), kinesin family member 2C
(KIF2C), BUB1 mitotic checkpoint serine/threonine kinase
(BUB1) and ZW10 interacting kinetochore protein
(ZWINT). Furthermore, the levels of mRNA expression of these
genes were validated using an additional dataset (GSE10072) and
NSCLC cell lines. Receiver operating characteristic (ROC) curves
and survival analyses were employed to evaluate the diagnostic and
prognostic potentials of five hub genes.
Materials and methods
Microarray data
The gene expression profiles of GSE19804 and
GSE10072 were obtained from the Gene Expression Omnibus (GEO,
http://www.ncbi.nlm.nih.gov/geo). These
two gene expression datasets were analyzed using the Affymetrix
platform (Affymetrix Human Genome U133 Plus 2.0 Array; Thermo
Fisher Scientific, Inc., Waltham, MA, USA). The GSE19804 gene
expression profile submitted by Lu et al (8) included 60 pairs of clinical NSCLC
samples, which consisted of 56 adenocarcinoma, 3 bronchioloalveolar
carcinoma, and 1 squamous carcinoma, and corresponding adjacent
normal tissue samples. The GSE10072 gene expression profile
consisted of 58 adenocarcinoma samples (16 non-smokers, 18 former
smokers and 24 current smokers) and 49 non-tumor samples (15
non-smokers, 18 former smokers and 16 current smokers) (9).
Processing of data
Raw microarray data files of the two datasets were
downloaded from the GEO database. GEO2R (http://www.ncbi.nlm.nih.gov/geo/geo2r/), an online
tool that compares two or more groups of samples in the same
experimental setting, was used to analyze the raw data (10). False Discovery Rate (FDR) adjusted
P-value of 0.05 and |logFC|>1 were set as the cut-off
criteria.
Functional and pathway enrichment
analyses of DEGs
Gene ontology (GO) analysis was processed by the
Database for Annotation, Visualization and Integrated Discovery
(DAVID) (http://david.abcc.ncifcrf.gov/) to elucidate the
biological function of genes in NSCLC. Kyoto Encyclopedia of Genes
and Genomes (KEGG) pathway enrichment analysis was performed to
identify DEGs using the DAVID database. P<0.05 was set as the
threshold.
Construction of PPI network and module
analysis
The functional interaction of proteins can shed
light on the molecular mechanism underlying NSCLC. The online
database STRING (version 10.0, http://string.embl.de/) can be used in the evaluation
of PPIs (11). The STRING database
includes 9,643,763 proteins from 2,031 organisms. In order to
evaluate the PPIs among the DEGs, DEGs were mapped to the STRING
database. A confidence score >0.7 was selected as significant.
In addition, the degree of the nodes in PPI network was calculated,
and the nodes with a higher degree were selected as hub proteins.
Furthermore, Cytoscape software (version 3.4.0, http://cytoscape.org/) was employed to construct PPI
networks. The plug-in Molecular Complex Detection (MCODE) was
performed to screen modules of the PPI network with the threshold
set as follows: MCODE scores >10. The GO and KEGG analysis of
genes in the module was performed using the DAVID online tool as
aforementioned.
Cell culture
The cell lines, human bronchial epithelial (HBE1),
A549 and H322, were gifted from Professor Zeyao Tang (Dalian
Medical University, Dalian, China) (12). The cells were maintained in
high-glucose Dulbecco's modified Eagles medium (Gibco; Thermo
Fisher Scientific, Inc.) supplemented with 10% fetal bovine serum
(GE Healthcare Life Sciences, Logan, UT, USA), 100 U/ml penicillin
and 100 µg/ml streptomycin (Gibco; Thermo Fisher Scientific, Inc.).
The cells were incubated at 37°C in a humidified chamber with 5%
CO2.
Reverse transcription-quantitative
polymerase chain reaction (RT-qPCR)
Total RNA from cells lines, including HBE1, A549,
and H322, were extracted by using the TRIzol® regent
(Invitrogen; Thermo Fisher Scientific, Inc.). The cDNA of mRNA was
synthesized using the PrimeScript™ RT reagent kit
(Takara Bio Inc., Otsu, Japan). RT-qPCR was carried out using the
7500 Real-time PCR system (Thermo Fisher Scientific, Inc.) at 95°C
for initial denaturation for 10 min, followed by 40 cycles at 95°C
for 15 sec, and 60°C for 1 min with the SYBR® Green mix
(Takara Bio Inc., Japan). Data were analyzed by using the
comparative Cq (ΔΔCq) to determine the relative gene expression,
and GAPDH was used as an endogenous control (13). The primers were synthesized by
Shanghai GenePharma Co., Ltd., (Shanghai, China). The following
primer pairs was used to measure the amount of GAPDH: Forward,
5′-GGAGCGAGATCCCTCCAAAAT-3′ and reverse,
5′-GGCTGTTGTCATACTTCTCATGG-3′.
ROC analysis
ROC curve analysis was performed using the MedCalc
software packages (version 16.8.4; MedCalc Software bvba, Ostend,
Belgium). The area under the curve (AUC) values with 95% confidence
interval (CI) were calculated to evaluate the overall performance
of the diagnostic tests.
Survival analysis of hub genes
Kaplan-Meier plotter (www.kmplot.com), an online survival analysis tool, was
used to evaluate the prognostic value of biomarkers of breast,
ovarian, lung and gastric cancer (14). Patients with NSCLC were divided into
high and low expression groups using the median level, which was
included in the low expression group, as the cutoff value. To
analyze the association between gene expression and clinical
outcomes, Kaplan-Meier plots was employed to compare the overall
survival ratio between the two groups, and the log rank P-value and
hazard ratio (HR) with 95% confidence intervals (CI) were
calculated and displayed.
Statistical analysis
The data are expressed as the mean ± standard
deviation of three replicates. Statistical differences were
assessed using one-way analysis of variance test and Tukey's
multiple comparisons test. SPSS software (version 17.0; SPSS, Inc.,
Chicago, IL, USA) was used to analyze the data. P<0.05 was
considered to indicate a statistically significant difference.
Results
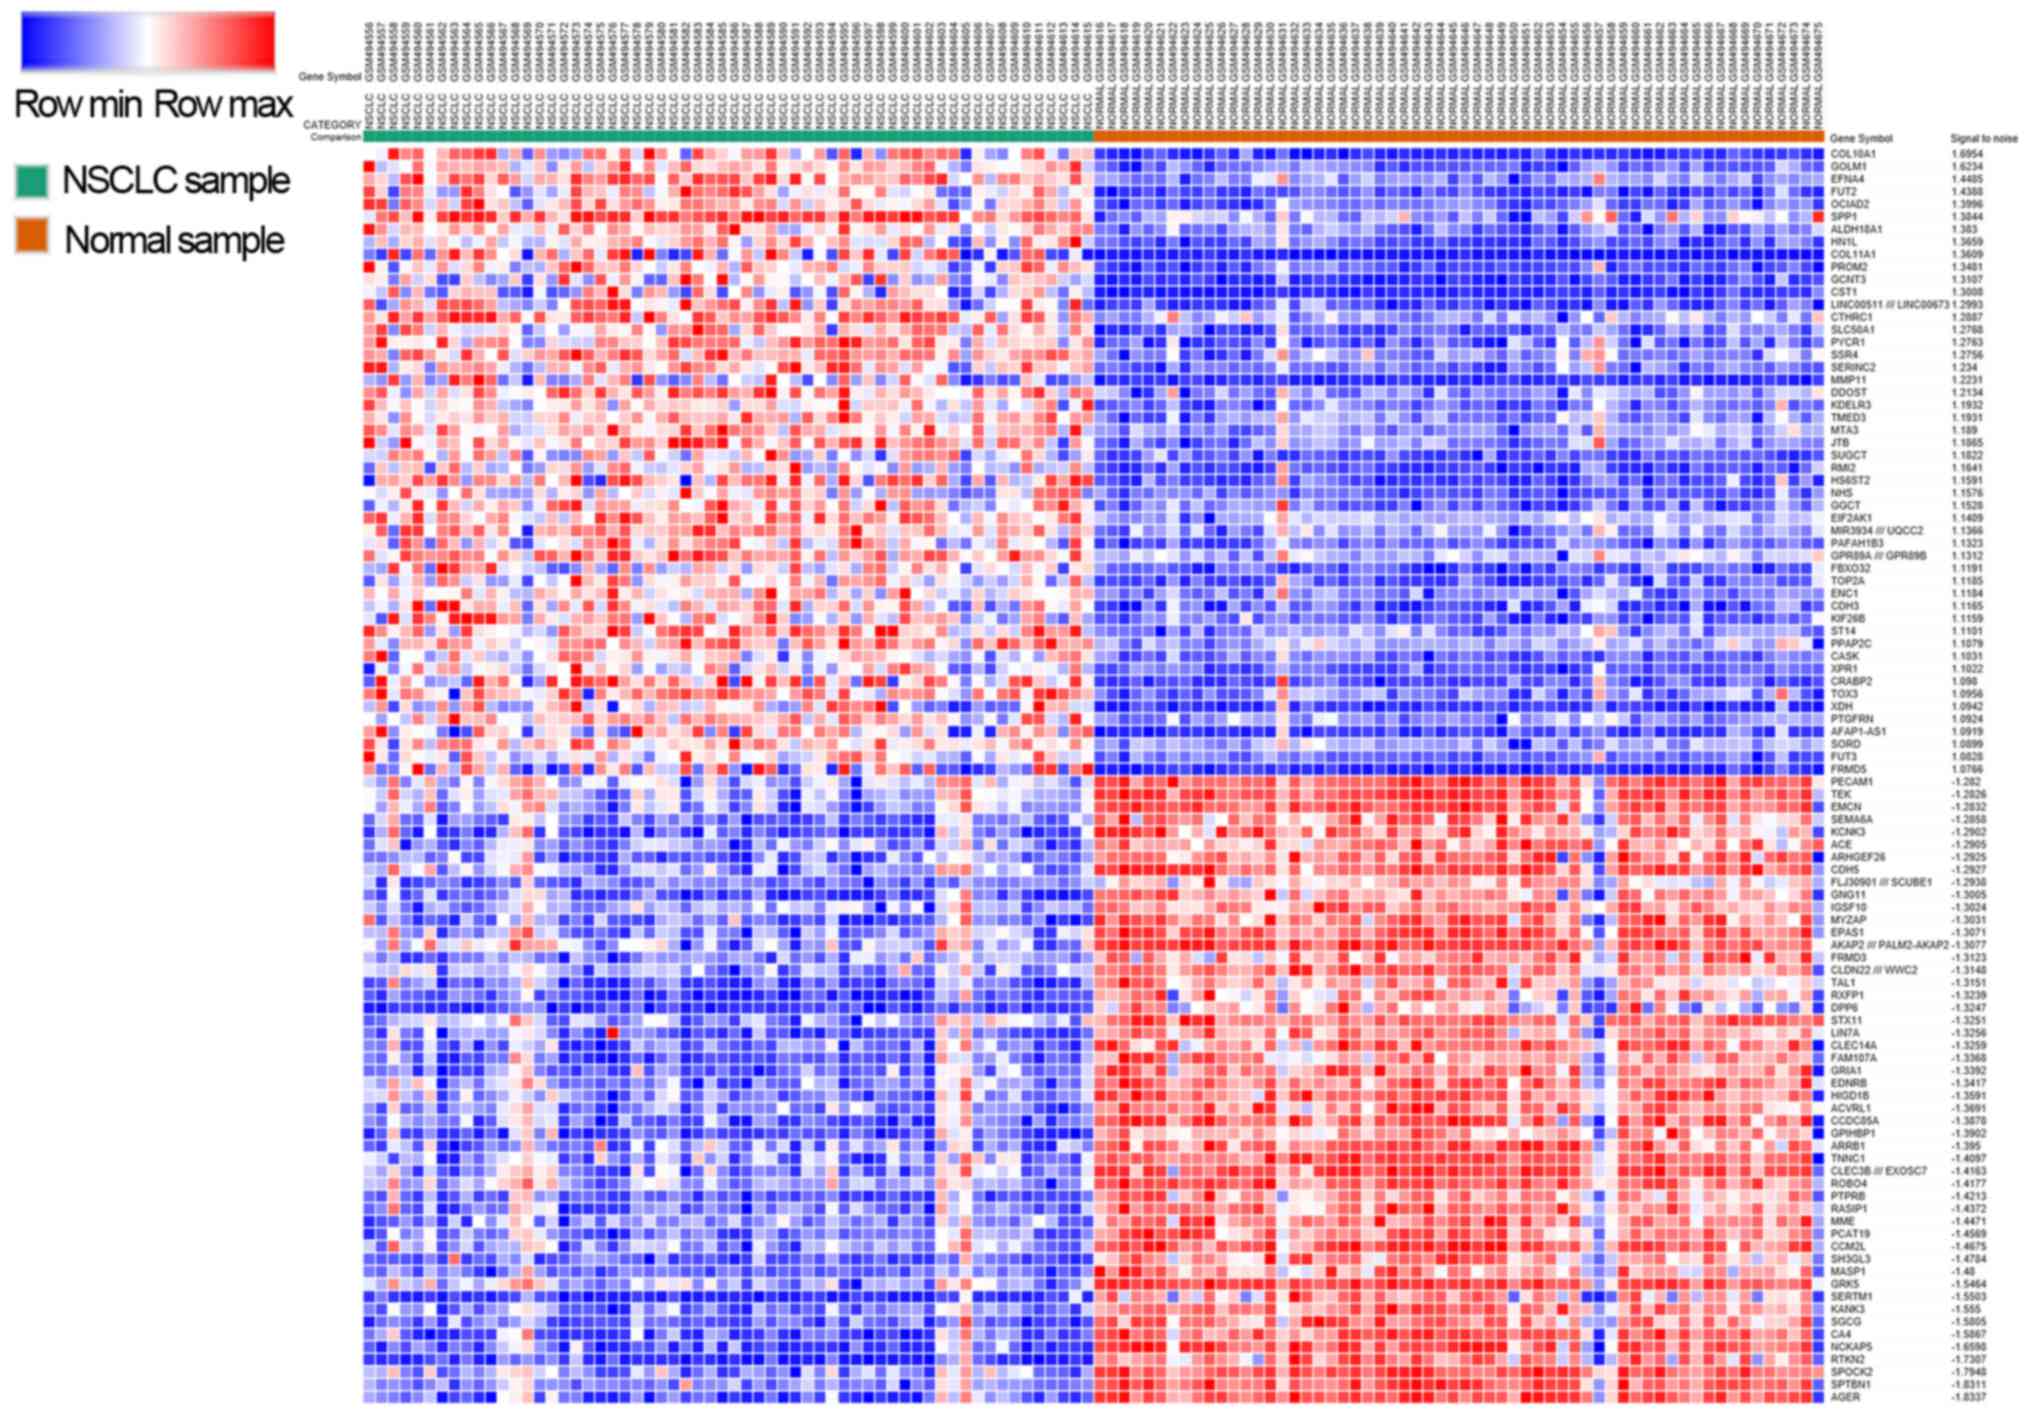
Identification of DEGs
By using the threshold (adjusted P-vale of 0.05 and
fold change >2), a total of 1,412 DEGs were identified in the
GSE19804 dataset. Among these genes, 453 genes were upregulated,
and 959 genes were downregulated. A heat-map illustrating the
expression of the top 50 up and downregulated DEGs is shown in
Fig. 1.
Analysis of GO terms and KEGG pathway
enrichment
To further elucidate the functions of the identified
DEGs in NSCLC, GO and KEGG pathway enrichment analyses were
employed. As shown in Table I, GO
analysis of upregulated DEGs in NSCLC indicated that these genes
were associated with ‘mitotic cell cycle’, ‘mitotic nuclear
division’ and the ‘cell cycle process’. KEGG pathway enrichment
analysis of DEGs revealed that upregulated DEGs were largely
enriched in cell cycle and extracellular matrix (ECM)-receptor
interaction pathways, while downregulated DEGs were enriched in
‘malaria’ and ‘tumor necrosis factor (TNF) signaling pathways’
(Table I). These results suggest that
upregulated DEGs in NSCLC may be largely involved in the
progression of the cell cycle.
 | Table I.Functional and pathway enrichment
analysis of upregulated and downregulated genes in non-small cell
lung cancer. |
Table I.
Functional and pathway enrichment
analysis of upregulated and downregulated genes in non-small cell
lung cancer.
| Category | Term/gene
function | Gene count | P-value |
|---|
| Upregulated |
|
|
|
| GO |
|
|
|
|
0000278 | Mitotic cell
cycle | 62 |
1.1×10¹⁴ |
|
0007067 | Mitotic nuclear
division | 39 |
1.2×10¹² |
|
0022402 | Cell cycle
process | 75 |
1.9×10¹² |
|
005130 | Cell division | 45 |
2.2×10¹² |
|
0044772 | Mitotic cell cycle
phase transition | 42 |
3.2×10¹² |
|
0000793 | Condensed
chromosome | 22 |
7.9×10⁸ |
|
0005578 | Proteinaceous
extracellular matrix | 27 |
2.1×10⁶ |
|
0005819 | Spindle | 24 |
2.3×10⁶ |
|
0000776 | Kinetochore | 15 |
5.4×10⁶ |
| KEGG |
|
|
|
|
hsa04110 | Cell cycle | 19 |
1.0×10⁹ |
|
hsa04512 | ECM-receptor
interaction | 14 |
1.7×10⁷ |
|
hsa04115 | P53 signaling
pathway | 12 |
6.0×10⁷ |
|
hsa04974 | Protein digestion
and absorption | 11 |
5.6×10⁵ |
|
hsa04510 | Focal adhesion | 15 |
5.5×10⁴ |
| Downregulated |
|
|
|
|
hsa05144 | Malaria | 15 |
2.2×10⁷ |
|
hsa04668 | TNF signaling
pathway | 19 |
1.6×10⁵ |
|
hsa04530 | Tight junction | 21 |
5.4×10⁵ |
|
hsa04514 | Chemokine signaling
pathway | 23 |
5.4×10⁴ |
|
hsa04360 | Axon guidance | 17 |
1.6×10³ |
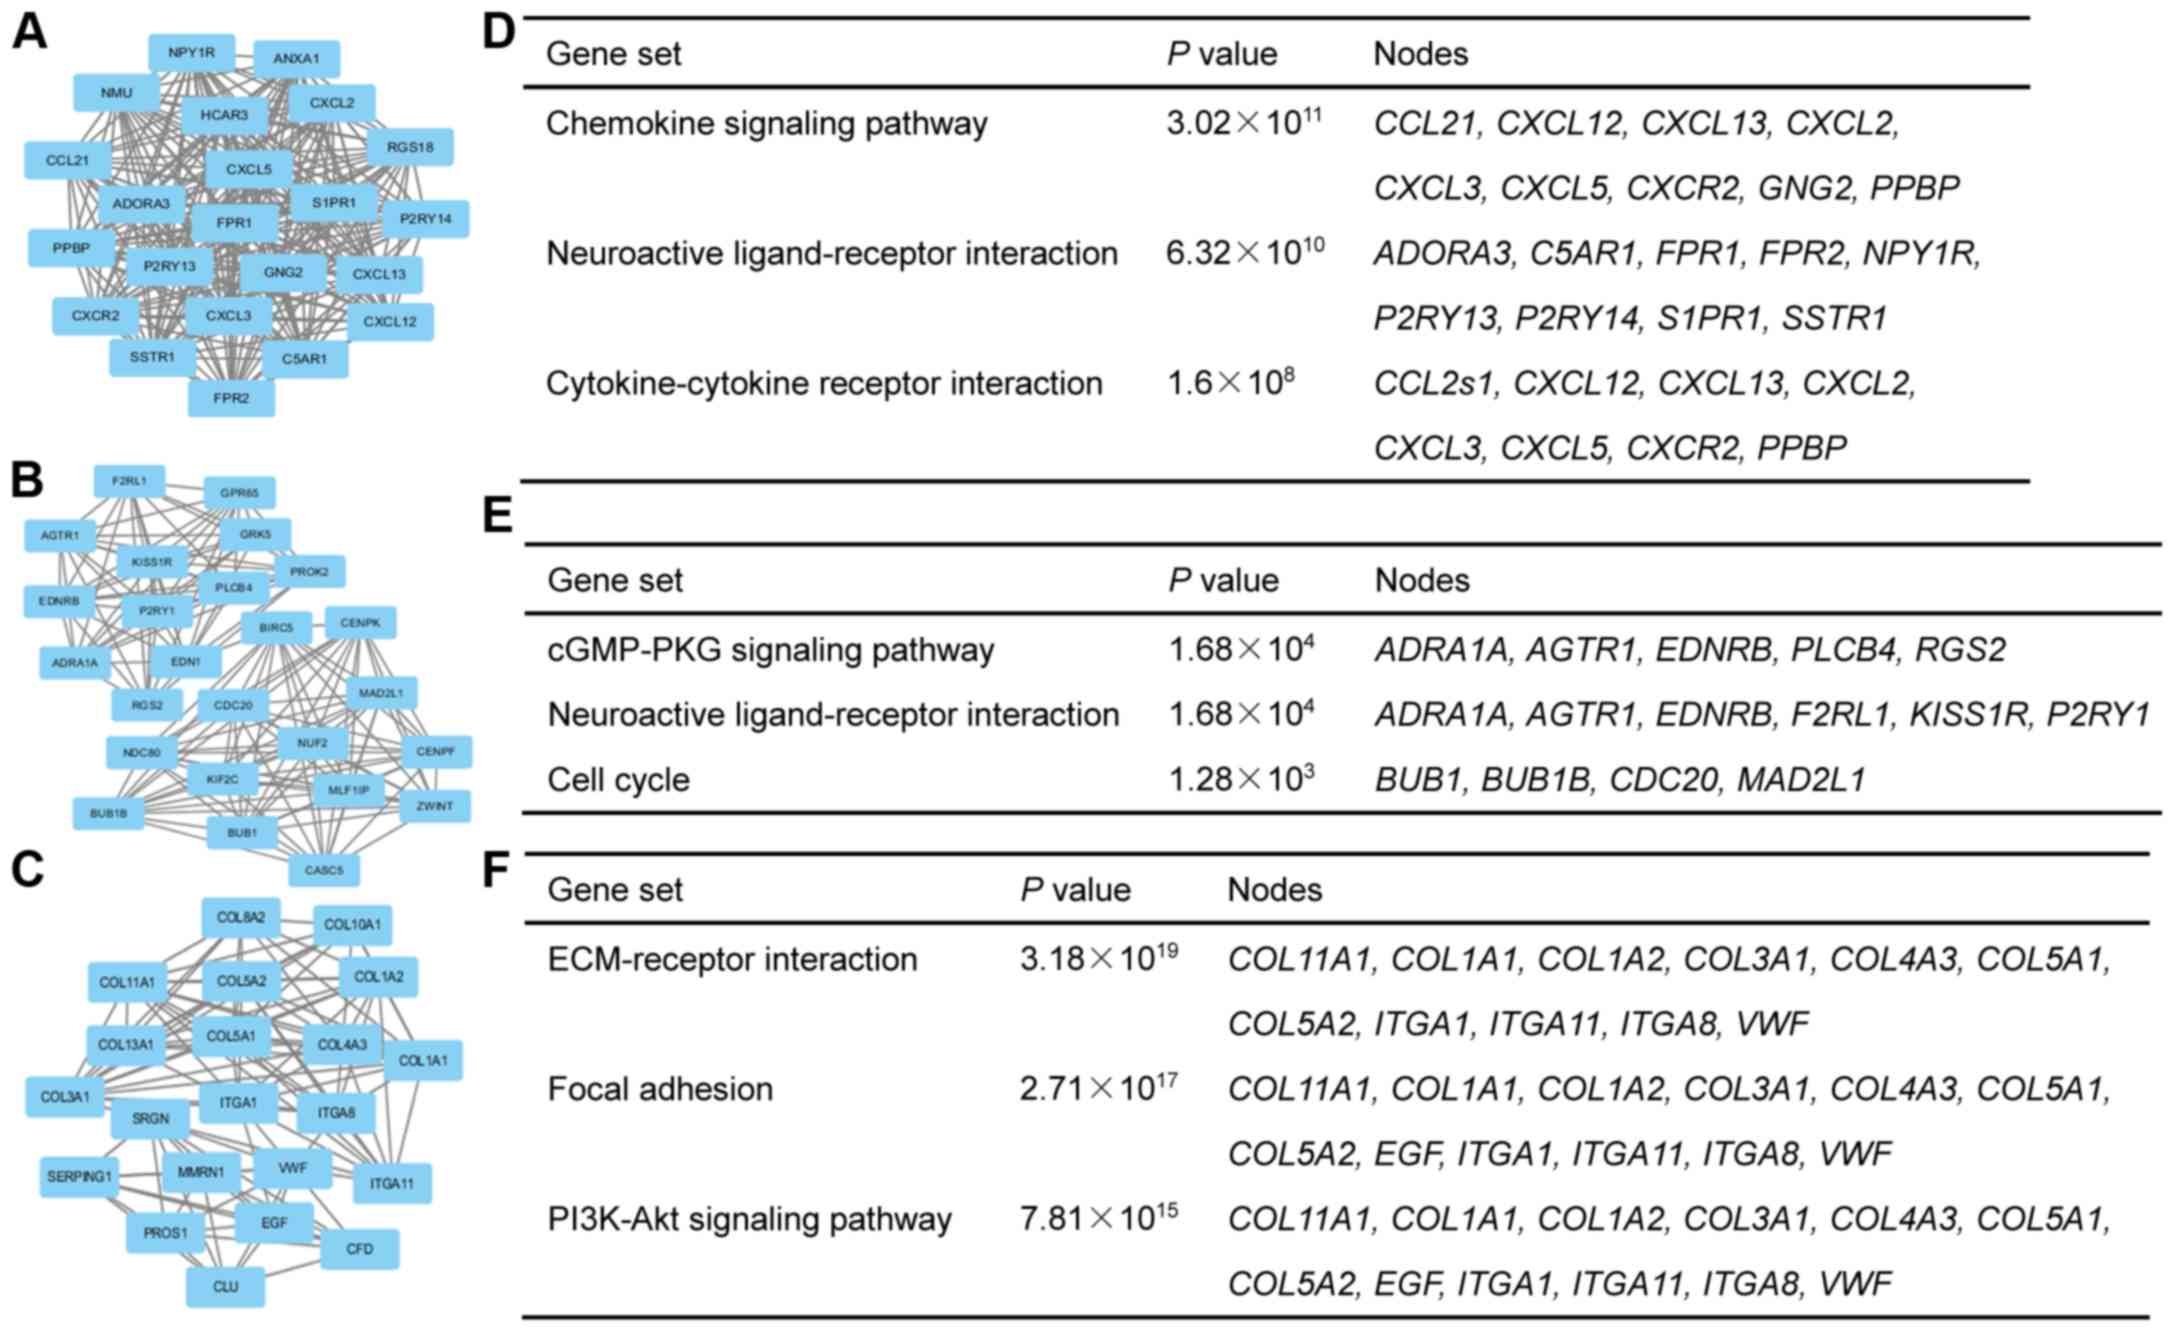
Construction of PPI network and
selection of modules
Based on the analysis of DEGs in the STRING
database, a PPI network of DEGs containing 1,291 nodes and 2,854
edges was constructed. By using the plug-in MCODE in Cytoscape, the
top 3 modules in the PPI network was obtained (Fig. 2A-C), and KEGG analysis of genes in the
corresponding modules was also performed (Fig. 2D-F). Consistent with the KEGG analysis
of DEGs, function enrichment analysis of genes in the top 3 modules
indicated that these hub genes were also enriched in ‘cell cycle
progression’ (Fig. 2E). Therefore,
the present study focused on the 5 hub genes associated with cell
cycle progression including CDC20, CENPF, KIF2C, BUB1 and
ZWINT.
Validation of 5 selected hub
genes
Although 5 hub genes were selected by KEGG analysis
the genes in these 3 modules, these 5 selected genes may be limited
to the diagnosis or prognosis for non-smoking female patients with
NSCLC. In order to elucidate whether these genes can be
non-selectively applied to patients with NSCLC, as previously
reported (4,15), an additional dataset and RT-qPCR were
employed to validate the mRNA level of these genes in NSCLC samples
and cell lines. Since the GSE19804 dataset included 56 non-smoking
female adenocarcinoma samples (8),
the present study searched for a dataset that included
adenocarcinoma and simultaneously excluded the effects of sex and
smoking. Based on the aforementioned criterion, the GSE10072
database was identified as suitable. Using the GSE10072 dataset, it
was detected that the mRNA level of these 5 genes were also
overexpressed in NSCLC samples (Fig.
3A-E). In addition, the RT-qPCR results also validated that the
mRNA level of these genes were overexpressed in NSCLC cell lines
including A549 and H322 (16), when
compared with the control cell line HBE1 (Fig. 3F). H322 may be identical to another
uncommonly used NSCLC cell line H322M (https://web.expasy.org/cellosaurus/CVCL_1556). Taken
together, these results suggest that these 5 hub genes may be novel
gene signatures for patients with NSCLC.
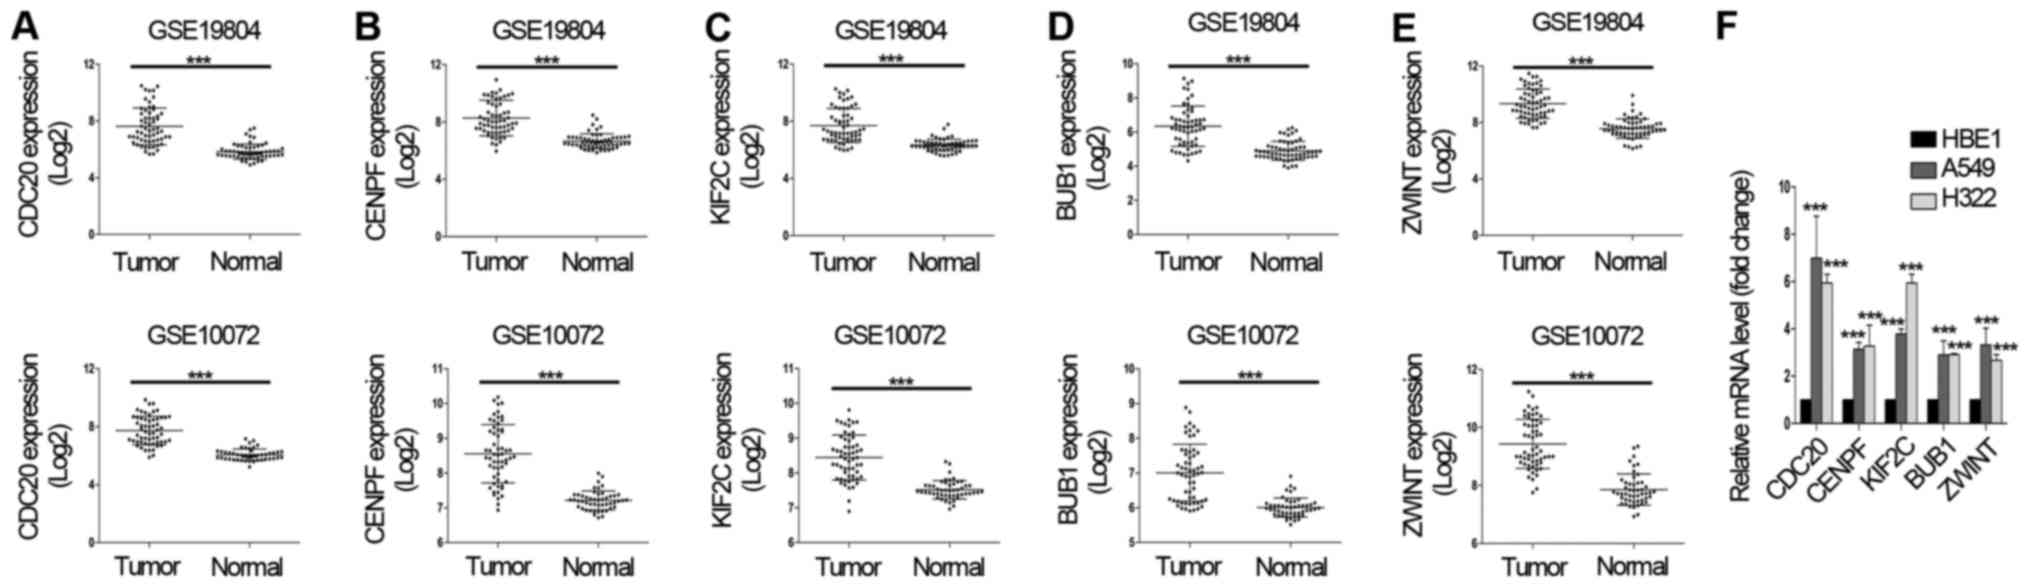 | Figure 3.Validation of 5 selected
differentially expressed genes. The mRNA level of 5 hub genes,
including (A) CDC20, (B) CENPF, (C) KIF2C, (D)
BUB1 and (E) ZWINT in two datasets (GSE19804 and
GSE10072). (F) The levels of CDC20, CENPF, KIF2C, BUB1 and
ZWINT mRNA were validated by reverse
transcription-quantitative polymerase chain reaction. Total RNA was
isolated from cultured non-small cell lung cancer cell lines (A549,
H322 and control cell line HBE1). The values are expressed as the
mean ± standard deviation of three replicates. ***P<0.01. CDC20,
cell division cycle 20; CENPF, centromere protein F; KIF2C, kinesin
family member 2C; BUB1, BUB1 mitotic checkpoint serine/threonine
kinase; ZWINT, ZW10 interacting kinetochore protein. |
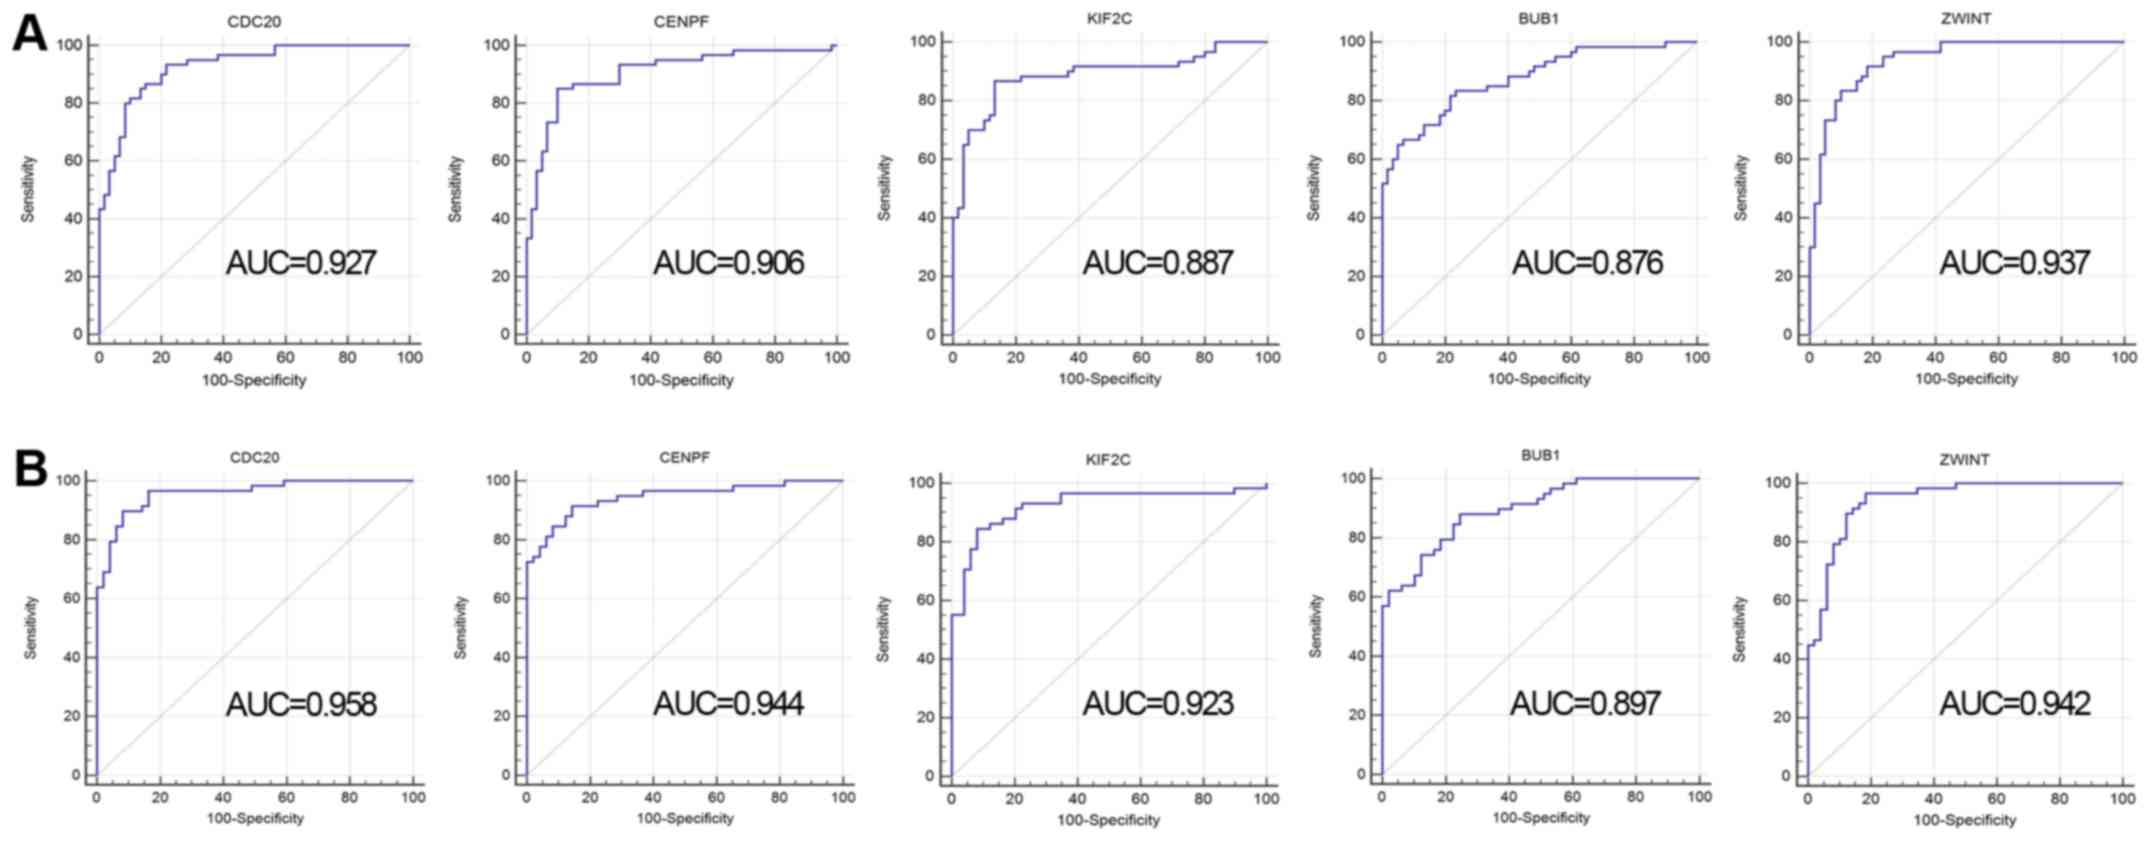
ROC analysis of selected hub
genes
To evaluate the diagnostic value of these 5 hub
genes, ROC analysis was conducted based on these 2 datasets. The
present study demonstrated that the sensitivity and specificity of
these 5 genes was relatively high. As shown in Fig. 4A, the AUC values for CDC20, CENPF,
KIF2C, BUB1 and ZWINT were 0.927, 0.906, 0.887, 0.876,
and 0.937, respectively in the GSE19804 dataset, while the values
were 0.958, 0.944, 0.923, 0.897, and 0.942, respectively in the
GSE10072 dataset (Fig. 4B). These
results indicate that these 5 hub genes may be sensitive and
specific in distinguishing NSCLC tissues from normal tissues.
Kaplan-Meier plotter analysis of
selected hub genes
The prognostic value of these 5 genes in PPI network
was evaluated using the Kaplan-Meier plotter as previous described
(14). Based on the low and high
expression of each hub gene, the overall survival of patients with
NSCLC was obtained for each gene. As shown in Fig. 5, the high mRNA expression of
CDC20 (HR, 1.82; CI, 1.6–2.07) was associated with a poorer
overall survival for patients with NSCLC. Similar associations were
detected for: CENPF (HR, 1.57, CI, 1.38–1.78), KIF2C
(HR, 1.78; CI, 1.57–2.03), BUB1 (HR, 1.83; CI, 1.61–2.09)
and ZWINT (HR, 1.5; CI, 1.32–1.71). These results indicate
that these 5 hub genes may serve as potential prognostic biomarkers
for patients with NSCLC.
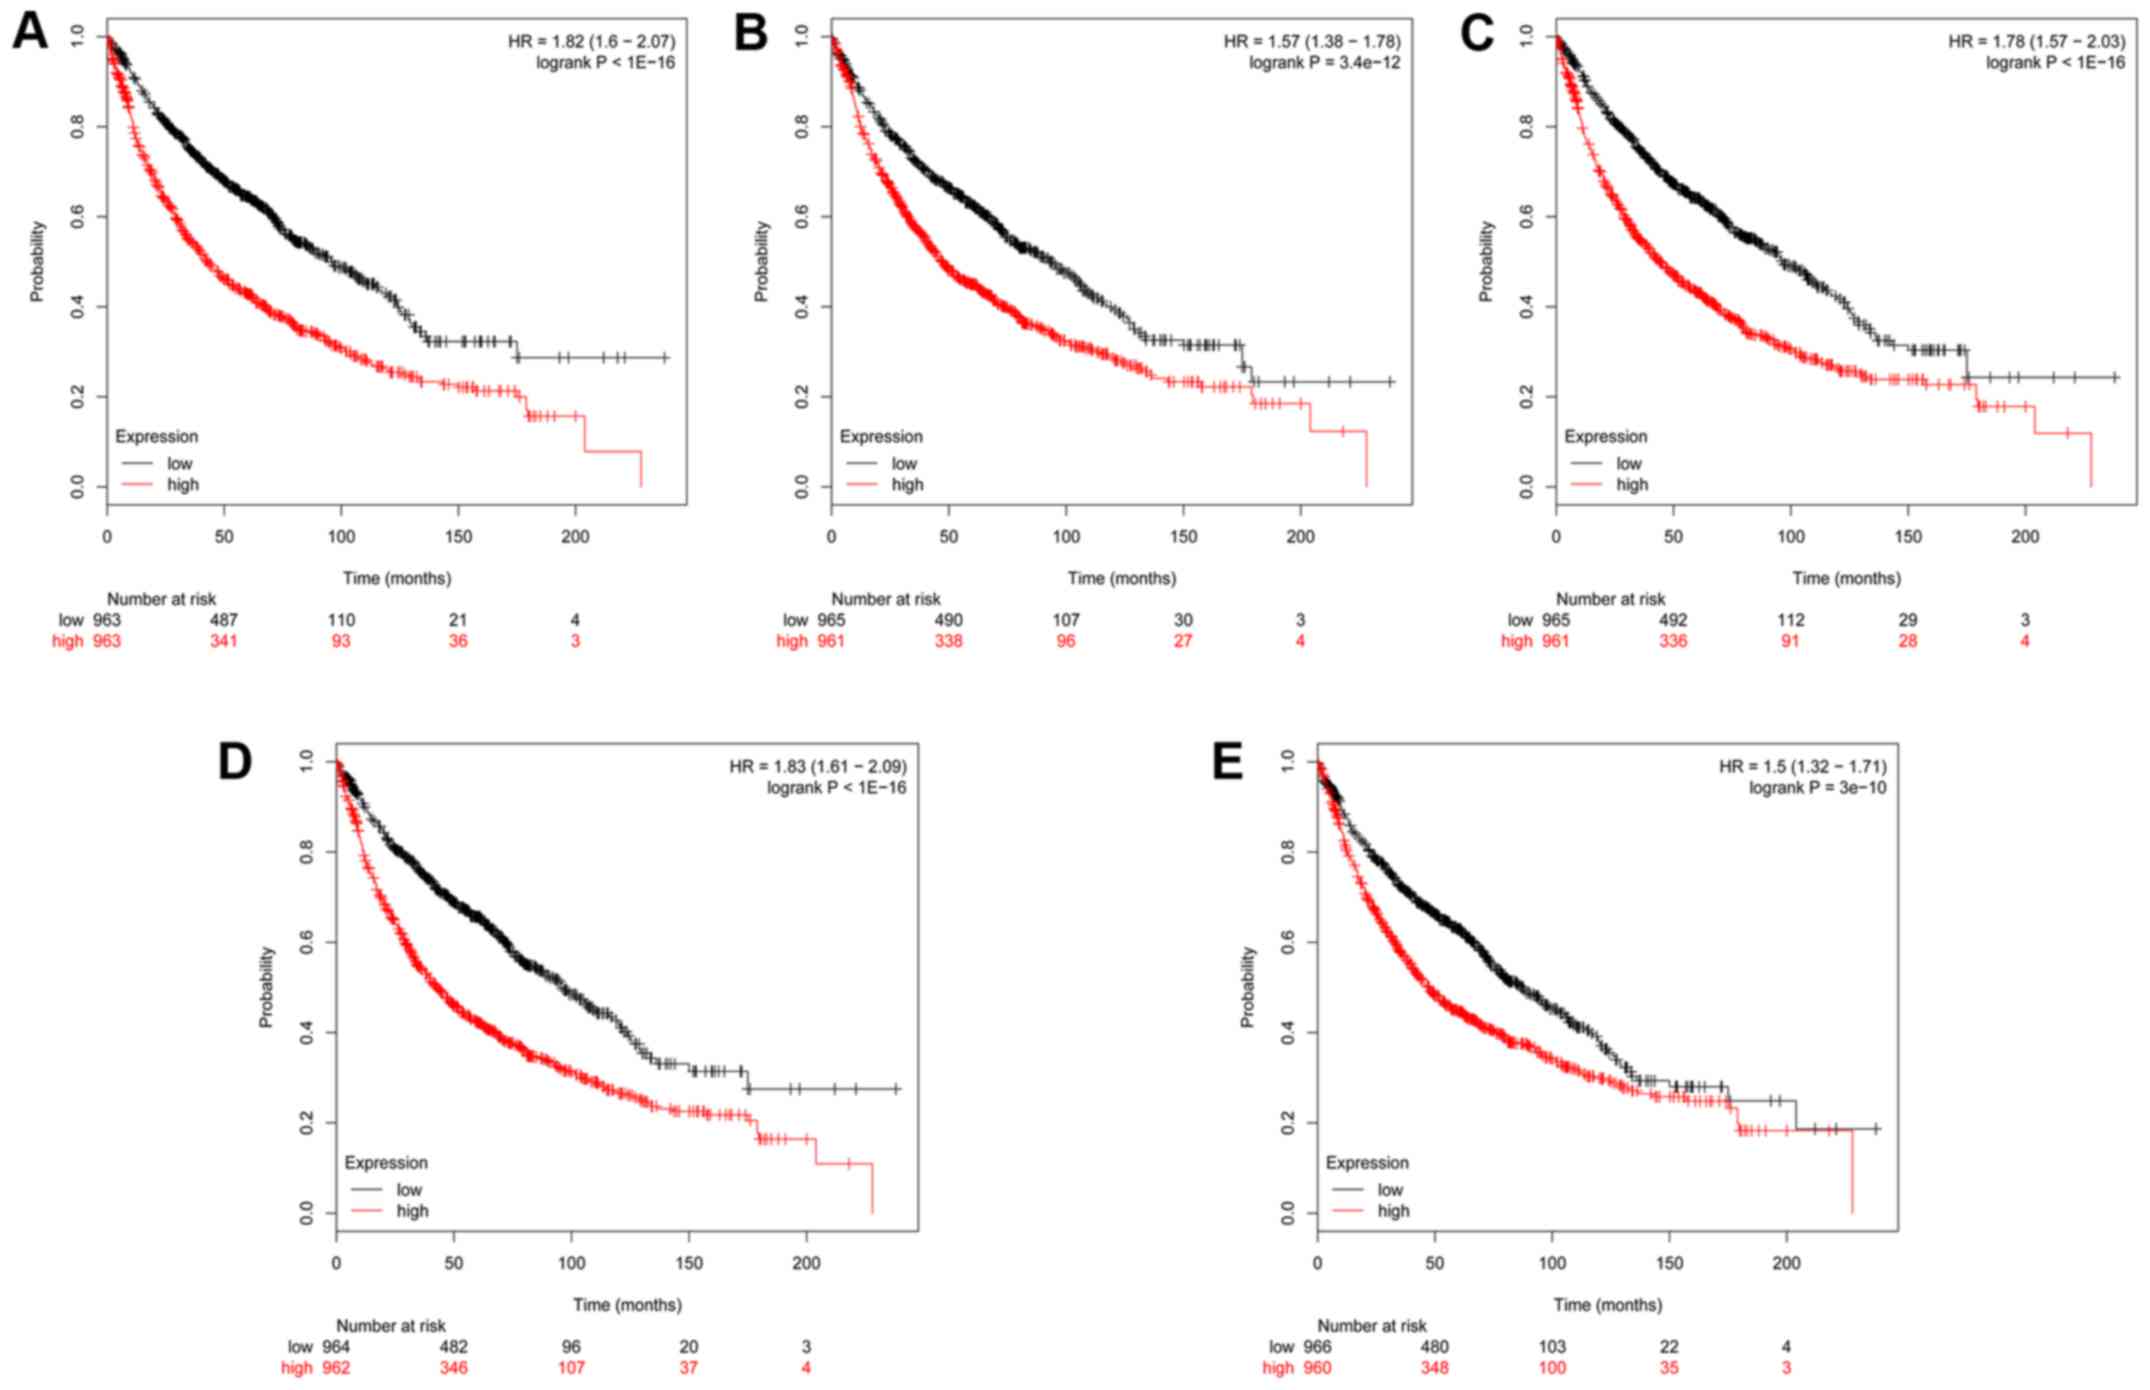 | Figure 5.Kaplan-Meier survival analysis of 5
hub genes in patients with non-small cell lung cancer. Prognostic
value of (A) CDC20, (B) CENPF, (C) KIF2C, (D)
BUB1 and (E) ZWINT were evaluated using the
Kaplan-Meier plotter. The Affymetrix IDs of the genes are as
follows: CDC20, 202870_s_; CENPF, 209172_s_;
KIF2C, 209408_at; BUB1, 209642_at; ZWINT,
204026_s_. CDC20, cell division cycle 20; CENPF, centromere protein
F; HR, hazard ratio; KIF2C, kinesin family member 2C; BUB1, BUB1
mitotic checkpoint serine/threonine kinase; ZWINT, ZW10 interacting
kinetochore protein. |
Discussion
In the present study, the mRNA level of five genes
identified from the GSE19804 dataset, CDC20, CENPF, KIF2C,
BUB1 and ZWINT, were demonstrated to be upregulated in
NSCLC samples. This was validated using the GSE10072 dataset and
RT-qPCR. By employing ROC curve and Kaplan-Meier plotter analyses,
it was further demonstrated that these five candidates were
sensitive and specific in distinguishing NSCLC tissues from normal
tissues, and these candidate genes were associated with a poor
overall survival in patients with NSCLC.
Although advances in surgery and chemotherapy have
improved the prognosis of patients with NSCLC, NSCLC remains the
leading cause of cancer-associated mortalities worldwide (1). However, due to a lack of specific
biomarkers and typical symptoms, patients with NSCLC are commonly
diagnosed at late stages of the disease (3). Therefore, it is important to elucidate
the molecular mechanisms of NSCLC and identify more specific
biomarkers for patients with NSCLC.
A combination of high-throughput sequencing and
bioinformatics analysis has been previously employed to search for
sensitive biomarkers for patients with NSCLC (4,8). In the
present study, in order to identify potential biomarkers of NSCLC,
the gene expression profiles in the dataset GSE19804 were obtained
and DEGs in NSCLC tissues were subsequently identified (Fig. 1). Using a combination of PPI analysis
and subsequent selection of modules, five hub genes (CDC20,
CENPF, KIF2C, BUB1 and ZWINT) that were overexpressed in
NSCLC tissues were selected as potential candidates (Fig. 2). However, the repeatability of a
study with a single dataset is usually insufficient. Therefore, an
additional two methods were used to validate the overexpression of
selected genes in NSCLC tissues and cell lines. The upregulation of
the candidate genes were validated by using the GSE10072 dataset
and by RT-qPCR (Fig. 3). The 5
candidates were further evaluated using the ROC and Kaplan-Meier
plotter analyses to assess their diagnostic and prognostic values.
Notably, the results obtained were consistent with those of
previous studies (4,6). These identified candidates were also
verified to be potential diagnostic and prognostic biomarkers for
patients with NSCLC.
The cell cycle is an evolutionarily conserved
process that is regulated by several molecules, including cyclins
and cyclin-dependent kinases. Cell cycle is critical for the growth
and development of mammalian cells (17). Mutations in these proteins and
subsequent cell cycle aberrations are common hallmarks of human
cancer (18). Although these aberrant
cell cycle-associated molecules are not specific to a particular
cancer type, they can still serve as potential candidates for the
diagnosis or prognosis of patients with cancer (4,15). For
instance, the level of cyclinB2, a member of the cyclin family, has
been regarded as an unfavorable predictor for the clinical
progression and prognosis for patients with NSCLC (19). The present study also identified 5
cell cycle-associated candidates (20–24), which
are sensitive and specific in distinguishing NSCLC from normal
tissues, and these candidate genes were associated with poor
prognosis of NSCLC. Among these candidates, the overexpression of
CDC20 has been used to predict the poor prognosis of
patients with NSCLC (25).
Furthermore, a number of chemotherapeutics have been designed to
target these cell cycle-associated molecules and therefore
eradicate cancer cells (26). The
present study postulates that these 5 identified candidates may
possess the potential to serve as novel therapeutic targets for
patients with NSCLC.
In summary, the present study has demonstrated that
the candidates CDC20, CENPF, KIF2C, BUB1, and ZWINT
are overexpressed in NSCLC tissues, which may be unfavorable
prognostic biomarkers for patients with NSCLC. By classifying
patients into high- and low-risk groups, patients may benefit from
more accurate decision-making in treatment selection and ultimately
have an improved clinical outcome. However, due to the different
histopathological typing and grouping methods used in the two
datasets, further validation of these five candidates for their
diagnostic and prognostic values in the clinical samples are
required.
Acknowledgments
Not applicable.
Funding
No funding was received.
Availability of data and materials
The datasets used and/or analyzed during the current
study are available from the corresponding author on reasonable
request.
Author's contributions
LG initiated the project and designed the research
plan. RH performed the experiments and analyzed the data. RH and LG
wrote and approved the manuscript.
Ethics approval and consent to
participate
Not applicable.
Consent for publication
Not applicable.
Competing interests
The authors declare that they have no competing
interests.
References
|
1
|
Smith RA, Manassaram-Baptiste D, Brooks D,
Doroshenk M, Fedewa S, Saslow D, Brawley OW and Wender R: Cancer
screening in the United States, 2015: A review of current American
cancer society guidelines and current issues in cancer screening.
CA Cancer J Clin. 65:30–54. 2015. View Article : Google Scholar : PubMed/NCBI
|
|
2
|
Thomas A, Liu SV, Subramaniam DS and
Giaccone G: Refining the treatment of NSCLC according to
histological and molecular subtypes. Nat Rev Clin Oncol.
12:511–526. 2015. View Article : Google Scholar : PubMed/NCBI
|
|
3
|
van Meerbeeck JP, Fennell DA and De
Ruysscher DK: Small-cell lung cancer. Lancet. 378:1741–1755. 2011.
View Article : Google Scholar : PubMed/NCBI
|
|
4
|
Lu Y, Lemon W, Liu PY, Yi Y, Morrison C,
Yang P, Sun Z, Szoke J, Gerald WL, Watson M, et al: A gene
expression signature predicts survival of patients with stage I
non-small cell lung cancer. PLoS Med. 3:e4672006. View Article : Google Scholar : PubMed/NCBI
|
|
5
|
Chen F, Xiang CX, Zhou Y, Ao XS, Zhou DQ,
Peng P, Zhang HQ, Liu HD and Huang X: Gene expression profile for
predicting survival of patients with meningioma. Int J Oncol.
46:791–797. 2015. View Article : Google Scholar : PubMed/NCBI
|
|
6
|
Xu Z, Zhou Y, Cao Y, Dinh TL, Wan J and
Zhao M: Identification of candidate biomarkers and analysis of
prognostic values in ovarian cancer by integrated bioinformatics
analysis. Med Oncol. 33:1302016. View Article : Google Scholar : PubMed/NCBI
|
|
7
|
Ioannidis JP, Allison DB, Ball CA,
Coulibaly I, Cui X, Culhane AC, Falchi M, Furlanello C, Game L,
Jurman G, et al: Repeatability of published microarray gene
expression analyses. Nat Genet. 41:149–155. 2009. View Article : Google Scholar : PubMed/NCBI
|
|
8
|
Lu TP, Tsai MH, Lee JM, Hsu CP, Chen PC,
Lin CW, Shih JY, Yang PC, Hsiao CK, Lai LC and Chuang EY:
Identification of a novel biomarker, SEMA5A, for non-small cell
lung carcinoma in nonsmoking women. Cancer Epidemiol Biomarkers
Prev. 19:2590–2597. 2010. View Article : Google Scholar : PubMed/NCBI
|
|
9
|
Landi MT, Dracheva T, Rotunno M, Figueroa
JD, Liu H, Dasgupta A, Mann FE, Fukuoka J, Hames M, Bergen AW, et
al: Gene expression signature of cigarette smoking and its role in
lung adenocarcinoma development and survival. PLoS One.
3:e16512008. View Article : Google Scholar : PubMed/NCBI
|
|
10
|
Barrett T, Wilhite SE, Ledoux P,
Evangelista C, Kim IF, Tomashevsky M, Marshall KA, Phillippy KH,
Sherman PM, Holko M, et al: NCBI GEO: Archive for functional
genomics data sets-update. Nucleic Acids Res. 41:(Database Issue).
D991–D995. 2013. View Article : Google Scholar : PubMed/NCBI
|
|
11
|
Szklarczyk D, Franceschini A, Wyder S,
Forslund K, Heller D, Huerta-Cepas J, Simonovic M, Roth A, Santos
A, Tsafou KP, et al: STRING v10: Protein-protein interaction
networks, integrated over the tree of life. Nucl Acids Res.
43:(Database Issue). D447–D452. 2015. View Article : Google Scholar : PubMed/NCBI
|
|
12
|
Sun B, Gao L, Ahsan A, Chu P, Song Y, Li
H, Zhang Z, Lin Y, Peng J, Song Z, et al: Anticancer effect of
SZC015 on lung cancer cells through ROS-dependent apoptosis and
autophagy induction mechanisms in vitro. Int Immunopharmacol.
40:400–409. 2016. View Article : Google Scholar : PubMed/NCBI
|
|
13
|
Livak KJ and Schmittgen TD: Analysis of
relative gene expression data using real-time quantitative PCR and
the 2(-Delta Delta C(T)) method. Methods. 25:402–408. 2001.
View Article : Google Scholar : PubMed/NCBI
|
|
14
|
Győrffy B, Surowiak P, Budczies J and
Lanczky A: Online survival analysis software to assess the
prognostic value of biomarkers using transcriptomic data in
non-small-cell lung cancer. PLoS One. 8:e822412013. View Article : Google Scholar : PubMed/NCBI
|
|
15
|
Shi YX, Zhu T, Zou T, Zhuo W, Chen YX,
Huang MS, Zheng W, Wang CJ, Li X, Mao XY, et al: Prognostic and
predictive values of CDK1 and MAD2L1 in lung adenocarcinoma.
Oncotarget. 7:85235–85243. 2016. View Article : Google Scholar : PubMed/NCBI
|
|
16
|
Gong Y, Yao E, Shen R, Goel A, Arcila M,
Teruya-Feldstein J, Zakowski MF, Frankel S, Peifer M, Thomas RK, et
al: High expression levels of total IGF-1R and sensitivity of NSCLC
cells in vitro to an anti-IGF-1R antibody (R1507). PLoS One.
4:e72732009. View Article : Google Scholar : PubMed/NCBI
|
|
17
|
Dominguez-Brauer C, Thu KL, Mason JM,
Blaser H, Bray MR and Mak TW: Targeting mitosis in cancer: Emerging
strategies. Mol Cell. 60:524–536. 2015. View Article : Google Scholar : PubMed/NCBI
|
|
18
|
Hydbring P, Malumbres M and Sicinski P:
Non-canonical functions of cell cycle cyclins and cyclin-dependent
kinases. Nat Rev Mol Cell Biol. 17:280–292. 2016. View Article : Google Scholar : PubMed/NCBI
|
|
19
|
Qian X, Song X, He Y, Yang Z, Sun T, Wang
J, Zhu G, Xing W and You C: CCNB2 overexpression is a poor
prognostic biomarker in Chinese NSCLC patients. Biomed
Pharmacother. 74:222–227. 2015. View Article : Google Scholar : PubMed/NCBI
|
|
20
|
Frescas D and Pagano M: Deregulated
proteolysis by the F-box proteins SKP2 and beta-TrCP: Tipping the
scales of cancer. Nat Rev Cancer. 8:438–449. 2008. View Article : Google Scholar : PubMed/NCBI
|
|
21
|
Varis A, Salmela AL and Kallio MJ: Cenp-F
(mitosin) is more than a mitotic marker. Chromosoma. 115:288–295.
2006. View Article : Google Scholar : PubMed/NCBI
|
|
22
|
Wordeman L: Microtubule-depolymerizing
kinesins. Curr Opin Cell Biol. 17:82–88. 2005. View Article : Google Scholar : PubMed/NCBI
|
|
23
|
Taylor SS and McKeon F: Kinetochore
localization of murine Bub1 is required for normal mitotic timing
and checkpoint response to spindle damage. Cell. 89:727–735. 1997.
View Article : Google Scholar : PubMed/NCBI
|
|
24
|
Seo Woo D, You Yeop S, Chung WJ, Cho DH,
Kim JS and Oh Su J: Zwint-1 is required for spindle assembly
checkpoint function and kinetochore-microtubule attachment during
oocyte meiosis. Sci Rep. 5:154312015. View Article : Google Scholar : PubMed/NCBI
|
|
25
|
Kato T, Daigo Y, Aragaki M, Ishikawa K,
Sato M and Kaji M: Overexpression of CDC20 predicts poor prognosis
in primary non-small cell lung cancer patients. J Surg Oncol.
106:423–430. 2012. View Article : Google Scholar : PubMed/NCBI
|
|
26
|
Malumbres M: Therapeutic opportunities to
control tumor cell cycles Clin Transl Oncol. 8:399–408.
2006.PubMed/NCBI
|