Introduction
Dynamic contrast-enhanced magnetic resonance imaging
(DCE-MRI) is increasingly used for breast cancer diagnosis as an
adjunct to conventional imaging techniques (1). It is used for all stages of management,
including detection, diagnosis, pre-operative staging, therapy
response monitoring and surveillance (2–6). Breast
MRI has demonstrated a high sensitivity, but with the shortcoming
of varying specificity, reported from 0.37 to 0.97 (3,7), which may
lead to unnecessary biopsies. Studies have demonstrated that using
morphological features in routine clinical practice as additional
diagnostic criteria in breast MRI can improve specificity without
significantly reducing sensitivity (8,9).
Currently, computer-assisted diagnosis (CAD) systems
for breast MRI are increasingly used in clinical practice in order
to reduce inter-observer variations in interpretations by
facilitating a quantitative and objective evaluation of the images
(10), thus shortening the time to
diagnosis.
Diffusion weighted MRI (DWI) reflects the movement
of water within tissues by measuring the degree of random molecular
motion, which is quantified by the apparent diffusion coefficient
(ADC) value. Previous studies (11,12) used
DWI as an additional tool for diagnosing breast cancer and found
that the ADC is significantly lower in malignant tumors than in
benign breast lesions or normal tissue. The observed low ADC values
associated with malignancy are mainly due to high cell density,
which causes increased restriction of the extracellular matrix and
increased fraction of signal from intracellular water (11). Through combined ADC and dynamic
contrast-enhanced kinetics, the diagnostic accuracy of breast MRI
has improved (13). Yabuuchi et
al (14) reported a high accuracy
for enhancing breast masses through a combination of DWI and
DCE-MRI features. However, the interpretation of breast DCE-MRI
imaging is mainly based on judgments from radiologists; it will be
beneficiary to derive discrimination rules provided by CAD. To the
best of our knowledge, no published studies have conducted a robust
assessment by incorporating morphology and texture features, and
kinetic features provided by CAD and ADC into a multivariable
diagnostic model for the discrimination of breast masses.
The purpose of this study was to retrospectively
investigate whether combining morphology, texture features and
kinetic features with ADC using quantitative analysis improves the
accuracy for differentiating between benign and malignant breast
lesions in MRI.
Materials and methods
Patients and lesions
In total, 320 patients came to Sun Yat-sen
University Cancer Center for clinically indicated bilateral breast
MRI between September 2008 and December 2011. The patients' breast
MRI examinations were retrospectively reviewed. The MRI studies of
205 women with 275 breast lesions met the following inclusion
criteria in the present study: i) MRI was performed using a 1.5-T
magnet; ii) both DCE-MRI imaging and DWI imaging sequences were
performed; iii) diagnosis was confirmed following pathological
analysis subsequent to core-needle biopsy or surgical excision (248
lesions), or lesion stability was confirmed at a minimum follow-up
of 2 years (27 lesions); iv) lesions presented as a mass according
to the breast imaging reporting and data system MRI lexicon; and v)
patients had not received a biopsy or received therapy prior to MRI
examination. Of the 320 patients, 23 were excluded for not having a
suspicious abnormality on dynamic images, 40 were excluded for
non-mass-like enhancement, 16 were excluded because their
pathological results were not determined, 20 were excluded for
having lesions without a sufficient follow-up period, and 16 were
excluded for inadequate fat suppression on DWI images.
MRI image acquisition
Imaging was performed with a GE Signa HDx 1.5-T
superconductive magnetic system, using a bilateral, dedicated
four-channel phased-array breast coil in the prone position.
Standard imaging was performed, including an axial fast spin echo
(FSE) T1WI and an axial and sagittal FSE T2WI. Subsequently, DWI
images were acquired in the axial planes, prior to gadolinium-based
contrast material injection, using: A spin-echo single-shot echo
planar imaging sequence; array spatial sensitivity encoding
technique (acceleration factor of two); b values of 0 and 800
sec/mm2; fat suppression; 5,000/75 (repetition time
msec/echo time msec); 5 mm section thickness; a 30×30 cm field of
view; a 128×128 matrix; 0 mm section gap; and 130 sec acquisition
time.
Subsequently, after one set of unenhanced baseline
images, dynamic contrast-enhanced MRI data were acquired using an
MRI-specific automatic power injector (Medrad Inc., Pittsburgh, PA,
USA) to inject 0.1 mmol/kg body weight contrast medium gadolinium
diethylenetriamine penta-acetic acid (Gd-DTPA), with a hand
venipuncture technique at a rate of 3 ml/sec. Saline (10 ml at 3
ml/sec) was then injected to wash the tube. Dynamic scanning was
initiated by simultaneously pushing the high-pressure syringe
button and the dynamic scan button. Nine post-contrast sets were
acquired. Each sequence was performed in the sagittal plane at 20
sec intervals with fat suppression using: Three-dimensional spoiled
gradient recall echo sequence; 5.5/2.6 repetition time msec/echo
time msec; 3.4 mm slice thickness; 15° flip angle; a 22×22 cm field
of view; a 288×192 matrix; and a 59 sec acquisition time.
Subsequently, axial MRI was employed using fat-suppressed enhanced
T1WI sequence.
Data analyses
All images were analyzed independently by two
radiologists with ten years experience in interpreting breast MRI.
They were blinded to the histological results of current patients.
The images were assessed independently and any disagreements were
resolved by achieving consensus. All lesions were assessed using
The Breast Imaging Reporting and Data System (BI-RADS) (15). BI-RADS category 1 (negative) and
category 2 (benign) denote an essentially 0% likelihood of cancer.
BI-RADS category 3 (probably benign) assessment is more intuitive
and can be recommended in the case of a unique focal finding for
which the likelihood of malignancy is ≥0% but ≤2%. BI-RADS category
4 (suspicious) and category 5 (highly suggestive of malignancy)
describe MRI findings that are suspicious enough to warrant tissue
diagnosis. BI-RADS category 6 (known biopsy-proven malignancy)
describes MRI findings of biopsy-proven breast cancer for which
surgical excision is recommended when clinically appropriate. All
images were analyzed on a workstation (Centricity Radiology RA 600
V 7.0; GE Healthcare, Chicago, IL, USA). All quantitative analysis
software was written in MATLAB (MathWorks, Natick, MA, USA;
http://www.mathworks.com).
Analysis of lesion kinetics
For kinetic analysis, time-signal intensity curves
were obtained from manually drawn regions of interest (ROIs), the
size of which varied with the size of the enhancing lesion and were
chosen to selectively include the area with the strongest
enhancement, as identified on the first post contrast subtracted
image. The early-phase enhancement rate and the signal enhancement
ratio (SER) (16) were quantified by
means of an ROI-based determination of lesion signal intensity
prior and subsequent to the injection of Gd-DTPA. The early-phase
enhancement was calculated according to the enhancement formula
(SI1-SI0)/SI0 ×100 (17) and SER was defined as
(SI1-SI0)/(SIlast-SI0),
where SI0, SI1, and SIlast
represent the signal intensity in the pre-contrast, the first
post-contrast and the last images, respectively.
Analysis of morphological and texture
features
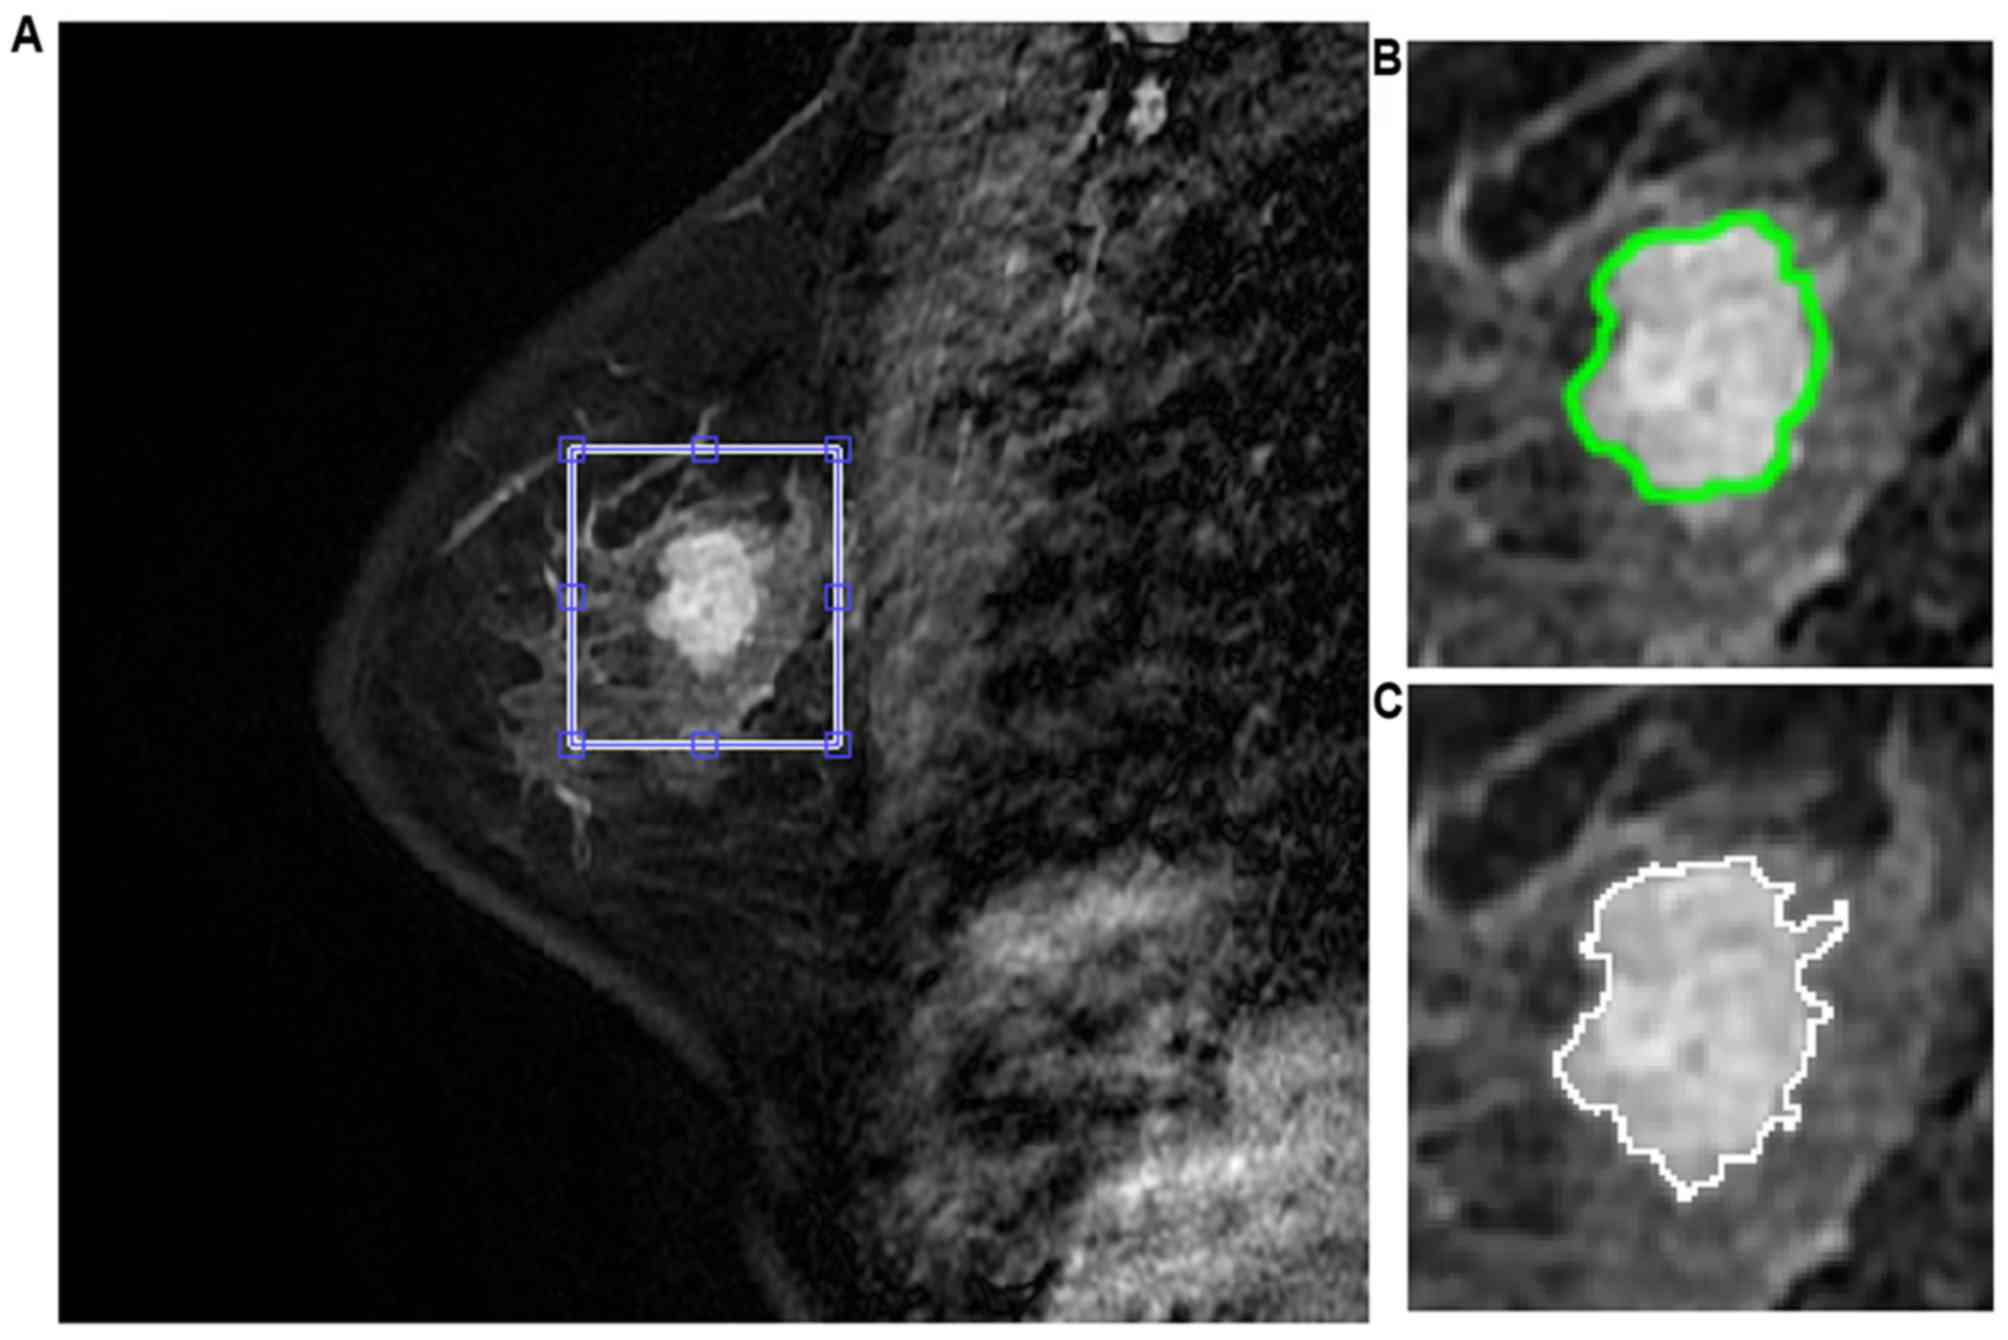
Following manual lesion identification, automatic
segmentation was undertaken for lesion contours. The segmentation
used a novel two-step approach that incorporated fuzzy c-means
(FCM) clustering (18) and gradient
vector flow snake algorithm (19).
The FCM clustering based method was used to obtain initialization
for commencement of segmentation while the gradient vector flow
snake model was further applied to obtain the exact segmentation
(Fig. 1). A total of 13 texture
features were estimated from the gray level co-occurrence matrix
(GLCM) (20). The parameters
included: Angular second moment; contrast; correlation; inverse
difference moment; sum average; sum variance; sum entropy; entropy;
difference average; difference variance; difference entropy;
information measure of correlation 1; and information measure of
correlation 2 (21). In total, 11
morphological features, including compactness, spiculation, extent,
elongation, solidity, circularity, entropy of radial length
distribution, fractal, heterogeneity, area and eccentricity, were
also computed (22).
Breast masses in the study were all verified
histopathologically (Table I), or the
diagnosis was confirmed following at ≥2 years of follow-up. Lesion
status was used as baseline for statistical evaluation of the
performance of the features. The whole patients set was randomly
divided into two sets, one for classifier training and the other
for testing the performance of the classifier. The ten-fold cross
validation scheme was used to evaluate and find the classifier with
the best performance.
 | Table I.Histopathology of benign and
malignant breast lesions. |
Table I.
Histopathology of benign and
malignant breast lesions.
| Tumor group | Number | Percentage |
|---|
| Malignant
lesions | 171 | 62.2 |
|
Invasive ductal carcinoma | 136 | 79.5 |
|
Intra-ductal carcinoma | 23 | 13.4 |
| Lobular
carcinoma | 2 | 1.2 |
|
Mucinous carcinoma | 3 | 1.8 |
|
Medullary carcinoma | 1 | 0.6 |
|
Others | 6 | 3.5 |
| Benign lesions | 104 | 37.8 |
|
Fibroadenosis | 64 | 61.6 |
|
Intraductal papilloma | 4 | 3.8 |
|
Hyperplasia | 4 | 3.8 |
|
Phyllodes tumor | 2 | 1.9 |
|
Adenomyosis epithelioma | 1 | 1 |
|
Inflammation | 2 | 1.9 |
| Follow-up | 27 | 26 |
Analysis of ADC
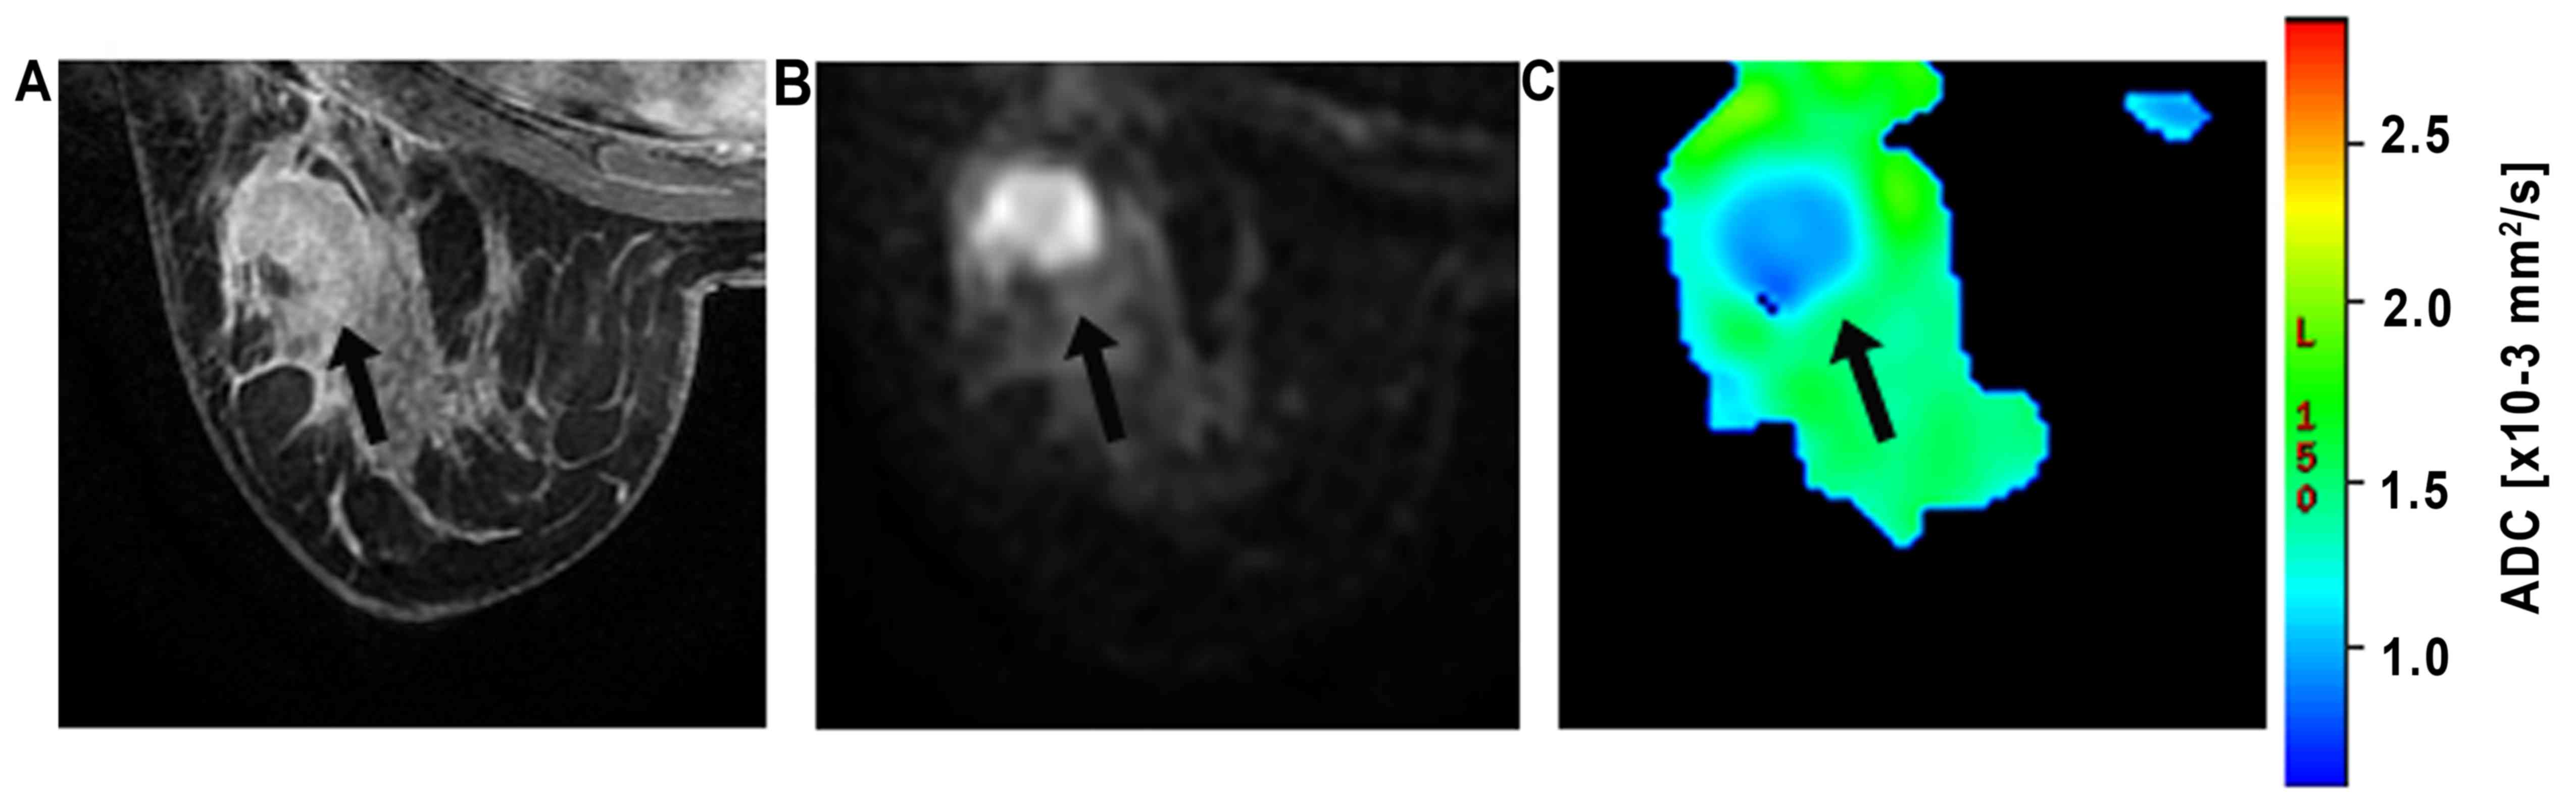
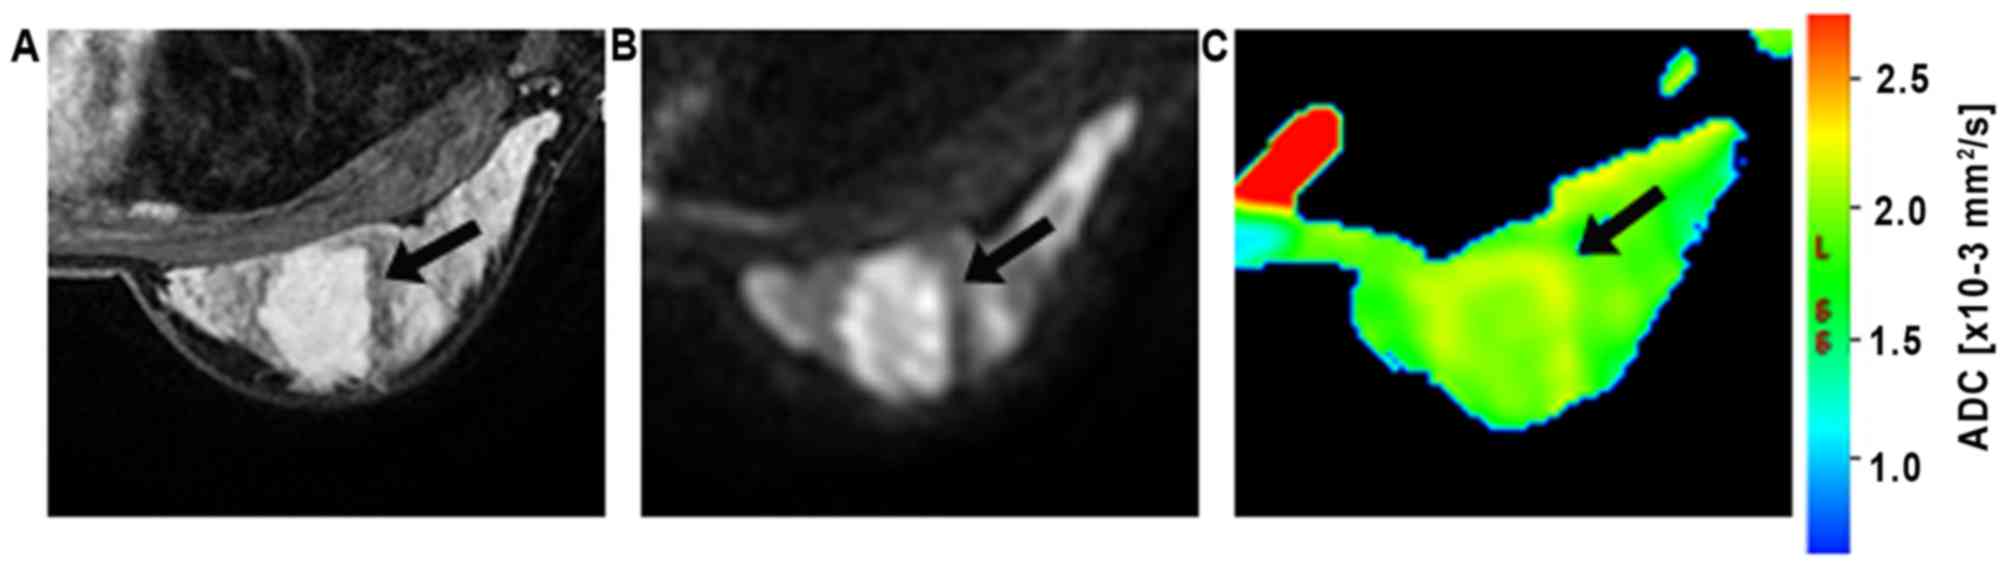
The ROIs were manually drawn on the
diffusion-weighted images (b=800 s/mm2; Figs. 2 and 3)
and were placed in regions with high signal intensity on the
images. The contrast and morphological characteristics at the early
phase of contrast-enhanced T1-weighted imaging and T2-weighted
imaging were used to guide ROI placement to prevent areas of T2
shine-through, which was usually found in necrotic or cystic parts.
The ROIs were defined as the area slightly smaller than the actual
lesions to reduce partial volume effects. In the current study, all
ROIs were >20 mm2 (23). The DWI intensity for each lesion was
classified as high or low compared to that of the corresponding
background breast tissue. The mean ADC of the voxels in ROIs were
then obtained.
Statistical analysis
Morphological features were shown to perform well in
terms of discriminating lesion types (8). Meanwhile, using the textural or kinetic
measurements alone can also shade light in the characteristics of
lesions, shown in Table II.
Therefore, the combination of the merits of the characterization
parameters, including morphological, textural and kinetic
measurements, was expected to achieve a better, or at least
comparable performance compared with individual measurements. The
combination of the parameters as whole reflected different aspects
of lesion properties and was a potentially comprehensive approach
to the characterization of lesion status.
| Table II.Group mean, P-values and diagnostic
accuracy of selected parameters. |
Table II.
Group mean, P-values and diagnostic
accuracy of selected parameters.
| Parameters | Benigna |
Malignanta |
P-valueb | Diagnostic
accuracyc | Threshold
value |
|---|
| Heterogeneity | −0.054±1.061 | 0.033±0.964 | 0.486 | 0.633 | 0.17 |
| Area | −0.403±0.751 | 0.245±1.053 | <0.001 | 0.742 | 440.00 |
| Sum variance | 0.373±1.094 | −0.227±0.866 | <0.001 | 0.684 | 11582.00 |
| Sum entropy | −0.508±1.057 | 0.309±0.825 | <0.001 | 0.709 | 7.88 |
| Difference
entropy | −0.171±1.112 | 0.104±0.914 | 0.003 | 0.647 | 5.06 |
| SER | −0.826±0.756 | 0.502±0.771 | 0 | 0.876 | 0.34 |
In total, 24 features were initially estimated from
the segmented lesion image. Since the features may be
self-dependent or irrelevant to the lesion type, an exhaustive
feature selection method was used to find an optimal feature subset
in which the classification accuracy is highest (24). The differentiation of malignant from
benign lesions was treated as a two-class pattern classification
problem. A newly reported classification model, the
difference-weighted local hyperplane classification model (DWLH),
was used to select the feature subset and to evaluate the
performance of the combined feature subsets (25). In the classification model, a local
hyperplane is constructed from its nearest neighbor for each
observed sample. The label of the sample is decided by the
minimized distance to its class-dependent hyperplane. The
performance of the model is superior to that of the classical
k-nearest neighbors algorithm in that the local hyperplane is
robust to noises and outliers (26).
The present study selected DWLH, not only because of its superior
performance over classical models, including the support vector
machine, but also as a result of the rationale behind its
mathematical formulation (27). Since
lesions usually share certain pictorial similarities among patients
with the same type lesions, the status of lesion could be deducted
from its nearest neighbors, other than particular one as k-nearest
neighbors does. This follows the same rationale with the classifier
of DWLH.
To test the discrimination power of different
characterization of breast masses, the whole dataset where
categorized into six subgroups including morphology, kinetics,
texture features and their combinations. To further evaluate the
discrimination power of ADC, various characteristics of breast
masses were combined with/without ADC, resulting another three data
subgroups. On each subgroup, the classifier of DWLH was evaluated
via ten-fold cross validation scheme. For each experiment, the
averaged accuracy and AUC were calculated to serve as criteria of
the feature performance. To eliminate the statistical variations
during the training phase, the present study conducted 10
classification experiments independently on each dataset. The
averaged classification error was recorded and is presented in
Table III. Receiver operating
characteristic (ROC) analysis was also used to evaluate the
diagnostic performance of the model under various features. The
area under the ROC curve (AUC) served as the criterion for
selecting the best combination.
| Table III.Diagnostic performance
differentiating between malignant and benign lesions. |
Table III.
Diagnostic performance
differentiating between malignant and benign lesions.
| Parameter
selection | Sensitivity | Specificity | Accuracy | AUC |
|---|
| Morphology | 0.57 | 0.78 | 0.70 | 0.68 |
| Kinetics | 0.79 | 0.89 | 0.85 | 0.84 |
| Texture | 0.53 | 0.81 | 0.71 | 0.67 |
|
Morphology+texture+kinetics | 0.81 | 0.91 | 0.87 | 0.86 |
| ADC | 0.78 | 0.90 | 0.84 | 0.83 |
| ADC+kinetics | 0.84 | 0.93 | 0.89 | 0.88 |
|
ADC+morphology+kinetics+texture | 0.85 | 0.94 | 0.90 | 0.90 |
Results
In total, 205 women with 275 lesions met the
inclusion criteria. The mean age of these patients was 46.2±10.9
years (age range, 18–78 years). A total of 48 lesions were assessed
as probably benign finding (BI-RADS category 3), 147 were assessed
as suspicious (BI-RADS category 4), and 80 were assessed as highly
suggestive of malignancy (BI-RADS category 5). Table I exhibits the distribution of
histopathological findings of all analyzed lesions. The mean lesion
size, defined as the longest dimension on DCE-MRI images, was
1.3±2.1 cm (range, 0.5–3.0 cm) for benign lesions and 2.8±1.5 cm
(range, 1.5–5.0 cm) for malignant lesions.
Diagnostic performance of
morphological and kinetic features
Segmentation results of randomly selected sample
breast lesion can be seen in Fig. 1.
In total, 6 features performed optimally in terms of prediction.
The features included two shape (heterogeneity, area) and three
texture (sum variance, sum entropy, difference entropy) parameters
and one kinetic parameter (SER).
The diagnostic performance of each feature used in
the experiment classifier was also evaluated individually. The mean
and standard deviation and the diagnostic performance of the 6
selected parameters are summarized in Table II. Among the 6 parameters, the
diagnostic accuracy of SER was the highest.
Utilization of 5 anatomical features, including
texture and shape parameters, resulted in an AUC of 0.68. The
kinetic parameter SER reached a comparable AUC of 0.84. When
combining these 6 parameters into a unified diagnostic model, the
AUC was further improved to 0.86. This combined classifier achieved
a sensitivity of 0.81 and a specificity of 0.91 with a diagnostic
accuracy of 0.87 (Table III).
Diagnostic performance of ADC
value
A malignant lesion and a benign lesion can be seen
in Fig. 2 and in Fig. 3, respectively. The box plot of the ADC
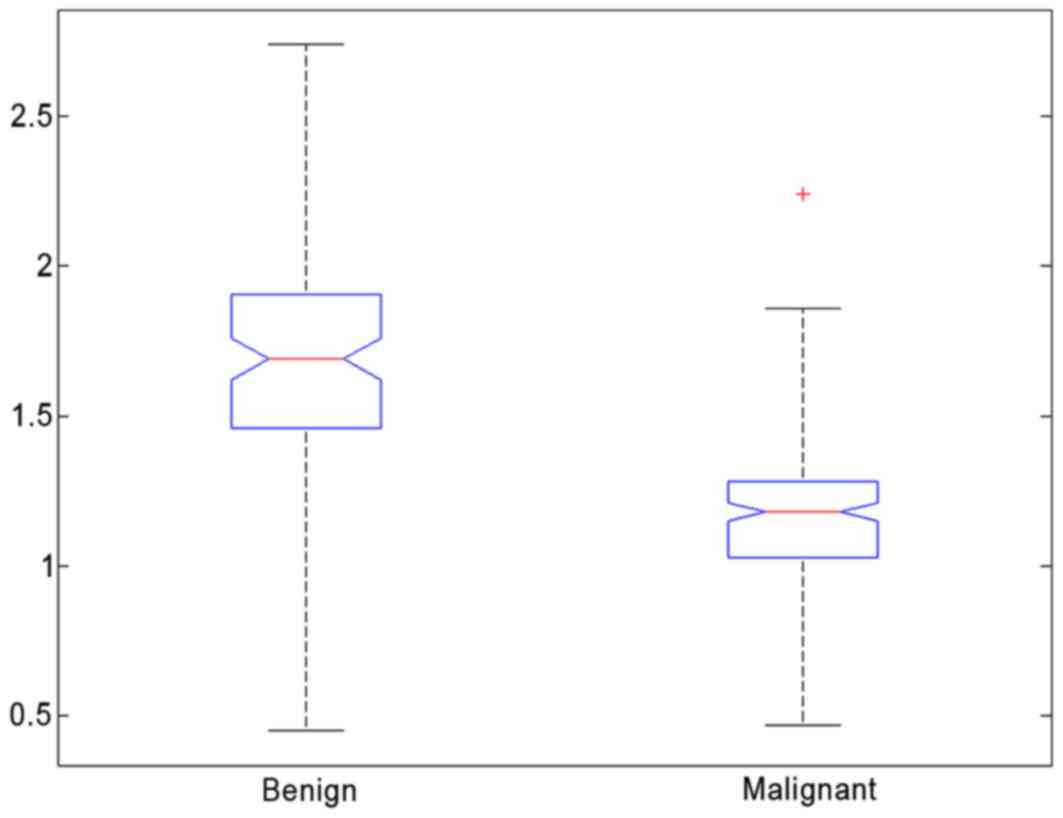
for all patients is shown in Fig. 4.
An overlap of ADC was observed between malignant and benign breast
lesions. The mean ADC of malignant lesions (mean,
1.16×10⁻³ mm2/sec; 95% CI,
1.13×10⁻³ mm2/sec; 1.20×10⁻³
mm2/sec) was significantly lower than that observed for
benign lesions (P<0.05; mean, 1.68×10⁻³
mm2/sec; 95% CI, 1.62×10⁻³
mm2/sec; 1.75×10⁻³ mm2/sec). The
predictive accuracy (sensitivity, specificity) of mean ADC was 0.84
(0.78 and 0.90, respectively; Table
III). Thus, a threshold value of 1.37×10⁻³
mm2/sec can achieve a specificity of 0.90, with a
sensitivity of 0.78, to discriminate between malignant and benign
lesions.
Analysis of the model combining
morphology and kinetic features with ADC values
When the ADC value was incorporated into the feature
sets, the sensitivity, specificity and accuracy of the
classification model increased to 0.85, 0.94 and 0.90, respectively
(Table III). The value of AUC was
dramatically increased from 0.86 to 0.90 by incorporating
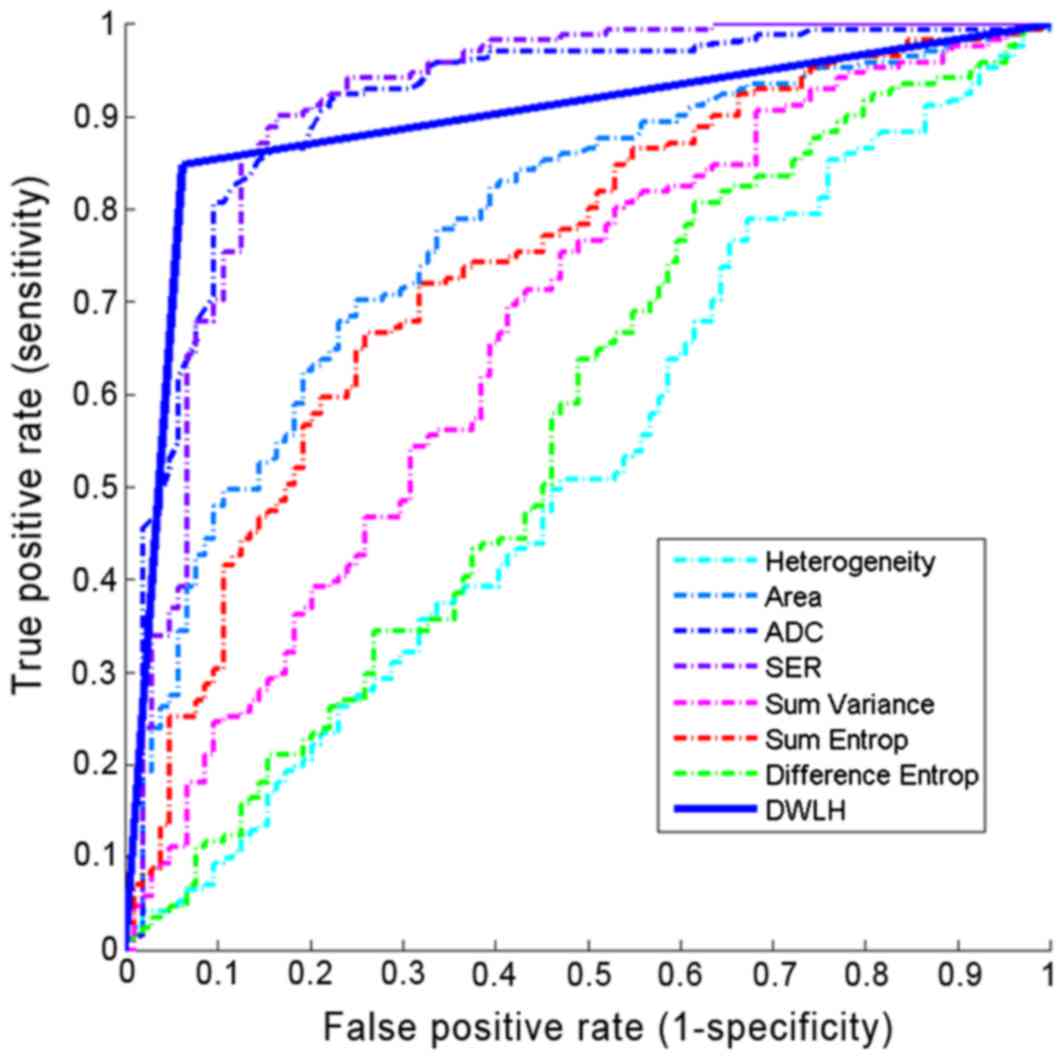
without/with using ADC (Fig. 5). It
implies that the ADC possesses the potential power in
discriminating benign masses from malignant ones. It also suggests
that addition of ADC values enhances the discriminatory power of
the combined feature set.
Discussion
The results of the present study demonstrate that
incorporating morphology and texture features, kinetic features and
ADC into a multivariable diagnostic model in breast MRI increases
diagnostic accuracy. Although previous studies have demonstrated
that the combination of DWI and DCE-MRI can result in high
diagnostic accuracy (28), and the
addition of DWI to DCE-MRI improves the positive predictive value
(PPV) of breast MRI (23), the
assessments were mainly based on the subjective expertise of
individual radiologists. In the current study, the undertaken
contrast-enhanced breast images were analyzed by professional CAD
software, which ensured less human interference and produced
definitive parameters. A series of quantitative analysis was then
followed to study the discrimination potentials of the images. El
Khouli et al (29)
demonstrated that quantitative assessment of the type of contrast
enhancement kinetic curve on breast DCE-MRI for establishing or
excluding malignancy is superior to standard qualitative
assessment.
The present study applied quantitative analysis to
characterize the morphology, texture and kinetic features of breast
lesions and used advanced machine learning techniques to obtain a
classifier for differential diagnosis. A total of 11 morphology, 13
GLCM texture and 2 kinetic features were extracted in order to
characterize each lesion. Furthermore, 2 shape (heterogeneity,
area) and 3 texture (sum variance, sum entropy, difference entropy)
parameters and 1 kinetic parameter (SER) were selected by DWLH
using ten-fold cross validation. The diagnostic performance based
on 2 shape features (heterogeneity, area) and 3 texture features
(sum variance, sum entropy, difference entropy) reached an AUC
value of 0.68. Using the kinetic parameter SER it reached a
comparable AUC of 0.84. When all 6 parameters were combined, the
resulting AUC improved further to 0.86. This finding demonstrates
that the combination of the kinetic enhancement data and morphology
information in a systematic model is the most effective and
comprehensive approach to the diagnosis of breast masses. These
results are consistent with those of Newell et al (28). The performance of the shape and
textural features (AUC=0.68) in the present study is evidently
lower than that of kinetic parameter SER (AUC=0.84), which is
different from the results of Newell et al (28) who received an AUC of 0.87 when using
morphological features to separate between benign and malignant
breast masses and a comparable value of 0.88 when using the kinetic
parameters.
In particular, it was found that SER was an
effective kinetic feature for the diagnosis of breast masses. Its
AUC value was the highest among all the parameters when measured
individually. SER has the advantage of being able to depict the
heterogeneous microvascular network in breast cancers (30). High SER corresponded to early signal
enhancement, with rapid washout of intravenous contrast reflecting
high tumor vascularity. Similarly, low SER correlated with slow and
sustained enhancement of contrast, reflecting low tumor vascularity
(31). SER, based on changes in
signal intensity between 3 time points, is an effective kinetic
parameter in the present study. However, it may be affected by the
selection of time points, by the magnet strength, the sequence
parameters (repetition time, echo time, flip angle) and by the
contrast agent concentration. Therefore, with a different selection
of sequence parameters, or a different selection of time points,
different SER values could be derived, and the diagnostic
effectiveness of SER may be altered.
Contrast-enhanced MRI imaging reflects the tumor
vascular bed and ADC has been demonstrated to correlate with tumor
cellularity density in breast cancer (32). The present results reveal that
diagnostic accuracy is increased when the morphological and kinetic
features are combined with the ADC value. This finding suggests
that DWI may yield information different from and complementary to
that obtained with DCE-MRI (33).
Additionally, the mean ADC of malignant lesions
(mean, 1.16×10⁻³ mm2/sec; 95% CI,
1.13×10⁻³ mm2/sec, 1.20×10⁻³
mm2/sec) in the present study was significantly lower
than that observed for benign lesions (P<0.05; mean,
1.68×10⁻³ mm2/se; 95% CI,
1.62×10⁻³ mm2/sec; 1.75×10⁻³
mm2/sec), which are similar results to other studies
(11,23). The diagnostic accuracy of DW imaging
performed in the present study was 0.87, which is slightly higher
than previous studies (33,34). It may be that the current study only
evaluates breast mass lesions, while the prior studies evaluate
MRI-detected mass and non-mass lesions. Besides, the present DW
imaging protocol is different.
There were several limitations to the current study.
The lesion segmentation was conducted in two-dimensions and high
dimensional description is needed to provide rich spatial
information. However, the segmentation algorithm was based on
enhanced lesion images, and sequences of two-dimensional images can
reflect spatial variations accurately. The present study also had
technical limitations. The DW examinations were acquired with
relatively thick slices (5 mm) in order to achieve an adequate
signal-to-noise ratio. Partial volume averaging within imaging
slices may affect the visibility of a number of lesions on DWI.
This limitation could be overcome by utilizing longer scanning
times or by imaging at higher field strengths (35). Finally, the current study excluded the
non-mass lesions. This is as non-mass-like enhancement lesions
exhibit poorly defined boundaries, which results in difficulty in
the analysis of morphology. Diagnosis of non-mass lesions is much
more challenging. However, kinetics and ADC analysis may be applied
to characterize non-mass lesions. The evaluation of non-mass
lesions may be an important next step.
To conclude, it was found that combining ADC with
quantitative morphology, texture features and kinetic features
improves the accuracy of characterization of breast lesions that
present as a mass. These integrated characteristic parameters are
promising in terms of generating an overall diagnostic marker for
breast masses, which can achieve high levels of diagnostic
accuracy.
Acknowledgments
Not applicable.
Funding
The present study was funded by the Science and
Technology Planning Project of Guangdong Province, China (grant
nos. 2016B090918066, 2016A010101013 and 2017B020226004), the
Science and Technology Program of Guangzhou, China (grant nos.
201704020060 and 201807010057), and the Health and Medical
Collaborative Innovation Project of Guangzhou City (grant nos.
201604020003 and 201803010021).
Availability of data and materials
The datasets used and/or analyzed during the current
study are available from the corresponding author on reasonable
request.
Authors' contributions
XJ, FX and LZL performed data collection, data
analysis, manuscript drafting and revision. YP aided in the image
data collection and data analysis. HC and LL initially developed
the concept of the study and contributed in writing the manuscript
and all revisions. All authors read and approved the final
manuscript.
Ethics approval and consent to
participate
The study was approved by the Ethics Committee of
Sun Yat-sen University Cancer Center (Guangzhou, China).
Consent for publication
All participants provided informed consent for the
publication of this data.
Competing interests
The authors declare that they have no competing
interests.
References
|
1
|
Sardanelli F, Boetes C, Borisch B, Decker
T, Federico M, Gilbert FJ, Helbich T, Heywang-Köbrunner SH, Kaiser
WA, Kerin MJ, et al: Magnetic resonance imaging of the breast:
Recommendations from the EUSOMA working group. Eur J Cancer.
46:1296–1316. 2010. View Article : Google Scholar : PubMed/NCBI
|
|
2
|
Kuhl CK, Schrading S, Leutner CC,
Morakkabati-Spitz N, Wardelmann E, Fimmers R, Kuhn W and Schild HH:
Mammography, breast ultrasound, and magnetic resonance imaging for
surveillance of women at high familial risk for breast cancer. J
Clin Oncol. 23:8469–8476. 2005. View Article : Google Scholar : PubMed/NCBI
|
|
3
|
Schelfout K, van Goethem M, Kersschot E,
Colpaert C, Schelfhout AM, Leyman P, Verslegers I, Biltjes I, van
den Haute J, Gillardin JP, et al: Contrast-enhanced MR imaging of
breast lesions and effect on treatment. Eur J Surg Oncol.
30:501–507. 2004. View Article : Google Scholar : PubMed/NCBI
|
|
4
|
Tillman GF, Orel SG, Schnall MD, Schultz
DJ, Tan JE and Solin LJ: Effect of breast magnetic resonance
imaging on the clinical management of women with early-stage breast
carcinoma. J Clin Oncol. 20:3413–3423. 2002. View Article : Google Scholar : PubMed/NCBI
|
|
5
|
Semiglazov V: Recist for response
(clinical and imaging) in neoadjuvant clinical trials in operable
breast cancer. J Natl Cancer Inst Monogr. 2015:21–23. 2015.
View Article : Google Scholar : PubMed/NCBI
|
|
6
|
Iwasa H, Kubota K, Hamada N, Nogami M and
Nishioka A: Early prediction of response to neoadjuvant
chemotherapy in patients with breast cancer using
diffusion-weighted imaging and gray-scale ultrasonography. Oncol
Rep. 31:1555–1560. 2014. View Article : Google Scholar : PubMed/NCBI
|
|
7
|
Jansen SA, Fan X, Karczmar GS, Abe H,
Schmidt RA, Giger M and Newstead GM: DCEMRI of breast lesions: Is
kinetic analysis equally effective for both mass and nonmass-like
enhancement? Med Phys. 35:3102–3109. 2008. View Article : Google Scholar : PubMed/NCBI
|
|
8
|
Malich A, Fischer DR, Wurdinger S,
Boettcher J, Marx C, Facius M and Kaiser WA: Potential MRI
interpretation model: Differentiation of benign from malignant
breast masses. AJR Am J Roentgenol. 185:964–970. 2005. View Article : Google Scholar : PubMed/NCBI
|
|
9
|
Kuhl CK: MRI of breast tumors. Eur Radiol.
10:46–58. 2000. View Article : Google Scholar : PubMed/NCBI
|
|
10
|
Jiang Y, Nishikawa RM, Schmidt RA, Metz
CE, Giger ML and Doi K: Improving breast cancer diagnosis with
computer-aided diagnosis. Acad Radiol. 6:22–33. 1999. View Article : Google Scholar : PubMed/NCBI
|
|
11
|
Hatakenaka M, Soeda H, Yabuuchi H, Matsuo
Y, Kamitani T, Oda Y, Tsuneyoshi M and Honda H: Apparent diffusion
coefficients of breast tumors: Clinical application. Magn Reson Med
Sci. 7:23–29. 2008. View Article : Google Scholar : PubMed/NCBI
|
|
12
|
Rubesova E, Grell AS, de Maertelaer V,
Metens T, Chao SL and Lemort M: Quantitative diffusion imaging in
breast cancer: A clinical prospective study. J Magn Reson Imaging.
24:319–324. 2006. View Article : Google Scholar : PubMed/NCBI
|
|
13
|
Partridge SC, Rahbar H, Murthy R, Chai X,
Kurland BF, DeMartini WB and Lehman CD: Improved diagnostic
accuracy of breast MRI through combined apparent diffusion
coefficients and dynamic contrast-enhanced kinetics. Magn Reson
Med. 65:1759–1767. 2011. View Article : Google Scholar : PubMed/NCBI
|
|
14
|
Yabuuchi H, Matsuo Y, Okafuji T, Kamitani
T, Soeda H, Setoguchi T, Sakai S, Hatakenaka M, Kubo M, Sadanaga N,
et al: Enhanced mass on contrast-enhanced breast MR imaging: Lesion
characterization using combination of dynamic contrast-enhanced and
diffusion-weighted MR images. J Magn Reson Imaging. 28:1157–1165.
2008. View Article : Google Scholar : PubMed/NCBI
|
|
15
|
Shin K, Phalak K, Hamame A and Whitman GJ:
Interpretation of breast MRI utilizing the bi-rads fifth edition
lexicon: How are we doing and where are we headed? Curr Probl Diagn
Radiol. 46:26–34. 2017. View Article : Google Scholar : PubMed/NCBI
|
|
16
|
Hylton NM: Vascularity assessment of
breast lesions with gadolinium-enhanced MR imaging. Magn Reson
Imaging Clin N Am. 9:321–332. 2001.PubMed/NCBI
|
|
17
|
Kuhl CK, Mielcareck P, Klaschik S, Leutner
C, Wardelmann E, Gieseke J and Schild HH: Dynamic breast MR
imaging: Are signal intensity time course data useful for
differential diagnosis of enhancing lesions? Radiology.
211:101–110. 1999. View Article : Google Scholar : PubMed/NCBI
|
|
18
|
Wu K: Analysis of parameter selections for
fuzzy c-means. Pattern Recognit. 45:407–415. 2012. View Article : Google Scholar
|
|
19
|
Xu C and Prince JL: Snakes, shapes, and
gradient vector flow. IEEE Trans Image Process. 7:359–369. 1998.
View Article : Google Scholar : PubMed/NCBI
|
|
20
|
Basu S, Goldgof D, Gu Y, Kumar V, Choi J,
Gillies RJ, Hall OL and Gatenby RA: Developing a classifier model
for lung tumors in CT-scan images. Proceedings of the IEEE
International Conference on Systems, Man and Cybernetics,
Anchorage, AK. pp. 1306–1312. 2011
|
|
21
|
Fu LZB: A co-occurrence matrix algorithm
used for medical image. Proceedings of the IEEE International
Conference on Systems, Man and Cybernetics, Anchorage, AK. pp.
1318–1321. 2011
|
|
22
|
Pang Y, Li L, Hu W, Peng Y, Liu L and Shao
Y: Computerized segmentation and characterization of breast lesions
in dynamic contrast-enhanced MR images using fuzzy c-means
clustering and snake algorithm. Comput Math Methods Med.
2012:6349072012. View Article : Google Scholar : PubMed/NCBI
|
|
23
|
Partridge SC, DeMartini WB, Kurland BF,
Eby PR, White SW and Lehman CD: Quantitative diffusion-weighted
imaging as an adjunct to conventional breast MRI for improved
positive predictive value. AJR Am J Roentgenol. 193:1716–1722.
2009. View Article : Google Scholar : PubMed/NCBI
|
|
24
|
Guyon IEA: An introduction to variable and
feature selection. J Mach Learn Res. 3:1157–1182. 2003.
|
|
25
|
Cai H: Improvements over Adaptive Local
Hyperplane to Achieve Better Classification. In: Advances in Data
Mining. Applications and Theoretical Aspects. Perner P: ICDM 2011.
Lecture Notes in Computer Science. vol. 6870. Springer; Berlin,
Heidelberg; 2011
|
|
26
|
Herrero JR and Navarro JJ: Exploiting
computer resources for fast nearest neighbor classification.
Pattern Anal Appl. 10:265–275. 2007. View Article : Google Scholar
|
|
27
|
Duan KB, Rajapakse JC, Wang H and Azuaje
F: Multiple SVM-RFE for gene selection in cancer classification
with expression data. IEEE Trans Nanobioscience. 4:228–234. 2005.
View Article : Google Scholar : PubMed/NCBI
|
|
28
|
Newell D, Nie K, Chen JH, Hsu CC, Yu HJ,
Nalcioglu O and Su MY: Selection of diagnostic features on breast
MRI to differentiate between malignant and benign lesions using
computer-aided diagnosis: Differences in lesions presenting as mass
and non-mass-like enhancement. Eur Radiol. 20:771–781. 2010.
View Article : Google Scholar : PubMed/NCBI
|
|
29
|
El Khouli RH, Macura KJ, Jacobs MA, Khalil
TH, Kamel IR, Dwyer A and Bluemke DA: Dynamic contrast-enhanced MRI
of the breast: Quantitative method for kinetic curve type
assessment. AJR Am J Roentgenol. 193:W295–W300. 2009. View Article : Google Scholar : PubMed/NCBI
|
|
30
|
Li KL, Partridge SC, Joe BN, Gibbs JE, Lu
Y, Esserman LJ and Hylton NM: Invasive breast cancer: Predicting
disease recurrence by using high-spatial-resolution signal
enhancement ratio imaging. Radiology. 248:79–87. 2008. View Article : Google Scholar : PubMed/NCBI
|
|
31
|
Esserman L, Hylton N, George T and Weidner
N: Contrast-enhanced magnetic resonance imaging to assess tumor
histopathology and angiogenesis in breast carcinoma. Breast J.
5:13–21. 1999. View Article : Google Scholar : PubMed/NCBI
|
|
32
|
Guo Y, Cai YQ, Cai ZL, Gao YG, An NY, Ma
L, Mahankali S and Gao JH: Differentiation of clinically benign and
malignant breast lesions using diffusion-weighted imaging. J Magn
Reson Imaging. 16:172–178. 2002. View Article : Google Scholar : PubMed/NCBI
|
|
33
|
Partridge SC, Mullins CD, Kurland BF,
Allain MD, DeMartini WB, Eby PR and Lehman CD: Apparent diffusion
coefficient values for discriminating benign and malignant breast
MRI lesions: Effects of lesion type and size. AJR Am J Roentgenol.
194:1664–1673. 2010. View Article : Google Scholar : PubMed/NCBI
|
|
34
|
Partridge SC, Demartini WB, Kurland BF,
Eby PR, White SW and Lehman CD: Differential diagnosis of
mammographically and clinically occult breast lesions on
diffusion-weighted MRI. J Magn Reson Imaging. 31:562–570. 2010.
View Article : Google Scholar : PubMed/NCBI
|
|
35
|
Rahbar H, Partridge SC, Demartini WB,
Gutierrez RL, Allison KH, Peacock S and Lehman CD: In vivo
assessment of ductal carcinoma in situ grade: A model incorporating
dynamic contrast-enhanced and diffusion-weighted breast MR imaging
parameters. Radiology. 263:374–382. 2012. View Article : Google Scholar : PubMed/NCBI
|