Introduction
Ulcerative colitis (UC) is an inflammatory bowel
disease characterized by periods of inflammatory recurrence and
remission events, accompanied by cell death and regeneration of the
colonic mucosa. Patients with UC face an increased risk of
UC-associated neoplasm (UCAN) including dysplasia and carcinoma
(1). The incidence of colorectal
dysplasia in UC patients was observed to be 1.9% at 5 years, 5.1%
at 15 years, and 9.2% at 25 years after the onset of the UC
(2). The elevated risk of UCAN
development is associated with several factors such as disease
duration, the extent and severity of inflammation, family history
of colorectal carcinoma, backwash ileitis, and primary sclerosing
cholangitis (3–5).
The pathogenesis of UCAN is thought to be associated
with oxidative DNA damage (6). Nitric
oxide (NO) is synthesized by nitric oxide synthase (iNOS) and
contributes to the pathogenesis of various types of cancer
including colonic carcinoma (7–9). It is
known that 8-oxoguanine (8-oxoG) is the most stable product of the
base damage due to oxidative stress, and 8-oxoG mismatches with
adenine residues, leading to a G:C to T:A transversion mutation
(10,11). 8-oxoG and 8-hydroxy-2′-deoxyguanosine
(8-OHdG) undergo keto-enol tautomerism, which favors the oxidized
product 8-oxodG (12). It was
reported that the levels of 8-OHdG are elevated in colorectal
cancer and UC-associated dysplasia (6,13).
DNA damage is normally repaired by base excision
repair (BER) enzymes such as 8-OHdG DNA glycosylase (OGG1) and
human MutY homolog (MUTYH) and nucleotide pool sanitizing enzyme
such as MutT Homolog 1 (MTH1). MTH1 protein exists in the
nucleotide pool and functions to prevent the misincorporation of
8-OHdG by hydrolyzing 8-OH-dGTP to 8-OH-dGMP (14). OGG1 excises 8-OHdG, which has been
mispaired with cytosine. MUTYH excises adenines that have been
misincorporated opposite 8-OH-G during replication (15). Altered expressions of OGG1, MTH1 and
MUTYH have been reported in various types of cancer (14,16–19). In
our previous study, we showed that the nuclear expression of MUTYH
was lower in UCAN and UC than in the non-inflamed mucosa (18). However, the expression status of OGG1
and MTH1 in UCAN has not been reported to date.
Various types of genetic mutation have been reported
in UCAN, including K-ras (30%), TP53 (40–80%),
p16 (100%), CTNNB1 (45–50%) and APC (10–30%)
(20,21). Isocitrate dehydrogenase 1 (IDH1)
catalyzes the oxidative carboxylation of isocitrate to
α-ketoglutarate, resulting in the production of nicotinamide
adenine dinucleotide phosphate. Mutations of IDH1 gene lead
to an accumulation of 2-hydroxyglutarate that can induce the
hypermethylation of DNA CpG islands, resulting in altered gene
transcription and genome stability (22,23). A
2014 study showed that adenocarcinomas associated with inflammatory
bowel disease had IDH1 mutations more frequently compared to
sporadic colon cancer (23).
Here we attempted to elucidate the mechanisms of DNA
damage and repair in UCAN by evaluating the accumulation of
oxidative stress markers and expression DNA repair proteins, iNOS,
8-OHdG, OGG1, MTH1 and MUTYH in UC and UC-associated neoplasms. We
also examined the frequencies of K-ras, TP53 and IDH1
gene mutations as candidates of oxidative stress-induced DNA
damage.
Materials and methods
Cases and histological evaluation
We examined the surgical specimens of 23 cases of
UC-associated neoplasia (Group Athe) including 14 carcinoma cases
(Group A1) and nine dysplasia cases (Group A2), 16 cases of UC
patients without neoplasia (Group B) and 17 cases of normal colon
(Group C). These lesions were surgically resected at Kyushu
University Hospital and its referral hospitals during the 28-year
period from 1987 to 2015. The diagnosis of UC had been made based
on clinical, endoscopic and histologic findings. All neoplastic
lesions were classified according to the criteria proposed by
Riddell et al (24). Patients
in Group B were in the active phase pf ulcerative colitis and
underwent surgery because of fulminant or intractable disease.
Group B specimens showed diffuse and severe neutrophilic
infiltration, goblet cell depletion, cryptitis, and crypt abscess
indicating the active phase of UC. As for Group C, we obtained the
specimens of non-cancerous tissue at least 10 cm apart from
sporadic colorectal cancer lesions of non-UC patients. Group C
specimens showed only slight to mild inflammatory infiltrate.
The study was approved by the Institutional Review
Boards of Kyushu University Hospital (no. 27-388).
Immunohistochemical analysis
Formalin-fixed and paraffin-embedded tissue
specimens were used for immunohistochemical stainings for iNOS,
8-OHdG, OGG1, MTH1, MUTYH and p53. The primary antibodies and
immunohistochemical staining procedures are summarized in Table I. In brief, after the pretreatment,
the primary antibody was applied to the specimen and left overnight
at 4°C. Sections were then incubated with a biotinylated secondary
antibody for 20 min, followed by the use of a
streptavidin-biotin-alkaline phosphatase kit (Nichirei, Tokyo) for
8-OHdG. The reaction was visualized with substrate for alkaline
phosphatase for 8-OHdG. For other markers, Envision+ (Dako,
Glostrup, Denmark) was used as the secondary antibody, and
3,3-diamino-benzidine was used for visualization. Finally, sections
were counterstained with Mayer's hematoxylin.
 | Table I.Antibodies used in
immunohistochemical stain. |
Table I.
Antibodies used in
immunohistochemical stain.
| Antigen | Primary
antibodies |
| Dilution | Source | Antigen
retrieval |
|---|
| iNOS | nos typeII | Mouse
monoclonal | 1:100 | BD Biosciences,
Franklin Lakes, NJ | Microwaved for 30
min in target retrieval solution high pH (DAKO, Glostrup,
Denmark) |
| 8-OHdG | N45.1 | Mouse
monoclonal | 1:20 | Japanese aging
control institute, Shizuoka, Japan | Proteinase K for 7
min incubate with 4N HCl for 20 min and with 50 mM Tris base for 5
min |
| OGG1 | NB100-106 | Rabbit
polyclonal | 1:250 | Novus Biologicals,
Littleton, CO, | Microwaved for 30
min in target retrieval solution high pH (DAKO, Glostrup,
Denmark) |
| MTH1 | D-2 | Rabbit
polyclonal | 1:400 | Abcam, Cambridge,
England | Microwaved for 30
min in target retrieval solution high pH (DAKO, Glostrup,
Denmark) |
| MUTYH | ab13698 |
Rabbit-polyclonal | 1:50 | Abcam, Cambridge,
England | Microwaved for 30
min in target retrieval solution high pH (DAKO, Glostrup,
Denmark) |
| p53 | PAb1801 | Mouse
monoclonal | 1:100 | Oncogene Research
Products, San Diego, CA. | Microwaved for 10
min in citrate buffer (pH 6.0) |
For the evaluation of immunohistochemical staining,
we counted a minimum of 500 cells on each slide. 8-OHdG
immunoreactivity in the colorectal crypts was evaluated by the
labeling index (LI) of nuclear staining (18). We divided the sections into High and
Low expression groups using the median as a reference value, and we
compared these values with other immunohistochemical scores and the
percentage of gene mutation. The expressions of iNOS expression
were evaluated as described (25).
The expression level was graded based on the combination of the
proportion and the intensity of immunoreactive cells. Proportion
scores (PS) were rated on the following scale: 0 (no staining) 1
(<1%), 2 (1% to <10%), 3 (10% to <33%), 4 (33–66%) and 5
(>66%). Intensity scores (IS) were rated on the scale 0 (no
staining), 1 (weak), 2 (moderate) and 3 (strong). The total score
was obtained by adding the PS and the IS.
The MUTYH expression was evaluated as described
(18). The proportion of nuclear
staining of the colorectal crypts was classified using a
three-grade scale: 0 (no staining), 1 (5–50%) and 2 (>50%), and
the intensity of cytoplasmic expression was classified with a
two-grade scale (1, weak; 2, strong).
The expressions of MTH1 and OGG1 expression were
evaluated as described (16).
Staining intensity was rated on the following scale: 0 (no
staining), 1 (weak), 2 (moderate) and 3 (strong). The proportion of
immunoreactive cells was then scored as 0 (no staining), 1 (1–50%)
or 2 (51–100%). The final score was calculated by multiplying the
IS by the PS, achieving theoretical results ranging from 0 to 6.
Immunoreactivity for p53 was regarded as positive when >10% of
the cells were stained (26,27).
Mutational analysis of K-ras, TP53 and
IDH1
For the mutational analysis, we analyzed the cases
of 23 patients with UCAN. Genomic DNA was extracted from
paraffin-embedded sections using a macrodissection or
microdissection technique. For the macrodissection technique,
histological areas measuring approx. ≥1 cm in dia. were removed by
macroscopic dissection with a needle so as to contain >70% tumor
cells. For the microdissection technique, the tumor cells were
isolated selectively using laser microdissection (AS LMD system;
Leica, Nussloch, Germany) and a pressure catapulting system to get
at least 1,000 tumor cells per sample for a polymerase chain
reaction (PCR) analysis. Subsequently, genomic DNA was extracted
from the samples using a QIAamp® DNA Micro kit (Qiagen,
Tokyo) and DNeasy Blood & Tissue kits (Qiagen), respectively,
in accordance with the manufacturer's protocols.
The mutational analysis for K-ras, TP53 and
IDH1 was performed using PCR and direct sequencing.
Mutational hot spots of K-ras (codon12 and 13), TP53
(exons 5–9) and IDH1 (R132) were included in these PCR
analyses (22,28,29). PCR
reactions were performed in a thermocycler (Tgradient; Biometra,
Gottingen, Germany). The amplified PCR products were then purified
using Montage centrifugal filters (Millipore, Bedford, MA, USA).
After purification, direct sequencing was performed using an ABI
3500 genetic analyzer (Applied Biosystems, Foster City, CA).
Statistical analysis
We examined the correlations among
clinicopathological factors and molecular data using the
Mann-Whitney U-test and Fisher's exact test. A P-value <0.05 was
considered significant. As the post-hoc test, we re-examined the
data using Tukey's test.
Results
Clinicopathological findings
The clinicopathological features of the patients are
summarized in Table II. Among the 23
patients of the Group A (UC-associated neoplasm), 13 patients were
men and 10 were women, with the median age of 48 years (range 25–77
years). The median disease duration of Group A was 16 years (range
0.5–35 years). The neoplastic lesions in both Group A1
(UC-associated carcinomas) and Group A2 (UC-associated dysplasia)
were predominantly located in the left side of the colon and
rectum.
| Table II.Summary of clinicopathological
findings in UC-associated neoplasm, UC without neoplasm and normal
colon. |
Table II.
Summary of clinicopathological
findings in UC-associated neoplasm, UC without neoplasm and normal
colon.
| Characteristic | Group A1 UC
associated carcinoma (n=14) | Group A2 UC
associated dysplasia (n=9) | Group A UC
associated neoplasm (n=23) | Group B UC without
neoplasm (n=16) | Group C normal
colon (n=17) |
P-valuea |
|---|
| Age (year) | 55.5 (38–77) | 43 (25–68) | 48 (25–77) | 42.5 (22–77) | 69 (53–85) | 0.2414 |
| Gender |
| Male
(%) | 8 (57.1) | 5 (55.6) | 13 (52.2) | 9 (56.3) | 13 (76.4) | 0.9866 |
| Female
(%) | 6 (42.9) | 4 (44.4) | 10 (47.8) | 7 (43.8) | 4 (23.6) |
|
| Disease
duration (year) | 17.5 (0.5–35) | 15 (9–23) | 16 (0.5–35) | 6 (0.5–31) | – | 0.0067b |
| Location |
| Left
side (%) | 9 (64.3) | 7 (77.8) | 16 (69.6) | – | 6 (35.3) |
|
| Right
side (%) | 4 (28.6) | 2 (22.2) | 6 (26.1) | – | 11 (64.7) |
|
| Unknown
(%) | 1 (7.1) | – | 1 (4.3) | – | – |
|
| Histology |
| Well,
moderate (%) | 11 (78.6) | – |
| – | – |
|
| Poor,
mucinous (%) | 3 (21.4) | – |
| – | – |
|
| Tumor depth |
| pT1
(%) | 4 (28.6) | – |
| – | – |
|
| pT2
(%) | 5 (35.7) | – |
| – | – |
|
| pT3 or
pT4 (%) | 5 (35.7) | – |
| – | – |
|
| Lymph vessel
permeation |
|
Negative (%) | 7 (50) | – |
| – | – |
|
|
Positive (%) | 7 (50) | – |
| – | – |
|
| Venous
permeation |
|
Negative (%) | 11 (78.6) | – |
| – | – |
|
|
Positive (%) | 3 (21.4) | – |
| – | – |
|
| Lymph node
metastasis |
|
Negative (%) | 9 (64.3) | – |
| – | – |
|
|
Positive (%) | 5 (35.7) | – |
| – | – |
|
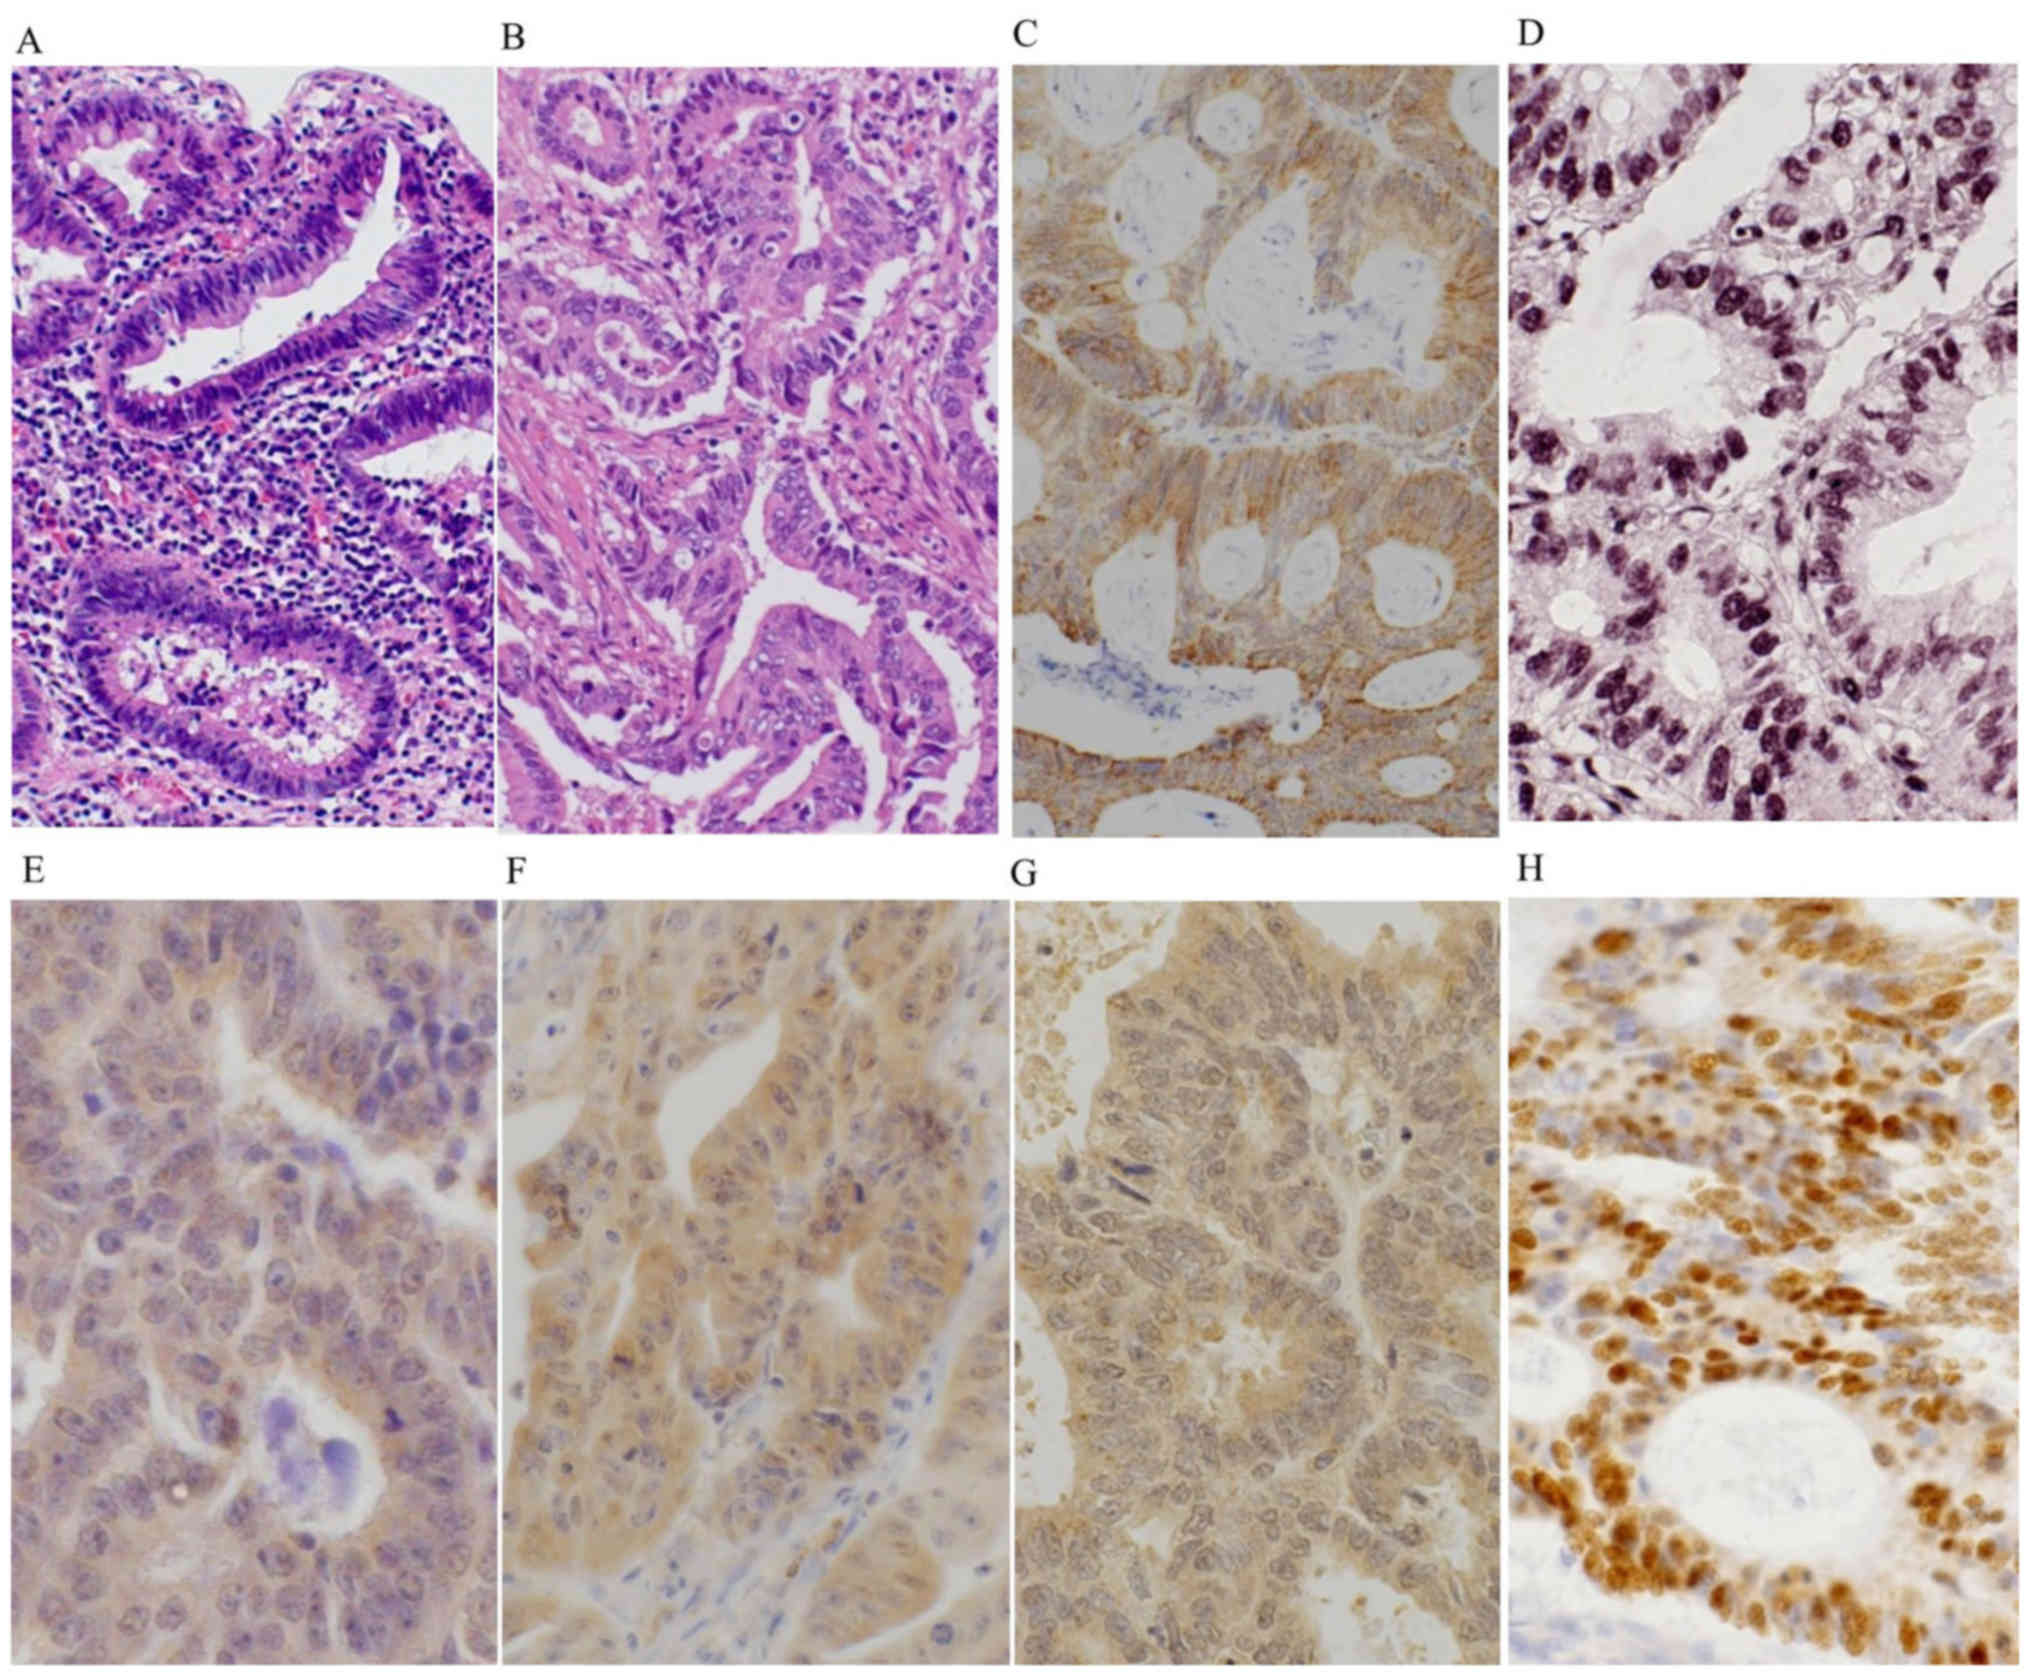
Histologically, Group A2 lesions showed atypical
columnar cells with hyperchromitic nuclei and mild nuclear
stratification as low-grade dysplasia (LGD) (Fig. 1A), and prominent dystrophic goblet
cells and/or severely atypical columnar cells with prominent
nuclear stratification without vesicular nuclei, as high-grade
dysplasia (HGD). Most of the carcinomas of Group A1 were well to
moderately differentiated adenocarcinoma (Fig. 1B). Among the 16 patients of Group B
(UC without neoplasm), nine patients were men and seven were women,
with the median age of 43 years (range 22–77 years). The median
disease duration of Group B was 6 years (range 0.5–31 years). The
disease duration of UC was significantly longer in Group A compared
to Group B (P=0.0067).
Immunohistochemical analyses
iNOS
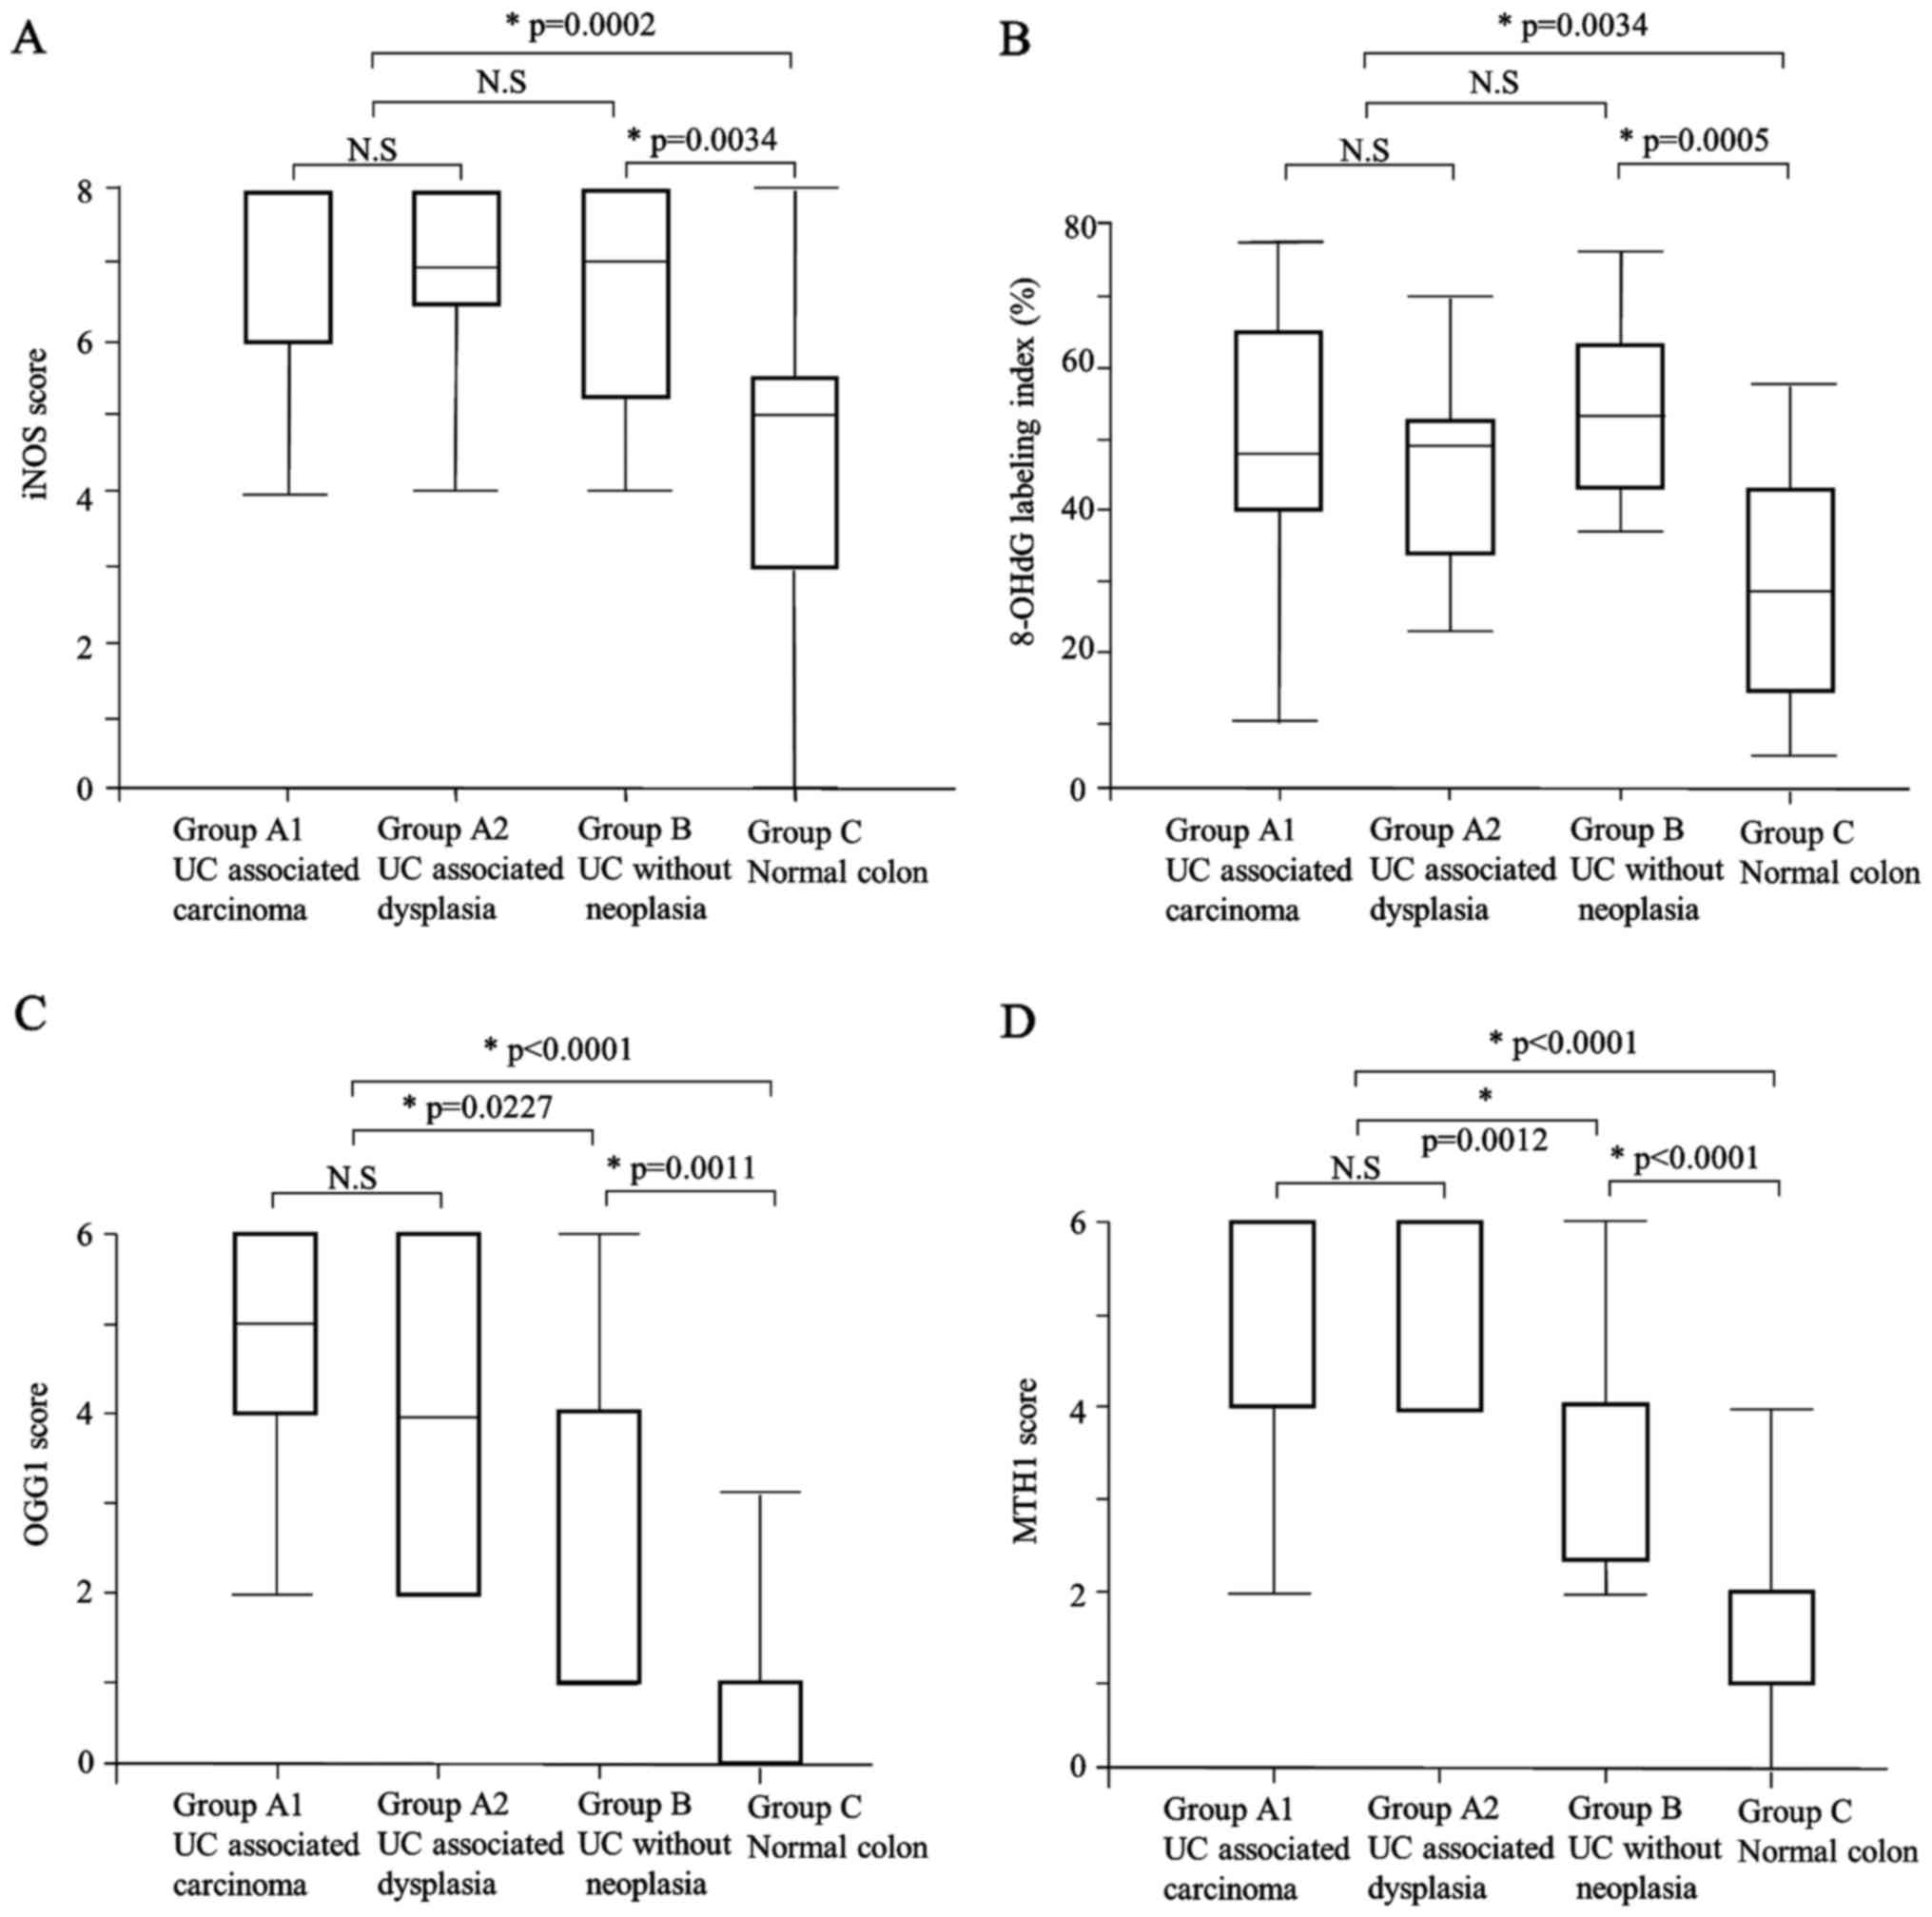
The iNOS expression scores in Group A (median: 8)
and Group B (median: 7) were significantly higher than that of
Group C (median: 5) (P=0.0002, P=0.0034, respectively) (Table III, Figs.
1C and 2A). There was no
significant difference in iNOS expression between Group A and Group
B, or between Group A1UC+carc and Group A2 (Tables III and IV).
| Table III.Immunohistochemical findings of iNOS,
8-OHdG, OGG1, MTH1, MUTYH and p53 in UC associated neoplasm
compared with UC without neoplasm and normal colon. |
Table III.
Immunohistochemical findings of iNOS,
8-OHdG, OGG1, MTH1, MUTYH and p53 in UC associated neoplasm
compared with UC without neoplasm and normal colon.
| Variable | Group A UC
associated neoplasm (n=23) | Group B UC without
neoplasm (n=16) | Group C normal
colon (n=17) | P-value Group A vs.
Group B | P-value Group A vs.
Group C | P-value Group B vs.
Group C |
|---|
| iNOS |
|
Score | 8 (4–8) | 7
(4–8) | 5 (0–8) | 0.1878 | 0.0002a | 0.0034a |
| 8-OHdG |
|
Labeling index | 49.3
(10.4–78.1) | 53.6 (36.7–77) | 29.1 (5.4–58) | 0.4407 | 0.0034a | 0.0005a |
| OGG1 |
|
Score | 4 (2–6) | 4 (1–6) | 1 (0–4) | 0.0227a |
<0.0001a | 0.0011a |
| MTH1 |
|
Score | 6 (2–6) | 4 (2–6) | 1 (0–4) | 0.0012a |
<0.0001a |
<0.0001a |
| MUTYH nuclear |
| Low
(score 0) (%) | 19 (82.7) | 9 (56.3) | 4 (23.5) | 0.1461 | 0.0003a | 0.0799 |
| High
(score 1) (%) | 4 (17.3) | 7 (43.7) | 13 (76.5) |
|
|
|
| Cytoplasmic |
| Low
(score 1) (%) | 9 (39.1) | 7 (43.8) | 15 (88.2) | 1.0000 | 0.0019a | 0.0104a |
| High
(score 2) (%) | 14 (60.9) | 9 (56.3) | 2 (11.8) |
|
|
|
| p53 protein |
|
Positive (%) | 11 (47.8) | 0 (0) | Not done | 0.0009a | Not available | Not available |
|
Negative (%) | 12 (52.1) | 16 (100) | Not done |
|
|
|
| Table IV.Immunohistochemical findings of iNOS,
8-OHdG, OGG1, MTH1, MUTYH and p53 and TP53 mutation in UC
associated carcinoma compared with UC associated dysplasia. |
Table IV.
Immunohistochemical findings of iNOS,
8-OHdG, OGG1, MTH1, MUTYH and p53 and TP53 mutation in UC
associated carcinoma compared with UC associated dysplasia.
| Variable | Group A1UC
associated carcinoma (n=14) | Group A2 UC
associated dysplasia (n=9) | P-value |
|---|
| iNOS |
|
Score | 8 (4–8) | 7 (4–8) | 0.7007 |
| 8-OHdG |
|
Labeling index | 49.2
(10.4–78.1) | 49.3
(23.4–69.1) | 0.6821 |
| OGG1 |
|
Score | 5 (2–6) | 4 (2–6) | 0.5623 |
| MTH1 |
|
Score | 6 (2–6) | 4 (4–6) | 0.7209 |
| MUTYH nuclear |
| Low
(score 0) (%) | 11 (78.6) | 8 (88.9) | 0.5241 |
| High
(score 1) (%) | 3 (21.4) | 1 (11.1) |
|
| Cytoplasmic |
| Low
(score 1) (%) | 2 (14.3) | 7 (77.8) | 0.0023a |
| High
(score 2) (%) | 12 (85.7) | 2 (22.2) |
|
| p53 protein |
|
Positive (%) | 4 (28.6) | 7 (77.8) | 0.0211a |
|
Negative (%) | 10 (71.4) | 2 (22.2) |
|
| TP53
mutationb |
|
Positive (%) | 5 (35.7) | 5 (62.5) | 0.2248 |
|
Negative (%) | 9 (64.3) | 3 (37.5) |
|
8-OHdG
The labeling indices of 8-OHdG in Group A (median:
49.3) and Group B (median: 53.6) were significantly higher than
that in Group C (median: 29.1) (P=0.0002, P=0.0034, respectively)
(Table III; Figs. 1D and 2B). There was no significant difference
between Group A and Group B, or between Group A1 and Group A2
(Tables III and IV).
We then examined the correlation between the
expression of 8-OHdG and other markers. The OGG1 scores of the high
8-OHdG cases (score 2: one case, score 4: five cases, score 6: five
cases) and those of the low 8-OHdG cases (score 2: one case, score
4: five cases, score 6: five cases) revealed no significant
correlations. The MTH1 scores of the high 8-OHdG cases (score 2: no
cases, score 4: six cases, score 6: five cases) and those of the
low 8-OHdG cases (score 2: one case, score 4: four cases, score 6:
six cases) revealed no significant correlations. No significant
correlations with other markers were revealed (Table V).
| Table V.The correlations between 8-OHdG
accumulation and immunohistochemical features of UC associated
neoplasm (n=22)a. |
Table V.
The correlations between 8-OHdG
accumulation and immunohistochemical features of UC associated
neoplasm (n=22)a.
|
| 8-OHdG
accumulation |
|
|---|
|
|
|
|
|---|
|
Immunohistochemistry | High (n=11) | Low (n=11) | P-value |
|---|
| Age (year) | 49 (26–77) | 44 (25–68) | 0.5759 |
| Gender |
| Male
(%) | 5 (45.5) | 8 (72.7) | 0.3870 |
| Female
(%) | 6 (54.5) | 3 (27.3) |
|
| Disease
duration (year) | 17 (9–35) | 12 (0.5–24) | 0.3832 |
| iNOS |
|
Score | 7 (4–8) | 8 (5–8) | 0.0819 |
| OGG1 |
|
Score | 4 (2–6) | 4 (2–6) | 0.5482 |
| MTH1 |
|
Score | 4 (4–6) | 6 (2–6) | 0.9714 |
| MUTYH nuclear |
| Low
(score 0) (%) | 8 (72.7) | 10 (90.9) | 0.5865 |
| High
(score 1) (%) | 3 (27.3) | 1 (9.1) |
|
| Cytoplasmic |
| Low
(score 1) (%) | 3 (27.3) | 5 (45.5) | 0.6594 |
| High
(score 2) (%) | 8 (72.7) | 6 (54.5) |
|
| p53 protein |
|
Positive (%) | 6 (54.5) | 4 (36.4) | 0.3918 |
|
Negative (%) | 5 (45.5) | 7 (63.6) |
|
| TP53 mutation |
|
Positive (%) | 4 (36.4) | 6 (54.6) | 0.6699 |
|
Negative (%) | 7 (63.6) | 5 (45.4) |
|
OGG1
OGG1 expression was observed only in cytoplasmic
regions in our cases, and both the intensity and the proportion of
cytoplasmic expression were different in each case. The OGG1
expression score was significantly higher in Group A (median: 4)
compared to Group B (median: 4) and Group C (median: 1) (P=0.0227,
P<0.0001, respectively) (Table
III; Figs. 1E and 2C). The OGG1 expression score was also
significantly higher in Group B than in Group C (P=0.0011). There
was no significant difference in OGG1 expression between Group A1
and Group A2 (Table IV).
MTH1
The MTH1 expression score was significantly higher
in Group A (median: 6) compared to Group B (median: 4) and Group C
(median: 1) (P=0.0012, P<0.0001, respectively) (Table III; Figs.
1F and 2D). The MTH1 expression
was also significantly higher in Group B compared to Group C
(P<0.0001). There was no significant difference in MTH1
expression between Group A1 and Group A2 (Table IV).
MUTYH
Regarding the nuclear expression of MUTYH, each case
was scored as 0 or 1; no cases were judged as score 2. The nuclear
expression of MUTYH was positive (score 1) in 4/23 cases (17.3%) in
Group A, 7/16 cases (43.7%) in Group B and 13/17 cases (76.5%) in
Group C (Table III and Fig. 1G). Group A and Group B showed
significantly lower nuclear expression of MUTYH compared to the
Group C (P=0.0003 and P=0.0799, respectively). There was no
significant difference in MUTYH nuclear expression between Group A1
and Group A2 (Table IV).
As for the cytoplasmic expression of MUTYH, each
case was scored 1 or 2; no cases were judged as score 0. High
(score 2) cytoplasmic expression of MUTYH was present in 14/23
cases (60.9%) in Group A, 9/16 cases (56.3%) in Group B and 2/17
cases (11.8%) in Group C (Table III
and Fig. 1G). Thus, Group A and Group
B showed significantly higher cytoplasmic expression of MUTYH
compared to the Group C (P=0.019, P=0.0104, respectively). Notably,
Group A1 showed significantly higher cytoplasmic expression of
MUTYH compared to Group A2 (P=0.0023) (Table IV).
p53
A nuclear accumulation of p53 protein was present in
11/23 cases (47.8%) of Group A, but it was not observed in Group B
(0/16 cases) (P=0.0009) (Table III
and Fig. 1H). In addition, Group A2
showed a significantly higher frequency of p53 accumulation
compared to the Group A1 (P=0.0211) (Table IV).
In Group A2, 7/9 cases (77.8%) showed nuclear
accumulation of p53 protein, and 5/8 cases (62.5%) showed
TP53 mutation. Four of the five dysplasias (i.e., Group A2)
with TP53 mutation revealed nuclear accumulation of p53
protein (4/5 cases, 80%). In Group A1, 4/14 cases (28.6%) showed
nuclear accumulation of p53 protein, and 5/14 cases (35.7%) showed
TP53 mutation in Group A1. Of the five carcinomas (i.e.,
Group A1) with TP53 mutation, only one case revealed nuclear
accumulation of p53 protein (1/5 cases, 20%). The concordance rate
between nuclear accumulation of p53 protein and TP53
mutation was not significantly different between the two groups,
but in the dysplasias (Group A 2), this rate tended to be higher
than that in the carcinomas (Group A1) (P=0.058).
Mutational analysis
TP53
The results of our mutation analysis as well as the
clinicopathological data of Group Athe UC+ group are summarized in
Table VI. The PCR for TP53
was successful in 22 cases of Group A. The TP53 mutation was
present in a total of 10 of the 22 (45.5%) cases, including 5/14
cases (35.7%) of Group A1 and 5/8 cases (62.5%) of Group A2. There
was no significant difference in the frequency of TP53
mutation between these two groups. Among the 10 cases with
TP53 mutation, transversion and transition mutations were
present in two and eight cases, respectively.
| Table VI.The clinicopathological features and
molecular findings of UC-associated neoplasm and mutation analysis
for TP53 and K-ras. |
Table VI.
The clinicopathological features and
molecular findings of UC-associated neoplasm and mutation analysis
for TP53 and K-ras.
| Case | Gender | Age | Disease
duration | Tumor location | Diagnosis | Clinical stage | p53 IHC | TP53 mutation | K-ras mutation |
|---|
| 1 | F | 63 | 20 | Rectum | Ca | T2 | + | codon220,
TAT>CAT | wt |
| 2 | F | 63 | 16 | Descending
colon | Ca | T2 | – | codon240,
AGT>AGC | wt |
| 3 | F | 71 | 10 | Ascending
colon | Ca | T2 | – | codon249,
AGG>AGT | codon12,
GGT>GAT |
| 4 | M | 43 | 10 | Rectum | Ca | T3 | – | codon249,
AGG>AGT | wt |
| 5 | F | 48 | 24 | Rectum | Ca | T3 | – | codon285,
GAA>GAG | wt |
| 6 | M | 49 | 9 | Ascending
colon | Ca | T2 | + | wt | wt |
| 7 | F | 43 | 5 | NA | Ca | T1 | + | wt | wt |
| 8 | M | 66 | 33 | Descending
colon | Ca | T2 | + | wt | wt |
| 9 | M | 38 | 0.5 | Ascending
colon | Ca | T1 | – | wt | wt |
| 10 | F | 75 | 35 | Rectum | Ca | T1 | – | wt | wt |
| 11 | M | 48 | NA | Rectum | Ca | T1 | – | wt | wt |
| 12 | M | 39 | 20 | Rectum | Ca | T3 | – | wt | wt |
| 13 | M | 62 | 19 | Transverse
colon | Ca | T2 | – | wt | codon12,
GGT>TGT |
| 14 | M | 68 | 19 | Descending
colon | Ca | T2 | – | wt | wt |
| 15 | M | 80 | 20 | Sigmoid colon | HGD | Tis | + | codon197,
GTG>ATG | wt |
| 16 | M | 50 | 11 | Sigmoid colon | HGD | Tis | – | codon197,
GTG>ATG | wt |
| 17 | M | 22 | 13 | Transverse
colon | HGD | Tis | + | codon220,
TAT>CAT | wt |
| 18 | M | 34 | 15 | Rectum | HGD | Tis | + | codon312,
AGC>AAG | wt |
| 19 | F | 26 | 9 | Rectum | HGD | Tis | – | wt | wt |
| 20 | F | 44 | 11 | Rectum | LGD | Tis | + | codon197,
GTG>ATG | NA |
| 21 | F | 68 | 23 | Descending
colon | LGD | Tis | + | NA | NA |
| 22 | M | 43 | 18 | Transverse
colon | LGD | Tis | + | wt | Wt |
| 23 | F | 42 | NA | Transverse
colon | LGD | Tis | + | wt | Wt |
We then checked the correlation between TP53
mutation and inflammation-associated marker expressions; no
significant correlation was observed (Table VII).
| Table VII.The correlations between TP53
mutational status and clinicopathological factors or
immunohistochemical features of UC-associated neoplasia
(n=22)a. |
Table VII.
The correlations between TP53
mutational status and clinicopathological factors or
immunohistochemical features of UC-associated neoplasia
(n=22)a.
|
| TP53 mutation |
|
|---|
|
|
|
|
|---|
| Variable | Positive (%)
(n=10) | Negative (%)
(n=12) | P-value |
|---|
| Age (year) | 46 (25–71) | 45.5 (26–77) | 0.8948 |
| Gender |
| Male
(%) | 5 (50) | 8 (66.6) | 0.4285 |
| Female
(%) | 5 (50) | 4 (33.3) |
|
| Disease
duration (year) | 14 (10–24) | 18.5 (0.5–35) | 0.9698 |
| iNOS |
|
Score | 8 (6–8) | 7 (4–8) | 0.1099 |
| 8-OHdG |
|
Labelling index (%) | 45.9
(23.4–78.1) | 50.7
(10.4–69.1) | 0.9212 |
| OGG1 |
|
Score | 4 (2–6) | 6 (2–6) | 0.1028 |
| MTH1 |
|
Score | 6 (4–6) | 4 (2–6) | 0.3515 |
| MUTYH nuclear |
| Low
(score 0) (%) | 8 (80) | 10 (83.3) | 0.8403 |
| High
(score 1) (%) | 2 (20) | 2 (16.7) |
|
| Cytoplasmic |
| Low
(score 1) (%) | 3 (30) | 5 (41.7) | 0.5711 |
| High
(score 2) (%) | 7 (70) | 7 (58.3) |
|
| p53 protein |
|
Positive (%) | 5 (50) | 5 (41.7) | 0.6959 |
|
Negative (%) | 5 (50) | 7 (58.3) |
|
K-ras
The mutation analysis of K-ras was successful
in 21 cases in Group A. We found that 2 of 21 (9.5%) cases had
K-ras gene mutation at codon 12; one mutation was the
transversion type and the other was the transition type (Table VI).
IDH1
No cases in Group A had IDH1 gene
mutation.
Discussion
Our present findings demonstrated that the
expression levels of iNOS, 8-OHdG, OGG1 and MTH1 were significantly
higher in UCAN and UC samples than in non-inflamed mucosa. In
addition, the OGG1 and MTH1 expressions were significantly higher
in the UCAN than in the UC cases. It has been reported that
increased levels of 8-OHdG induce the activation of MTH1 or OGG1 to
minimize 8-OHdG accumulation in mammalian DNA (13,30).
Similarly in UC, oxidative stress may upregulate defense systems
such as MTH1 and OGG1 to minimize 8-OHdG accumulation.
Liao et al reported that OGG1 knockout mice
showed a significantly increased risk of adenocarcinoma development
in the colon compared to wild-type mice after the induction of
dextran sulfate sodium-induced colitis (31). In breast cancer, reduced OGG1
expression was correlated with poor prognosis (17). On the other hand, Kubo et al
showed 8-OHdG accumulation and cytoplasmic OGG1 overexpression in
esophageal squamous cell carcinoma (16), They also showed that cytoplasmic OGG1
expression was correlated with the depth of cancer, lymph node
metastasis and the stage of progression. In the present study, the
OGG1 cytoplasmic expression was higher in UCAN than UC cases.
It is reported that OGG1 protein is present in the
nucleus and mitochondria and that the protein at both of these
sites work as DNA repair protein. The dysfunction of each OGG1
leads to high 8-OHdG accumulation and cell death (32). These findings suggested that OGG1
overexpression might represent persisting oxidative stress and
cellular response in UCAN and unlike in mouse models, the
upregulation of OGG1 function may play some role in the
pathogenesis of human UCAN.
Tsuzuki et al showed that in an
MTH-1-deficient mouse model, a greater number of tumors were formed
in the lung, liver, and stomach compared to MTH1 wild-type mice
(33). In contrast, Song et al
showed that MTH1 expression was significantly higher in human
gastric cancer tissue than para-cancer tissue, and that MTH1
expression correlated with 8-OHdG accumulation (34). These findings may be explained in part
by the notion that cancer cells may require MTH1 to avoid both DNA
damage and cell death because an excessive accumulation of 8-OHdG
leads to tumor cell death (35,36). In
the present study, the MTH1 expression was higher in UCAN than in
the UC and non-inflamed mucosa. Our results may support the
hypothesis that MTH1 is required for cancer survival for defense
against oxidative damage in UCAN. Similar to the previous study,
the present UCAN and UC cases exhibited higher cytoplasmic
expression and lower nuclear expression of MUTYH compared to the
non-inflamed mucosa. Such an abnormal expression pattern of MUTYH
may represent dysfunction of MUTYH, as we had suggested (18).
In general, 8-OHdG accumulation leads to the G:C to
T:A and A:T to C:G transversion mutations (10). Chaubert et al reported that
K-ras mutations were present in 44% of UCAN patients with a
predominance of G:C to T:A transversion (37). However, in our series, despite the
accumulation of 8-OHdG, transversion mutations of K-ras or
TP53 gene were not frequent. For example, among our 21 cases
of UCAN, K-ras mutation was identified in two (9.5%) cases,
one of whom showed a G:C to T:A transversion mutation. Although we
detected the TP53 mutations in 10/22 cases (45.5%) of UCAN,
only two cases showed transversion mutations.
The frequency of TP53 mutation was higher in our
dysplasia cases compared to the carcinoma cases. Carcinoma may
arise from other factors, such as genetic alterations in tumor
suppressor genes, oncogenes and genes encoding DNA repair proteins,
as well as from loss of genomic stability.
We also observed that the expression levels of OGG1,
MUTYH and MTH1 were not correlated with the presence of TP53
gene mutation or p53 protein accumulation. It thus seems to be less
likely that a dysfunction of OGG1, MUTYH or MTH1 caused the
excessive accumulation of 8-OHdG and the subsequent transversion
mutation of K-ras or TP53 in UCAN. However, the
possibility remains that an accumulation of 8-OHdG might cause a
transversion mutation of other genes that would participate in the
pathogenesis of UCAN. As an additional possibility, dysfunction of
OGG1 and MUTYH caused by TP53 mutation might play a role in
the tumorigenesis in some populations of UCAN. It has been reported
that, since OGG1 and MUTYH are transcriptionally regulated by p53,
p53 deficiency leads to OGG1 and MUTYH dysfunction, resulting in
escape from programmed cell death under oxidative stress and the
promotion of tumorigenesis (38,39).
However, further study is necessary to elucidate the mechanism of
TP53 mutation and its role in the tumorigenesis of UCAN.
A previous study revealed that isocitrate
dehydrogenase 1(IDH1) mutations were present in 1% of sporadic
colorectal carcinomas (22). Hartman
et al also reported that adenocarcinomas associated with
inflammatory bowel disease more frequently demonstrated IDH1
mutations than conventional intestinal adenocarcinomas did (13% vs.
0%) (23). In addition, IDH1
mutations were more frequently observed in Crohn's
disease-associated neoplasms than UC-associated neoplasms in their
study. In the present study, no IDH1 gene mutation was detected in
the neoplasms associated with UC. These findings suggest that IDH1
mutation may be exceptional in UCAN.
In conclusion, the results of our study demonstrated
that iNOS, 8-OHdG, MTH1 and OGG1 were accumulated in UCAN and the
inflamed mucosa of UC patients. We also observed that the
expressions of MTH1 and OGG1 were higher in UCAN than in UC. Our
results suggest that both inflamed mucosa and neoplasms of UC are
exposed to persisting oxidative damage, which may lead to the
increased expressions of MTH1 and OGG1, and possibly to UC-related
carcinogenesis.
Acknowledgements
The authors would like to thank the Research Support
Center, Graduate School of Medical Sciences, Kyushu University for
their technical support.
References
|
1
|
Jess T, Rungoe C and Peyrin-Biroulet L:
Risk of colorectal cancer in patients with ulcerative colitis: A
meta-analysis of population-based cohort studies. Clin
Gastroenterol Hepatol. 10:639–645. 2012. View Article : Google Scholar : PubMed/NCBI
|
|
2
|
Jess T, LoftusEV Jr, Velayos FS, Harmsen
WS, Zinsmeister AR, Smyrk TC, Tremaine WJ, Melton LJ III, Munkholm
P and Sandborn WJ: Incidence and prognosis of colorectal dysplasia
in inflammatory bowel disease: A population-based study from
Olmsted County, Minnesota. Inflamm Bowel Dis. 12:669–676. 2006.
View Article : Google Scholar : PubMed/NCBI
|
|
3
|
Brentnall TA, Haggitt RC, Rabinovitch PS,
Kimmey MB, Bronner MP, Levine DS, Kowdley KV, Stevens AC, Crispin
DA, Emond M and Rubin CE: Risk and natural histoy of colonic
neoplasia in patients with primary sclerosing cholangitis and
ulcerative colitis. Gastroenterology. 110:331–338. 1996. View Article : Google Scholar : PubMed/NCBI
|
|
4
|
Nuako KW, Ahlquist DA, Mahoney DW, Schaid
DJ, Siems DM and Lindor NM: Familial predisposition for colorectal
cancer in chronic ulcerative colitis: A case-control study.
Gastroenterology. 115:1079–1083. 1998. View Article : Google Scholar : PubMed/NCBI
|
|
5
|
Devroede GJ, Taylor WF, Sauer WG, Jackman
RJ and Stickler GB: Cancer risk and life expectancy of children
with ulcerative colitis. N Engl J Med. 285:17–21. 1971. View Article : Google Scholar : PubMed/NCBI
|
|
6
|
D'Incà R, Cardin R, Benazzato L, Angriman
I, Martines D and Sturniolo GC: Oxidative DNA damage in the mucosa
of ulcerative colitis increases with disease duration and
dysplasia. Inflamm Bowel Dis. 10:23–27. 2004. View Article : Google Scholar : PubMed/NCBI
|
|
7
|
Kojima M, Morisaki T, Tsukahara Y,
Uchiyama A, Matsunari Y, Mibu R and Tanaka M: Nitric oxide synthase
expression and nitric oxide production in human colon carcinoma
tissue. J Surg Oncol. 70:222–229. 1999. View Article : Google Scholar : PubMed/NCBI
|
|
8
|
Choudhari SK, Chaudhary M, Bagde S,
Gadbail AR and Joshi V: Nitric oxide and cancer: A review. World J
Surg Oncol. 11:1182013. View Article : Google Scholar : PubMed/NCBI
|
|
9
|
Vannini F, Kashfi K and Nath N: The dual
role of iNOS in cancer. Redox Biol. 6:334–343. 2015. View Article : Google Scholar : PubMed/NCBI
|
|
10
|
Nakabeppu Y, Tsuchimoto D, Ichinoe A, Ohno
M, Ide Y, Hirano S, Yoshimura D, Tominaga Y, Furuichi M and Sakumi
K: Biological significance of the defense mechanisms against
oxidative damage in nucleic acids caused by reactive oxygen
species: From mitochondria to nuclei. Ann N Y Acad Sci.
1011:101–111. 2004. View Article : Google Scholar : PubMed/NCBI
|
|
11
|
Shibutani S, Takeshita M and Grollman AP:
Insertion of specific bases during DNA synthesis past the
oxidation-damaged base 8-oxodG. Nature. 349:431–434. 1991.
View Article : Google Scholar : PubMed/NCBI
|
|
12
|
Vakakanidis A, Vlachogianni T and Fiotakis
C: 8-hydroxy-2′-deoxyguanosine (8-OHdG): A critical biomarker of
oxidative stress and carcinogenesis. J Environ Sci Health C Environ
Carcinog Ecotoxicol Rev. 27:120–139. 2009. View Article : Google Scholar : PubMed/NCBI
|
|
13
|
Kondo S, Toyokuni S, Tanaka T, Hiai H,
Onodera H, Kasai H and Imamura M: Overexpression of the hOGG1 gene
and high 8-hydroxy-2′-deoxyguanosine (8-OHdG) lyase activity in
human colorectal carcinoma: Regulation mechanism of the 8-OHdG
level in DNA. Clin Cancer Res. 6:1394–1400. 2000.PubMed/NCBI
|
|
14
|
Sekiguchi M and Tsuzuki T: Oxidative
nucleotide damage: Consequences and prevention. Oncogene.
21:8895–8904. 2002. View Article : Google Scholar : PubMed/NCBI
|
|
15
|
García-Quispes WA, Pérez-Machado G, Akdi
A, Pastor S, Galofré P, Biarnés F, Castell J, Velázquez A and
Marcos R: Association studies of OGG1, XRCC1, XRCC2 and XRCC3
polymorphisms with differentiated thyroid cancer. Mutat Res.
709–710:67–72. 2011. View Article : Google Scholar
|
|
16
|
Kubo N, Morita M, Nakashima Y, Kitao H,
Egashira A, Saeki H, Oki E, Kakeji Y, Oda Y and Maehara Y:
Oxidative DNA damage in human esophageal cancer:
Clinicopathological analysis of 8-hydroxydeoxyguanosine and its
repair enzyme. Dis Esophagus. 27:285–293. 2014. View Article : Google Scholar : PubMed/NCBI
|
|
17
|
Karihtala P, Kauppila S, Puistola U and
Jukkola-Vuorinen A: Absence of the DNA repair enzyme human
8-oxoguanine glycosylase is associated with an aggressive breast
cancer phenotype. Br J Cancer. 106:344–347. 2012. View Article : Google Scholar : PubMed/NCBI
|
|
18
|
Gushima M, Hirahashi M, Matsumoto T,
Fujita K, Fujisawa R, Mizumoto K, Nakabeppu Y, Iida M, Yao T and
Tsuneyoshi M: Altered expression of MUTYH and an increase in
8-hydroxydeoxyguanosine are early events in ulcerative
colitis-associated carcinogenesis. J Pathol. 219:77–86. 2009.
View Article : Google Scholar : PubMed/NCBI
|
|
19
|
Grasso F, Di Meo S, de Luca G, Pasquini L,
Rossi S, Boirivant M, Biffoni M, Bignami M and Di Carlo E: The
MUTYH base excision repair gene protects against
inflammation-associated colorectal carcinogenesis. Oncotarget.
6:19671–19684. 2015. View Article : Google Scholar : PubMed/NCBI
|
|
20
|
Scarpa M, Castagliuolo I, Castoro C, Pozza
A, Scarpa M, Kotsafti A and Angriman I: Inflammatory colonic
carcinogenesis: A review on pathogenesis and immunosurveillance
mechanisms in ulcerative colitis. World J Gastroenterol.
20:6774–6785. 2014. View Article : Google Scholar : PubMed/NCBI
|
|
21
|
Yin J, Harpaz N, Tong Y, Huang Y, Laurin
J, Greenwald BD, Hontanosas M, Newkirk C and Meltzer SJ: p53 point
mutations in dysplastic and cancerous ulcerative colitis lesions.
Gastroenterology. 104:1633–1639. 1993. View Article : Google Scholar : PubMed/NCBI
|
|
22
|
Borger DR, Tanabe KK, Fan KC, Lopez HU,
Fantin VR, Straley KS, Schenkein DP, Hezel AF, Ancukiewicz M
Liebman HM, et al: Frequent mutation of isocitrate dehydrogenase
(IDH)1 and IDH2 in cholangiocarcinoma identified through
broad-based tumor genotyping. Oncologist. 17:72–79. 2012.
View Article : Google Scholar : PubMed/NCBI
|
|
23
|
Hartman DJ, Binion D, Regueiro M, Schraut
W, Bahary N, Sun W, Nikiforova M and Pai RK: Isocitrate
dehydrogenase-1 is mutated in inflammatory bowel disease-associated
intestinal adenocarcinoma with low-grade tubuloglandular histology
but not in sporadic intestinal adenocarcinoma. Am J Surg Pathol.
38:1147–1156. 2014. View Article : Google Scholar : PubMed/NCBI
|
|
24
|
Riddell RH, Goldman H, Ransohoff DF,
Appelman HD, Fenoglio CM, Haggitt RC, Ahren C, Correa P, Hamilton
SR, Morson BC, et al: Dysplasia in inflammatory bowel disease:
Standardized classification with provisional clinical applications.
Human Pathol. 11:931–968. 1983. View Article : Google Scholar
|
|
25
|
Brennan PA, Palacios-Callender M, Zaki GA,
Spedding AV and Langdon JD: Type II nitric oxide synthase (NOS2)
expression correlates with lymph node status in oral squamous cell
carcinoma. J Oral Pathol Med. 30:129–134. 2001. View Article : Google Scholar : PubMed/NCBI
|
|
26
|
Maehara Y, Tomoda M, Hasuda S, Kabashima
A, Tokunaga E, Kakeji Y and Sugimachi K: Prognostic value of p53
protein expression for patients with gastric cancer- a multivariate
analysis. Br J Cancer. 79:1255–1261. 1999. View Article : Google Scholar : PubMed/NCBI
|
|
27
|
Feng CW, Wang LD, Jiao LH, Liu B, Zheng S
and Xie XJ: Expression of p53, inducible nitric oxide synthase and
vascular endothelial growth factor in gastric precancerous and
cancerous lesions: Correlation with clinical features. BMC Cancer.
2:82002. View Article : Google Scholar : PubMed/NCBI
|
|
28
|
Oda Y, Sakamoto A, Satio T, Kawauchi S,
Iwamoto Y and Tsuneyoshi M: Molecular abnormalities of p53, MDM2
and H-ras in synovial sarcoma. Mod Pathol. 13:994–1004. 2000.
View Article : Google Scholar : PubMed/NCBI
|
|
29
|
Fujita K, Yamamoto H, Matsumoto T,
Hirahashi M, Gushima M, Kishimoto J, Nishiyama K, Taguchi T, Yao T
and Oda Y: Sessile serrated adenoma with early neoplastic
progression: A clinicopathologic and molecular study. Am J Surg
Pathol. 35:295–304. 2011. View Article : Google Scholar : PubMed/NCBI
|
|
30
|
Kajitani K, Yamaguchi H, Dan Y, Furuichi
M, Kang D and Nakabeppu Y: MTH1, an oxidized purine nucleoside
triphosphatase, suppresses the accumulation of oxidative damage of
nucleic acids in the hippocampal microglia during kainate-induced
excitotoxicity. J Neurosci. 26:1688–1698. 2006. View Article : Google Scholar : PubMed/NCBI
|
|
31
|
Liao J, Seril DN, Lu GG, Zhang M, Toyokuni
S, Yang AL and Yang GY: Increased susceptibility of chronic
ulcerative colitis-induced carcinoma development in DNA repair
enzyme Ogg1 deficient mice. Mol Carcinog. 47:638–646. 2008.
View Article : Google Scholar : PubMed/NCBI
|
|
32
|
Nakabeppu Y: Cellular levels of
8-oxoguanine in either DNA or the nucleotide pool play pivotal
roles in carcinogenesis and survival of cancer cells. Int J Mol
Sci. 15:12543–12557. 2014. View Article : Google Scholar : PubMed/NCBI
|
|
33
|
Tsuzuki T, Egashira A, Igarashi H, Iwakuma
T, Nakatsuru Y, Tominaga Y, Kawate H, Nakao K, Nakamura K, Ide F,
et al: Spontaneous tumorigenesis in mice defective in the MTH1 gene
encoding 8-oxo-dGTPase. Proc Natl Acad Sci USA. 98:11456–11461.
2001. View Article : Google Scholar : PubMed/NCBI
|
|
34
|
Song WJ, Jiang P, Cai JP and Zheng ZQ:
Expression of cytoplasmic 8-oxo-Gsn and MTH1 correlates with
pathological grading in human gastric cancer. Asian Pac J Cancer
Prev. 16:6335–6338. 2015. View Article : Google Scholar : PubMed/NCBI
|
|
35
|
Gad H, Koolmeister T, Jemth AS, Eshtad S,
Jacques SA, Ström CE, Svensson LM, Schultz N, Lundbäck T,
Einarsdottir BO, et al: MTH1 inhibition eradicates cancer by
preventing sanitation of the dNTP pool. Nature. 508:215–221. 2014.
View Article : Google Scholar : PubMed/NCBI
|
|
36
|
Huber KV, Salah E, Radic B, Gridling M,
Elkins JM, Stukalov A, Jemth AS, Göktürk C, Sanjiv K, Strömberg K,
et al: Stereospecific targeting of MTH1 by (S)-crizotinib as an
anticancer strategy. Nature. 508:222–227. 2014. View Article : Google Scholar : PubMed/NCBI
|
|
37
|
Chaubert P, Benhattar J, Saraga E and
Costa J: K-ras mutations and p53 alterations in neoplastic and
nonneoplastic lesions associated with longstanding ulcerative
colitis. Am J Pathol. 144:767–775. 1994.PubMed/NCBI
|
|
38
|
Oka S, Leon J, Tsuchimoto D, Sakumi K and
Nakabeppu Y: MUTYH, an adenine DNA glycosylase, mediates p53 tumor
suppression via PARP-dependent cell death. Oncogenesis. 4:e1422015.
View Article : Google Scholar : PubMed/NCBI
|
|
39
|
Chatterjee A..Mambo E, Osada M, Upadhyay S
and Sidransky D: The effect of p53-RNAi and p53 knockout on human
8-oxoguanine DNA glycosylase (hOgg1) activity. FASEB J. 20:112–114.
2006. View Article : Google Scholar : PubMed/NCBI
|