Introduction
Multiple myeloma (MM) is a monoclonal plasma cell
malignancy accounting for 1% of neoplastic diseases and >10% of
all hematological malignancies from cancer statistics in 2016
(1). MM is characterized by CRAB
features, defined as hypercalcemia, anemia, renal insufficiency and
bone lesions (2). A combinatorial
treatment of bortezomib and stem cell transplantation has prolonged
the overall survival time of patients with MM (3). MM remains an incurable malignancy to
date, and the prognosis of MM is frequently poor due to inefficient
early diagnosis (4). In general, MM
is characterized by multi-step stages, including an
indistinguishable early stage called monoclonal gammopathy of
undetermined significance (MGUS) and an intermediate stage called
smoldering MM (5) Ultimately, MM
progresses to symptomatic plasma neoplasms, including
intramedullary multiple myeloma and extramedullary plasmacytoma
(6). Early MM has no typical
features, and the presence of CRAB symptoms is usually attributed
to disease progression (6). To
improve long-term survival time, early diagnosis and a risk
stratification assessment for MM are required. MGUS and MM exhibit
few differences in global gene expression profiling (7). Understanding of the proteome of MM is
essential for a better understanding of the biology of MM, and may
lead to the development of more effective treatment strategies.
Following diagnosis, monitoring treatment response is equally
important. Despite receiving early advanced medical treatment, some
patients still suffer from primary disease relapse and drug
resistance (8). Traditional
measurements of levels of monoclonal protein secreted by plasma
cells and bone marrow (BM) have limitations (9). Thus, the International Multiple Myeloma
Working Group (IMWG) revised the response criteria for diagnosis of
MM to include sequencing and flow cytometry-based approaches as
evaluation methods for minimal residual disease (MRD) (10). To summarize, early detection of MM
combined with monitoring of MRD may improve disease treatment.
The clinical manifestations of MM are highly
variable. The diagnostic criteria for MM were first established by
Durie and Salmon (DS) in 1975. The DS staging system uses levels of
hemoglobin, serum calcium, creatinine and the concentration of
monoclonal serum protein to distinguish patients with different
prognoses (11). To eliminate the
drawbacks of the traditional staging system, a new and powerful
classification system based on serum β2-microglobulin and albumin
levels was defined in 2005 by the IMWG (12). With in-depth research into B-cell
development and plasma cell biology, MM was defined to be a
heterogeneous disease accompanied by genetic alterations that are
the driving events for tumor genesis (13). Further studies are being conducted to
determine the initiator of clonal evolution and reveal the
mechanisms involved in the process. The association between
multiple myeloma cells and the BM microenvironment is also being
investigated. The BM microenvironment consists of numerous stromal
cells, mesenchymal stem cells, cytokines, growth factors and
chemokines, which are crucial for tumor cell growth, infiltration,
migration and drug resistance (14).
Studies conducted on BM serum may elucidate the interaction of MM
and stromal cells.
In the last 2 decades, high-throughput
matrix-assisted laser desorption/ionization time-of-flight mass
spectrometry (MALDI-TOF MS) has been one of the crucial, yet
relatively simple proteomics tools for cancer investigation and
validation across various tissues and blood serum/plasma samples
(15). Some of the markers such as
prostate-specific membrane antigen (PSMA) and osteopontin were
associated with cancer stage and prognosis and lack of early
detection (16). Therefore, the
identification of novel and specific biomarkers for diagnosis and
evaluation of prognosis is urgently needed. In the present study,
MALDI-TOF MS based on a magnetic bead purification approach was
used to detect potential biomarkers from BM samples for the first
time. We supposed to find potential biomarkers for early diagnosis
and a valuable therapeutic target for MM.
Materials and methods
Samples and patients
The present study was approved by the Ethics
Committee of the First Affiliated Hospital of Xi'an Jiaotong
University (Xi'an, China). All participants in the study provided
written informed consent. BM and serum specimens were obtained from
30 patients with MM and 30 healthy controls diagnosed at the First
Affiliated Hospital of Xi'an Jiaotong University between April,
2011 and November, 2012. Patients with MM were newly-diagnosed
based on the diagnostic criteria from the IMWG guidelines (17). Disease stage was defined according to
the International Staging System (ISS) and DS Staging System
(10,11). The clinical parameters of the
patients with MM are presented in Table
I. The control group consisted of 30 individuals who were
suspected to have a hematological disease and were later revealed
to not have hemato-oncological disease. No patients had a history
of hematological neoplasms. In all cases, 3 ml BM samples were
collected in BD vacutainers without anticoagulants. Next, the
samples were centrifuged within 1 h of collection at room
temperature at 800 × g for 10 min. The supernatant was separated
and centrifuged at 4°C at 3,500 × g for 10 min. BM samples were
stored at −80°C for subsequent analysis.
 | Table I.Characteristics of patients with
multiple myeloma. |
Table I.
Characteristics of patients with
multiple myeloma.
|
Characteristics | Values |
|---|
| Total, n | 30 |
| Sex |
|
|
Male | 17 |
|
Female | 13 |
| Age, years, mean
(range) | 59.6 (38–71) |
| DS stage, n |
|
| I | 5 |
| II | 10 |
|
III | 15 |
| ISS stage, n |
|
| I | 5 |
| II | 14 |
|
III | 11 |
| M component, n |
|
|
IgG | 15 |
|
IgD | 2 |
|
IgA | 6 |
| κ | 3 |
| λ | 3 |
|
Nonsecretory | 1 |
| Serum M protein,
g/l, mean (range) | 21.0 (7–44) |
| Bone marrow plasma
cell, %, mean (range) | 33.5 (17–79) |
Peptidome purification and MALDI-TOF
peptide profiling
The samples obtained from patients and controls were
purified using the manufacturer's standard protocol. First, 10 µl
of each sample was incubated with 10 µl of magnetic beads from a
weak cation-exchange chromatography kit (MB-WCX Profiling kit;
Bruker Corporation) at room temperature for 5 min. Next, the
mixtures were loaded on the magnetic bead separator for 1 min at
room temperature. The supernatant was removed from the separator
and washed with washing buffer three times. Finally, 1 µl of eluted
sample was manually deposited onto the MALDI AnchorChip target
surface (Bruker Corporation) and overlaid with a 1 µl matrix
containing 3 mg/ml α-cyano-4-hydroxy-cinnamic acid, 50%
acetonitrile and 2% trifluoroacetic acid.
The mixed targets were analyzed using Autoflex III
MALDI-TOF MS instrument (Bruker Corporation) with a mass range of
700–10,000 Da according to the manufacturer's measuring protocol.
Mass spectra data were collected and analyzed by Flex Analysis v3.0
and ClinProTools version 2.2 (Bruker Corporation) using a standard
data preparation workflow. Mass spectra calibration was performed
using standard peptides. All measurements of patient and control
group samples were performed in random order. According to the
P-value of Wilcoxon test and Average peak intensity of different
groups (Ave1 and Ave2), the top 50% most differentially expressed
peaks were selected for further investigation.
Identification of peptides
Peptide sequencing and identification were performed
with a Liquid chromatography/electrospray ionization-tandem mass
spectrometry (LC-ESI-MS/MS) system. The LC-ESI-MS/MS system
contained an Acquity Ultra Performance Liquid Chromatography system
(Waters Corporation) and LTQ Orbitrap XL mass spectrometer (Thermo
Fisher Scientific, Inc.). The samples were diluted in gradient
elution containing formic acid and acetonitrile and then injected
into a C18 trap column (Nano Acquity™ Column; Waters Corporation)
for 3 min at 35°C. The flow rate was set to 15 µl/min. Ultimately,
peptides were analyzed through a C18 analytical column (Nano
Acquity™ Column) for 60 min with a rate of 400 nl/min at 35°C. The
electrospray source was performed in a dynamic exclusion and
data-dependent model. The full scan of MS spectra was operated with
a scanning range from m/z 400–2,000. The optimal MS operating
parameters were set as follows: Ionization mode: Electrospray
ionization, dryer temperature: 350°C, nebulizer pressure: 0.24 MPa
(35.0 psi), flow rate: 12 l/min, Spray voltage of 1.8 kV, and
scanning time of 60 min. The first scan (MS) used Orbitrap with a
resolution of 100,000. The second scan (MS/MS) and character
identifier used LTQ-Orbitrap. The single isotope composed of the 10
most intense ions was selected as the parent ion for MS. The
acquired data were analyzed and retrieved using BioWorks Browser
(BioWorks Browser 3.3.1 SP1 for Sequest™) from the International
Protein Index database. The MS search criteria were set as a parent
ion error of 100 ppm, a fragment ion error of 1 Da, and in
non-digested mode with variable modifications at methionine
oxidation
ELISA determination of serum
proteins
Concentrations of GSTP1, FN1, complement 3f (C3f)
and α-fetoprotein (AFP) were assayed using ELISA kits (nos.
MBS700126, KE00039, 108823 and 193765, respectively) (R&D
Systems, Inc.) using serum samples from 30 MM patients and 30
healthy controls. Procedures were performed according to the
manufacturer's instructions.
Statistical analysis
SPSS 25.0 (IBM Corp.) was used for all statistical
analyses. Comparisons between various groups were performed by
one-way ANOVA and a Student-Newman-Keuls test for post hoc
comparisons. Receiver operating characteristic curve analysis was
performed to determine the diagnostic capability of GSTP1 and FN1.
The associations between GSPT1 level and clinical characteristics
were examined by χ2 tests. ROC analyses were performed
to calculate AUCs to define threshold for GSTP1 that could be used
to discriminate different groups. Comparisons of variables between
high and low GTSP1 groups were analyzed by unpaired Student's
t-test. Multivariate Cox models were used to determine the
association between clinicopathological parameters and overall
survival time. Survival analysis was conducted using the
Kaplan-Meier method followed by log-rank test. P<0.05 was
considered to indicate a statistically significant difference.
Results
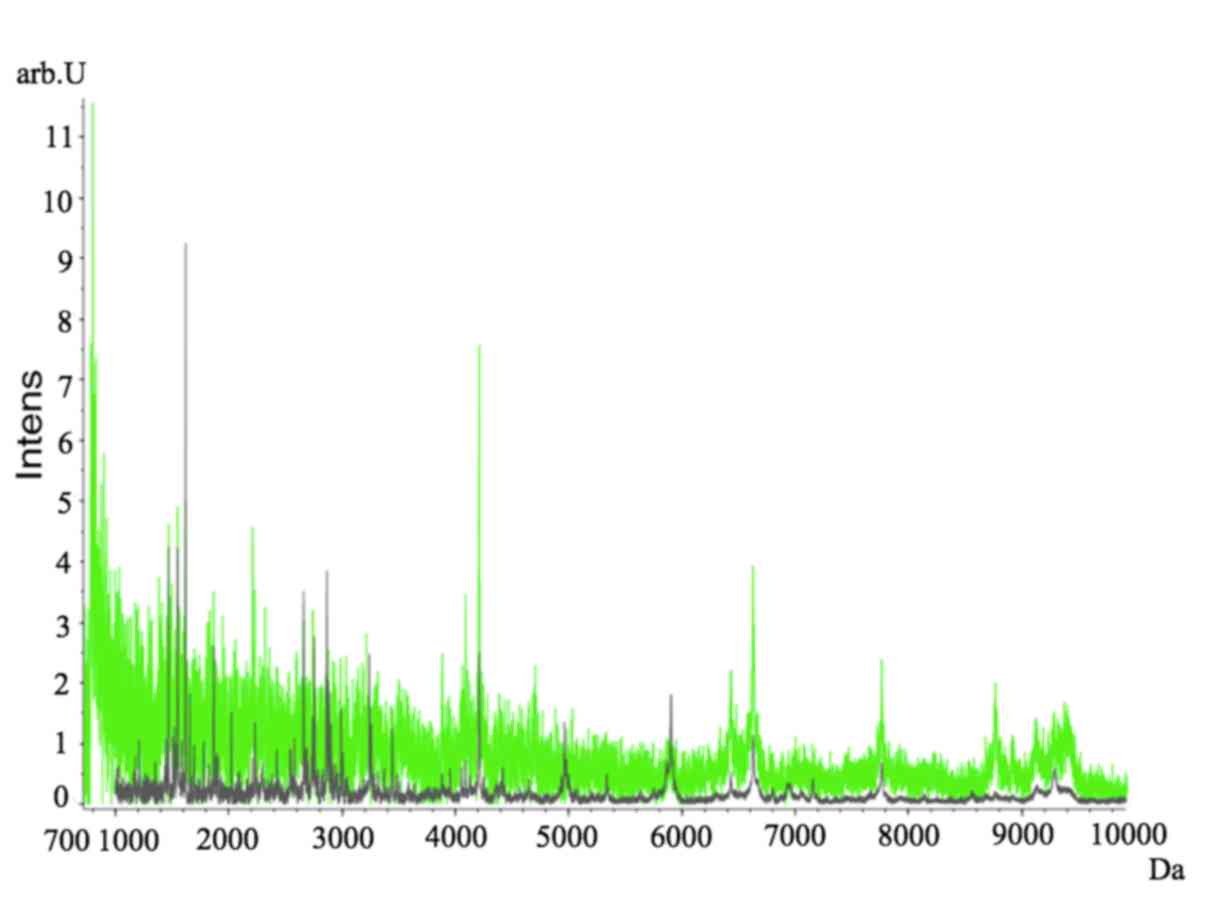
Proteomic profiling of patients with
MM and controls
Proteomic profiles of the MM and control groups were
compared. Fractionation of BM samples from MM (gray) and control
(green) groups was performed and the proteomic profiles
subsequently analyzed using ClinProt-based serum peptidomics
(Fig. 1). Various differentially
expressed peaks within the 700–10,000 kDa mass range were detected
between the 2 groups (Fig. 1).
Table II summarizes the
characteristics of the 10 significantly differentiated peaks. Among
these 10 peaks, 6 peaks with m/z values of 1,779.24, 1,866.32,
2,022.36, 2,878.90, 4,417.76 and 7,155.38 were upregulated, and 4
peaks with m/z values of 1,466.54, 1,520.02, 1,546.53 and 2,991.05
were downregulated in patients with MM compared with healthy
controls. Potential biomarkers were selected using spectral data
from patients with MM and healthy controls.
| Table II.Differentially expressed peptides
between patients with multiple myeloma and healthy controls. |
Table II.
Differentially expressed peptides
between patients with multiple myeloma and healthy controls.
| Index | Mass, Da | Dave | P-value | Ave1 | Ave2 | SD1 | SD2 |
|---|
| 8 | 1,866.32 | 4.41 | 0.0000103 | 2.51 | 6.92 | 0.44 | 4.32 |
| 9 | 2,022.36 | 2.19 | 0.00134 | 2.3 | 4.49 | 0.29 | 3.43 |
| 7 | 1,779.24 | 0.98 | 0.0459 | 2.51 | 3.49 | 0.38 | 1.45 |
| 17 | 2,991.05 | 2.07 | 0.000101 | 4.34 | 4.34 | 2.28 | 0.56 |
| 32 | 7,155.38 | 0.77 | 0.00392 | 1.07 | 1.84 | 0.15 | 1.39 |
| 15 | 2,878.9 | 1.44 | 0.00998 | 3.28 | 4.72 | 1.44 | 2.08 |
| 3 | 1,520.02 | 0.74 | 0.0181 | 3.98 | 3.24 | 1.10 | 0.79 |
| 1 | 1,466.54 | 2.59 | 0.0473 | 7.65 | 5.05 | 4.51 | 2.20 |
| 4 | 1,546.53 | 1.39 | 0.0467 | 6.41 | 5.02 | 2.34 | 2.20 |
| 22 | 4,417.76 | 1.07 | 0.00382 | 1.46 | 2.53 | 0.31 | 3.56 |
Peptide identification using
LC-ESI-MS/MS
Using LC-ESI-MS/MS, peptide peaks (pk 8, 1,866.32
Da; pk 15, 2,878.90 Da; pk 17, 2,991.05 Da and pk 3, 1,520.02 Da)
were further identified (Fig. 2).
These peptide sequences were identified as peptide fragments of
C3f, GSTP1, FN1 and AFP (Table
III).
| Table III.Sequence identification of selected
biomarkers for patients with multiple myeloma. |
Table III.
Sequence identification of selected
biomarkers for patients with multiple myeloma.
| Mass, Da | Peptide
sequence | Identity |
|---|
| 1,866.32 | Complement 3f |
R.SSKITHRIHWESASLL.R |
| 2,991.05 | Glutathione
S-transferases P1 |
R.MLLADQGQSWKEEVVTVETWQEGSLK.A |
| 2,878.90 | Fibronectin 1 |
R.SYTITGLQPGTDYKIYLYTLNDNAR.S |
| 1,520.02 | α-fetoprotein |
K.APQLTSSELMAITR.K |
Serum levels of C3f, GSTP1, FN1 and
AFP in patients with MM and healthy controls
Serum concentrations of GSTP1, FN1, C3f and AFP in
patients with MM and controls were measured using ELISAs. The mean
concentrations of GSTP1 were 29.64±9.13 µg/l in patients with MM
and 16.15±5.64 µg/l in controls. Meanwhile, the mean concentration
of FN1 expression was significantly increased in the MM group
(76.62±14.13 µg/l) compared with the control group (31.07±14.36
µg/l). The concentrations of GSTP1 and FN1 were significantly
increased in the MM group compared with the control group
(P<0.05; Fig. 3C and D).
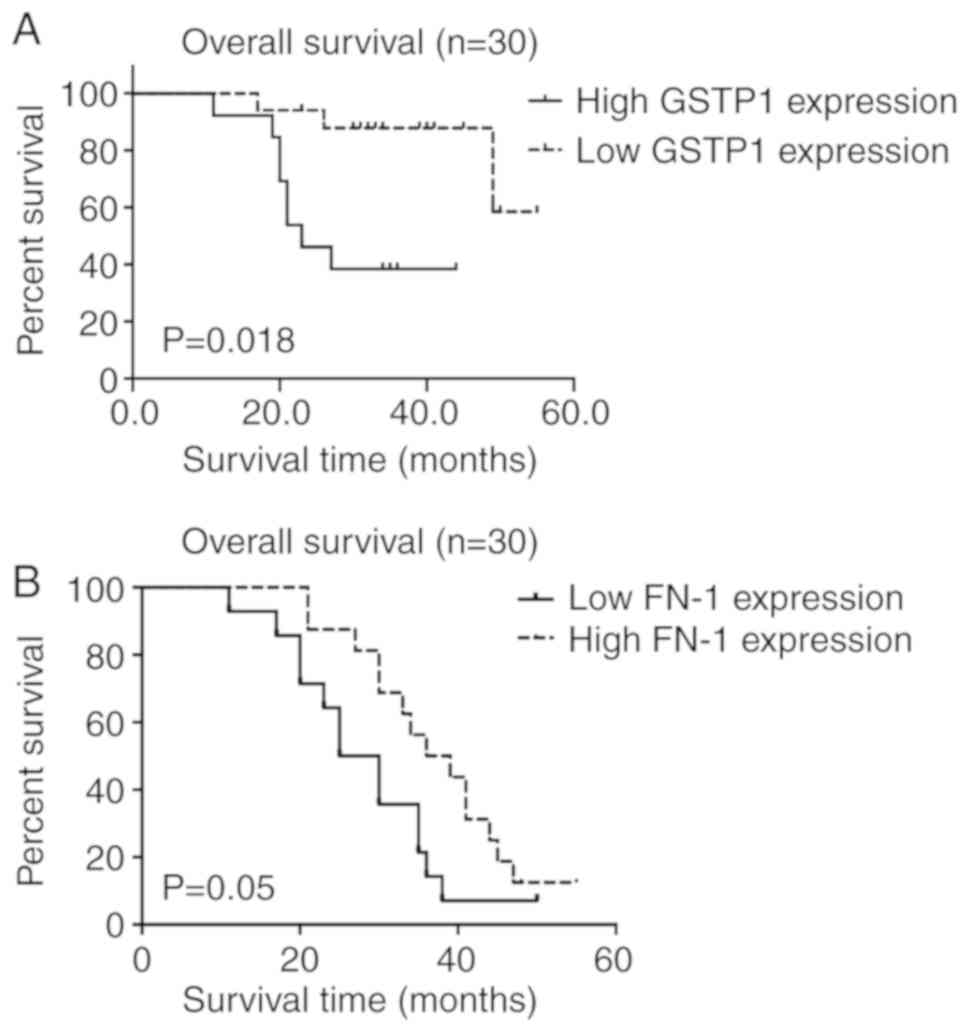
GSTP1 expression is associated with
clinical features of MM
Τhe association between GSTP1 expression and the
clinical features of patients with MM was investigated. A strong
association was found between GSTP1 levels and the clinical stage
of disease (DS stage, P=0.001 and ISS stage, P=0.018; Table IV). However, no significant
differences were observed between the GSTP1 levels and age
(P=0.670), sex (P=0.785) or Osteolytic bone disease (P=0.068)
(Table IV). Patients were split
into two groups based on ROC analysis. The cutoff value of
expression of GSTP-1 is set as 19.45 µg/l. Student's t-test
analysis revealed that the hemoglobin level and OS in the
high-GSTP1 group were significantly lower than in the low-GSTP1
group (P<0.001 and P<0.05, respectively; Fig. 4B and C). Serum M protein and BM
plasma cell levels were significantly higher in the high-GSTP1
group compared with the low-GSTP1 group (P<0.001 and P<0.001,
respectively; Fig. 4A and D).
Furthermore, multivariate Cox regression analysis indicated that
the expression of GSTP1 was an independent prognostic factor for
poor OS time (P=0.015; Table V).
Kaplan-Meier survival analyses showed that there is significant
difference between survival of high-GSTP1 and low-GSTP1 group.
(P=0.018, Fig. 5A). These results
indicate that GSTP1 was associated with the clinical outcome of
patients with MM, and may be a valuable prognostic marker for
MM.
| Table IV.Association of GSTP1 expression and
clinical outcomes of patients with multiple myeloma. |
Table IV.
Association of GSTP1 expression and
clinical outcomes of patients with multiple myeloma.
|
Characteristics | Total | High GSTP1 | Low GSTP1 | P-value |
|---|
| Patients, n | 30 | 13 | 17 |
|
| Sex, n | 30 |
|
|
0.785 |
|
Male |
| 7 | 10 |
|
|
Female |
| 6 | 7 |
|
| Age in years, mean
± SD | 59.6±8.30 | 57.54±7.48 | 61.18±8.72 | 0.67 |
| DS stage, n |
|
|
|
0.001 |
| I | 5 | 0 | 5 |
|
| II | 10 | 1 | 9 |
|
|
III | 15 | 12 | 3 |
|
| ISS stage, n |
|
|
|
0.018 |
| I | 5 | 0 | 5 |
|
| II | 14 | 5 | 9 |
|
|
III | 11 | 8 | 3 |
|
| Osteolytic bone
disease | 20 | 11 | 9 |
0.068 |
| Table V.Multivariate analysis of overall
survival time in patients with multiple myeloma. |
Table V.
Multivariate analysis of overall
survival time in patients with multiple myeloma.
|
|
|
| 95% confidence
interval |
|---|
|
|
|
|
|
|---|
| Characteristic | P-value | Hazard ratio | Lower | Upper |
|---|
| GSTP1 | 0.015 | 6.914 | 1.459 | 32.77 |
| Sex | 0.051 | 0.212 | 0.045 | 0.922 |
| Age | 0.283 | 0.962 | 0.895 | 1.033 |
| DS stage | 0.040 | 4.248 | 1.068 | 16.901 |
| ISS stage | 0.005 | 8.628 | 1.945 | 38.264 |
| Serum M
protein | 0.002 | 1.135 | 1.046 | 1.232 |
| Hemoglobin | 0.004 | 0.892 | 0.826 | 0.964 |
| Bone marrow plasma
cell | 0.001 | 1.122 | 1.054 | 1.195 |
| Osteolytic bone
disease | 0.086 | 1.762 | 0.986 | 2.743 |
Discussion
Similar to most human cancers, nearly all cases of
MM are preceded by an asymptomatic premalignant stage such as MGUS
or smoldering myeloma (2). Nearly 1%
of patients with MGUS consistently progress to MM per year
(18). Early detection and diagnosis
of MM could significantly decrease mortality from the disease. The
majority of current biomarker studies have focused on gene or
protein expression in serum from patients with MM (19,20).
However, these markers cannot indicate the BM microenvironment,
especially for patients at early stages of MM (19). In recent years, proteomic techniques
have been widely used to find potential biomarkers in various solid
tumors and hematological diseases (21).
In the present study, the BM proteomic profiles of
patients with MM were established using an MB-WCX-based MALDI-TOF
MS technique combined with ClinProTools. The 10 most
differentially-expressed potential biomarkers between the patients
and controls were analyzed. Among these biomarkers, four were
down-regulated (peptides with m/z values of 1,466.54, 1,520.02,
1,546.53 and 2,991.05) and the rest were upregulated (peptides with
m/z values of 1,779.24, 1,866.32, 2,022.36, 2,878.9, 4,417.76 and
7,155.38) in the MM group. Furthermore, four peptide peaks that
were different between patients with MM and healthy controls were
successfully identified as C3f, FN1, GSTP1 and AFP.
The complement cascade is an essential component of
the human innate immune system and is an important mechanism for
the detection and clearance of potential pathogens (22). C3f is an essential component of the
complement cascade (23). In the
alternative pathway of the complement cascade, C3b is activated by
C3, which can be inactivated by factor I in the presence of one of
several cofactor molecules, including factor H, complement receptor
1 and membrane co-factor protein (24). C3f is formed by the cleavage of C3b
(25). The presence of C3f is
associated with a predisposition for developing renal diseases,
metabolic syndrome and rheumatological diseases (26,27). In
addition, it has been demonstrated that C3f has a significant
association with an increased risk of marginal zone lymphoma
(28). To date, there have been few
reports focused on the role of C3f in the pathogenesis and
progression of MM. In the present study, the C3f level in BM
samples from patients with MM was significantly increased compared
with those from healthy control patients. It can be speculated that
C3f participates in the genesis and development of MM. However, the
association between C3f and MM pathogenesis requires further
investigation.
FN1 is a member of the glycoprotein family, which is
implicated in cell migration, cytoskeletal organization and
oncogenic transformation, and is widely expressed in different cell
lines (29,30). It has been reported that FN1 is
upregulated in several tumors such as nasopharyngeal carcinoma
(31) and melanoma (32). Upregulation of FN1 indicates poor
prognosis in thyroid cancer and nasopharyngeal cancer (33,34). A
previous study demonstrated that FN1 may be a potential biomarker
for radiotherapy and drug resistance in head and neck squamous cell
carcinoma (35). The exact mechanism
by which FN1 induces these poor outcomes has not been investigated.
High expression of FN1 suppressed apoptosis through the NF-κB
pathway and was associated with migration in nasopharyngeal tumors
(31). FN1 can also downregulate p53
and inhibit apoptosis in colorectal cancer (36). Since FN1 is associated with disease
progression and survival, it may be a prognostic biomarker in
tumors. In the present study, high levels of FN1 protein expression
were detected in BM samples from patients with MM. The serum level
of FN1 was increased in patients with MM compared with controls.
Therefore, FN1 may be a potential biomarker for MM detection.
Glutathione S-transferases (GSTs) are a superfamily
of phase-II metabolic enzymes (37).
The function of GSTs is essential in the antioxidant response
system (38). Glutathione
S-transferases π 1 is a key phase-II metabolic enzyme involved in
tumorigenesis and detoxification (39). It has been reported that the
expression of GSTs is increased in numerous types of human cancer
and in a large number of drug-resistant tumor cell lines (40). Previous studies revealed that GSTP1
participates in tumorigenesis by regulating several kinase pathways
(37,41). GST inhibitors can enhance tumor cell
sensitivity to drugs leading to reversion of drug resistance
(42). In addition, GSTP1 can
directly influence the BM environment by stimulating aberrant
redox, which causes myeloproliferative events (43). This finding is consistent with the
findings of the present study, which indicate that peptides of
GSTP1 were upregulated in BM samples from patients with MM compared
with those from healthy control patients. Additionally, it was
demonstrated that GSTP1 was upregulated in serum samples from
patients with MM compared with healthy controls. Statistical
analysis revealed that high levels of GSTP1 were significantly
associated with the MM clinical stage and shorter OS time of
patients with MM. Multivariate analysis indicated that a high level
of GSTP1 may serve as an independent prognostic indicator for MM.
The findings of the current study suggest that GSTP1 may not only
be a biomarker of MM, but also a good indicator for monitoring
MRD.
In conclusion, MB-WCX-based MALDI-TOF MS showed high
sensitivity and specificity for identification of MM in patients.
Peptides corresponding to GSTP1 and FN1 were confirmed by ELISA to
be potential serum biomarkers in patients with MM. Furthermore,
clinical data indicated that GSTP1 expression was directly
associated with MM prognosis. GSTP1 may be a marker for diagnosis
and prognosis of MM.
Acknowledgements
Not applicable.
Funding
The present study was funded by grants from the Key
Science and Technology Research Program of Shaanxi Province (grant
no. 2018SF-054), the Fundamental Research Funds for the Central
Universities (grant no. xjj2018jchz15) and the Fundamental Research
Funds of the First Affiliated Hospital of Xi'an Jiao Tong
University (grant no. 2017QN-29).
Availability of data and materials
The datasets used and/or analyzed during the current
study are available from the corresponding author on reasonable
request.
Authors' contributions
JZ and MZ contributed to the conception and
administrative support of the study. JZ wrote the manuscript. MW
attributed to provision of the study materials and collection of
bone marrow samples and analysis of mass spectral data. PH and YC
attributed to the collection and analysis of the experimental data.
XW conducted follow-ups of the patients and analysis of clinical
data. All authors have read and approved the manuscript.
Ethical approval and consent to
participate
This study was approved by The Ethics Committee of
the First Affiliated Hospital of Xi'an Jiaotong University (Xi'an,
China). All participants in the study provided written informed
consent.
Patient consent for publication
Not applicable.
Competing interests
The authors declare that they have no competing
interests.
References
|
1
|
Siegel RL, Miller KD and Jemal A: Cancer
statistics, 2016. CA Cancer J Clin. 66:7–30. 2016. View Article : Google Scholar : PubMed/NCBI
|
|
2
|
Kumar SK, Rajkumar V, Kyle RA, van Duin M,
Sonneveld P, Mateos MV, Gay F and Anderson KC: Multiple myeloma.
Nat Rev Dis Primers. 3:170462017. View Article : Google Scholar : PubMed/NCBI
|
|
3
|
Durie BGM, Hoering A, Abidi MH, Rajkumar
SV, Epstein J, Kahanic SP, Thakuri M, Reu F, Reynolds CM, Sexton R,
et al: Bortezomib with lenalidomide and dexamethasone versus
lenalidomide and dexamethasone alone in patients with newly
diagnosed myeloma without intent for immediate autologous stem-cell
transplant (SWOG S0777): A randomised, open-label, phase 3 trial.
Lancet. 389:519–527. 2017. View Article : Google Scholar : PubMed/NCBI
|
|
4
|
Abe M, Harada T and Matsumoto T: Concise
review: Defining and targeting myeloma stem cell-like cells. Stem
Cells. 32:1067–1073. 2014. View Article : Google Scholar : PubMed/NCBI
|
|
5
|
Kyle RA, Remstein ED, Therneau TM,
Dispenzieri A, Kurtin PJ, Hodnefield JM, Larson DR, Plevak MF,
Jelinek DF, Fonseca R, et al: Clinical course and prognosis of
smoldering (asymptomatic) multiple myeloma. N Engl J Med.
356:2582–2590. 2007. View Article : Google Scholar : PubMed/NCBI
|
|
6
|
Zhan F, Hardin J, Kordsmeier B, Bumm K,
Zheng M, Tian E, Sanderson R, Yang Y, Wilson C, Zangari M, et al:
Global gene expression profiling of multiple myeloma, monoclonal
gammopathy of undetermined significance, and normal bone marrow
plasma cells. Blood. 99:1745–1757. 2002. View Article : Google Scholar : PubMed/NCBI
|
|
7
|
Landgren O, Kyle RA, Pfeiffer RM, Katzmann
JA, Caporaso NE, Hayes RB, Dispenzieri A, Kumar S, Clark RJ, Baris
D, et al: Monoclonal gammopathy of undetermined significance (MGUS)
consistently precedes multiple myeloma: A prospective study. Blood.
113:5412–5417. 2009. View Article : Google Scholar : PubMed/NCBI
|
|
8
|
Chee CE, Kumar S, Larson DR, Kyle RA,
Dispenzieri A, Gertz MA, Colby CL and Rajkumar SV: The importance
of bone marrow examination in determining complete response to
therapy in patients with multiple myeloma. Blood. 114:2617–2618.
2009. View Article : Google Scholar : PubMed/NCBI
|
|
9
|
Durie BG, Harousseau JL, Miguel JS, Bladé
J, Barlogie B, Anderson K, Gertz M, Dimopoulos M, Westin J,
Sonneveld P, et al: International uniform response criteria for
multiple myeloma. Leukemia. 20:1467–1473. 2006. View Article : Google Scholar : PubMed/NCBI
|
|
10
|
Kumar S, Paiva B, Anderson KC, Durie B,
Landgren O, Moreau P, Munshi N, Lonial S, Bladé J, Mateos MV, et
al: International myeloma working group consensus criteria for
response and minimal residual disease assessment in multiple
myeloma. Lancet Oncol. 17:e328–e346. 2016. View Article : Google Scholar : PubMed/NCBI
|
|
11
|
Durie BG and Salmon SE: A clinical staging
system for multiple myeloma. Correlation of measured myeloma cell
mass with presenting clinical features, response to treatment, and
survival. Cancer. 36:842–854. 1975. View Article : Google Scholar : PubMed/NCBI
|
|
12
|
Greipp PR, Miguel JS, Durie BG, Crowley
JJ, Barlogie B, Bladé J, Boccadoro M, Child JA, Avet-Loiseau H,
Kyle RA, et al: International staging system for multiple myeloma.
J Clin Oncol. 23:3412–3420. 2005. View Article : Google Scholar : PubMed/NCBI
|
|
13
|
Morgan GJ, Walker BA and Davies FE: The
genetic architecture of multiple myeloma. Nat Rev Cancer.
12:335–348. 2012. View
Article : Google Scholar : PubMed/NCBI
|
|
14
|
Hideshima T, Mitsiades C, Tonon G,
Richardson PG and Anderson KC: Understanding multiple myeloma
pathogenesis in the bone marrow to identify new therapeutic
targets. Nat Rev Cancer. 7:585–598. 2007. View Article : Google Scholar : PubMed/NCBI
|
|
15
|
Tsai TH, Song E, Zhu R, Di Poto C, Wang M,
Luo Y, Varghese RS, Tadesse MG, Ziada DH, Desai CS, et al:
LC-MS/MS-based serum proteomics for identification of candidate
biomarkers for hepatocellular carcinoma. Proteomics. 15:2369–2381.
2015. View Article : Google Scholar : PubMed/NCBI
|
|
16
|
Srinivas PR, Verma M, Zhao Y and
Srivastava S: Proteomics for cancer biomarker discovery. Clin Chem.
48:1160–1169. 2002.PubMed/NCBI
|
|
17
|
International Myeloma Working Group, :
Criteria for the classification of monoclonal gammopathies,
multiple myeloma and related disorders: A report of the
international myeloma working group. Br J Haematol. 121:749–757.
2003. View Article : Google Scholar : PubMed/NCBI
|
|
18
|
Dhodapkar MV: MGUS to myeloma: A
mysterious gammopathy of underexplored significance. Blood.
128:2599–2609. 2016. View Article : Google Scholar : PubMed/NCBI
|
|
19
|
Rajkumar SV, Mesa RA, Fonseca R, Schroeder
G, Plevak MF, Dispenzieri A, Lacy MQ, Lust JA, Witzig TE, Gertz MA,
et al: Bone marrow angiogenesis in 400 patients with monoclonal
gammopathy of undetermined significance, multiple myeloma, and
primary amyloidosis. Clin Cancer Res. 8:2210–2216. 2002.PubMed/NCBI
|
|
20
|
Szalat R, Avet-Loiseau H and Munshi NC:
Gene expression profiles in myeloma: Ready for the real world? Clin
Cancer Res. 22:5434–5442. 2016. View Article : Google Scholar : PubMed/NCBI
|
|
21
|
Hristova VA and Chan DW: Cancer biomarker
discovery and translation: Proteomics and beyond. Expert Rev
Proteomics. 16:93–103. 2019. View Article : Google Scholar : PubMed/NCBI
|
|
22
|
Sahu A and Lambris JD: Structure and
biology of complement protein C3, a connecting link between innate
and acquired immunity. Immunol Rev. 180:35–48. 2001. View Article : Google Scholar : PubMed/NCBI
|
|
23
|
Nilsson B and Nilsson Ekdahl K: The
tick-over theory revisited: Is C3 a contact-activated protein?
Immunobiology. 217:1106–1110. 2012. View Article : Google Scholar : PubMed/NCBI
|
|
24
|
Ricklin D, Reis ES, Mastellos DC, Gros P
and Lambris JD: Complement component C3-The ‘Swiss Army Knife’ of
innate immunity and host defense. Immunol Rev. 274:33–58. 2016.
View Article : Google Scholar : PubMed/NCBI
|
|
25
|
Delanghe JR, Speeckaert R and Speeckaert
MM: Complement C3 and its polymorphism: Biological and clinical
consequences. Pathology. 46:1–10. 2014. View Article : Google Scholar : PubMed/NCBI
|
|
26
|
Wlazlo N, van Greevenbroek MM, Ferreira I,
Jansen EJ, Feskens EJ, van der Kallen CJ, Schalkwijk CG, Bravenboer
B and Stehouwer CD: Low-grade inflammation and insulin resistance
independently explain substantial parts of the association between
body fat and serum C3: The CODAM study. Metabolism. 61:1787–1796.
2012. View Article : Google Scholar : PubMed/NCBI
|
|
27
|
Van Timmeren MM, Chen M and Heeringa P:
Review article: Pathogenic role of complement activation in
anti-neutrophil cytoplasmic auto-antibody-associated vasculitis.
Nephrology (Carlton). 14:16–25. 2009. View Article : Google Scholar : PubMed/NCBI
|
|
28
|
Cerhan JR, Novak AJ, Fredericksen ZS, Wang
AH, Liebow M, Call TG, Dogan A, Witzig TE, Ansell SM, Habermann TM,
et al: Risk of non-Hodgkin lymphoma in association with germline
variation in complement genes. Br J Haematol. 145:614–623. 2009.
View Article : Google Scholar : PubMed/NCBI
|
|
29
|
Sponziello M, Rosignolo F, Celano M,
Maggisano V, Pecce V, De Rose RF, Lombardo GE, Durante C, Filetti
S, Damante G, et al: Fibronectin-1 expression is increased in
aggressive thyroid cancer and favors the migration and invasion of
cancer cells. Mol Cell Endocrinol. 431:123–132. 2016. View Article : Google Scholar : PubMed/NCBI
|
|
30
|
Gao W, Liu Y, Qin R, Liu D and Feng Q:
Silence of fibronectin 1 increases cisplatin sensitivity of
non-small cell lung cancer cell line. Biochem Biophys Res Commun.
476:35–41. 2016. View Article : Google Scholar : PubMed/NCBI
|
|
31
|
Wang J, Deng L, Huang J, Cai R, Zhu X, Liu
F, Wang Q, Zhang J and Zheng Y: High expression of Fibronectin 1
suppresses apoptosis through the NF-κB pathway and is associated
with migration in nasopharyngeal carcinoma. Am J Transl Res.
9:4502–4511. 2017.PubMed/NCBI
|
|
32
|
Li B, Shen W, Peng H, Li Y, Chen F, Zheng
L, Xu J and Jia L: Fibronectin 1 promotes melanoma proliferation
and metastasis by inhibiting apoptosis and regulating EMT. Onco
Targets Ther. 12:3207–3221. 2019. View Article : Google Scholar : PubMed/NCBI
|
|
33
|
Xia S, Wang C, Postma EL, Yang Y, Ni X and
Zhan W: Fibronectin 1 promotes migration and invasion of papillary
thyroid cancer and predicts papillary thyroid cancer lymph node
metastasis. Onco Targets Ther. 10:1743–1755. 2017. View Article : Google Scholar : PubMed/NCBI
|
|
34
|
Ma LJ, Lee SW, Lin LC, Chen TJ, Chang IW,
Hsu HP, Chang KY, Huang HY and Li CF: Fibronectin overexpression is
associated with latent membrane protein 1 expression and has
independent prognostic value for nasopharyngeal carcinoma. Tumour
Biol. 35:1703–1712. 2014. View Article : Google Scholar : PubMed/NCBI
|
|
35
|
Jerhammar F, Ceder R, Garvin S, Grénman R,
Grafström RC and Roberg K: Fibronectin 1 is a potential biomarker
for radioresistance in head and neck squamous cell carcinoma.
Cancer Biol Ther. 10:1244–1251. 2010. View Article : Google Scholar : PubMed/NCBI
|
|
36
|
Yi W, Xiao E, Ding R, Luo P and Yang Y:
High expression of fibronectin is associated with poor prognosis,
cell proliferation and malignancy via the NF-κB/p53-apoptosis
signaling pathway in colorectal cancer. Oncol Rep. 36:3145–3153.
2016. View Article : Google Scholar : PubMed/NCBI
|
|
37
|
Townsend DM and Tew KD: The role of
glutathione-S-transferase in anti-cancer drug resistance. Oncogene.
22:7369–7375. 2003. View Article : Google Scholar : PubMed/NCBI
|
|
38
|
Strange RC, Spiteri MA, Ramachandran S and
Fryer AA: Glutathione-S-transferase family of enzymes. Mutat Res.
482:21–26. 2001. View Article : Google Scholar : PubMed/NCBI
|
|
39
|
Adler V, Yin Z, Fuchs SY, Benezra M,
Rosario L, Tew KD, Pincus MR, Sardana M, Henderson CJ, Wolf CR, et
al: Regulation of JNK signaling by GSTp. EMBO J. 18:1321–1334.
1999. View Article : Google Scholar : PubMed/NCBI
|
|
40
|
Ding H, Liu W, Yu X, Wang L, Shao L and Yi
W: Risk association of meningiomas with MTHFR C677T and GSTs
polymorphisms: A meta-analysis. Int J Clin Exp Med. 7:3904–3914.
2014.PubMed/NCBI
|
|
41
|
Tew KD, Manevich Y, Grek C, Xiong Y, Uys J
and Townsend DM: The role of glutathione S-transferase P in
signaling pathways and S-glutathionylation in cancer. Free Radic
Biol Med. 51:299–313. 2011. View Article : Google Scholar : PubMed/NCBI
|
|
42
|
Wang R, Liu C, Xia L, Zhao G, Gabrilove J,
Waxman S and Jing Y: Ethacrynic acid and a derivative enhance
apoptosis in arsenic trioxide-treated myeloid leukemia and lymphoma
cells: The role of glutathione S-transferase p1-1. Clin Cancer Res.
18:6690–6701. 2012. View Article : Google Scholar : PubMed/NCBI
|
|
43
|
Emadi A and Karp JE: The clinically
relevant pharmacogenomic changes in acute myelogenous leukemia.
Pharmacogenomics. 13:1257–1269. 2012. View Article : Google Scholar : PubMed/NCBI
|