Introduction
Gliomas are specific tumour types present in either
the brain or the spinal cord. Notably, gliomas start in the gluey
supportive cells, called glial cells, that surround nerve cells and
help in their functioning. Gliomas are one of the most prevalent
types of brain tumours and most cancerous tumours found in the
brain and central nervous system are gliomas (1). Based on the criteria established by
the World Health Organization (WHO), gliomas may have different
severity levels, from grade I to IV (2). At present, surgical resection combined
with radiotherapy, chemotherapy and targeted therapy are the
primary clinical treatment strategies for gliomas (3). However, owing to the high
heterogeneity and invasiveness of gliomas, complete surgical
resection of the focus is challenging; furthermore, drugs cannot
pass through the blood-brain barrier, severely limiting the
efficacy of traditional therapeutic drugs, including immunotherapy,
targeted therapy and chemotherapy (4). Therefore, the survival time of most
patients with gliomas is markedly short and patients with
high-grade gliomas have the lowest 5-year survival rate of ~5.4%
among all cancer types (3,5).
Recent advances in molecular biology and molecular
pathology as well as detailed studies on key molecules and
signalling pathways involved in tumorigenesis and development have
led to the development of targeted therapies for corresponding
molecular targets and signalling pathways, including epidermal
growth factor receptor tyrosine kinase inhibitors, anti-vascular
endothelial growth factor therapy and mutant isocitrate
dehydrogenase (IDH) as molecularly targeted drugs (6–9).
Furthermore, molecular pathology, a new concept, has again been
elevated to a new level in the 2021 WHO diagnosis and treatment
guidelines (10). These new
guidelines for glioma diagnosis and treatment are not only related
to the classification, diagnosis and prognostic evaluation of
gliomas but also to the grading, optimization and updating of the
traditional morphological classification methods for gliomas.
This new classification method, involving molecular
typing as the core basis for tumour classification, not only
increases the accuracy and reliability of diagnosis but also helps
accurately judge prognosis and guide treatment, making it a
revolutionary approach (10).
Therefore, it is vital to explore new and reliable molecular
markers for glioma diagnosis and prognosis in the future to
clinically manage patients with this condition.
S100 Calcium-binding protein A6 (S100A6) is a
protein that belongs to the S100 family; it plays a role in tumour
occurrence and progression by promoting the epithelial-mesenchymal
transformation, proliferation and migration of several cancer cells
(11–14). In addition, S100A6 is associated
with the unfavourable prognosis of patients with cancer (15). However, a previous study reported
that S100A6 expression is remarkably decreased in non-small cell
lung cancer tissues compared with that in normal tissues (16); these findings suggest that S100A6
plays different roles in different tumours. Previous studies
reported that the clinical significance of S100A6 in gliomas is
controversial. Camby et al (17) reported that S100A6 protein levels
can help clearly distinguish between low- and high-grade
astrocytomas. However, another study reported that S100A6 is highly
expressed in human astrocytomas; however, its expression does not
exert significant functional changes in the degree of malignancy of
the tumour (18). Therefore, S100A6
cannot be used as a specific marker among different grades.
Kucharczak et al (19)
reported that gastrin can mediate the movement of glioblastoma
cells by upregulating the promoter of S100A6, which could induce
the overexpression of S100A6. To the best of our knowledge, the
correlation between S100A6 and glioma is inconclusive, with only
the study by Zhang et al (20) suggesting that S100A6 upregulation in
low-grade glioma is markedly correlated with a dismal prognosis.
However, at present, studies on the biological function of S100A6
in gliomas are lacking and the diagnostic and prognostic
significance of S100A6 in gliomas should be further validated.
Therefore, additional studies are warranted to determine the
clinical significance of S100A6 in gliomas.
In the present study, the Genotype-Tissue Expression
(GTEx) and The Cancer Genome Atlas (TCGA) databases were used to
elucidate the clinical significance of S100A6 in glioblastoma.
Moreover, the present study confirmed this significance in a small
clinical cohort of glioma. The present findings enhance the
understanding of the role of S100A6 in glioblastoma and should help
in the detection of this protein, assess its clinical importance
and prognostic significance and develop new therapeutic approaches
for patients with glioma.
Materials and methods
Data collection and analysis
Information on S100A6 gene expression and the basic
clinical characteristics of 33 tumour types were derived from GTEx
and TCGA (https://portal.gdc.cancer.gov) (21–23).
TCGAbiolinks (R package; http://bioconductor.org/packages/TCGAbiolinks/) was
used to download and organise the RNA sequencing (RNA-seq) data and
clinical information for each representative tumour type from TCGA
and convert them into the TPM format for subsequent analysis.
Simultaneously, UCSCXenaTools (R package;, http://ucscpublic.xenahubs.net) was used to download
the RNA-seq data and clinical information for normal individuals
from the GTEx project database (https://gtexportal.org/home/). RNAseq data through
Spliced Transcripts Alignment to a Reference comparison process of
33 tumor projects, TCGA-Glioblastoma Multiforme and TCGA-Low Grade
Glioma projects were downloaded and collated from TCGA database
(24). After determining the
differential expression of the S100A6 gene, the findings were
expressed as a box diagram and a paired difference diagram.
Differential gene expression, link and
enrichment analyses
DESeq2 (R package; http://bioconductor.org/packages/DESeq2/) was used to
compare S100A6 expression data (HTseq count) (critical value=50%)
and identify the differentially expressed genes (DEGs) [fold change
(FC) >2.0 or <−2.0, P<0.05] (25). Ggplot2 (R package; http://ggplot2.tidyverse.org) was used to plot the
heatmaps of the top 10 DEGs. Based on the data from TCGA-Stomach
Adenocarcinoma, Pearson's link analysis of S100A6 mRNA and other
glioma-related mRNAs was conducted. Furthermore, to determine the
function of S100A6, the top 300 genes that had the strongest
positive association with S100A6 were subjected to enrichment
analysis.
To elucidate the biological role of S100A6 in glioma
development, ClusterProfiler (R package; http://bioconductor.org/packages/clusterProfiler/) was
used to perform gene set enrichment analysis (GSEA) using the Kyoto
Encyclopedia of Genes and Genomes (KEGG), Gene Ontology (GO) and
protein-protein interaction (PPI) datasets. Enrichplot (R package;
http://bioconductor.org/packages/enrichplot/) was used
to illustrate the top five signalling pathways that had the highest
significance level of enrichment in the database (26).
Single-sample (ss)GSEA to evaluate
immune cell infiltration
The median expression of the S100A6 gene was used to
divide TCGA glioma samples into high- and low-expression groups.
The infiltrating immune cell levels were compared between the two
groups. The immune infiltration landscape was investigated using
the ssGSEA algorithm. Furthermore, Spearman's link analysis was
performed to elucidate the relationship between S100A6 expression
profiles and infiltrating immune cell subpopulations. Immune cells
with an R-value >0.4 or <−0.4 were selected for the scatter
plots and chord plots were generated.
Patients and tissue samples
In total, 43 patients with glioma who had undergone
surgical resection between January 2016 and October 2017 at the
Second Affiliated Hospital of Zhejiang University School of
Medicine were included in the present study. Glioma samples and
their associated medical information were obtained from all
patients. The inclusion criteria were as follows: i) glioma primary
tumour; ii) histopathological confirmation of glioma diagnosis;
iii) received preoperative chemo-radiotherapy; and iv) complete
clinical records. The exclusion criteria were as follows: i)
autoimmune disorders or other diseases; ii) other severe diseases;
and iii) previous immunosuppressive schemes. The present study
adhered to the ethical principles outlined in The Declaration of
Helsinki. Study procedures were approved by the Ethics Committee of
the Second Affiliated Hospital of Zhejiang University School of
Medicine, Hangzhou, China (approval no: 2021-0641).
Immunohistochemical (IHC)
staining
Glioma tissue blocks were fixed in 10% formalin at
room temperature and embedded in paraffin before they were sliced
into 5-mm thick sections for IHC staining. The slides were
deparaffinized with xylene and rehydrated using a series of
successively increasing alcohol dilutions (absolute ethanol, 95%
ethanol, 80% ethanol, 70% ethanol and 50% ethanol) at room
temperature. Subsequently, the slices were treated with 0.3%
hydrogen peroxide at 25°C for 30 min to inhibit endogenous
peroxidase activity. Thereafter, to retrieve the antigens, the
sections were boiled for 30 min in citrate buffer (10 mmol/l; Ph
6.0) at 100°C. Non-specific binding was prevented by incubating the
slides with 10% normal goat serum (cat. no. ZLI-9022; OriGene
Technologies, Inc.) for 10 min after washing the slides three times
with phosphate-buffered saline, 5 min each time. Thereafter, the
slides were incubated with rabbit anti-human S100A6 monoclonal
antibody (1:200; cat. no. ab250543; Abcam) at 4°C overnight.
Immunoassay was conducted as previously described using the Dako
EnVision detection system (K5007, Dako; Agilent Technologies, Inc.)
(27). Mayer's haematoxylin was
used as the counterstaining agent for 8 min at room temperature.
Slides were dehydrated using serial dilutions of alcohol (50%
ethanol, 70% ethanol, 80% ethanol, 95% ethanol and absolute
ethanol). Finally, the slides were mounted in neutral resin.
Manual IHC staining quantitation
Two different pathologists who were blinded to the
clinical features quantitatively analysed IHC staining results.
Based on the number of S100A6-positive cells, the positive cell
rate was categorized into five levels: 0 (0%); 1 (1–10%); 2
(10–50%); 3 (50–70%); and 4 (70–100%). Furthermore, based on
staining intensity, positive S100A6 expression was categorized into
four classes: 0 (no staining); 1 (weak staining in light yellow); 2
(mild staining in yellow brown); and 3 (strong staining in dark
brown). A semi-quantitative score was generated by combining the
results of the two indicators, i.e. the number of positive cells
and staining intensity. The product of these two indicators was
used to provide the final IHC score (0–12). IHC staining was
performed to categorize the tissue staining pattern as either high
(IHC score=4-12) or low (IHC score=0-3) expression (26).
Prognostic analyses
Kaplan-Meier (K-M) analysis was the foundation for
plotting the overall survival (OS) curve. Patients were grouped
based on the expression of S100A6 and labeled with their survival
status and OS time. The K-M analysis was conducted using R software
(R package; http://CRAN.R-project.org/package=survival), with the
logrank test for comparison. The K-M survival curve was plotted
using Graphpad Prism 10 software (https://www.graphpad-prism.cn/). Furthermore, OS was
determined using univariate and multivariate Cox regression models
by focusing on the effects of the S100A6 gene and clinical factors
on patient outcomes. WHO grade, IDH status and 1p/19q codeletion
information provided by Ceccarelli et al (24) were downloaded; furthermore, the
prognostic data provided by Liu et al (28) were downloaded. After removing the
samples with missing clinical information, the survival function (R
package; http://CRAN.R-project.org/package=survival) was used
for proportional risk hypothesis testing, followed by Cox
regression analysis. Lastly, rms (R package; http://hbiostat.org/R/rms/) was used to construct a
nomogram for regression analysis.
Statistical analyses
Statical and bioinformatics analyses were conducted
using R software (version Rx64 V3.6.3; http://cran.r-project.org). The pROC (R package;
http://bioconductor.org/packages/ROC/) was used to
construct the receiver operating characteristic (ROC) curves and
visualize them. The area under the ROC (AUC) was determined and the
AUC value was calculated. It is generally believed that AUC values
between 0.5 and 0.7 indicate low diagnostic accuracy, between 0.7
and 0.9 indicate medium diagnostic accuracy, and above 0.9 indicate
high diagnostic accuracy (29). The
Wilcoxon rank-sum test was performed to investigate the
differential gene expression of S100A6 in glioma tissues and normal
brain tissues. Furthermore, the Kruskal-Wallis test, logistic
regression analysis and Wilcoxon rank sum test were conducted to
verify the relationship between S100A6 gene expression and
clinicopathological characteristics. Patients without sufficient
clinical information were excluded. The statistical significance of
the variations was evaluated using the unpaired Student's t-test,
Spearman's link analysis, χ2 test and Fisher's exact
test, as appropriate, for comparing the various groups. P<0.05
was considered to indicate a statistically significant
difference.
Results
S100A6 expression is high in glioma
tissues
The Wilcoxon rank sum test was performed to
determine the differences in the mRNA expression of S100A6 in
various cancerous and normal tissues; the findings were based on
the data from both GTEx and TCGA (Fig.
1A and B). The S100A6 gene was expressed in various cancers,
such as bladder urothelial carcinoma, breast invasive carcinoma,
cholangiocarcinoma, colon adenocarcinoma, esophageal carcinoma,
head and neck squamous cell carcinoma, kidney chromophobe, kidney
renal clear cell carcinoma, kidney renal papillary cell carcinoma,
liver hepatocellular carcinoma, lung squamous cell carcinoma,
prostate adenocarcinoma, stomach adenocarcinoma and thyroid
carcinoma. Furthermore, S100A6 gene expression was increased in
glioma tumour tissues compared with that in normal tissue samples
(P<0.001; Fig. 1C).
 | Figure 1.S100A6 levels were increased in
glioma tissues compared with those in the adjacent normal tissues
and were associated with clinicopathological characteristics. (A)
S100A6 expression was shown to be higher or lower in several
malignancies compared with that in normal tissues using the
GTEx-derived data. (B) Various malignancies in the TCGA database
showed either increased or reduced S100A6 expression levels
relative to normal tissues. (C) When comparing cancer tissues with
normal tissues, the former showed increased S100A6 expression
levels. (D) The value of S100A6 gene expression for glioma
diagnosis was analyzed using receiver operating characteristic
curve plots based on GTEx and TCGA data. S100A6 gene expression in
relation with (E) WHO grade, (F) IDH status, (G) 1p/19q codeletion,
(H) Primary therapy outcome, (I) Sex, (J) Sge, (K) Histological
type and (L) OS, (M) DSS event and (N) PFI events. (O) Survival
analysis of S100A6 gene expression in patients with glioma. S100A6
high- and low-expression patient groups were separated using the
median score. (P and Q) A prognostic model of S100A6 gene
expression in glioma. (P) Prediction of 1-, 3-, and 5-year OS in
patients with glioma using a nomogram; (Q) Nomogram calibration
plot for predicting 1-, 3-, and 5-year OS rates. ACC,
adrenocortical carcinoma; BLCA, bladder urothelial carcinoma; BRCA,
breast invasive carcinoma; CESC, cervical squamous cell carcinoma
and endocervical adenocarcinoma; CHOL, cholangiocarcinoma; COAD,
colon adenocarcinoma; DLBC, lymphoid neoplasm diffuse large B-cell
lymphoma; ESCA, esophageal carcinoma; GBM, glioblastoma multiforme;
HNSC, head and neck squamous cell carcinoma; KICH, kidney
chromophobe; KIRC, kidney renal clear cell carcinoma; KIRP, kidney
renal papillary cell carcinoma; LAML, acute myeloid leukemia; LGG,
brain lower grade glioma; LIHC, liver hepatocellular carcinoma;
LUAD, lung adenocarcinoma; LUSC, lung squamous cell carcinoma;
MESO, mesothelioma; OV, ovarian serous cystadenocarcinoma; PAAD,
pancreatic adenocarcinoma; PCPG, pheochromocytoma and
paraganglioma; PRAD, prostate adenocarcinoma; READ, rectum
adenocarcinoma; SARC, sarcoma; SCKM, skin cutaneous melanoma; STAD,
stomach adenocarcinoma; TGCT, testicular germ cell tumor; THCA,
thyroid carcinoma; THYM, thymoma; UCEC, uterine corpus endometrial
carcinoma; USC, uterine carcinosarcoma (UCS); UVM, uveal Melanoma;
IDH, isocitrate dehydrogenase; OS, overall survival; DSS,
disease-specific survival; PFI, progression-free interval.
*P<0.05, **P<0.01, and ***P<0.001. |
ROC curves are used to determine whether a certain
factor has a diagnostic value for a certain disease. Furthermore,
AUC reflects the value of the diagnostic tests. The larger the AUC,
the higher the diagnostic value. Based on the data from GTEx and
TCGA, the ROC curves revealed that the mRNA of S100A6 had an
improved diagnostic value in differentiating between normal brain
and glioma tissues (AUC=0.830; Fig.
1D).
Association between S100A6 gene
expression and the clinicopathological characteristics of patients
with glioma
The clinical data that were used to define 696
individuals diagnosed with glioma were retrieved from TCGA and then
classified into the low and high groups based on median S100A6 gene
expression. To determine the relationship between S100A6 gene
expression and the clinicopathological characteristics of patients
with glioma, the Wilcoxon rank sum test and logistic regression
analysis were performed. Table SI
comprehensively presents these clinical findings. S100A6 gene
expression in glioma was substantially associated with WHO grade,
histological type, sex, age, primary treatment outcomes, 1p/19q
codeletion, IDH status, OS, disease-specific survival and
progression-free interval (P<0.05, Fig. 1E-N). Subsequently, univariate
logistic regression analysis was performed to determine the
relationship between S100A6 gene expression and the
clinicopathological characteristics of patients with glioma. A
significant correlation was observed between the S100A6 gene and
histological type, age, IDH status, 1p/19q codeletion and WHO
grade. However, no association was observed between S100A6 gene
expression and primary treatment outcomes, sex and race (Table SII).
Clinical significance of S100A6 gene
expression in glioma prognosis
The clinical significance of S100A6 gene expression
in terms of glioma prognosis was assessed using the KM plotter
database. The high S100A6 gene expression group exhibited a shorter
OS than the low-expression group (P<0.001; Fig. 1O). Univariate analysis revealed that
S100A6 upregulation was associated with a higher risk of developing
glioma [hazards ratio (HR), 4.914; CI, 3.716–6.496; P<0.001;
Table SIII). Furthermore,
multivariate analysis revealed that increased S100A6 expression was
an independent prognostic marker for predicting OS (HR, 2.155; CI,
1.358–3.419; P=0.001; Table
SIII).
A nomogram model based on Cox regression analysis
results was developed to improve the prognosis of patients
diagnosed with glioma (Fig. 1P).
The model included four independent prognostic factors: S100A6
expression; primary treatment outcomes; IDH status; and WHO grade.
A point system was used to assign scores to these variables
depending on the outcomes of multivariate analysis. A straight line
was used to identify the points corresponding to the variables.
Then, the total number of points that were allotted to each
variable was rescaled such that they were between 0 and 100. The
total score was determined by summing all the points assigned to
each variable in the analysis. The 1-, 3- and 5-year survival rates
of patients diagnosed with glioma were determined by drawing a line
directly extending from the axis denoting total score to the axis
denoting outcome. All observations of patients were consistent with
the calibration curve findings of the OS nomogram (Fig. 1Q).
Identification and enrichment analysis
of the DEGs in high/low S100A6 expression glioma samples
The median mRNA expression of the genes in the
expression profiles of low and high S100A6 expression samples were
compared. In total, 1998 DEGs, with 1,725 upregulated and 273
downregulated genes, were identified that were associated with
S100A6 expression. S100A6 gene expression was statistically
significant between low and high S100A6 expression groups
(|logFC|>2.0, P<0.05, Fig.
2A). Fig. 2B and C display the
heatmaps presenting the top 10 downregulated and upregulated DEGs
between the high and low S100A6 expression groups.
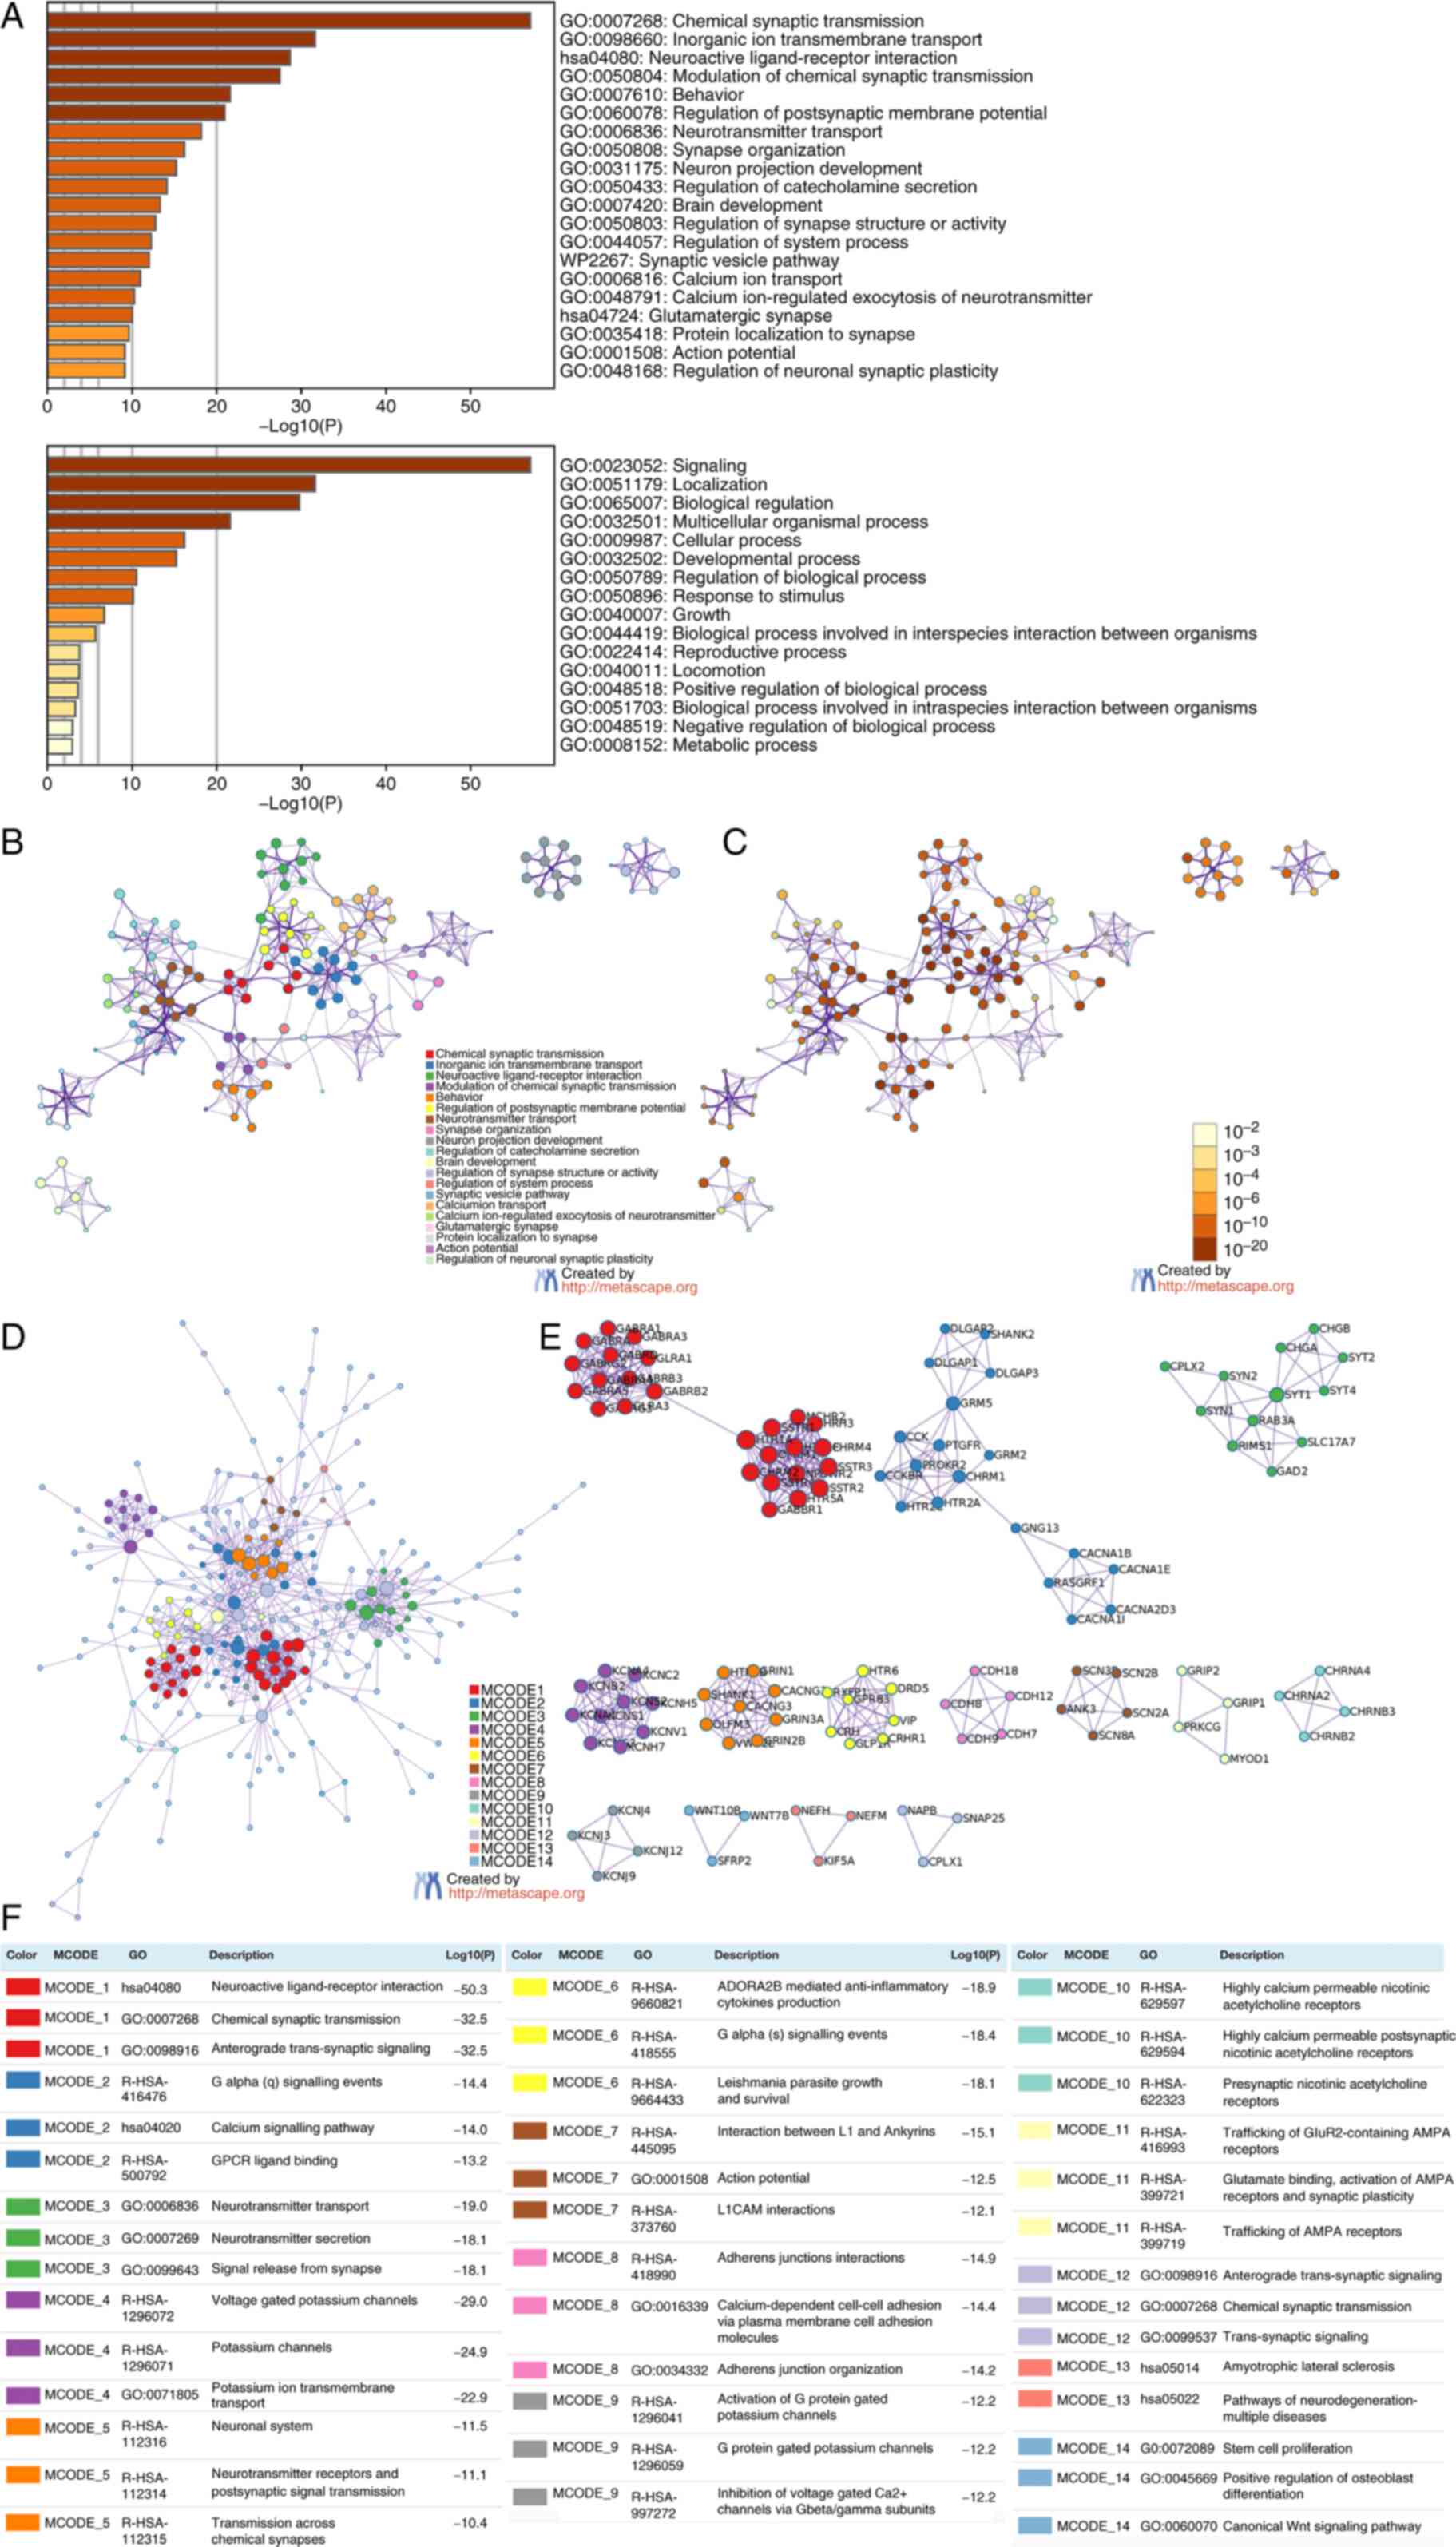
Functional enrichment analysis was performed using
the upregulated and downregulated genes to determine the biological
classification of the DEGs. GO analysis revealed the substantial
enrichment of the upregulated genes in the immune system process
and synthesis of immune response molecules that act as mediators
and adaptive immune response; on the other hand, the downregulated
genes were enriched in chemical synaptic transmission, inorganic
ion transmembrane transport, chemical synaptic transmission
regulation, behaviour and modulation of postsynaptic membrane
potential. In addition, KEGG pathway enrichment analysis revealed
that the upregulated genes primarily participated in the NABA
matrisome-associated pathway (Fig.
3A-C); by contrast, most downregulated genes were implicated in
neuroactive ligand-receptor interactions (Fig. 4A-C).
Subsequently, PPI enrichment analysis revealed that
the upregulated genes were primarily enriched in integrin cell
surface interactions, NABA collagens, collagen chain trimerization,
peptide ligand-binding receptors, G alpha signalling events and
class A/1 (rhodopsin-like receptors) (Fig. 3D and E). By contrast, the
downregulated genes were primarily enriched in neuroactive
ligand-receptor interaction, anterograde trans-synaptic signalling,
G alpha signalling events, calcium signalling pathway, chemical
synaptic transmission and GPCR ligand binding (Fig. 4D and E). Figs. 3E and F, and 4E and F demonstrate that the MCODE
components were identified in the gene lists.
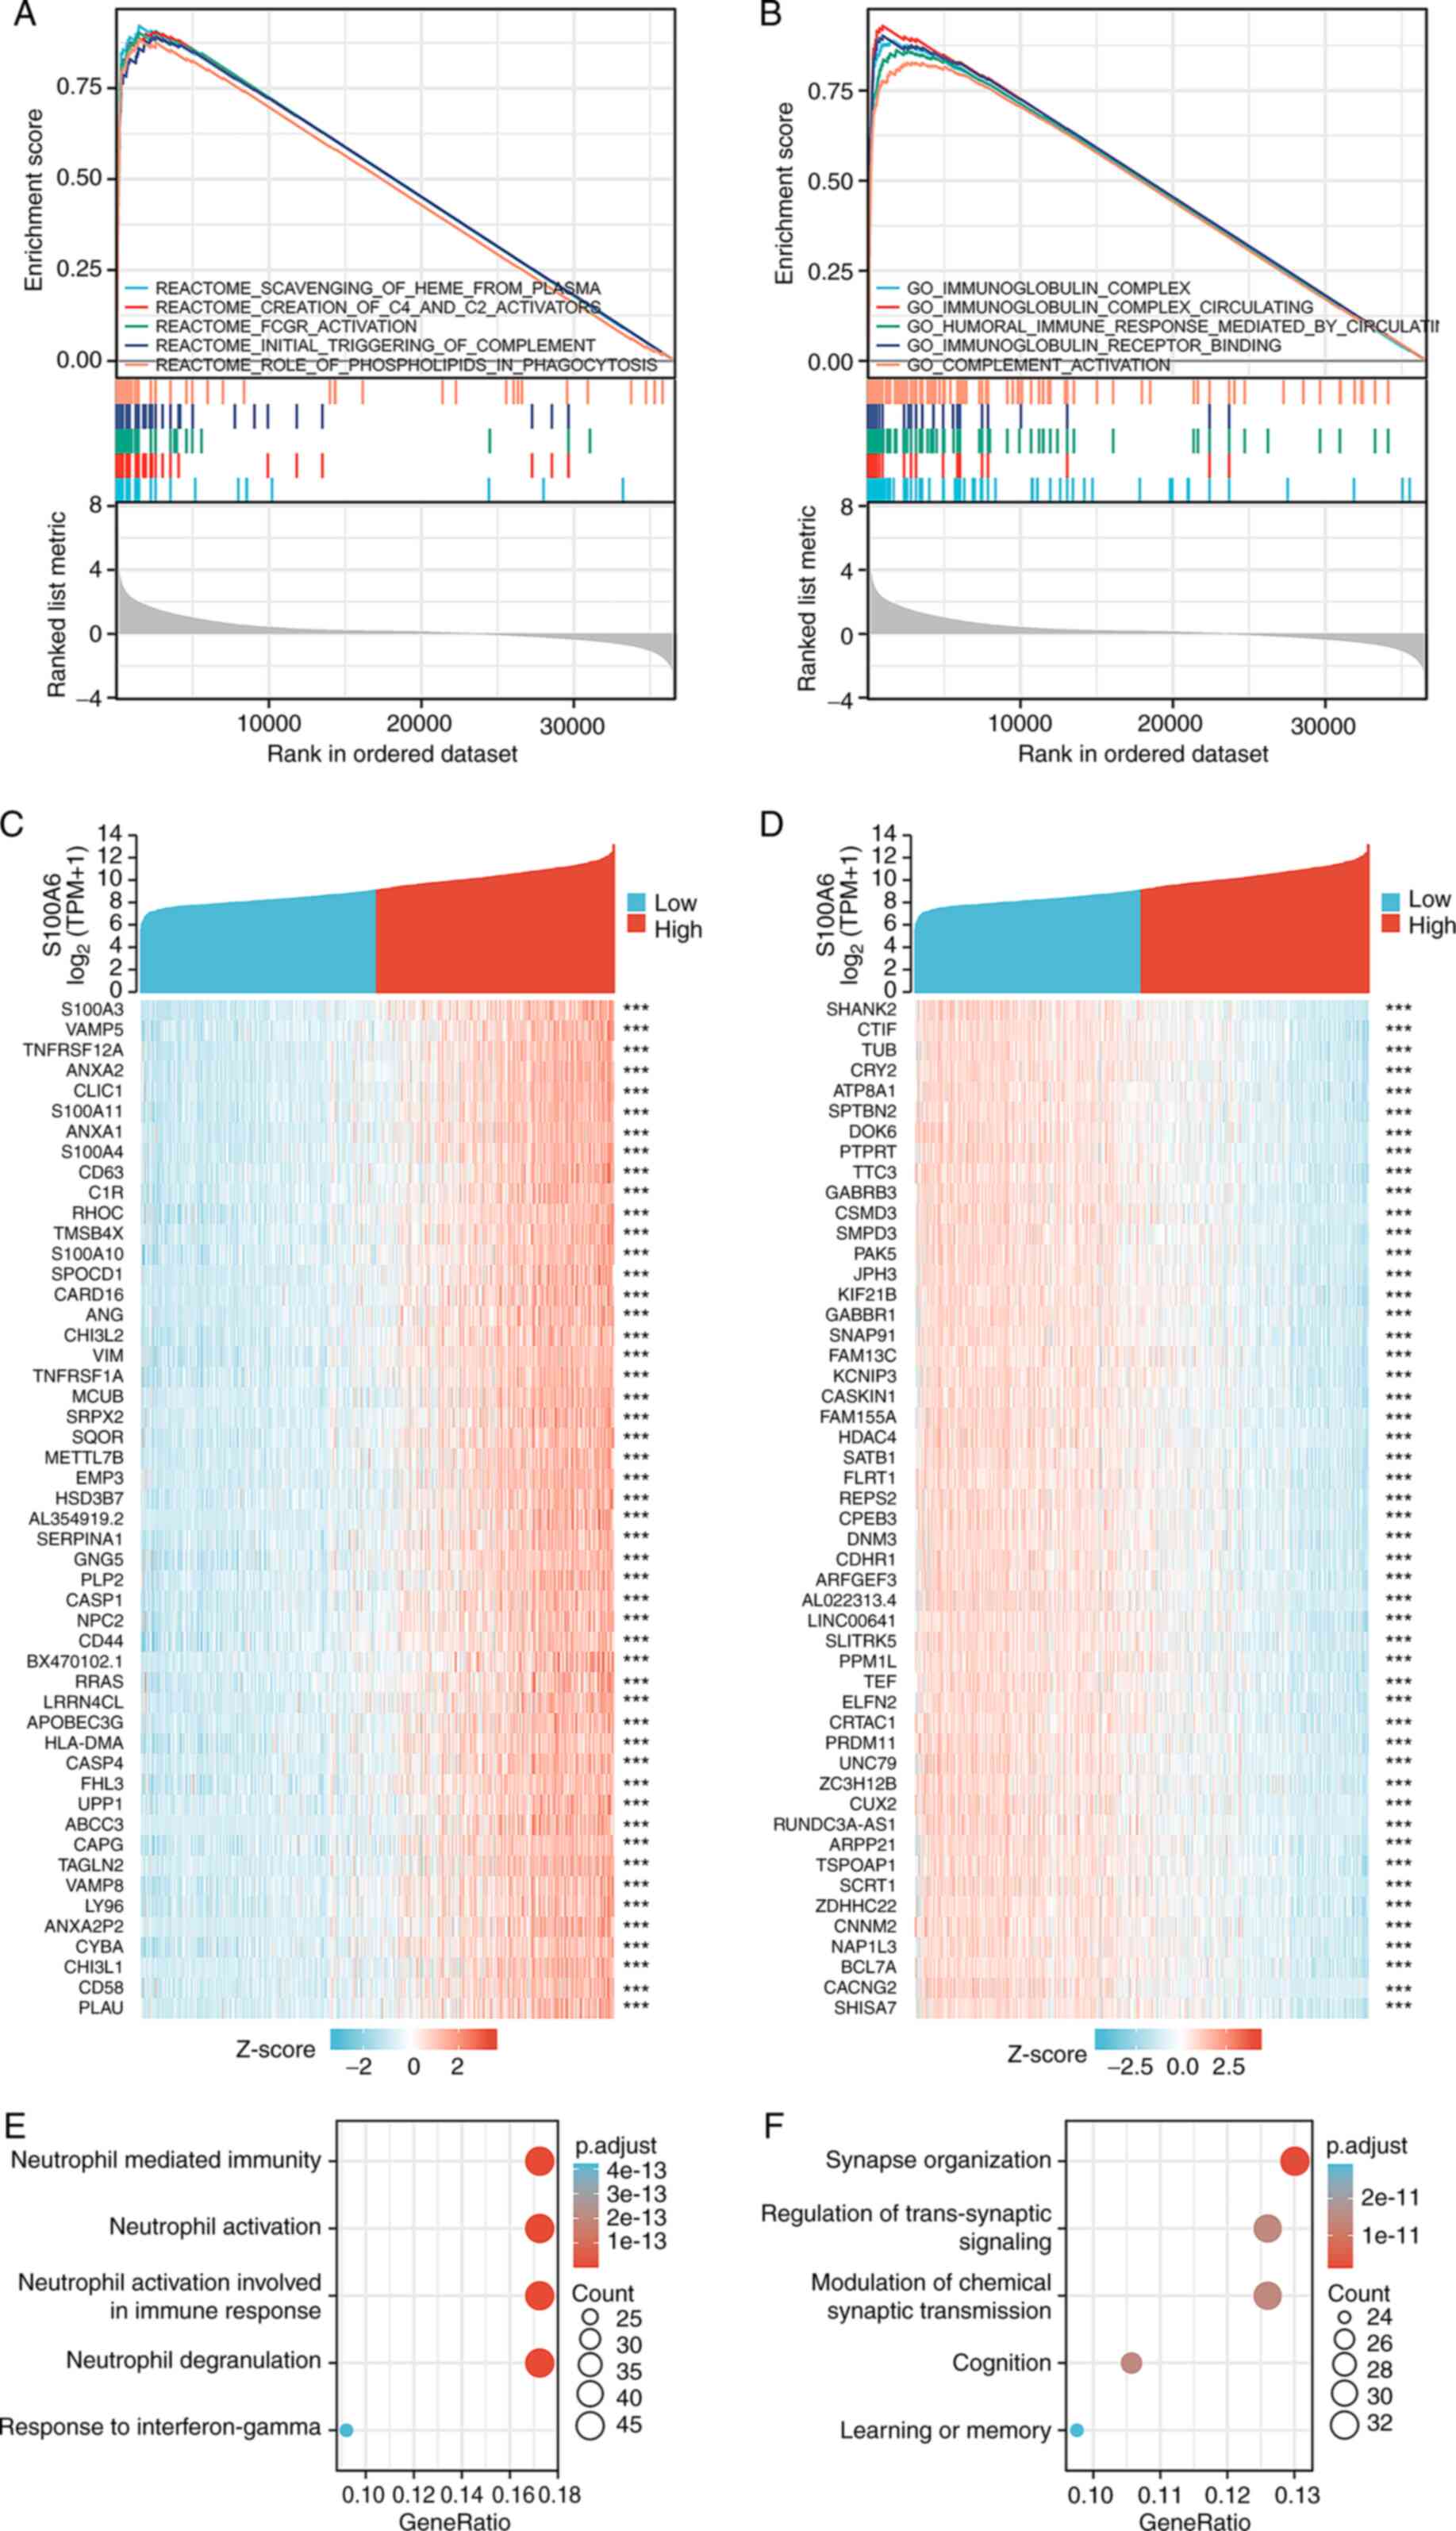
Using TCGA-derived data, GSEA was conducted to
investigate the mechanisms underlying the role of the S100A6 gene
in glioma. Enrichment data from the Molecular Signatures Database
was used to conduct Reactome enrichment analysis and GO enrichment
analysis of S100A6 gene expression samples. Reactome enrichment
analysis of S100A6 gene expression revealed the top five enriched
pathways based on their false discovery rate, normalized enrichment
score and P-values: Scavenging of plasma heme; creation of C2 and
C4 activators; Fc gamma receptor activation; initial triggering of
complement; and role of phospholipids in phagocytosis (Fig. 5A; Table
SIV). Furthermore, the five most enriched GO terms associated
with S100A6 gene expression were as follows: Immunoglobulin
complex; circulating immunoglobulin complex; humoral immune
response mediated by circulating immunoglobulin; immunoglobulin
receptor binding; and complement activation (Fig. 5B; Table
SIV).
KEGG and GO enrichment analyses of
S100A6 expression-associated genes in glioma
Link analysis of S100A with all other mRNAs in
glioblastoma was performed using TCGA-derived data to elucidate the
activities and pathways affected by S100A in glioma. The top 300
genes that exhibited the strongest positive and negative links with
S100A6 were enriched. Fig. 5C and D
demonstrates the outcomes of these analyses for the top-ranked
genes.
Using the clusterProfiler R tool, the potential
functional pathways of S100A6 based on the top 300 genes were
elucidated. GO functional enrichment analysis revealed that S100A6
was primarily and positively associated with neutrophil-mediated
immunity, neutrophil activation, neutrophil activation involved in
immune response, neutrophil degranulation and response to
interferon-γ (Fig. 5E). On the
other hand, S100A6 was primarily and negatively associated with
synapse organisation, regulation of trans-synaptic signalling,
modulation of chemical synaptic transmission, cognition and
learning or memory (Fig. 5F).
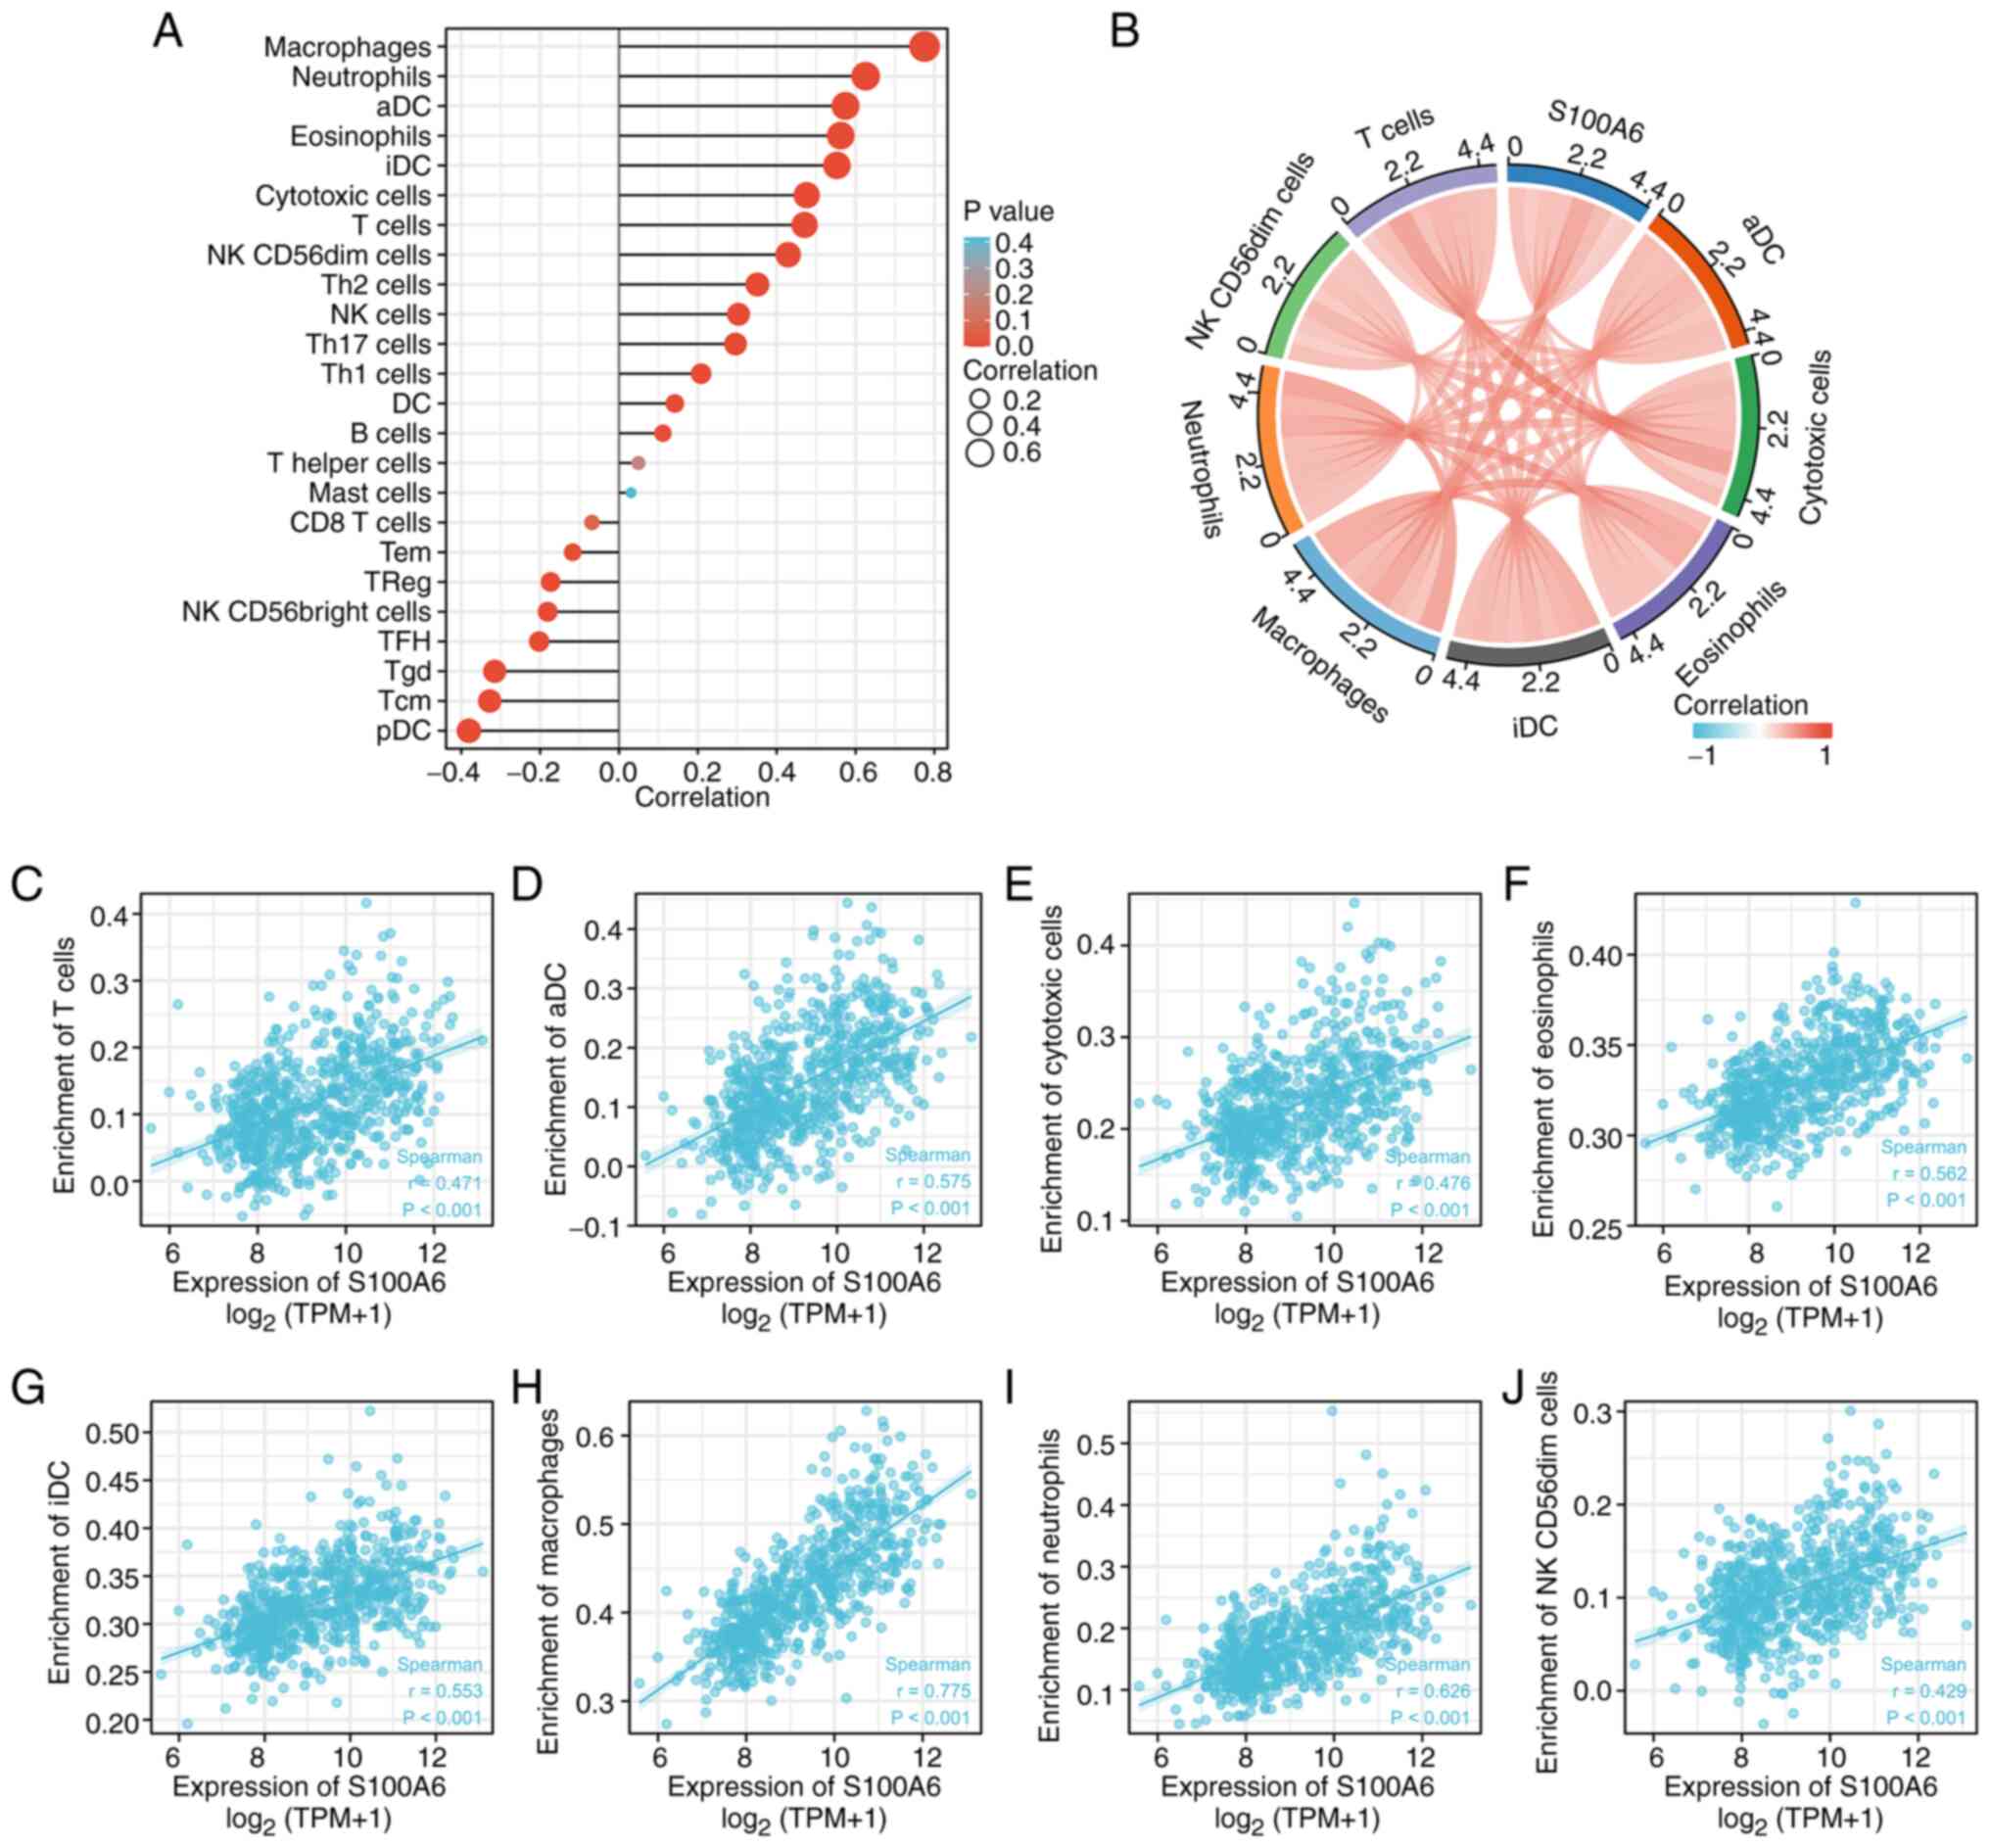
S100A6 gene expression and immune cell
infiltration
The immune infiltration algorithm (ssGSEA) and
Spearman's correlation were used to determine the relationship
between S100A6 expression patterns and invading immune cell subsets
using TCGA-derived data of patients with glioma (Fig. 6A). S100A6 expression was positively
associated with eosinophils (P<0.001), macrophages (P<0.01),
neutrophils (P<0.001), activated dendritic cell (P<0.001),
interstitial dendritic cells (P<0.001), cytotoxic cells
(P<0.001), T cells (P<0.001) and natural killer
CD56dim cells (P<0.001) (immune cells with r>0.4
and P<0.003 selected for description) (Fig. 6B-J). Therefore, elevated S100A6
expression is associated with the intertumoral accumulation of
macrophages and neutrophils. These findings suggest an association
between the immune state of gliomas and increased S100A6
expression.
Statistical association between S100A6
and the clinicopathological characteristics of patients with glioma
in a clinical cohort
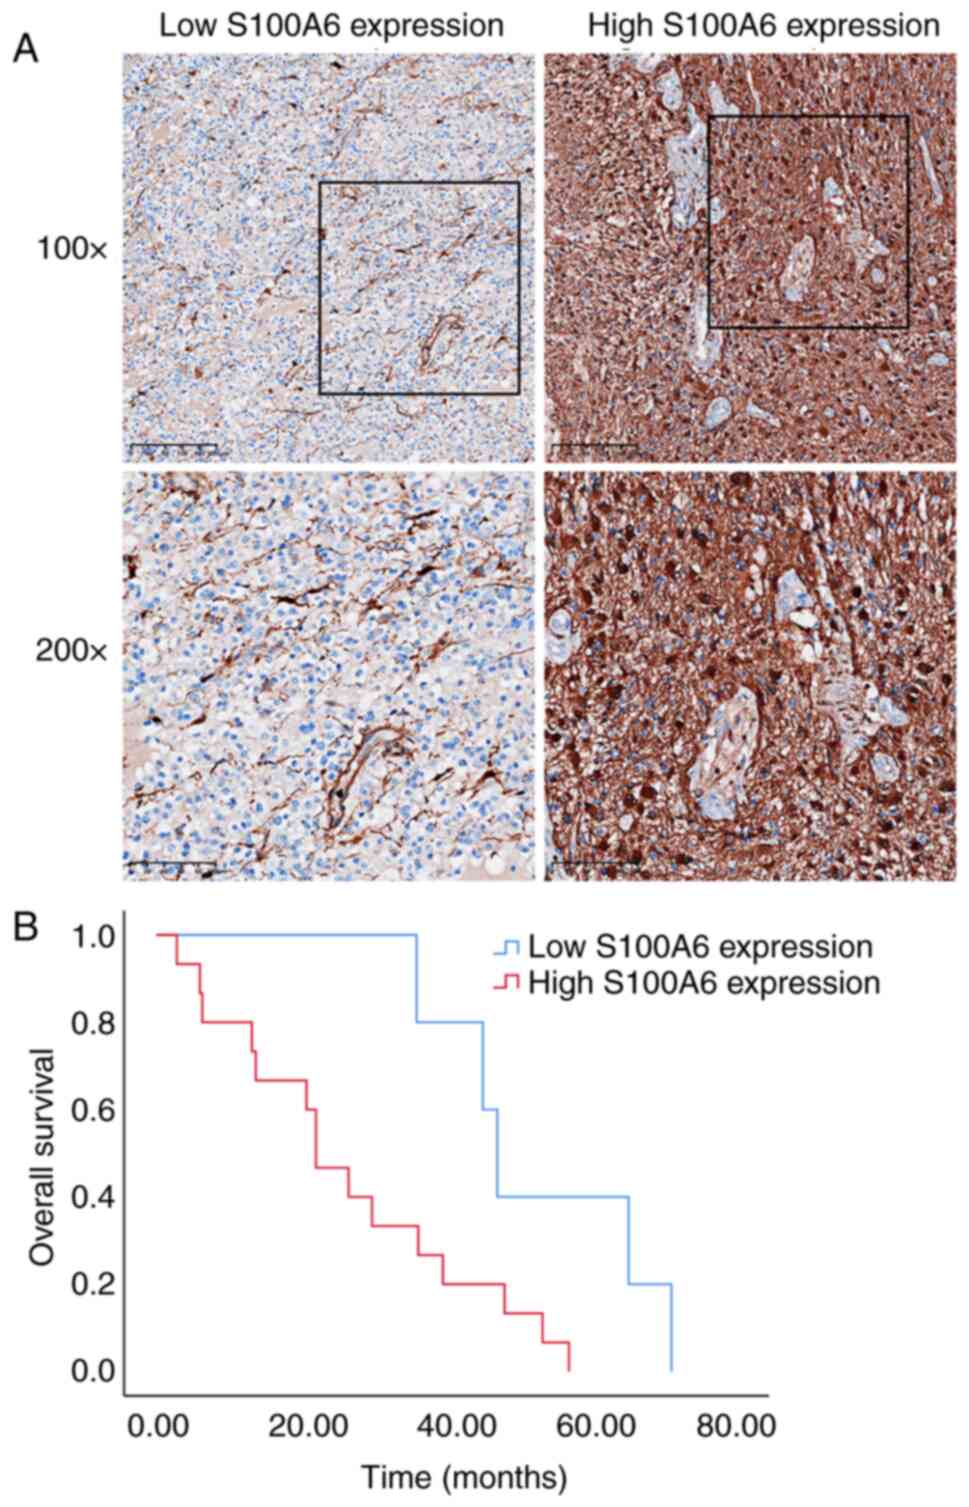
In most glioma cases, the S100A6 protein was
diffusely expressed in the tumour cell membrane and/or cytoplasm
(Fig. 7A). Table I presents the association between
the clinicopathological characteristics of 43 patients with glioma
and their S100A6 protein levels. Patients with high S100A6
expression had fewer IDH mutations, fewer 1p/19q chromosomal
deletions and worse survival (P<0.05). To some extent, these
data suggest that enhanced S100A6 expression is associated with
tumour progression and that S100A6 performs a critical function in
glioma prognosis.
 | Table I.Association between
clinicopathological features and S100A6 expression in glioma
patients. |
Table I.
Association between
clinicopathological features and S100A6 expression in glioma
patients.
| Characteristic | Low expression of
S100A6 | High expression of
S100A6 | P-value | S100A6 expression
scores, mean ± standard deviation | t | P-value |
|---|
| Number of
patients | 13 | 30 | - |
|
|
|
| World Health
Organization grade, n (%) |
|
|
|
|
|
|
| G1 +
G2 | 4 (9.30) | 5 (11.63) | 0.417b | 6.89±3.95 | 0.584 | 0.336 |
| G3 +
G4 | 9 (20.93) | 25 (58.14) |
| 6.26±3.48 |
|
|
| Isocitrate
dehydrogenase status, n (%) |
|
|
|
|
|
|
| Wild
type | 1 (2.33) | 16 (37.21) | 0.006a | 7.82±3.47 | 2.484 | 0.017 |
|
Mutant | 12 (27.91) | 14 (32.56) |
| 5.27±3.18 |
|
|
| 1p/19q codeletion,
n (%) |
|
|
|
|
|
|
|
Codel | 10 (23.26) | 9 (20.93) | 0.007a | 5.00±3.45 | 2.235 | 0.031 |
|
Non-codel | 3 (6.98) | 21 (48.84) |
| 7.29±3.25 |
|
|
| Years of age, n
(%) |
|
|
|
|
|
|
|
≤60 | 13 (30.23) | 20 (46.51) | 0.020b | 5.88±3.48 | 1.379 | 0.175 |
|
>60 | 0 | 10 (23.26) |
| 7.60±3.37 |
|
|
| Sex, n (%) |
|
|
|
|
|
|
|
Female | 6 (13.95) | 14 (32.56) | 1.000a | 6.70±3.73 | 0.733 | 0.468 |
|
Male | 7 (16.28) | 16 (37.21) |
| 5.91±3.32 |
|
|
| Overall survival
event, n (%) |
|
|
|
|
|
|
|
Alive | 8 (18.60) | 8 (18.60) | 0.043b | 4.88±2.87 | 2.11 | 0.041 |
|
Dead | 5 (11.63) | 22 (51.16) |
| 7.11±3.61 |
|
|
| Median age
(interquartile range), years | 48 (44–52) | 51.5
(34.5–62.25) | 0.339c |
|
|
|
S100A6 protein level and its
prognostic significance
The resection date was the starting point for
patient follow-up, which continued till October 2022. The date at
which survival or death was definitively established was considered
the end of OS. The predictive value of S100A6 was determined via KM
survival analysis. Fig. 7B
demonstrates that the expression profile of the S100A6 protein was
correlated with the prognosis of patients with glioma. Furthermore,
increased S100A6 levels were associated with decreased OS compared
with that in patients with decreased S100A6 levels (P<0.05). The
Cox proportional hazard ratio model was used to investigate the
potential predictors of OS in patients with glioma. The univariate
analysis confirmed that age, WHO stage, IDH mutation, 1p/19q
deletion and S100A6 expression were prognostic factors for glioma
(Table II). These data suggest
that the dismal prognosis of patients with glioma can be predicted
by increased S100A6 expression in glioma tissue. This finding may
motivate the development of novel therapeutic approaches.
| Table II.Univariate analysis of OS. |
Table II.
Univariate analysis of OS.
| Characteristic | Cases, n | Median survival (±
standard deviation), months | 95% CI, months | P-value |
|---|
| Age, years |
|
|
|
|
|
≤60 | 14 | 36.10±8.54 | 19.36–52.84 | 0.007 |
|
>60 | 6 | 13.17±4.51 | 4.32–22.02 |
|
| Sex |
|
|
|
|
|
Female | 11 | 39.50±13.76 | 12.53–66.47 | 0.147 |
|
Male | 9 | 29.73±11.52 | 7.15–52.32 |
|
| WHO grade |
|
|
|
|
| G2 | 2 | 45.00 |
| 0.001 |
| G3 | 7 | 48.00±1.31 | 45.43–50.57 |
|
| G4 | 11 | 22.00±4.70 | 12.80–31.20 |
|
| IDH status |
|
|
|
|
| Wild
type | 9 | 22.00±12.37 | 0.00–46.25 | 0.003 |
|
Mutant | 11 | 47.00±6.68 | 33.91–60.09 |
|
| 1p/19q
codeletion |
|
|
|
|
|
Codel | 9 | 47.00±2.98 | 41.16–52.84 | 0.044 |
|
Non-codel | 11 | 22.00±4.41 | 13.35–30.65 |
|
| S100A6
expression |
|
|
|
|
|
High | 15 | 22.00±3.74 | 14.68–29.32 | 0.030 |
|
Low | 5 | 47.00±2.19 | 42.71–51.29 |
|
Discussion
Glioma is an extremely aggressive type of brain
tumour with poor responses to standard cancer treatment regimens
owing to its diffuse infiltration (27). Although there have been advances in
the last two decades in understanding glioma pathophysiology and
conventional treatment, most patients have succumbed to this tumour
within 2 years of diagnosis owing to recurrence and drug resistance
(30). Furthermore, the presence of
molecular heterogeneity and different tumour microenvironments
(TMEs) within gliomas markedly affects patient prognosis and
treatment response. Glioma cells actively interact with surrounding
healthy cells and the immune milieu, thereby promoting tumour onset
and progression (31). Innovative
strategies to detect and treat gliomas can be derived by
identifying critical molecules that communicate with the
surrounding microenvironment or are implicated in TME
formation.
The S100A6 protein belongs to group A of the
calcium-binding S100 protein family. It is an intracellular protein
and is associated with the modulation of several cellular
activities, including proliferation, apoptosis, cytoskeleton
dynamics and cellular responses to various stress factors (32). S100A6 and its ligands are widely
expressed in neurons and astrocytes and may promote
neuropathological progression when their expression is altered
(32). Inhibition of its expression
can be a new therapeutic approach for treating gliomas. Notably,
S100A6 enhances the proliferation, migration, invasiveness and
adhesion of malignant cells in breast, gastric, pancreatic and
colon cancers (33,34) and is correlated with patient
prognosis (35). In the present
study, by analysing TCGA data, the present authors noted that
S100A6 expression was remarkably increased in glioma tissues
compared with that in normal tissues. ROC diagnostic curves
directly revealed that S100A6 can identify gliomas, thereby
highlighting its diagnostic significance. As it is well known, IDH,
as a recognized diagnostic marker for glioma, has excellent
diagnostic efficacy (9).
Meta-analysis showed that the AUC of IDH in the validation set can
reach 0.89 (36). By contrast, as a
new diagnostic marker, the diagnostic efficacy of s100A6 is still
acceptable.
In addition, S100A6 expression exhibited a strong
positive association with WHO grading, pathological stage and
molecular markers such as IDH status and 1p/19q codeletion; this
finding indicates that S100A6 is closely associated with
tumorigenesis and progression, which was verified in clinical
glioma samples. In gliomas, the presence of both 1p/19q codeletion
and IDH mutations suggests a good prognosis and increased
sensitivity to radiotherapy and chemotherapy (37,38).
Based on these findings, we hypothesized that S100A6 can be used as
an indicator for tumour staging in gliomas. Moreover, it was
observed that patients with low S100A6 expression had a longer
survival time than those with high expression. In addition, S100A6
independently functions as a risk predictor of OS in patients with
glioma. Using a nomogram, the complex Cox regression model was
transformed into a visual graph, increasing the readability of the
results of the prediction model; it intuitively revealed the
contribution of four factors, namely S100A6 expression, primary
treatment outcomes, IDH status and WHO grade, in predicting patient
prognosis and facilitated the clinical evaluation and prognosis
management of patients with glioma. Therefore, taken together, the
present findings suggest that S100A6 serves as a novel biomarker
for the unfavourable prognosis of patients with glioma. Although
nomograms can be used to assist decision-making, they also have
certain limitations, such as being challenging in conveying
relevant concepts to patients and the high theoretical nature of
nomograms not fully representing good clinical effects. Therefore,
it is necessary to have a comprehensive understanding of clinical
issues and improve the performance of the nomogram to improve its
application in the clinical decision-making process.
Analyses of the DEGs and expression-related gene
enrichment of S100A6 in patients with glioma in the TCGA database
revealed that S100A6 is primarily involved in immune responses,
particularly in the activation of neutrophils and
neutrophil-mediated immunity. Previous studies reported that the
S100 family proteins can promote the migration and chemotaxis of
immune cells and release several inflammatory cytokines and
regulate inflammation and immune responses (11). In addition, S100A6 is generally
detected at inflammatory sites (39). Tong et al (40) confirmed that S100A6 can induce in
vitro inflammation by activating Kupffer cells, resulting in
liver damage. Therefore, we hypothesize that the immune regulatory
effect of S100A6 is an essential factor affecting glioma
progression. Furthermore, enrichment analysis revealed that S100A6
is related to chemical signal transmission and intercellular
communication. In general, S100A6 plays an extracellular or
intracellular role by interacting with binding or target proteins
and activating downstream signalling pathways. Previous studies
reported that S100A6 overexpression can increase β-catenin
expression and nuclear translocation (13,15,31–41).
β-Catenin is a key mediator involved in the canonical Wnt
signalling pathway and transcriptional regulation of several genes
(42). S100A6 can promote tumour
cell growth and migration by activating extracellular regulated
protein kinases 1/2 and p38/MAPKs in colorectal cancer. Another
study suggested that S100A6 promotes nasopharyngeal carcinoma
development by activating the p38/MAPK signalling pathway.
Therefore, S100A6, a key mediator of signal transduction in
tumours, may play a vital role in glioma occurrence and
progression. In the future, the signalling pathways involved and
specific mechanisms underlying S100A6 in glioma will be
explored.
The tumour immune microenvironment is a critical
factor associated with cancer onset and progression (43,44).
Stromal cells in the TME and immune cells directly or indirectly
affect the TME and regulate tumour cell behaviour. The TME has
exerted a remarkable effect in clinical settings by facilitating
the accurate anticipation of the prognosis and treatment response
of patients with cancer (45,46).
In the present study, increased S100A6 expression was significantly
correlated with immune cell infiltration in the TME of patients
with glioma. Compared with other tumour types, the TME of glioma is
abundant in macrophages; these macrophages are generally polarized
into tumour-supporting and immunosuppressive phenotypes (47); these macrophage phenotypes can
promote tumour cell bioactivity by releasing growth factors and
cytokines (48,49) and correlate with the
immunosuppressive phenotype of the TME (50). The present study found a positive
association between S100A6 expression in glioma and macrophages,
suggesting the role of S100A6 in the formation of a
tumour-suppressive immune microenvironment in glioma. Chronic
inflammation in the brain may induce mitochondrial dysfunction in
gliomas and inhibit glioma cell apoptosis, thereby promoting tumour
progression (27). Furthermore,
tumour cells can evade the immune system by promoting ligand
shedding of NK cell-activating receptors, upregulating the
expression of inhibitory receptor ligands (51) and inhibiting the maturation of
antigen-presenting cells (52).
S100A6 expression in glioma was proven to be associated with the
number of macrophages and other inflammatory cells in the tumour.
S100A6 can significantly contribute to the modulation of tumour
immunity and can be implicated in the formation of an
immunosuppressive microenvironment in gliomas, which, in turn,
promotes tumour growth.
Compared with the study of Zhang et al
(20), both the present study and
their study explored the expression, functional enrichment and
relationship with immune cell infiltration of S100A6 in glioma.
Nevertheless, the present study has a certain degree of innovation.
Compared with others, the present study effectively verified the
clinical significance of S100A6 in a small glioma cohort, explored
the correlation between S100A6 protein levels and
clinicopathological features and confirmed the clinical diagnostic
value of S100A6 in distinguishing low- and high-grade gliomas. In
addition, in the present study, the follow-up period was ~60
months. The present study obtained the complete survival data of
patients and confirmed that S100A6 has a relatively stable
prognostic significance in the clinical cohort. Therefore, the
present study provides a good reference value and practical
significance for promoting S100A6 as an effective molecular marker
for glioma and the clinical management of patients with glioma in
the future. However, the present study has some limitations. First,
empirical data accessible in the public databases were lacking and
contaminated tissues may have resulted in biased outcomes. Second,
owing to the availability of a limited number of clinical samples,
adequate clinical evidence could not be provided to fully confirm
that S100A6 is an independent predictive factor for glioma; this
should be validated in future clinical trials.
In summary, the present study found that enhanced
expression of the S100A6 gene is linked to the unfavorable OS in
glioma patients. We hypothesized that S100A6 would be useful as
both a prognostic biological marker and as an indicator in the
diagnosis of glioma. The present findings revealed novel
perspectives that may improve the detection and treatment of glioma
patients.
Supplementary Material
Supporting Data
Acknowledgements
Not applicable.
Funding
The present work was supported by the National Natural Science
Foundation of China (grant no. 81802081).
Authors' contributions
BH drafted the manuscript and carried out the IHC
staining experiments. HZ, YX, and LS analyzed and interpreted the
data. YQ and BH designed the study. YQ and BH confirm the
authenticity of all the raw data. All authors read and approved the
final version of the manuscript.
Availability of data and materials
The datasets used and/or analyzed during the current
study are available from the corresponding author on reasonable
request.
Ethics approval and consent to
participate
Ethical approval was received for the study by the
Clinical Research Ethics Committee of The Second Affiliated
Hospital, Zhejiang University School of Medicine (approval no.
2021-0641; Hangzhou, China). Informed consent was waived by the
Clinical Research Ethics Committee of The Second Affiliated
Hospital, Zhejiang University School of Medicine. All methods were
carried out in accordance with relevant guidelines and
regulations.
Patient consent for publication
Not applicable.
Competing interests
The authors declare that they have no competing
interests.
References
|
1
|
Ostrom QT, Price M, Neff C, Cioffi G,
Waite KA, Kruchko C and Barnholtz-Sloan JS: CBTRUS statistical
report: Primary brain and other central nervous system tumors
diagnosed in the United States in 2015–2019. Neuro Oncol. 24 (Suppl
5):S1–S95. 2022. View Article : Google Scholar
|
|
2
|
Wesseling P and Capper D: WHO 2016
classification of gliomas. Neuropathol Appl Neurobiol. 44:139–150.
2018. View Article : Google Scholar : PubMed/NCBI
|
|
3
|
Xu S, Tang L, Li X, Fan F and Liu Z:
Immunotherapy for glioma: Current management and future
application. Cancer Letters. 476:1–12. 2020. View Article : Google Scholar : PubMed/NCBI
|
|
4
|
Wen J, Chen W, Zhu Y and Zhang P: Clinical
features associated with the efficacy of chemotherapy in patients
with glioblastoma (GBM): A surveillance, epidemiology, and end
results (SEER) analysis. BMC Cancer. 21:812021. View Article : Google Scholar : PubMed/NCBI
|
|
5
|
Tan AC, Ashley DM, López GY, Malinzak M,
Friedman HS and Khasraw M: Management of glioblastoma: State of the
art and future directions. CA Cancer J Clin. 70:299–312. 2020.
View Article : Google Scholar : PubMed/NCBI
|
|
6
|
Ramón Y, Cajal S, Sesé M, Capdevila C,
Aasen T, De Mattos-Arruda L, Diaz-Cano SJ, Hernández-Losa J and
Castellví J: Clinical implications of intratumor heterogeneity:
Challenges and opportunities. J Mol Med (Berl). 98:161–177. 2020.
View Article : Google Scholar
|
|
7
|
Binder DC, Ladomersky E, Lenzen A, Zhai L,
Lauing KL, Otto-Meyer SD, Lukas RV and Wainwright DA: Lessons
learned from rindopepimut treatment in patients with
EGFRvIII-expressing glioblastoma. Transl Cancer Res. 7 (Suppl
4):S510–S513. 2018. View Article : Google Scholar : PubMed/NCBI
|
|
8
|
Wick W, Gorlia T, Bendszus M, Taphoorn M,
Sahm F, Harting I, Brandes AA, Taal W, Domont J, Idbaih A, et al:
Lomustine and bevacizumab in progressive glioblastoma. N Engl J
Med. 377:1954–1963. 2017. View Article : Google Scholar : PubMed/NCBI
|
|
9
|
de la Fuente MI, Colman H, Rosenthal M,
Van Tine BA, Levacic D, Walbert T, Gan HK, Vieito M, Milhem MM,
Lipford K, et al: Olutasidenib (FT-2102) in patients with relapsed
or refractory IDH1-mutant glioma: A multicenter, open-label, phase
Ib/II trial. Neuro Oncol. 25:146–156. 2023. View Article : Google Scholar : PubMed/NCBI
|
|
10
|
Bale TA and Rosenblum MK: The 2021 WHO
classification of tumors of the central nervous system: An update
on pediatric low-grade gliomas and glioneuronal tumors. Brain
Pathol. 32:e130602022. View Article : Google Scholar : PubMed/NCBI
|
|
11
|
Gonzalez LL, Garrie K and Turner MD: Role
of S100 proteins in health and disease. Biochim Biophys Acta Mol
Cell Res. 1867:1186772020. View Article : Google Scholar : PubMed/NCBI
|
|
12
|
Li Z, Tang M, Ling B, Liu S, Zheng Y, Nie
C, Yuan Z, Zhou L, Guo G, Tong A and Wei Y: Increased expression of
S100A6 promotes cell proliferation and migration in human
hepatocellular carcinoma. J Mol Med (Berl). 92:291–303. 2014.
View Article : Google Scholar : PubMed/NCBI
|
|
13
|
Li Y, Wagner ER, Yan Z, Wang Z, Luther G,
Jiang W, Ye J, Wei Q, Wang J, Zhao L, et al: The calcium-binding
protein S100A6 accelerates human osteosarcoma growth by promoting
cell proliferation and inhibiting osteogenic differentiation. Cell
Physiol Biochem. 37:2375–2392. 2015. View Article : Google Scholar : PubMed/NCBI
|
|
14
|
Chen X, Liu X, Lang H, Zhang S, Luo Y and
Zhang J: S100 calcium-binding protein A6 promotes
epithelial-mesenchymal transition through β-catenin in pancreatic
cancer cell line. PLoS One. 10:e01213192015. View Article : Google Scholar : PubMed/NCBI
|
|
15
|
Wang XH, Zhang LH, Zhong XY, Xing XF, Liu
YQ, Niu ZJ, Peng Y, Du H, Zhang GG, Hu Y, et al: S100A6
overexpression is associated with poor prognosis and is
epigenetically up-regulated in gastric cancer. Am J Pathol.
177:586–597. 2010. View Article : Google Scholar : PubMed/NCBI
|
|
16
|
Li L, Pan Y, Mo X, Wei T, Song J, Luo M,
Huang G, Teng C, Liang K, Mao N and Yang J: A novel metastatic
promoter CEMIP and its downstream molecular targets and signaling
pathway of cellular migration and invasion in SCLC cells based on
proteome analysis. J Cancer Res Clin Oncol. 146:2519–2534. 2020.
View Article : Google Scholar : PubMed/NCBI
|
|
17
|
Camby I, Nagy N, Lopes MB, Schäfer BW,
Maurage CA, Ruchoux MM, Murmann P, Pochet R, Heizmann CW, Brotchi
J, et al: Supratentorial pilocytic astrocytomas, astrocytomas,
anaplastic astrocytomas and glioblastomas are characterized by a
differential expression of S100 proteins. Brain Pathol. 9:1–19.
1999. View Article : Google Scholar : PubMed/NCBI
|
|
18
|
Camby I, Lefranc F, Titeca G, Neuci S,
Fastrez M, Dedecken L, Schäfer BW, Brotchi J, Heizmann CW, Pochet
R, et al: Differential expression of S100 calcium-binding proteins
characterizes distinct clinical entities in both WHO grade II and
III astrocytic tumours. Neuropathol Appl Neurobiol. 26:76–90. 2000.
View Article : Google Scholar : PubMed/NCBI
|
|
19
|
Kucharczak J, Pannequin J, Camby I,
Decaestecker C, Kiss R and Martinez J: Gastrin induces
over-expression of genes involved in human U373 glioblastoma cell
migration. Oncogene. 20:7021–7028. 2001. View Article : Google Scholar : PubMed/NCBI
|
|
20
|
Zhang Y, Yang X, Zhu XL, Bai H, Wang ZZ,
Zhang JJ, Hao CY and Duan HB: S100A gene family: Immune-related
prognostic biomarkers and therapeutic targets for low-grade glioma.
Aging (Albany NY). 13:15459–15478. 2021. View Article : Google Scholar : PubMed/NCBI
|
|
21
|
Blum A, Wang P and Zenklusen JC: SnapShot:
TCGA-analyzed tumors. Cell. 173:5302018. View Article : Google Scholar : PubMed/NCBI
|
|
22
|
Chin L, Hahn WC, Getz G and Meyerson M:
Making sense of cancer genomic data. Genes Dev. 25:534–555. 2011.
View Article : Google Scholar : PubMed/NCBI
|
|
23
|
Grossman RL, Heath AP, Ferretti V, Varmus
HE, Lowy DR, Kibbe WA and Staudt LM: Toward a shared vision for
cancer genomic data. N Engl J Med. 75:1109–1112. 2016. View Article : Google Scholar
|
|
24
|
Ceccarelli M, Barthel FP, Malta TM,
Sabedot TS, Salama SR, Murray BA, Morozova O, Newton Y, Radenbaugh
A, Pagnotta SM, et al: Molecular profiling reveals biologically
discrete subsets and pathways of progression in diffuse glioma.
Cell. 164:550–663. 2016. View Article : Google Scholar : PubMed/NCBI
|
|
25
|
Love MI, Huber W and Anders S: Moderated
estimation of fold change and dispersion for RNA-seq data with
DESeq2. Genome Biol. 15:5502014. View Article : Google Scholar : PubMed/NCBI
|
|
26
|
Yan X, Hong B, Feng J, Jin Y, Chen M, Li F
and Qian Y: B7-H4 is a potential diagnostic and prognostic
biomarker in colorectal cancer and correlates with the
epithelial-mesenchymal transition. BMC Cancer. 22:10532022.
View Article : Google Scholar : PubMed/NCBI
|
|
27
|
Fan W, Song Y, Ren Z, Cheng X, Li P, Song
H and Jia L: Glioma cells are resistant to inflammation-induced
alterations of mitochondrial dynamics. Int J Oncol. 57:1293–1306.
2020. View Article : Google Scholar : PubMed/NCBI
|
|
28
|
Liu J, Lichtenberg T, Hoadley KA, Poisson
LM, Lazar AJ, Cherniack AD, Kovatich AJ, Benz CC, Levine DA, Lee
AV, et al: An integrated TCGA pan-cancer clinical data resource to
drive high-quality survival outcome analytics. Cell.
173:400–416.e411. 2018. View Article : Google Scholar : PubMed/NCBI
|
|
29
|
Yu CH: Evaluation of diagnostic test,
Medical statistics. Beijing: People's Medical Publishing House; pp.
164–178. 2002, (In Chinese).
|
|
30
|
Radin DP and Tsirka SE: Interactions
between tumor cells, neurons, and microglia in the glioma
microenvironment. Int J Mol Sci. 21:84762020. View Article : Google Scholar : PubMed/NCBI
|
|
31
|
Barthel L, Hadamitzky M, Dammann P,
Schedlowski M, Sure U, Thakur BK and Hetze S: Glioma: molecular
signature and crossroads with tumor microenvironment. Cancer
Metastasis Rev. 41:53–75. 2022. View Article : Google Scholar : PubMed/NCBI
|
|
32
|
Filipek A and Leśniak W: S100A6 and its
brain ligands in neurodegenerative disorders. Int J Mol Sci.
21:39792020. View Article : Google Scholar : PubMed/NCBI
|
|
33
|
Donato R, Sorci G and Giambanco I: S100a6
protein: functional roles. Cell Mol Life Sci. 74:2749–2760. 2017.
View Article : Google Scholar : PubMed/NCBI
|
|
34
|
Hua X, Zhang H, Jia J, Chen S, Sun Y and
Zhu X: Roles of S100 family members in drug resistance in tumors:
Status and prospects. BioMed Pharmacother. 127:1101562020.
View Article : Google Scholar : PubMed/NCBI
|
|
35
|
Hu Y, Zeng N, Ge Y, Wang D, Qin X, Zhang
W, Jiang F and Liu Y: Identification of the shared gene signatures
and biological mechanism in type 2 diabetes and pancreatic cancer.
Front Endocrinol (Lausanne). 13:8477602022. View Article : Google Scholar : PubMed/NCBI
|
|
36
|
Zhao J, Huang Y, Song Y, Xie D, Hu M, Qiu
H and Chu J: Diagnostic accuracy and potential covariates for
machine learning to identify IDH mutations in glioma patients:
Evidence from a meta-analysis. Eur Radiol. 30:4664–4674. 2020.
View Article : Google Scholar : PubMed/NCBI
|
|
37
|
Ghouzlani A, Kandoussi S, Tall M, Reddy
KP, Rafii S and Badou A: Immune checkpoint inhibitors in human
glioma microenvironment. Front Immunol. 12:6794252021. View Article : Google Scholar : PubMed/NCBI
|
|
38
|
Lapointe S, Perry A and Butowski NA:
Primary brain tumours in adults. Lancet. 392:432–446. 2018.
View Article : Google Scholar : PubMed/NCBI
|
|
39
|
Wirths O, Breyhan H, Marcello A, Cotel MC,
Bruck W and Bayer TA: Inflammatory changes are tightly associated
with neurodegeneration in the brain and spinal cord of the
APP/PS1KI mouse model of Alzheimer's disease. Neurobiol Aging.
31:747–757. 2010. View Article : Google Scholar : PubMed/NCBI
|
|
40
|
Tong H, Wang L, Zhang K, Shi J, Wu Y, Bao
Y and Wang C: Correction to: S100A6 activates kupffer cells via the
p-P38 and p-JNK pathways to induce inflammation,
mononuclear/macrophage infiltration sterile liver injury in mice.
Inflammation. 46:5552023. View Article : Google Scholar : PubMed/NCBI
|
|
41
|
Liu Z, Zhang X, Chen M, Cao Q and Huang D:
Effect of S100A6 over-expression on beta-catenin in endometriosis.
J Obstet Gynaecol Res. 41:1457–1462. 2015. View Article : Google Scholar : PubMed/NCBI
|
|
42
|
Rijsewijk F, van Deemter L, Wagenaar E,
Sonnenberg A and Nusse R: Transfection of the int-1 mammary
oncogene in cuboidal RAC mammary cell line results in morphological
transformation and tumorigenicity. EMBO J. 6:127–131. 1987.
View Article : Google Scholar : PubMed/NCBI
|
|
43
|
Deberardinis RJ: Tumor microenvironment,
metabolism, and immunotherapy. N Engl J Med. 382:869–871. 2020.
View Article : Google Scholar : PubMed/NCBI
|
|
44
|
Chen F, Song J, Ye Z, Xu B, Cheng H, Zhang
S and Sun X: Integrated analysis of cell cycle-related and
immunity-related biomarker signatures to improve the prognosis
prediction of lung adenocarcinoma. Front Oncol. 11:6668262021.
View Article : Google Scholar : PubMed/NCBI
|
|
45
|
Li C, Jiang P, Wei S, Xu X and Wang J:
Regulatory T cells in tumor microenvironment: New mechanisms,
potential therapeutic strategies and future prospects. Mol Cancer.
19:1162020. View Article : Google Scholar : PubMed/NCBI
|
|
46
|
Erin N, Grahovac J, Brozovic A and Efferth
T: Tumor microenvironment and epithelial mesenchymal transition as
targets to overcome tumor multidrug resistance. Drug Resist Update.
53:1007152020. View Article : Google Scholar : PubMed/NCBI
|
|
47
|
Wei J, Chen P, Gupta P, Ott M, Zamler D,
Kassab C, Bhat KP, Curran MA, de Groot JF and Heimberger AB: Immune
biology of glioma-associated macrophages and microglia: Functional
and therapeutic implications. Neuro Oncol. 22:180–194.
2020.PubMed/NCBI
|
|
48
|
Xia Y, Rao L, Yao H, Wang Z, Ning P and
Chen X: Engineering macrophages for cancer immunotherapy and drug
delivery. Adv Mater. 32:e20020542020. View Article : Google Scholar : PubMed/NCBI
|
|
49
|
Hambardzumyan D, Gutmann DH and Kettenmann
H: The role of microglia and macrophages in glioma maintenance and
progression. Nat Neurosci. 19:20–27. 2016. View Article : Google Scholar : PubMed/NCBI
|
|
50
|
Domingues P, González-Tablas M, Otero Á,
Pascual D, Miranda D, Ruiz L, Sousa P, Ciudad J, Gonçalves JM,
Lopes MC, et al: Tumor infiltrating immune cells in gliomas and
meningiomas. Brain Behav Immun. 53:1–15. 2016. View Article : Google Scholar : PubMed/NCBI
|
|
51
|
Di W, Fan W, Wu F, Shi Z, Wang Z, Yu M,
Zhai Y, Chang Y, Pan C, Li G, et al: Clinical characterization and
immunosuppressive regulation of CD161 (KLRB1) in glioma through 916
samples. Cancer Sci. 113:756–769. 2022. View Article : Google Scholar : PubMed/NCBI
|
|
52
|
Cho A, McKelvey KJ, Lee A and Hudson AL:
The intertwined fates of inflammation and coagulation in glioma.
Mamm Genome. 29:806–816. 2018. View Article : Google Scholar : PubMed/NCBI
|