Introduction
Metastasis is responsible for the high mortality
rate of patients with cancer (1).
Cancer cell migration and invasion are important steps in tumor
metastasis, which is a multistage process (2). Elucidation of the mechanisms
underlying cell migration and invasion will provide improved
understanding of the dynamics and complexity of tumor metastasis
and facilitate the development of novel clinical interventions for
patients with cancer (3).
Several studies have examined the proteins and
regulatory mechanisms involved in cell migration and invasion. For
example, heat shock factor 1 has been demonstrated to be involved
in the migration and invasion of human melanoma cells (4). In addition, it has been reported that
activated prostaglandin-endoperoxidase synthase 2/prostaglandin E2
contributes to the migration and invasion of U87 human glioblastoma
cells (5), while tumor necrosis
factor superfamily member 10 promotes the migration and invasion of
cholangiocarcinoma cells (6). Thus,
diverse proteins or mechanisms are involved in cell migration.
However, studies on these proteins or pathways are limited only to
certain types of tumors.
Previous studies have revealed that the tumor
microenvironment (TME) plays a crucial role in the regulation of
metastasis (7). The association
between cancer cell metabolism and metastasis has piqued the
interest of the scientific community (8). Metabolic reprogramming, which is a
hallmark of cancer metastasis, involves a global metabolic shift
toward increased glycolysis, known as the Warburg effect, to meet
the energy demands of tumor cells and the TME (9). The Warburg effect is reported to
promote tumor metastasis. Metastatic cancer cells experience
increased oxidative stress, and the Warburg effect helps to reduce
the oxidative stress in cancer cells via the inhibition of
mitochondrial oxidative metabolism, thereby promoting the spread of
metastases. Furthermore, the acidified TME, which develops due to
the secretion of lactate from the cancer cells, increases the
migratory and invasive activity of the cancer cells (10).
Most cancer cells rely on the Warburg effect for
energy generation, which is accompanied by the production of
increased quantities of lactate (11). Monocarboxylate transporter (MCT)
family members, particularly MCT4, which is encoded by the solute
carrier family 16 member 3 (SLC16A3) gene, are associated
with lactate export from cells (12). The expression of MCT4 is upregulated
in various tumor cells, including breast, lung, pancreatic, bladder
cancer and colorectal cancer cells (13–17).
Also, the upregulation of MCT4 expression is strongly associated
with a poor prognosis in patients with cancer (15–17).
In previous studies the knockdown of MCT4 expression
was shown to decrease the migration and invasion of lung cancer
(18), oral squamous cell carcinoma
(16), hepatocellular carcinoma
(19), pancreatic ductal
adenocarcinoma (20), prostate
cancer (21), glioma (22) and breast cancer cells (23). These studies involved the transient
silencing of MCT4 in various types of tumor cells and were mostly
limited to describing the decreased migration after MCT4 silencing.
Few studies have investigated the mechanism by which MCT4 promotes
cell migration, and the mechanism by which MCT4 promotes migration
has been found to vary, with inconsistency between different tumor
cell models. In our previous study, human MCT4 was expressed in
non-cancerous L929 cells via stable transfection and the
overexpression of MCT4 was demonstrated to promote the migration
and invasion of the non-cancerous L929 fibroblast cells (24). Notably, the homology of human and
mouse MCT4 proteins is as high as 88%. The present study used
transcriptomic sequencing and protein-protein interaction (PPI)
analysis of these cells to identify key differentially expressed
genes (DEGs) and key networks to elucidate the potential mechanisms
by which MCT4 promotes cell migration.
Analysis of the DEGs indicated that insulin-like
growth factor 1 (Igf1) was the most critical DEG. Therefore,
the function of IGF1 in MCT4-overexpressing L929 cells was also
investigated, and the potential mechanism by which MCT4 drives the
migration of non-cancerous L929 fibroblast cells was
identified.
Materials and methods
Cells and cell culture
L929 cells, which are non-cancerous murine cells
that do not express MCT4, were obtained from the American Type
Culture Collection (ATCC). L929 cell lines stably expressing human
MCT4 were constructed as previously described (24). The human SLC16A3 gene
sequence and enhanced green fluorescent protein (EGFP) gene
sequence were inserted into a pcDNA3.0 vector, and the plasmids
were transfected into host L929 cells by electroporation. Three
L929 cell lines with high MCT4 expression were selected (3E10, 4D11
and 8E4), and the transfected human MCT4 was confirmed to be active
in the murine L929 cells. Additionally, three L929 cell lines
expressing EGFP protein were chosen as control cell lines (C5, H9
and 2H6). These were generated using the same transfection and
screening protocol as was used to generate the MCT4-overexpressing
cells. In the following sections, L929 cells expressing MCT4 or
EGFP are referred to as MCT4-L929 or control-L929 cells,
respectively. The cells were cultured in CSC03-CL medium (cat. no.
Y3020; Zhejiang Yishengke Biotechnology Co., Ltd.) supplemented
with 10% fetal bovine serum (FBS; Gibco; Thermo Fisher Scientific,
Inc.) and 600 µg/ml G418 (cat. no. G15000; Vazyme Biotech Co.,
Ltd.) at 37°C in an atmosphere containing 5% CO2. Cell
counts and viability were measured using an automated cell counter
(Shanghai Ruiyu Biotech Co., Ltd.) with trypan blue staining (cat.
no. 93595; Sigma-Aldrich; Merck KGaA).
RNA sequencing (RNA-seq)
The three control-L929 cell lines (C5, H9 and 2H6)
and three MCT4-L929 cell lines (3E10, 4D11 and 8E4) were subjected
to RNA-seq using an Illumina platform. Total RNA was isolated using
TRIzol (cat. no. 15596026, Invitrogen). Library preparation and
sequencing were performed at Shanghai Personal Biotechnology Co,
Ltd (Shanghai, China). The mixed library was diluted to 2 nM and
then denatured by alkali to create a single-stranded library. The
paired-end method was used with 150 base pairs for each end length.
HISTAT2 (version 2.2.1, ccb.jhu.edu/software/hisat2/index.shtml)
was used to map the reads to the
Mus_musculus.GRCm38.dna.primary_assembly.fa.gz genome. The
transcriptome coverage was in the range of 93.43–94.98%. The
quality of the data is assessed based on factors including the Q20
ratio (the ratio of bases whose base recognition accuracy is over
99%), the Q30 ratio (the ratio of bases whose base recognition
accuracy is over 99.9%), the Total_Mapped ratio (the ratio of total
number of sequences of the reference genome on the alignment out of
all clean reads), and Uniquely_Mapped ratio (the ratio of sequences
aligned to only one position on the reference genome out of
Total_Mapped). DEGs between the control-L929 and MCT4-L929 cells
were identified based on the following criteria: |log2
fold change (FC)|>1 and P<0.05.
Bioinformatics
Gene Ontology (GO: geneontology.org/) and Kyoto
Encyclopedia of Genes and Genomes (KEGG: http://www.kegg.jp/kegg) enrichment analyses were
performed. The degree of enrichment was evaluated based on the rich
factor, the false discovery rate (FDR) and the number of genes
enriched in each GO term. The rich factor is the ratio of the
number of enriched DEGs to the total number of annotated genes in
the GO term and is directly proportional to the degree of
enrichment. The FDR is the expected proportion of false positives
among all the significant results; the closer the FDR value is to
zero, the more likely the significant results are likely to be true
positives. PPI network functional enrichment analysis was performed
using STRING 11.0 (https://string–db.org/). The STRING results were saved
in tab-separated values (TSV) format, and the TSV file was retained
and imported into Cytoscape software (version 3.9.1;
bytesin.com/software/Cytoscape/) to visualize the relevant PPI
networks. Clusters of networks were detected using the MCODE
Cytoscape plugin (version 1.5.1) (25). The hub or core genes among the DEGs
in the PPI network were identified using the CytoNCA Cytoscape
plugin (version 2.1) (26).
Antibodies and inhibitors
The antibodies used in this study are listed in
Table SI, along with the
concentrations at which they were used. The following inhibitors
were used: Picropodophyllin (PPP; cat. no. HY-15494;
MedChemExpress) as an inhibitor of IGF1 receptor (IGF1R) activity
(27–29); and GSK650394 (cat. no. HY-15192;
MedChemExpress), as an inhibitor of serum/glucocorticoid regulated
kinase 1 (SGK1) activity (30,31).
Reverse transcription-quantitative PCR
(RT-qPCR)
Total RNA was extracted from cells using TRNzol
Universal Reagent (cat. no. DP424; Tiangen Biotech Co., Ltd.).
Complementary DNA was synthesized from the RNA using the HiFiScript
cDNA Synthesis Kit (cat. no. CW2569; CoWin Biosciences) under the
following conditions: 42°C for 15 min and 85°C for 5 min. qPCR
analysis was then performed using 2X UltraSYBR Mixture (cat. no.
CW0957; CoWin Biosciences) on a CFX96 system (Bio-Rad Laboratories,
Inc.) with the appropriate primers (Table SII). The qPCR conditions were as
follows: 95°C for 10 min as the initial activation step, followed
by 40 cycles of 95°C for 15 sec for denaturation and 60°C for 60
sec for annealing. The mRNA expression levels were calculated using
the 2−ΔΔCq relative quantification method (32). The expression level of each target
gene was normalized to that of b-actin mRNA in the same sample.
Enzyme-linked immunosorbent assay
(ELISA)
Cells were plated in a 24-well plate at a density of
1×10⁶ cells/well and incubated overnight to achieve 100%
confluency. After discarding the culture supernatant, the cells
were washed with phosphate-buffered saline (PBS) and cultured
overnight in serum-free medium. The culture supernatant was then
collected to measure the IGF1 levels using a mouse IGF1 (mIGF1)
ELISA kit (cat. no. EK0378; Boster Biological Technology),
following the manufacturer's instructions. The absorbance of the
samples was measured at 450 nm using an Infinite M200 microplate
reader (Tecan Group, Ltd.).
Cell counting assay
Cell proliferation was measured using a Cell
Counting Kit-8 (CCK-8; cat. no. HY-K030; MedChemExpress), following
the manufacturer's instructions. The absorbance of the samples at
450 nm was measured using an Infinite M200 microplate reader (Tecan
Group, Ltd.).
Protein extraction and western
blotting (WB)
Control-L929 and MCT4-L929 cells were seeded into
6-cm dishes and incubated in the presence or absence of recombinant
mIGF1 (cat. no. 50437-MNAY; Sino Biological, Inc.) at a
concentration of 500 pg/ml for 1 h or inhibitors (300 nM PPP/5 µM
GSK650394) for 2 h in serum-free medium at 37°C. The cells were
serum-free starved overnight prior to treatment with mIGF1 or
inhibitor. After incubation, cells were collected using a scraper,
incubated on ice for 15 min, and lysed using
radioimmunoprecipitation assay lysis buffer (cat. no. P0013C;
Beyotime Institute of Biotechnology) with 1 mM protease inhibitor
cocktail (cat. no. 05892970001; Roche Diagnostics, GmbH) and 1 mM
phosphatase inhibitors (cat. no. 4906845001; Roche Diagnostics,
GmbH). The lysate was centrifuged at 10,000 × g for 10 min. The
protein concentration in the supernatant was quantified using a
bicinchoninic acid assay kit (cat. no. AR0197A; Wuhan Boster
Biological Technology, Ltd.).
To perform WB, lysates (15–50 µg/lane) were resolved
using sodium dodecyl sulfate-polyacrylamide gel electrophoresis
with a 12 (all proteins except IGF1) or 15% (for IGF1) gel. The
resolved proteins were transferred to a 0.45-µm polyvinylidene
difluoride membrane (cat. no. IPFL00010; Merck KGaA). To reduce
background staining, the membrane was blocked with 5% bovine serum
albumin in Tris-buffered saline containing 0.1% Tween 20 (TBST) for
1 h at room temperature. Next, the membrane was incubated with
primary antibodies overnight at 4°C. After washing with TBST
buffer, the membrane was incubated with horseradish
peroxidase-conjugated anti-mouse (cat. no. 31430; Invitrogen;
Thermo Fisher Scientific, Inc.; 1:5,000) or anti-rabbit (cat. no.
31460; Invitrogen; 1:5,000) secondary antibodies for 1 h at room
temperature. Protein bands were visualized using enhanced
chemiluminescence (cat. no. KGP1127; Nanjing KeyGen Biotech Co.,
Ltd.) with 5200 Multi Automatic Chemiluminescence (Tanon Science
and Technology Co., Ltd.) and quantified using ImageJ v1.5.1
software (National Institutes of Health).
Cell migration assay
The wound healing assay, which mimics in vivo
cell migration, is based on the observation of cell migration into
a ‘wound’ that is generated in a cell monolayer (33). To form a confluent monolayer,
1×10⁶ cells/well were seeded in a 24-well plate and
incubated overnight to achieve 100% confluency. A wound was
generated at the midline of each culture by scraping the confluent
cells with a 200-µl pipette tip. Next, the cell monolayer was
gently washed with PBS to remove the detached cells and incubated
with fresh serum-free medium. In each experiment, a first image (0
h) was immediately captured under a light microscope (Leica
Microsystems GmbH), and a second image was captured in the same
manner after 48 h. The closure of the wound was measured using
Image-Pro Plus analysis software (Media Cybernetics, Inc.). The
migration rate was calculated using the following formula:
Migration rate (%)=[(average wound width at 0 h-average wound width
at 48 h)/average wound width at 0 h] ×100.
For migration promotion or inhibition studies, the
same protocol was used, with the exception that before wounds were
generated, the cells were treated with serum-free medium overnight,
and after the wounds were generated, mIGF1 (500 pg/ml for 1 h at
37°C), PPP (300 nM for 2 h at 37°C) or GSK650394 (5 µM for 2 h at
37°C) was added to the serum-free medium. Cell proliferation was
measured using the aforementioned CCK-8 kit.
Lentivirus system-mediated knockdown
of IGF1
BLOCK-iT™ RNAi Designer (https://rnaidesigner.thermofisher.com/rnaiexpress/)
was used to design IGF1 short hairpin (sh) sequences. Three gene
sequences were synthesized (Genewiz, Inc.): IGF1 sh1:
5′-GCCTCTGTGACTTCTTGAAGACGAATCTTCAAGAAGTCACAGAGGC-3′; IGF1 sh2:
5′-GCTCTTCAGTTCGTGTGTGGACGAATCCACACACGAACTGAAGAGC-3′; and IGF1 sh3:
5′-CAGGCATTGTGGATGAGTGTTCGAAAACACTCATCCACAATGCCTG-3′. These
sequences were cloned into an LV-U6-MSC-CMV-ZsGreen-PGK-PURO vector
(Hanheng Biotechnology Co., Ltd.) for lentiviral packaging. The
vector was also used for lentiviral packaging as a knockdown
control (shControl). The lentiviral plasmids shControl and IGF1
sh1-3 were transfected into 293T cells (ATCC) using a LipoFiter™
transfection reagent (cat. no. HB-TRIF-1000; Hanheng Biotechnology
Co., Ltd.).
A total of 25 µg lentiviral plasmid was used for
transfection. The lentivirus, packaging plasmid, and envelope
plasmid were used in a ratio of 2:2:1. After 6 h of transfection at
37°C, the medium was replaced with complete medium (CSC03-CL medium
containing 10% FBS), and ZsGreen protein expression was observed 48
and 72 h after transfection. The viral supernatant was removed
after 72 h and the viral stock was obtained by ultracentrifugation
at 100,000 × g for 2 h at 4°C.
MCT4-L929 (4D11) cells were seeded at a density of
1×10⁴ cells/well in a 96-well plate and incubated
overnight. Then, the culture supernatant was removed, 50 µl/well
lentivirus stock solution was added, and 50 µl complete medium
(CSC03-CL medium with 10% FBS) was added after 4 h. Lentiviral
transfection was performed using a multiplicity of infection of 50.
The virus-containing medium was replaced with 100 µl/well complete
medium after 24 h. ZsGreen expression was observed 48 h after
lentiviral infection, and puromycin (10 µg/ml) was added to the
cell supernatant. Plates were then returned to the incubator for 2
weeks. Clones were sub-cultured in 24- or 6-well plates and used
for subsequent experiments.
Statistical analysis
Origin (Electronic Arts Inc.) was used to generate
volcano plots and GO/KEGG bubble diagrams. Statistical analyses
were performed using GraphPad Prism software version 8.0.1
(GraphPad Software; Dotmatics). Two-tailed unpaired t-tests were
used to compare results between two groups. One-way ANOVA or
two-way ANOVA with Tukey's post hoc test was used to compare
results among more than two groups. Correlation was assessed by
Pearson's coefficient. P<0.05 was considered to indicate a
statistically significant difference.
Results
Overview of RNA-Seq
Sequencing the three MCT4-L929 cell lines (3E10,
4D11 and 8E4) and three control-L929 cell lines (C5, H9 and 2H6) on
an Illumina platform yielded an average of 45,975,435 clean reads
per library. The data quality analysis revealed that the Q20 and
Q30 ratios were >95 and >90%, respectively. The total_mapped
and uniquely_mapped ratios were both >95%, indicating good data
quality (Table SIII).
Transcriptome de novo assembly
Two groups of cells from each cell line were
subjected to correlation analysis to ensure biological
reproducibility within each group. Pearson's correlation test was
used to measure the correlation of gene expression levels
[fragments per kilobase of exon per million mapped fragments
(FPKM)] among the six cell lines (Fig.
1A). A strong correlation coefficient (0.8–1.0) indicates high
reproducibility among samples within biological replicates.
Conversely, a correlation coefficient lower than 0.8 indicates low
reproducibility among samples in the same cohort.
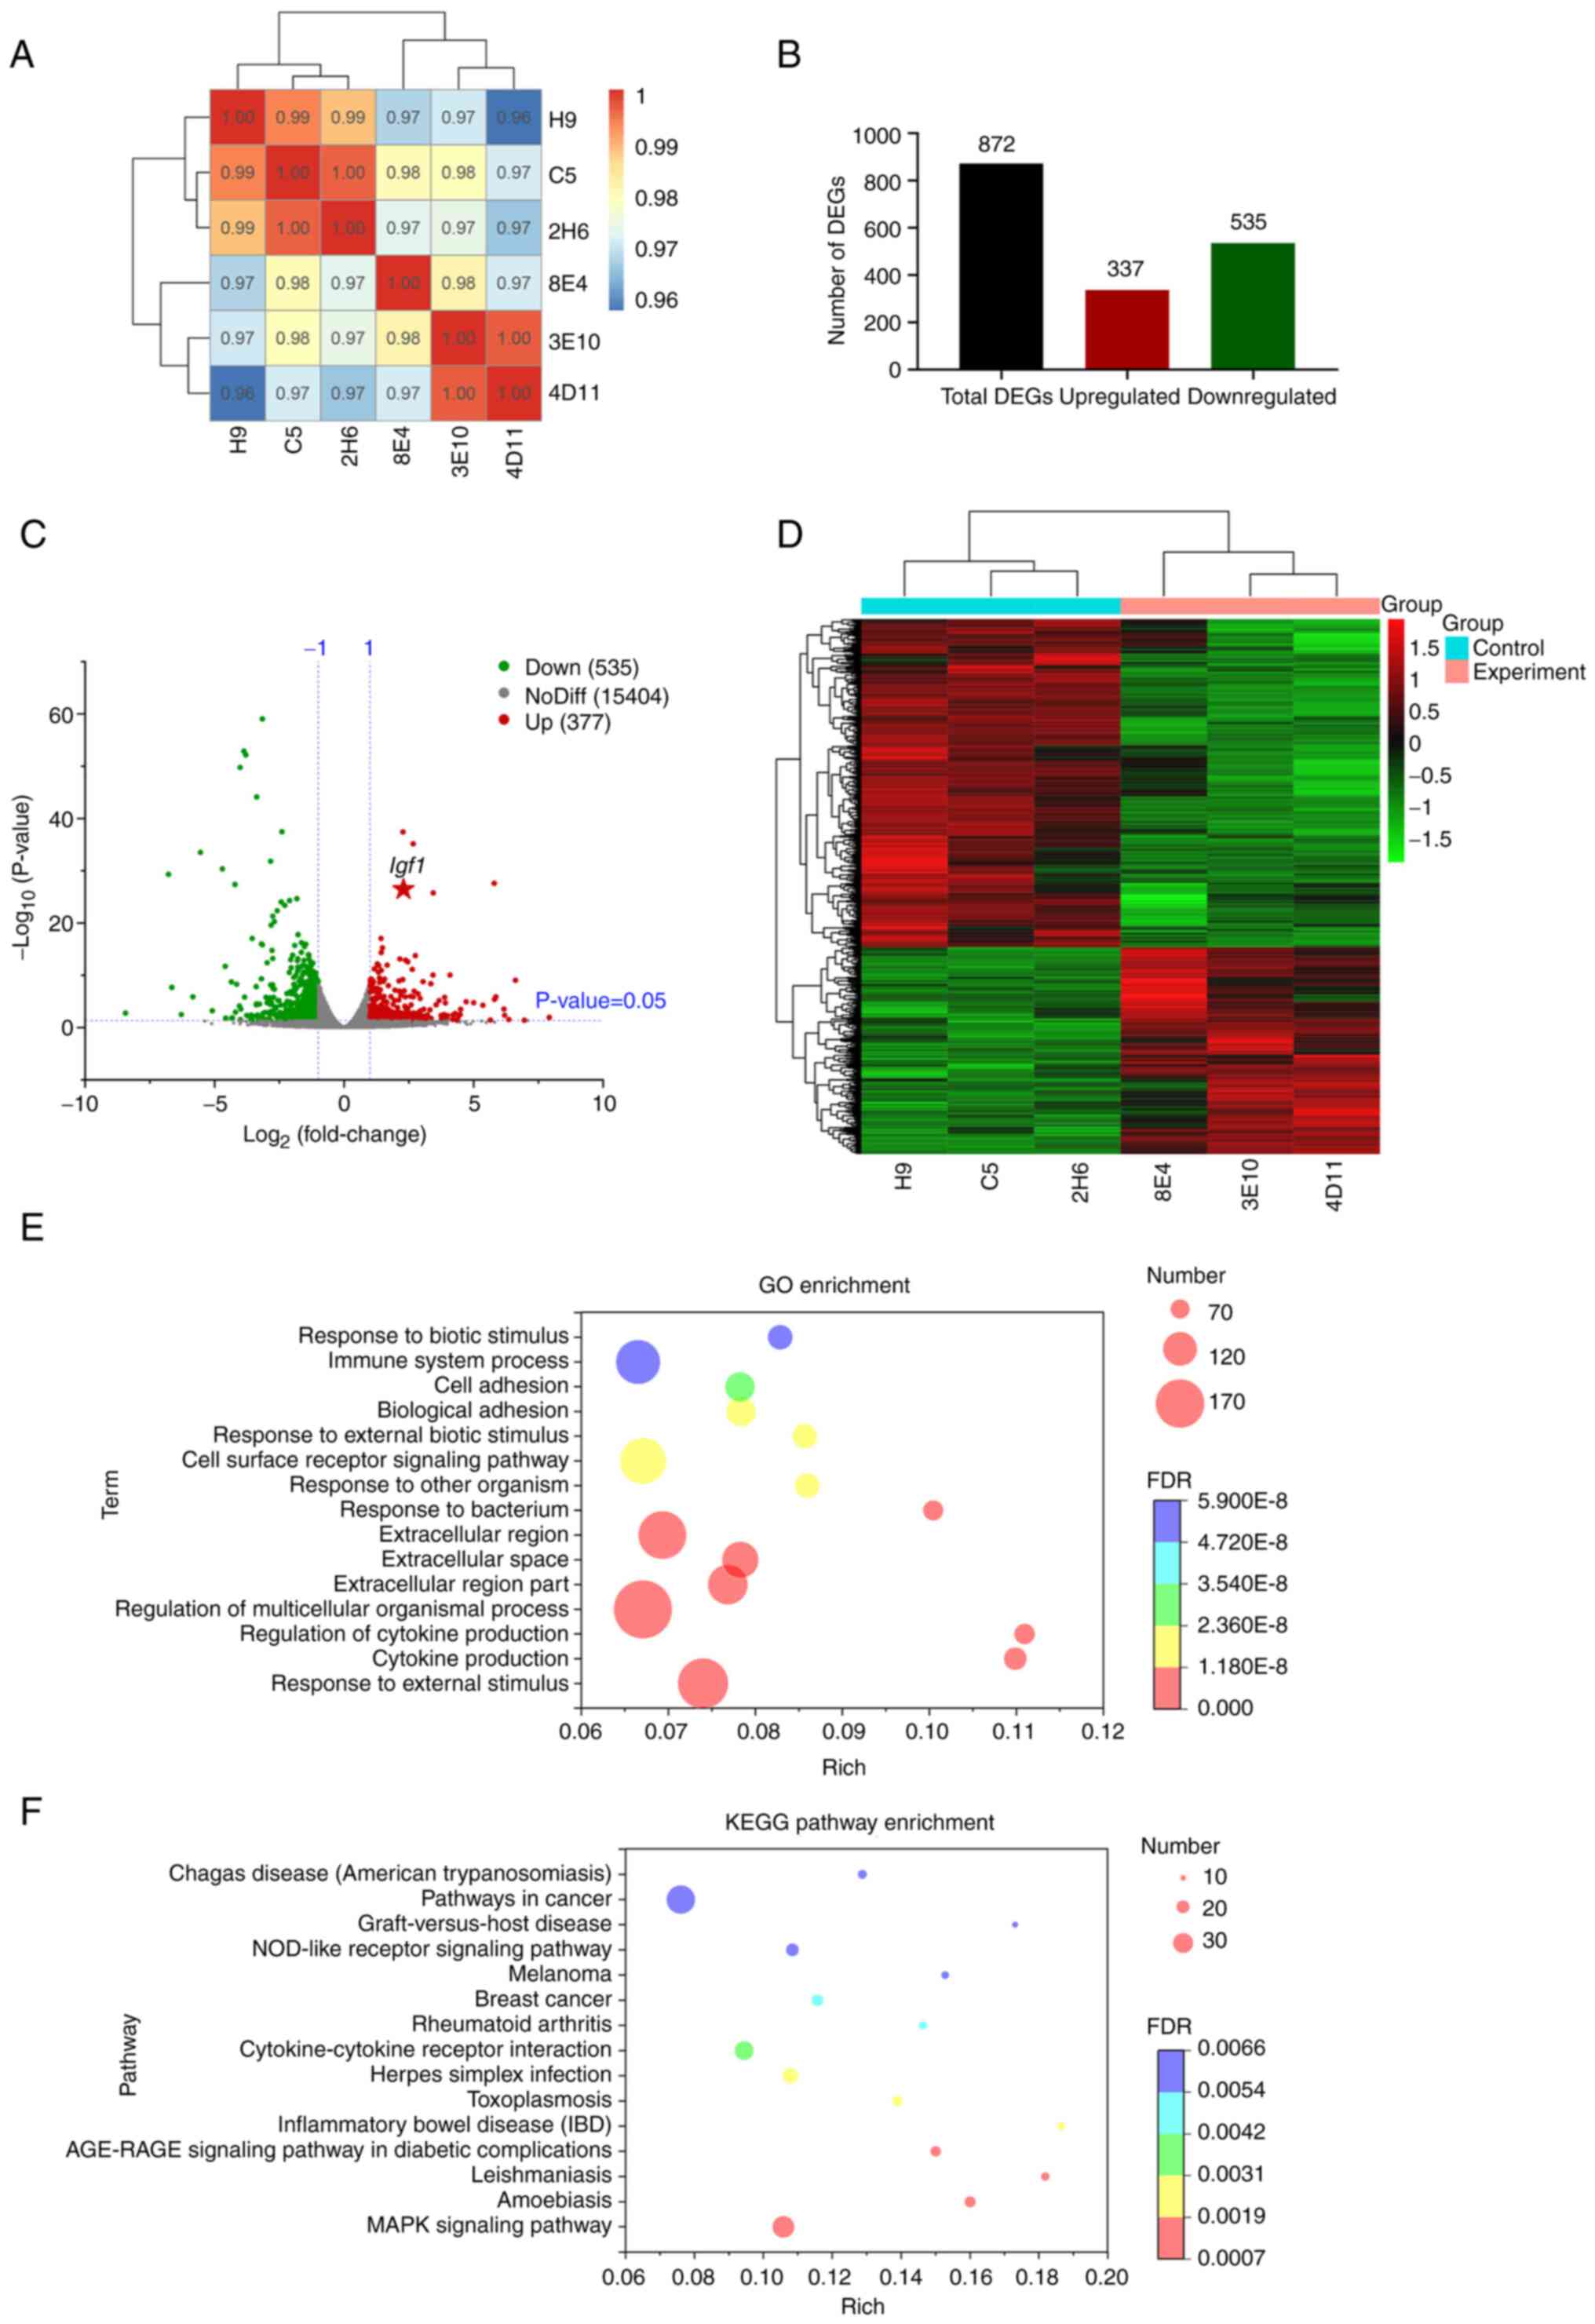 | Figure 1.Transcriptome data analysis. (A)
Sample correlation analysis. The left and upper sides indicate
sample clustering, while the right and lower sides of the figure
are cell line names. Different colors of the squares represent the
strength of the correlation between the two corresponding samples.
(B) Bar chart showing the number of upregulated and downregulated
DEGs. (C) Volcano plot of DEGs in which the x-axis represents
log2 |fold change| for MCT4-L929/control-L929 and the
y-axis shows the log10 (P-value). The two vertical
dashed lines in the figure indicate the two-fold expression
difference threshold, while the horizontal dashed line indicates
the P=0.05 threshold. The red and green dots represent upregulated
and downregulated genes, respectively. The gray dots represent
genes that are not significantly and differentially expressed. (D)
Heatmap of DEGs in which each column is a cell line and the y-axis
represents DEGs. The colors indicate the expression levels of the
DEGs; red and green represent upregulated and downregulated genes,
respectively. (E) GO enrichment and (F) KEGG enrichment. The color
of each bubble represents the P-value, while the size represents
the number of DEGs in the GO or KEGG term. The x-axis shows the
rich factor, which represents the ratio of DEGs vs. total genes in
the pathway that is measured. DEGs, differentially expressed genes;
GO, Gene Ontology; KEGG, Kyoto Encyclopedia of Genes and Genomes;
Igf1, insulin-like growth factor 1; NoDiff, no difference. |
The RNA-seq data of MCT4-L929 (3E10, 4D11 and 8E4)
and control-L929 (C5, H9 and 2H6) cells were normalized using FPKM
values. In total, 872 DEGs were identified with
|log2FC|>1 and P<0.05); these comprised 337
upregulated and 535 downregulated genes. The results are displayed
in a bar graph (Fig. 1B) and
volcano plot (Fig. 1C). A
clustering heatmap was prepared to present a visual comparison of
DEGs between the MCT4-L929 and control-L929 cells (Fig. 1D). In the GO and KEGG analyses, the
top 15 GO terms with the smallest FDR values are shown in Fig. 1E and the top 15 KEGG pathways with
the smallest FDR values are shown in Fig. 1F. The most enriched KEGG pathway is
‘pathways in cancer’, suggesting that the upregulated expression of
MCT4 may promote the carcinogenesis of L929 cells.
Analysis and identification of
DEGs
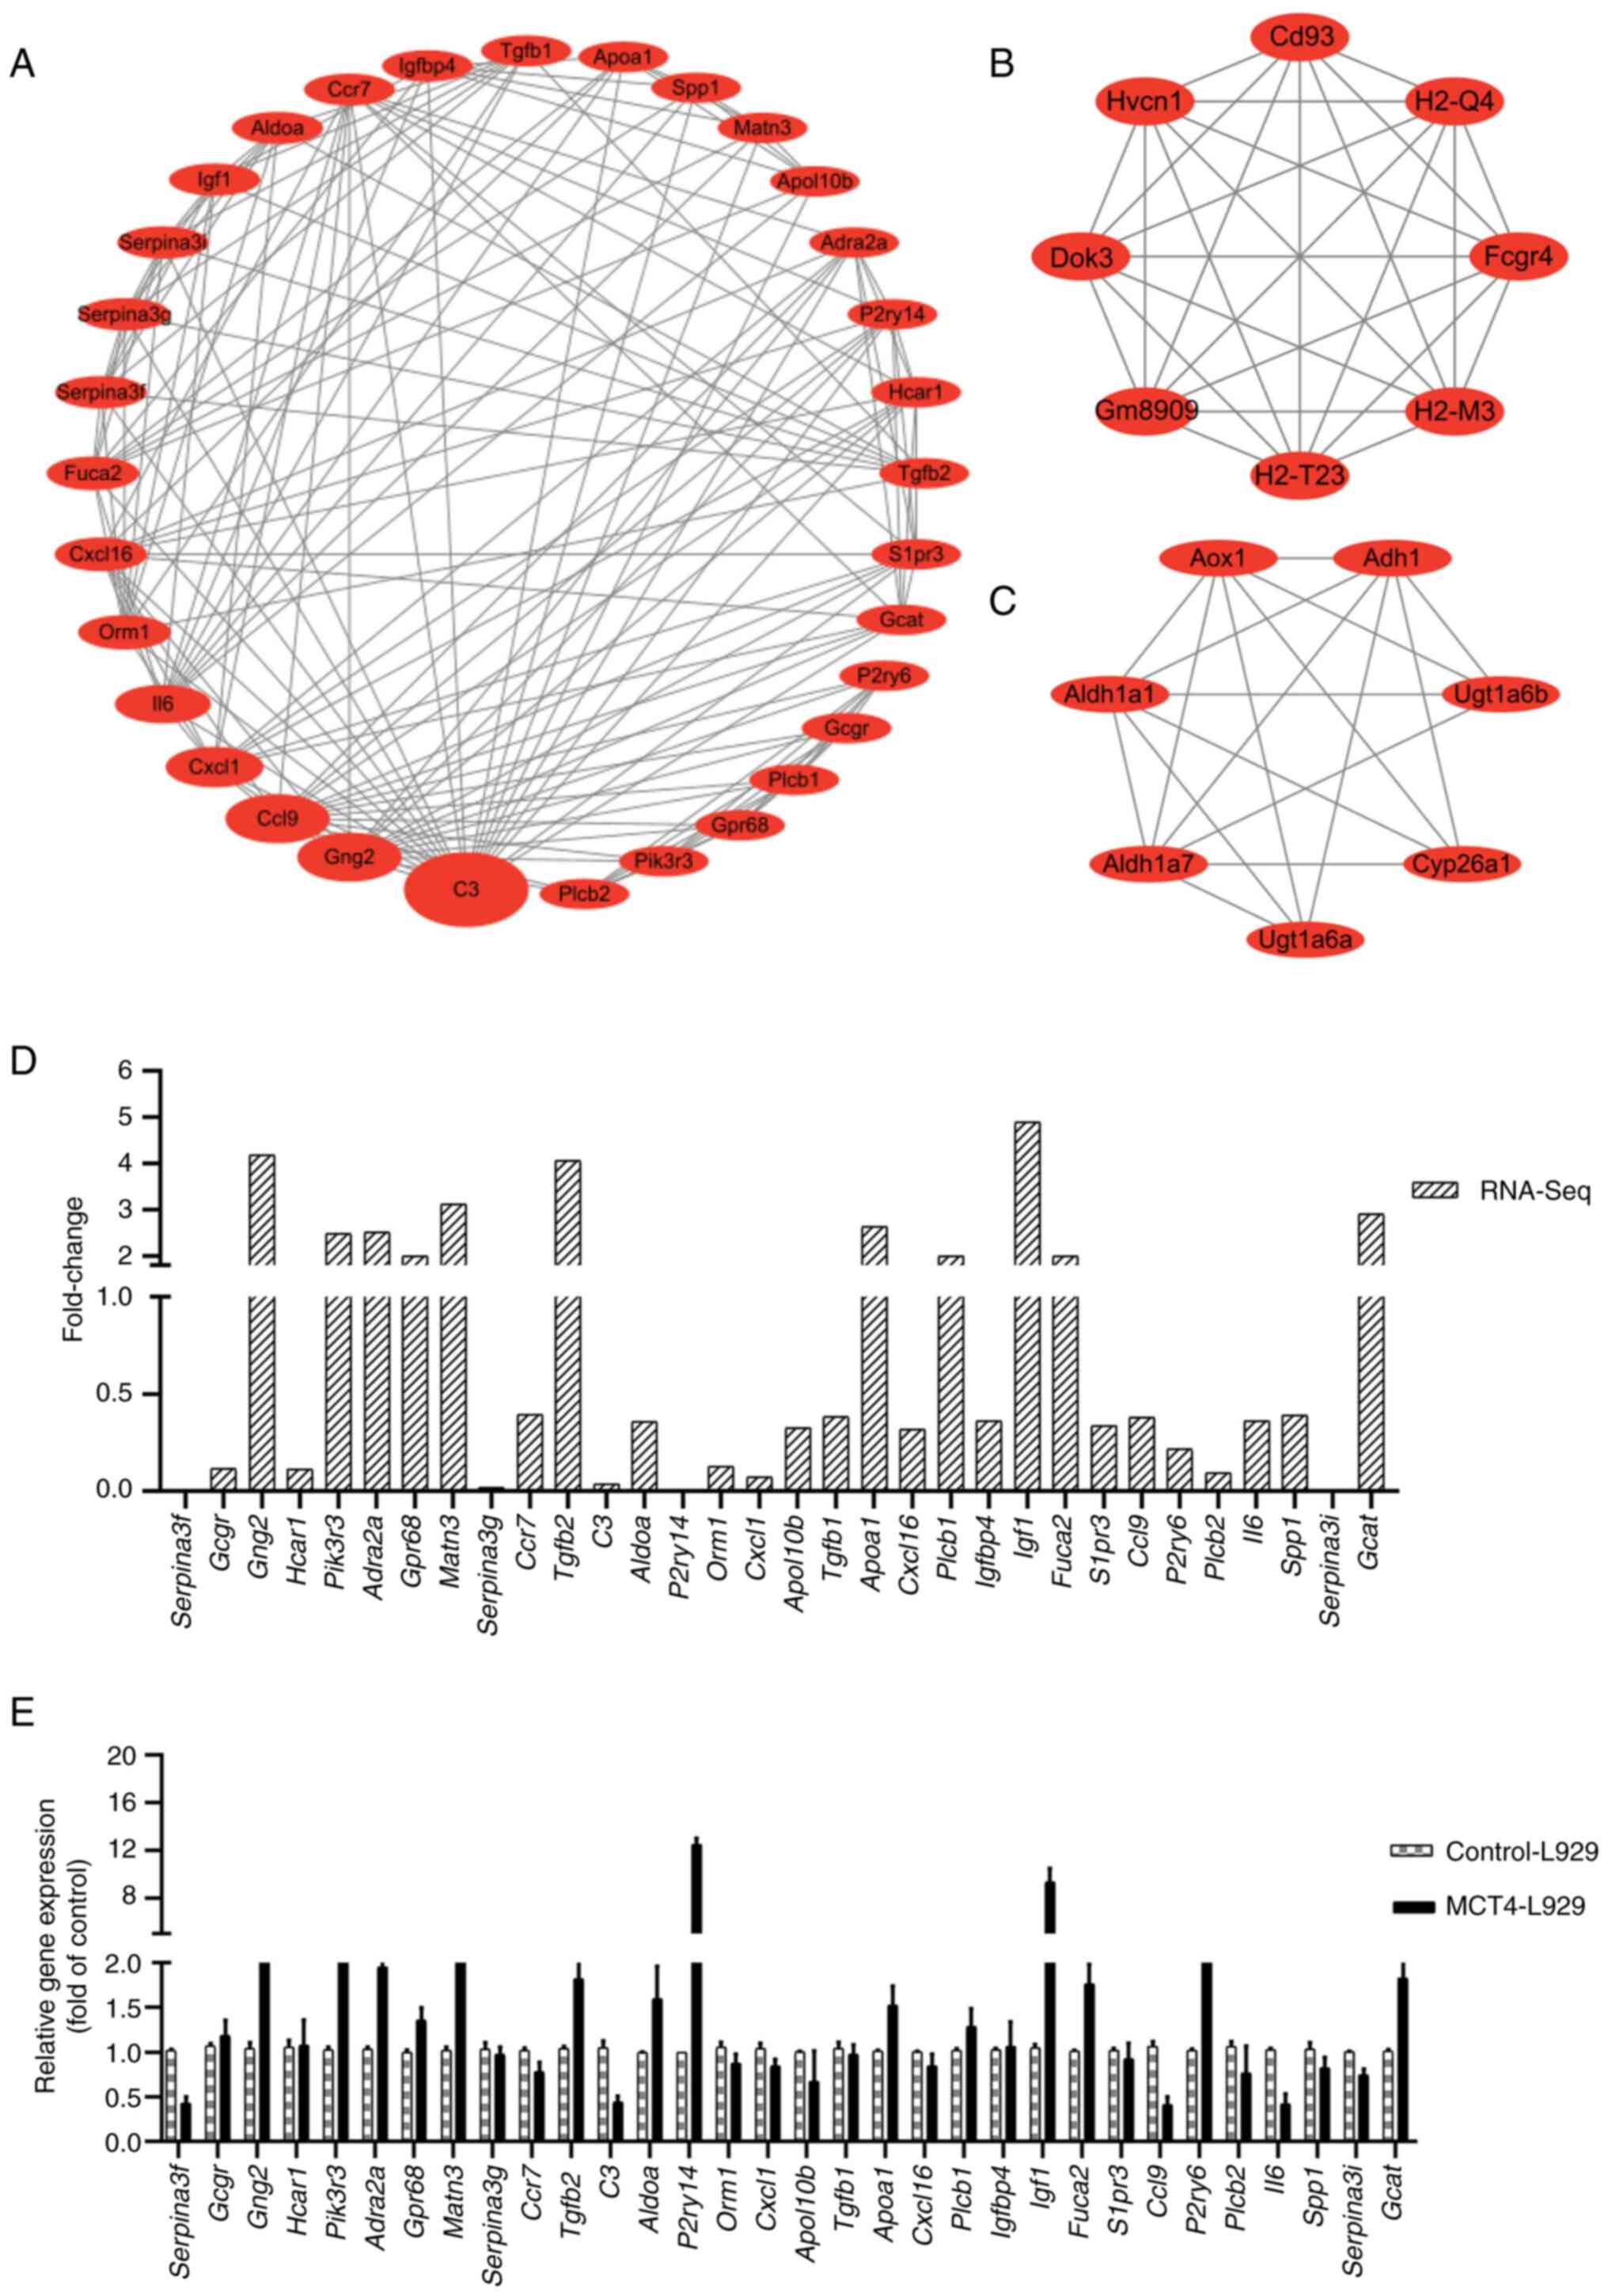
The top three scoring clusters in the PPI network
according to the MCODE analysis are listed in Table SIV. These clusters are shown in
Fig. 2A-C, where the nodes
represent proteins and the edges represent the association between
proteins. The first-ranked network, cluster 1, consists of 32 nodes
and 155 edges, making it the largest and potentially most impactful
network. As a result, this network was chosen for further
examination. Table SV lists the 32
genes of cluster 1 ranked by their betweenness value obtained using
CytoNCA. A higher betweenness value indicates a higher likelihood
of a gene being the core gene in the PPI network. The size of each
gene cluster was sorted based on the betweenness value.
The mRNA levels of all genes in cluster 1 were
subjected to pairwise comparison. The fold change was determined as
the ratio of expression in the MCT4-L929 and control-L929 groups
according to the RNA-seq data (Fig.
2D). The transcription of Serpina3f and Serpina3i
in MCT4-L929 cells and that of purinergic receptor P2Y14
(P2ry14) in control-L929 cells was low (close to zero).
Therefore, the fold change values of these three genes were not
calculated. The expression levels of all genes in cluster 1 were
verified using RT-qPCR (Fig. 2E).
P2ry14 and Igf1 exhibited large differences in
expression between the MCT4-L929 and control-L929 cells, which is
consistent with the RNA-seq results. Therefore, P2ry14 and
Igf1 were selected as the two candidate target genes for
further investigation.
P2RY14 is a UDP-glucose P2Y purinergic receptor that
plays a crucial role in signaling through G-protein-coupled
receptors and peptide ligand-binding receptors (34). It is associated with various
biological processes, including immune responses, tumorigenesis and
cell senescence (35,36). Studies have shown that P2RY14
expression is significantly downregulated in head and neck squamous
cell carcinoma and lung cancer, and the higher expression of P2RY14
is associated with an improved prognosis in patients with these
cancers (37,38). Acute leukemia cells that are
resistant to PI3K/mTOR inhibition have been found to exhibit an
upregulation of P2RY14, which plays a role in patient survival and
is associated with activation of ERK signaling; however, PI3K/mTOR
signaling is not downstream of P2RY14 (39). In the formation and development of
gastrointestinal cancers, P2Y14 triggers numerous mitogen-activated
protein kinases (MAPKs), Src family kinases and downstream protein
kinases (40). Furthermore, in
stem/progenitor cells, P2RY14 inhibits cell senescence through a
mechanism involving reactive oxygen species, p38 MAPK/JNK and
p16/Rb (35).
IGFs family members and their receptors constitute
an important growth regulatory system under physiological
conditions. However, under pathological conditions, IGFs contribute
to tumorigenesis owing to their powerful pro-growth and
anti-apoptotic effects (41,42).
IGF1 expression is upregulated in tumors (43), and promotes the growth and
metastasis of various tumors, including Wilms tumor (44), papillary thyroid cancer (45), colorectal cancer (46), glioma (47) and cervical cancer (48).
Cytoscape analysis indicates that Igf1 has a
higher betweenness value than P2ry14 (Table SV). Additionally, the
aforementioned studies have shown that P2RY14 is downregulated in
several types of tumors and that higher expression levels are
associated with better patient prognosis while, by contrast, IGF1
and MCT4 are upregulated in tumors and promote tumor growth and
metastasis. On the basis on these findings, it was decided to focus
the present investigation on Igf1.
MCT4 activates the
IGF1/IGF1R/PIK3R3/SGK1 axis
WB analysis indicated that MCT4 upregulated the
expression level of IGF1 (Fig. 3A and
B). The upregulation of IGF1 levels in the MCT4-L929 culture
supernatant was demonstrated using mIGF1 ELISA test. As the cells
were cultured in serum-free medium, no exogenous IGF1 was present.
The difference in the IGF1 concentration between the MCT4-L929 and
control-L929 cells was 150–250 pg/ml (Fig. 3C). Analysis using the CCK-8 assay
revealed that the number of MCT4-L929 and control-L929 cells was
not significantly different (Fig.
S1A).
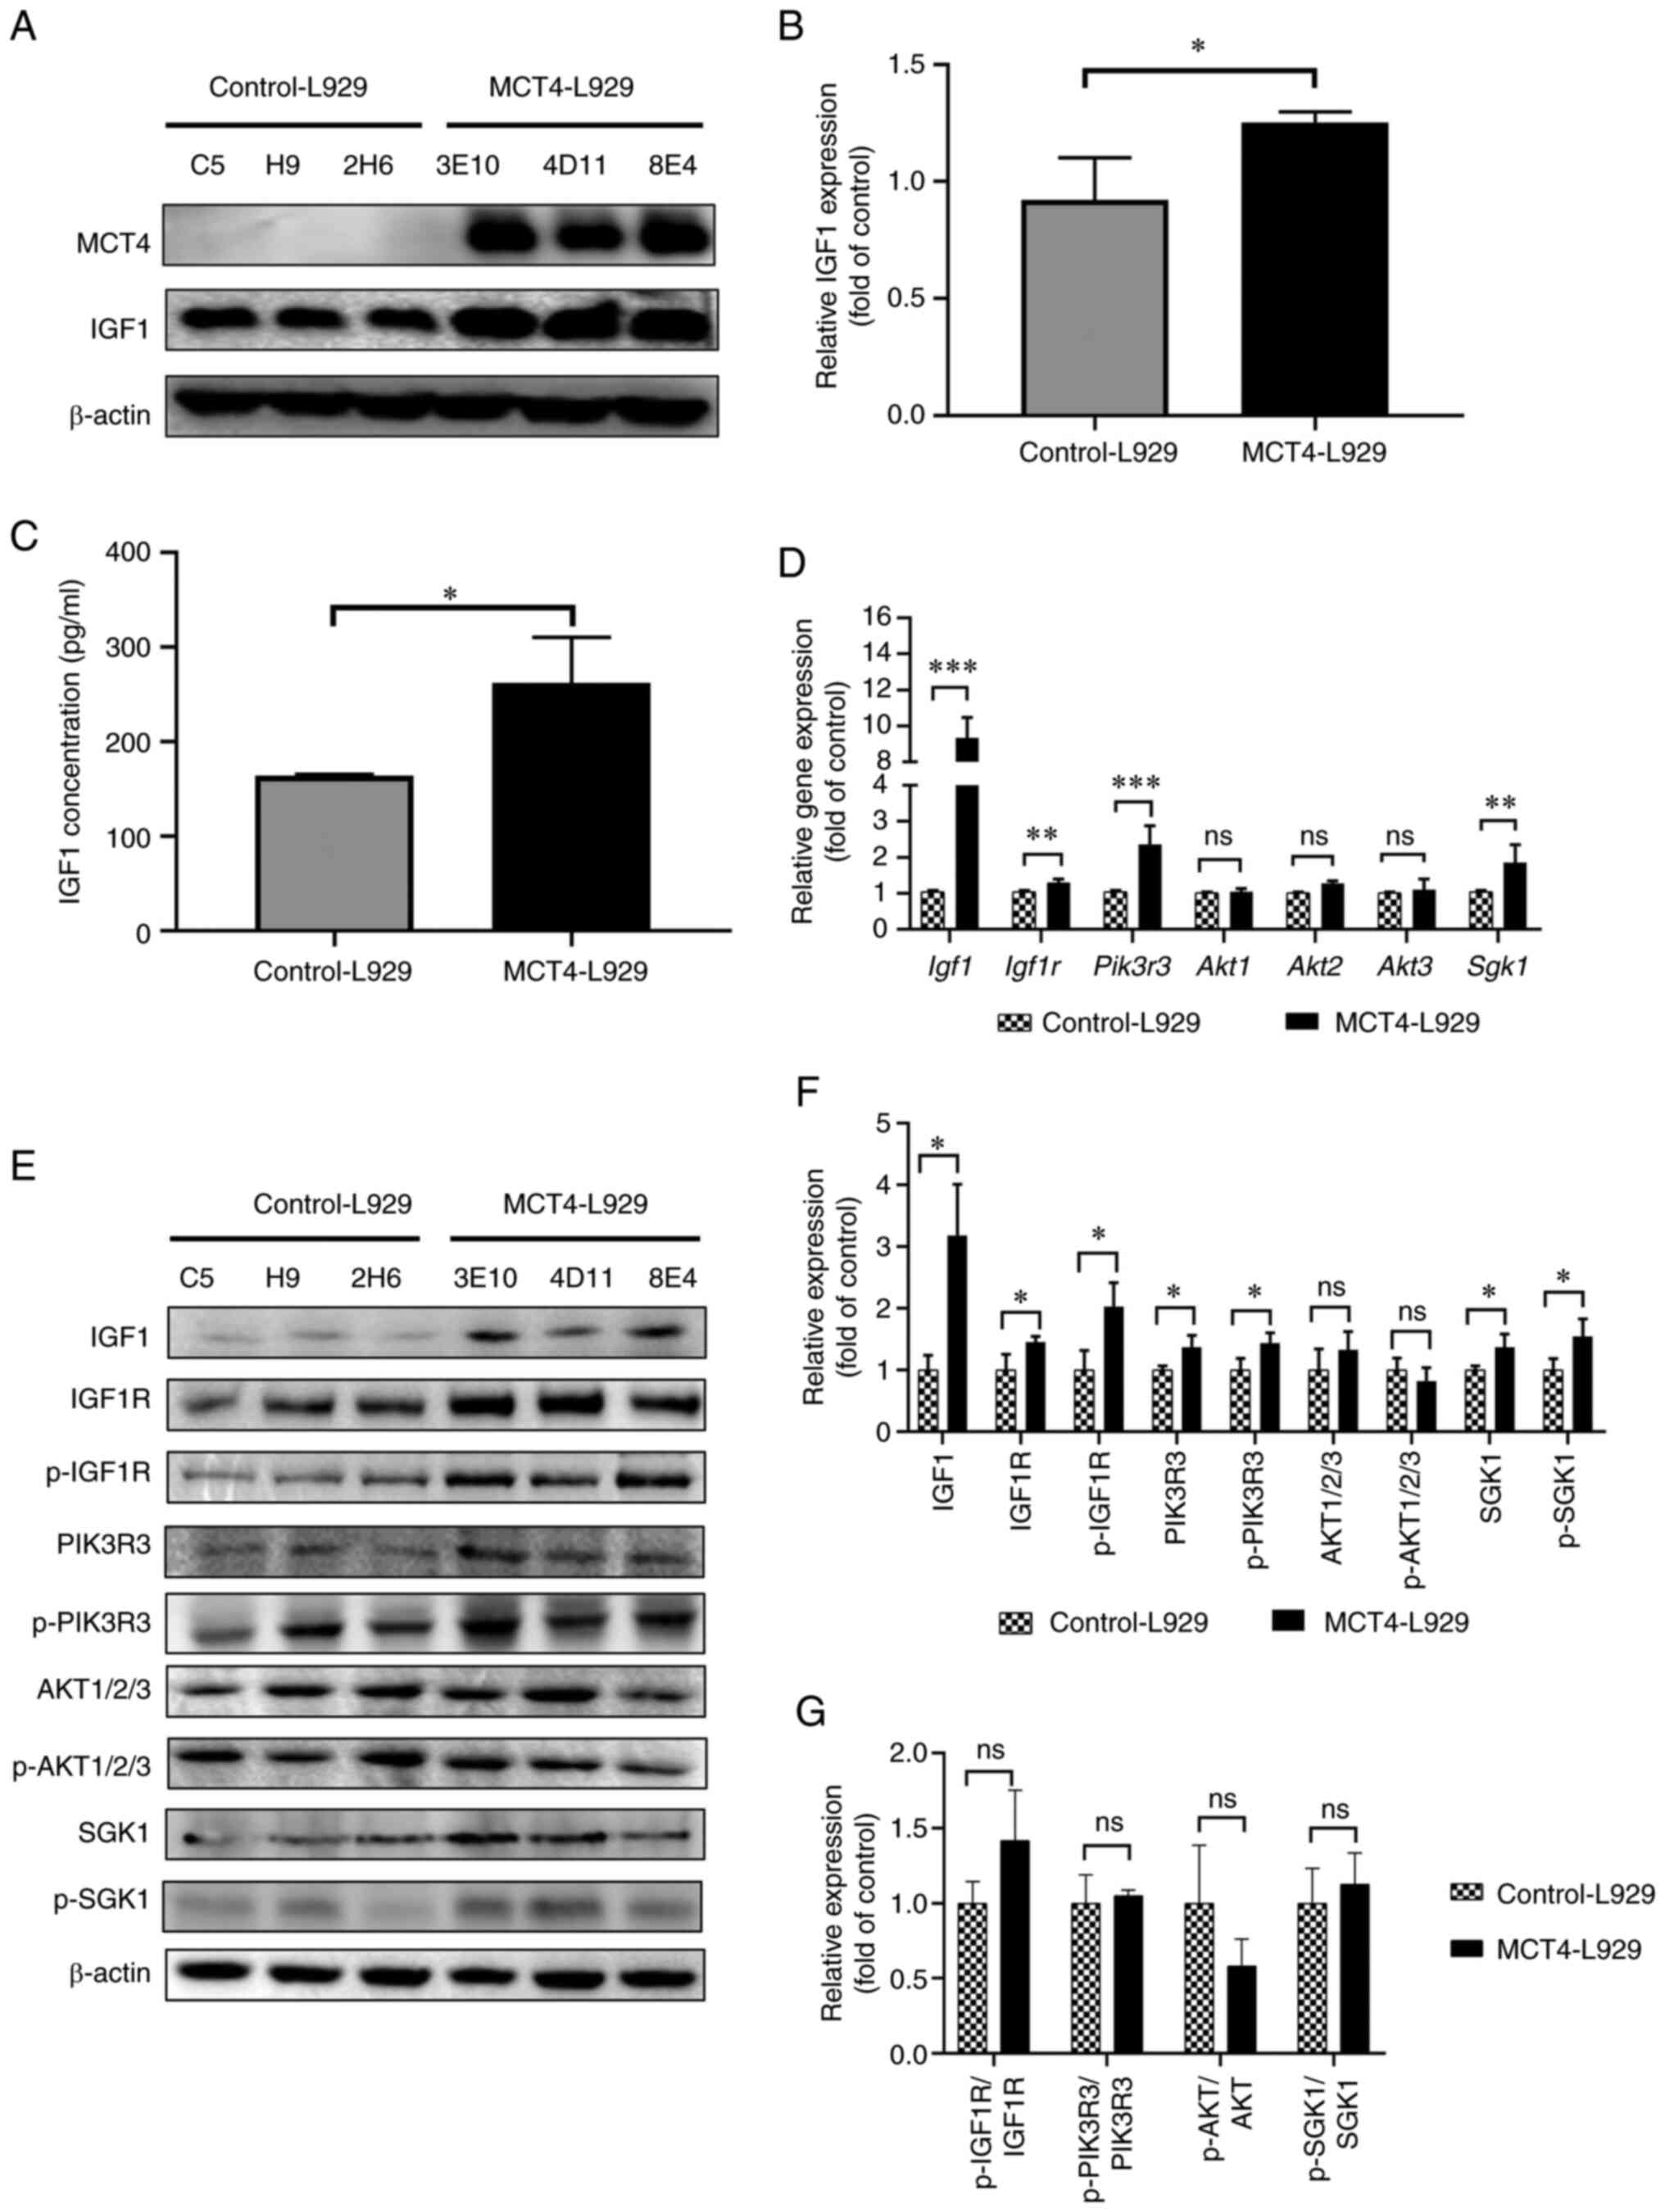 | Figure 3.MCT4 activates the
IGF1/IGF1R/PIK3R3/SGK1 axis. (A) WB analysis of MCT4 and IGF1
levels in control-L929 and MCT4-L929 cell lines using β-actin as a
loading control and (B) semi-quantification of the WB results. The
expression of IGF1 was normalized to that of β-actin. (C) IGF1
concentration in the supernatant of MCT4-L929 and control-L929 cell
lines as quantified using an enzyme-linked immunosorbent assay. (D)
The mRNA levels of selected genes in the IGF1/IGF1R pathway in
MCT4-L929 and control-L929 cells as quantified using reverse
transcription-quantitative PCR. Transcription levels in MCT4-L929
cells were normalized to those in control-L929 cells. (E) WB
analysis of IGF1, IGF1R, PIK3R3, AKT1/2/3 and SGK1 expression
levels and the phosphorylation of IGF1R, PIK3R3, AKT1/2/3 and SGK1
and (F) semi-quantification of the WB results. (G)
Phosphorylated/total protein ratio. The expression levels in
MCT4-L929 cells were normalized to those in control-L929 cells. The
means of the data from three cell lines in each group are shown,
and each error bar represents one standard deviation. Differences
between groups were analyzed using two-tailed unpaired t-tests.
*P<0.05, **P<0.01 and ***P<0.001. ns, not significant;
MCT4, monocarboxylate transporter 4; IGF1, insulin-like growth
factor 1; IGF1R, IGF1 receptor; PIK3R3, phosphoinositide 3-kinase
regulatory subunit 3; SGK1, serum/glucocorticoid regulated kinase
1; WB, western blotting; p-, phosphorylated. |
The function of IGF1 is primarily mediated through
the IGF1R (49,50). The IGF1R has been reported to be
involved in aberrant tumor growth and malignancy in vitro
(51). Therefore, the mRNA levels
of Igf1r and key genes downstream of activated IGF1R were
evaluated. The Igf1r mRNA levels in MCT4-L929 cell lines
were found to be higher than those in control-L929 cell lines
(Fig. 3D), which we hypothesize may
be attributed to upregulated IGF1 expression.
Two major downstream pathways of IGF1/IGF1R are the
Ras/Raf and phosphoinositide 3-kinase (PI3K) pathways (52). PI3K regulatory subunit 3
(Pik3r3), which encodes the PI3K regulatory subunit p55γ
(53), is a key gene in cluster 1
(Fig. 2A) and its mRNA level is
upregulated in MCT4-L929 cell lines (Fig. 3D). Therefore, it was speculated that
the PI3K pathway may be the key pathway downstream of IGF1/IGF1R.
PIK3R3 is reported to be involved in the migration and invasion of
various cancers, including glioma (54), oral carcinoma (55) and melanoma (56). AKT is commonly reported as a
downstream mediator of PI3K (57).
However, the RNA-seq analysis revealed that Akt was not a
DEG while Sgk1 was differentially expressed between the
MCT4-L929 and control-L929 cell lines. SGK1 is a member of the
cAMP-dependent, cGMP-dependent and protein kinase C family of
serine/threonine kinases, which shares a large homologous sequence
and kinase function with the AKT family. Additionally, SGK1 is a
downstream effector of PI3K that acts in parallel to AKT (57) and is upregulated in most cancers
(58). SGK1 overexpression has been
reported to promote cell migration and invasion in various cancers,
including colorectal cancer (59),
lung adenocarcinoma (60) and
prostate cancer (61).
The transcription of several effector genes
downstream of IGF1/IGF1R signaling was quantified using RT-qPCR
(Fig. 3D). The Pik3r3 and
Sgk1 mRNA levels in MCT4-L929 cells were higher than those
in control-L929 cells. However, the mRNA levels of Akt1,
Akt2 and Akt3 were not significantly different between
the MCT4-L929 and control-L929 cells. These findings are consistent
with the RNA-seq data. The protein levels of IGF1, IGF1R, PIK3R3,
SGK1, AKT1/2/3 and their phosphorylation levels, with the exception
of IGF1 phosphorylation, were analyzed using WB. The protein levels
of IGF1, IGF1R, p-IGF1R, PIK3R3, p-PIK3R3, SGK1 and p-SGK1 in the
MCT4-L929 cells were higher than those in the control-L929 cell
lines (Fig. 3E and F). As the
expression levels of both total and phosphorylated levels of IGF1R,
PIK3R3, and SGK1 were increased in MCT4-L929 cells compared with
control-L929 cells, the ratios of phosphorylated to total proteins
did not show a significant difference between MCT4-L929 and
Control-L929 cells (Fig. 3G).
Therefore, it was speculated that the overexpression of MCT4 may
promote the migration of L929 cells via activation of the
IGF1/IGF1R/PIK3R3/SGK1 pathway.
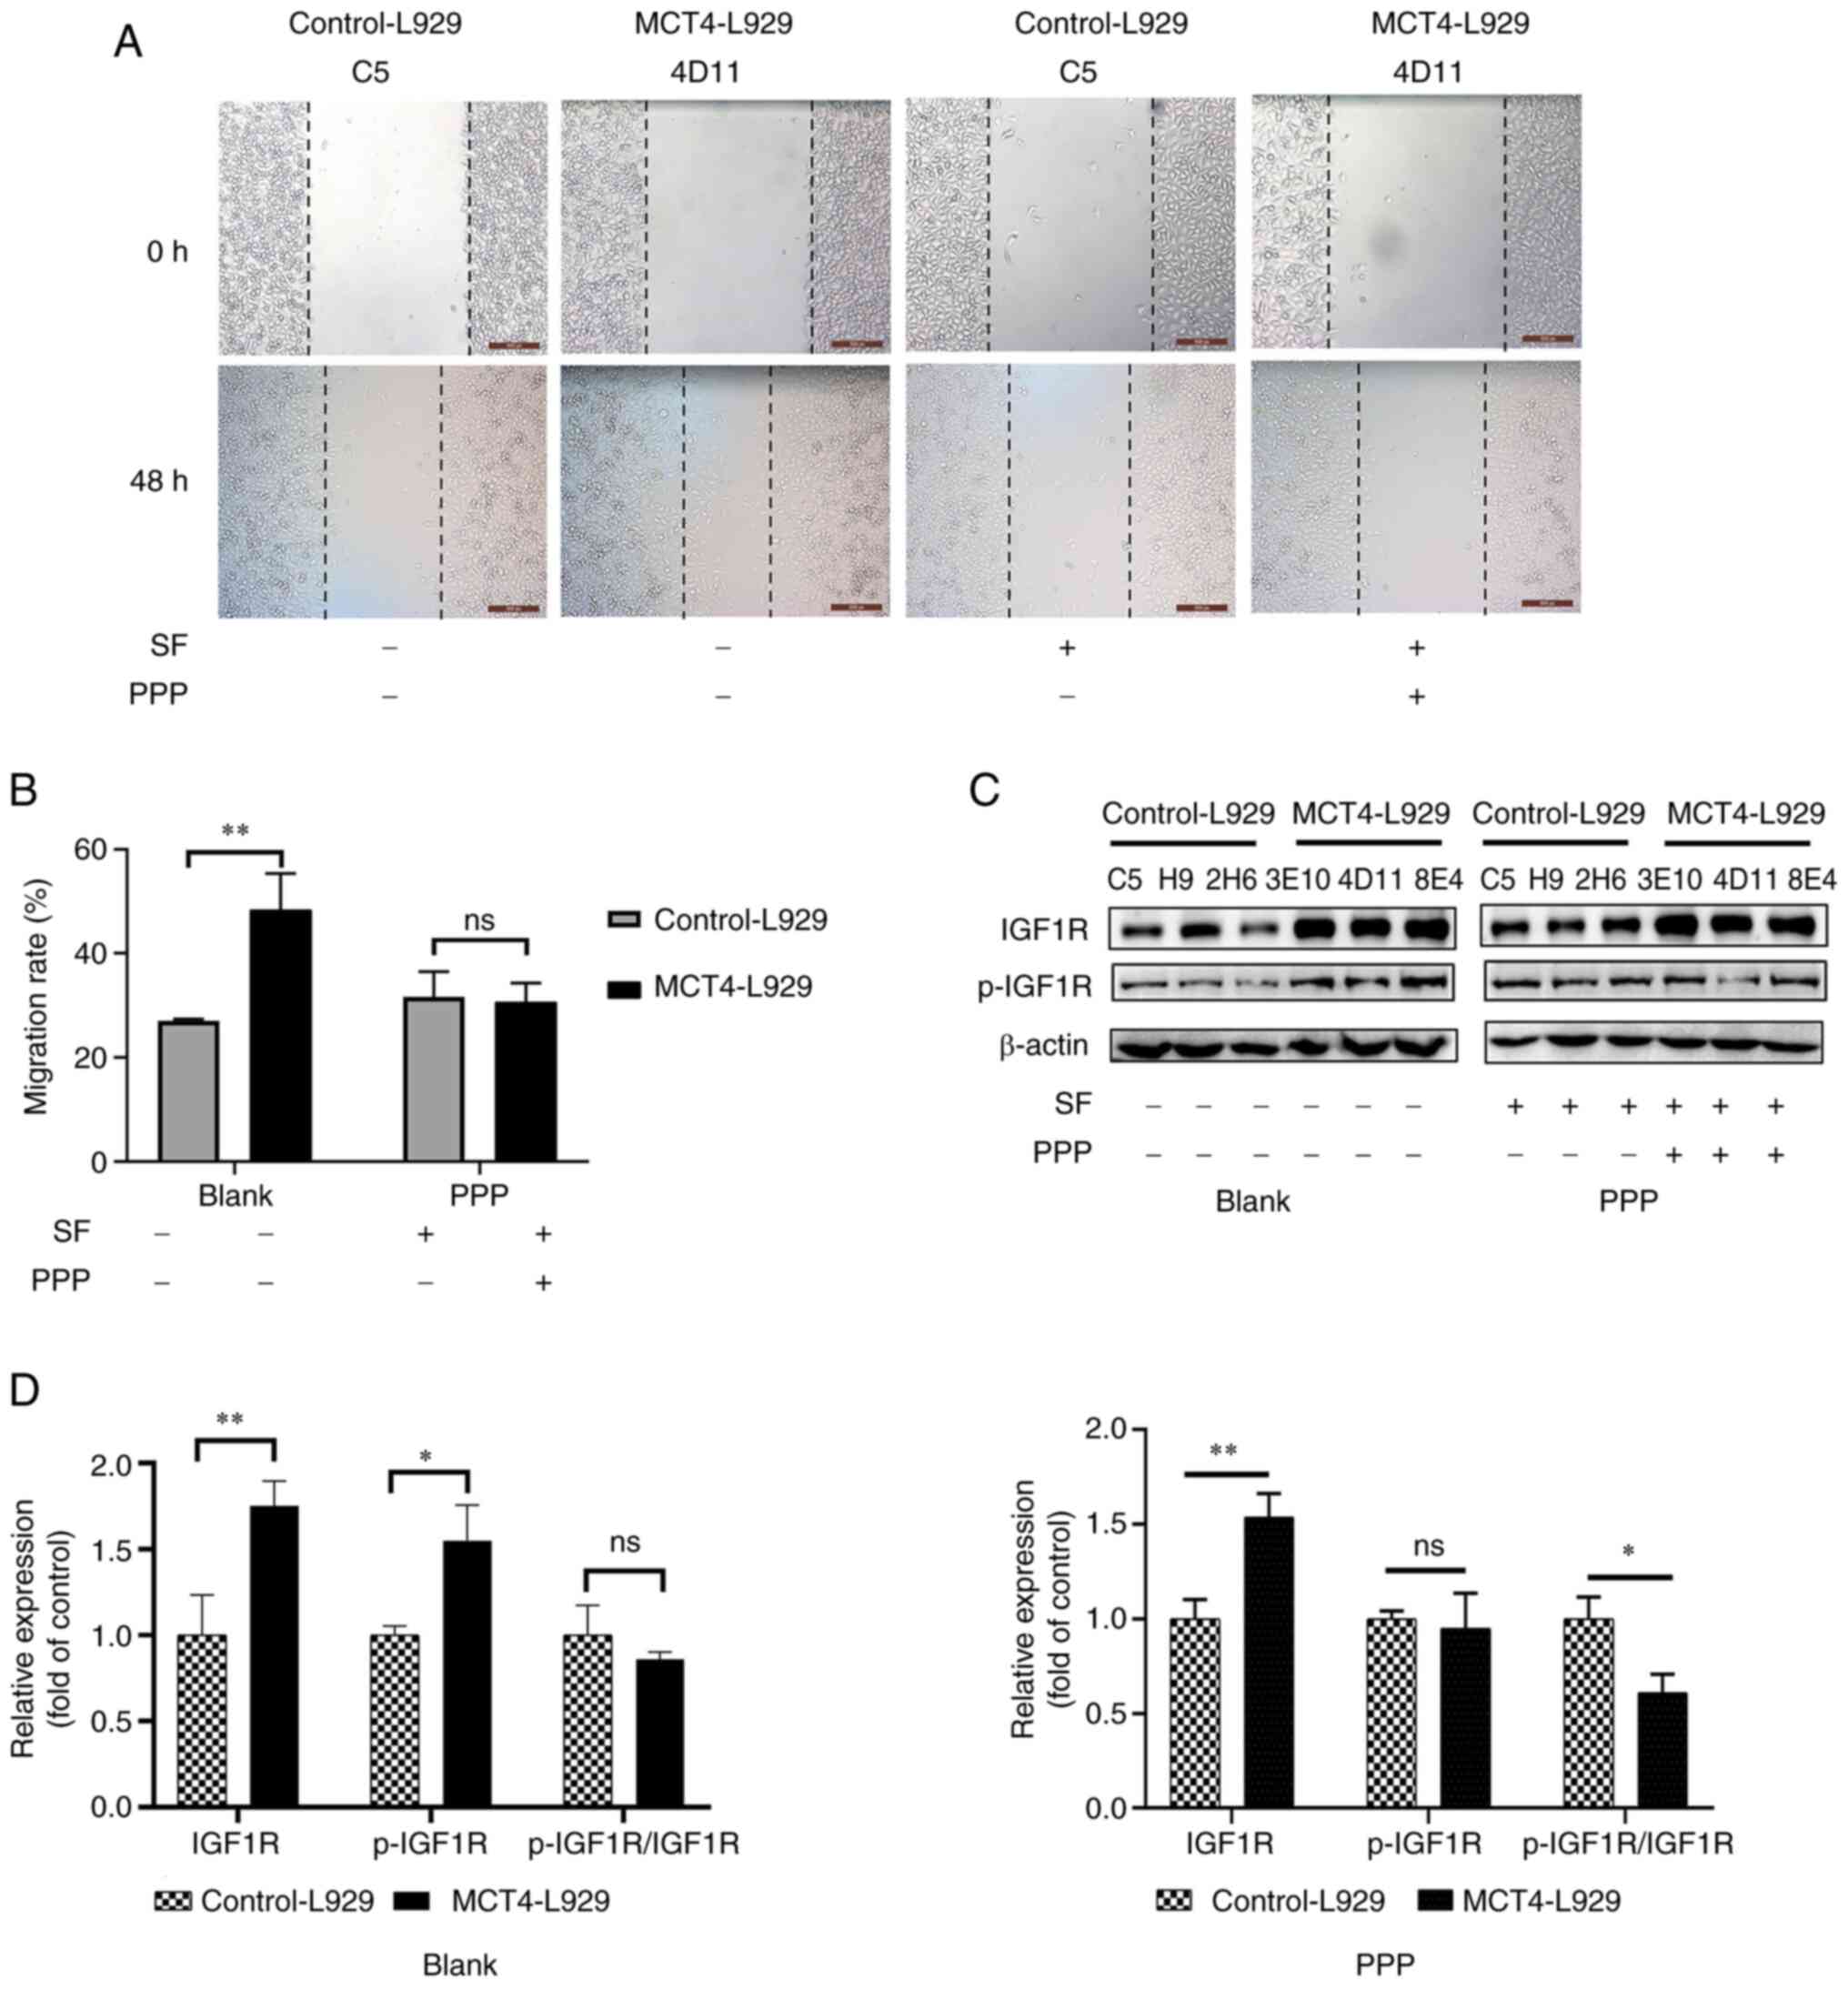
IGF1 promotes the migration of
control-L929 cells
Control-L929 cell lines (C5, H9, and 2H6) were
treated with mIGF1 to simulate the effect of MCT4 overexpression.
The migration rate of the control-L929 cells treated with 500 pg/ml
mIGF1 was significantly upregulated and similar to that of
MCT4-L929 cells (Fig. 4A and B).
Analysis using the CCK-8 kit revealed that the number of MCT4-L929
and control-L929 cells was not significantly different (Fig. S1A). The expression and
phosphorylation of proteins in the IGF1R/PIK3R3/SGK1 axis were
examined in control-L929 cells treated with 500 pg/ml mIGF1 for 1
h. As in Fig. 4C and D, the levels
of IGF1R, p-IGF1R, p-PIK3R3 and p-SGK1 in IGF1-stimulated cells
were comparable to those in MCT4-L929 cells. Phosphorylated/total
protein ratios were shown in Fig.
4E. In the blank group, the ratio of phosphorylated protein to
total protein showed no significant difference between MCT4-L929
and control-L929 cells as the expressions of both total and
phosphorylated proteins of IGF1R, PIK3R3, and SGK1 were increased
in MCT4-L929 cells compared with control-L929 cells (Fig. 4E). In the mIGF1 group, the ratio of
phosphorylated IGF1R and PIK3R3 to their corresponding total
proteins showed no significant difference between MCT4-L929 and
control-L929 cells, but the ratio of phosphorylated SGK1 to total
protein in MCT4-L929 cells was significantly lower than that in
control-L929 cells, which could be attributed to the notable
changes in SGK1 and p-SGK1.
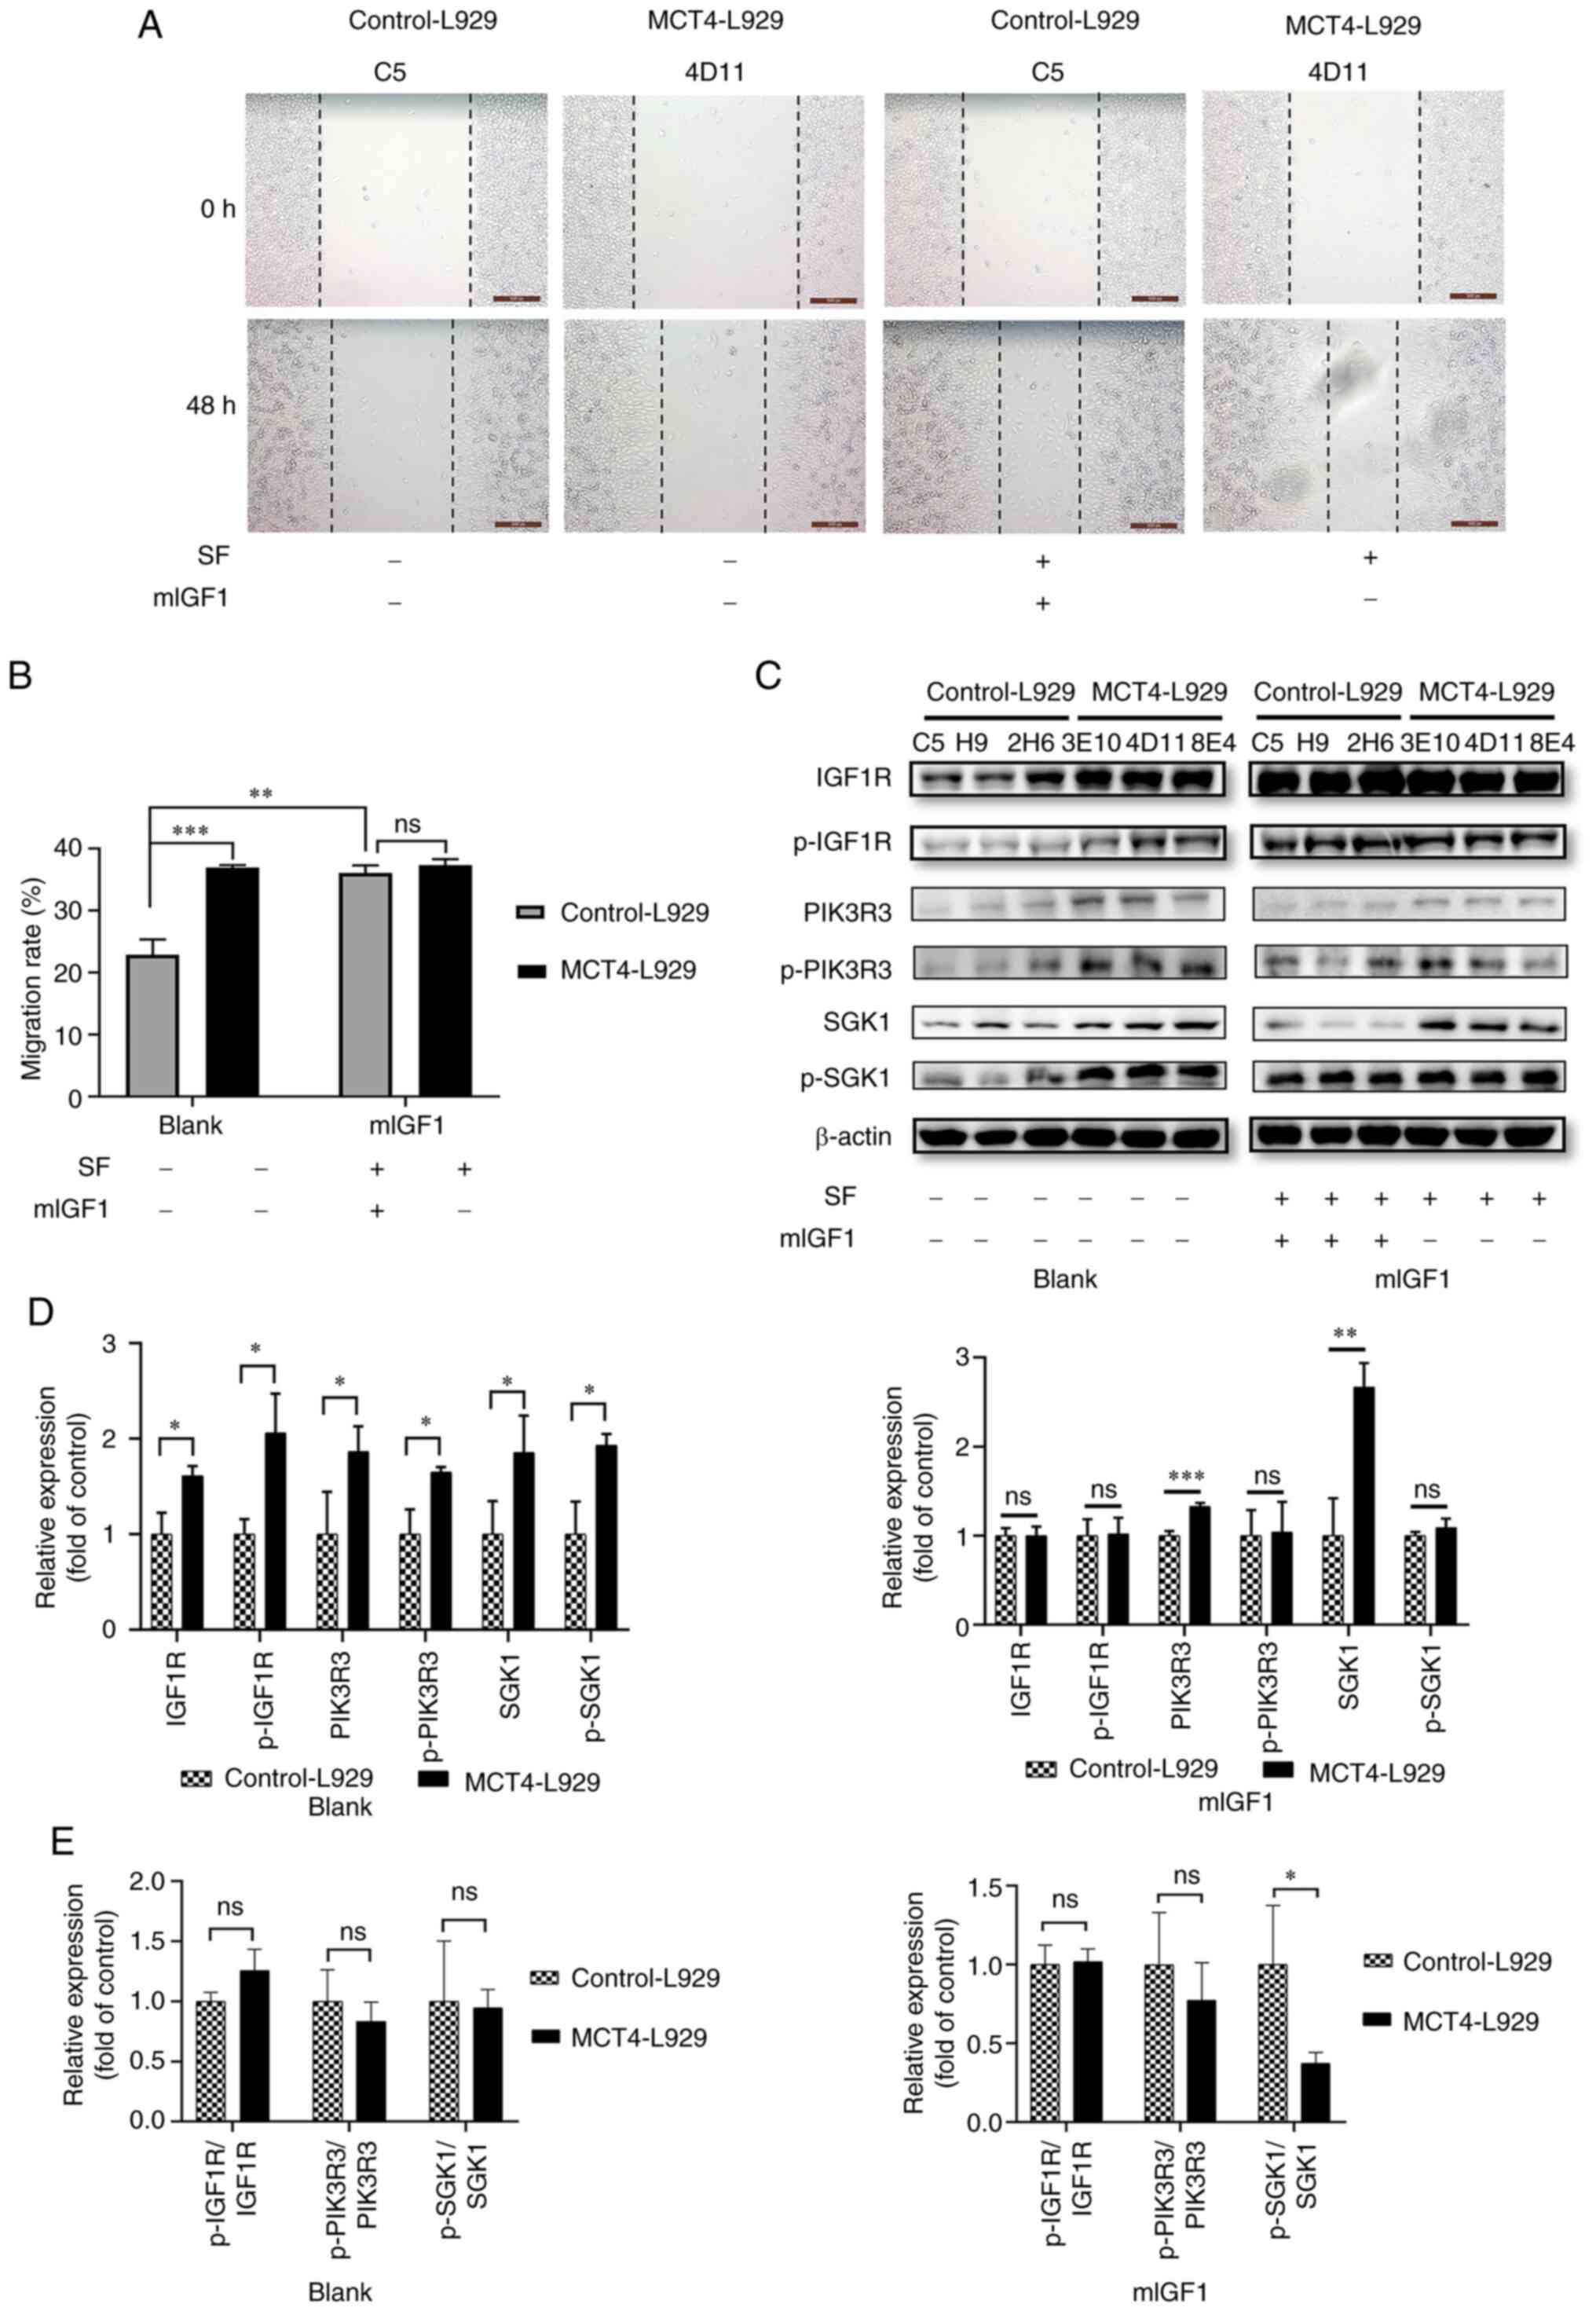 | Figure 4.IGF1 promotes the migration of
control-L929 cells. (A) Representative wound healing images of the
control-L929 and MCT4-L929 cells treated with or without SF and
mIGF1 and (B) quantified wound healing results. (C) Western blot
analysis of the expression levels of IGF1, IGF1R, PIK3R3 and SGK1
and the phosphorylated forms of IGF1R, PIK3R3 and SGK1 in
control-L929 and MCT4-L929 cells supplemented with or without SF
and mIGF1 using β-actin as a loading control and (D)
semi-quantification of the results. The expression level of target
genes in MCT4-L929 cells was normalized to that in control-L929
cells. (E) Phosphorylated/total protein ratio. The means of the
data from three cell lines in each group are shown, and each error
bar represents one standard deviation. Differences between groups
were analyzed using two-tailed unpaired t-tests. *P<0.05,
**P<0.01 and ***P<0.001. ns, not significant; IGF1,
insulin-like growth factor 1; MCT4, monocarboxylate transporter 4;
SF, serum-free starvation overnight before mIGF1 treatment; mIGF1,
mouse IGF1; IGF1R, IGF1 receptor; PIK3R3, phosphoinositide 3-kinase
regulatory subunit 3; SGK1, serum/glucocorticoid regulated kinase
1; p-, phosphorylated. |
Conversely, the expression of IGF1 was knocked down
in the MCT4-L929 cell line 4D11 using a lentivirus system. The
migration-promoting effect of MCT4 in the L929 cells was mitigated
to varying degrees according to the degree of IGF1 knockdown
(Fig. S2). The knockdown of IGF1
expression in the MCT4-L929 (4D11) cells by IGF1 sh1-3 was
evaluated. The results indicated that IGF1 sh-2 and particularly
IGF1 sh-3 decreased the expression level of IGF1. The migration
rate of the MCT4-L929 cells (4D11) treated with IGF1 sh-2 was
downregulated and was significantly downregulated by IGF1 sh-3 to a
level similar to that of control-L929 cells (2H6). CCK-8 assay
indicated that viability of L929 cells was not significantly
affected by the knockdown of IGF1 (Fig. S2B). The phenotypes of the
IGF1-supplemented control-L929 cells and IGF1 knockdown MCT4-L929
cells indicate the critical role of IGF1 in the regulation of L929
cell migration, suggesting that MCT4 may exert its cell
migration-promoting function via IGF1.
Inhibition of IGF1R or SGK1 mitigates
the migration-promoting effect of MCT4
To further examine whether MCT4 exerts its function
through the IGF1/IGF1R pathway, the IGF1R inhibitor PPP and SGK1
inhibitor GSK650394 were used to block the functions of MCT4. The
migration rate of MCT4-L929 cells treated with 300 nM PPP was
significantly downregulated to a level similar to that of
control-L929 cells (Fig. 5A and B).
CCK-8 analysis revealed that the number of MCT4-L929 and
control-L929 cells was not significantly different (Fig. S1B). WB analysis revealed that the
phosphorylation of IGF1R was significantly inhibited in the
MCT4-L929 cells upon PPP treatment (Fig. 5C and D). In the blank group, the
ratio of phosphorylated protein to total protein showed no
significant difference between MCT4-L929 and control-L929 cells as
the expressions of both total and phosphorylated proteins of IGF1R
were increased in MCT4-L929 cells compared with control-L929 cells.
In the PPP group, the ratio of phosphorylated IGF1R protein to
total protein in MCT4-L929 cells was significantly lower than that
in control-L929 cells, which could be attributed to the notable
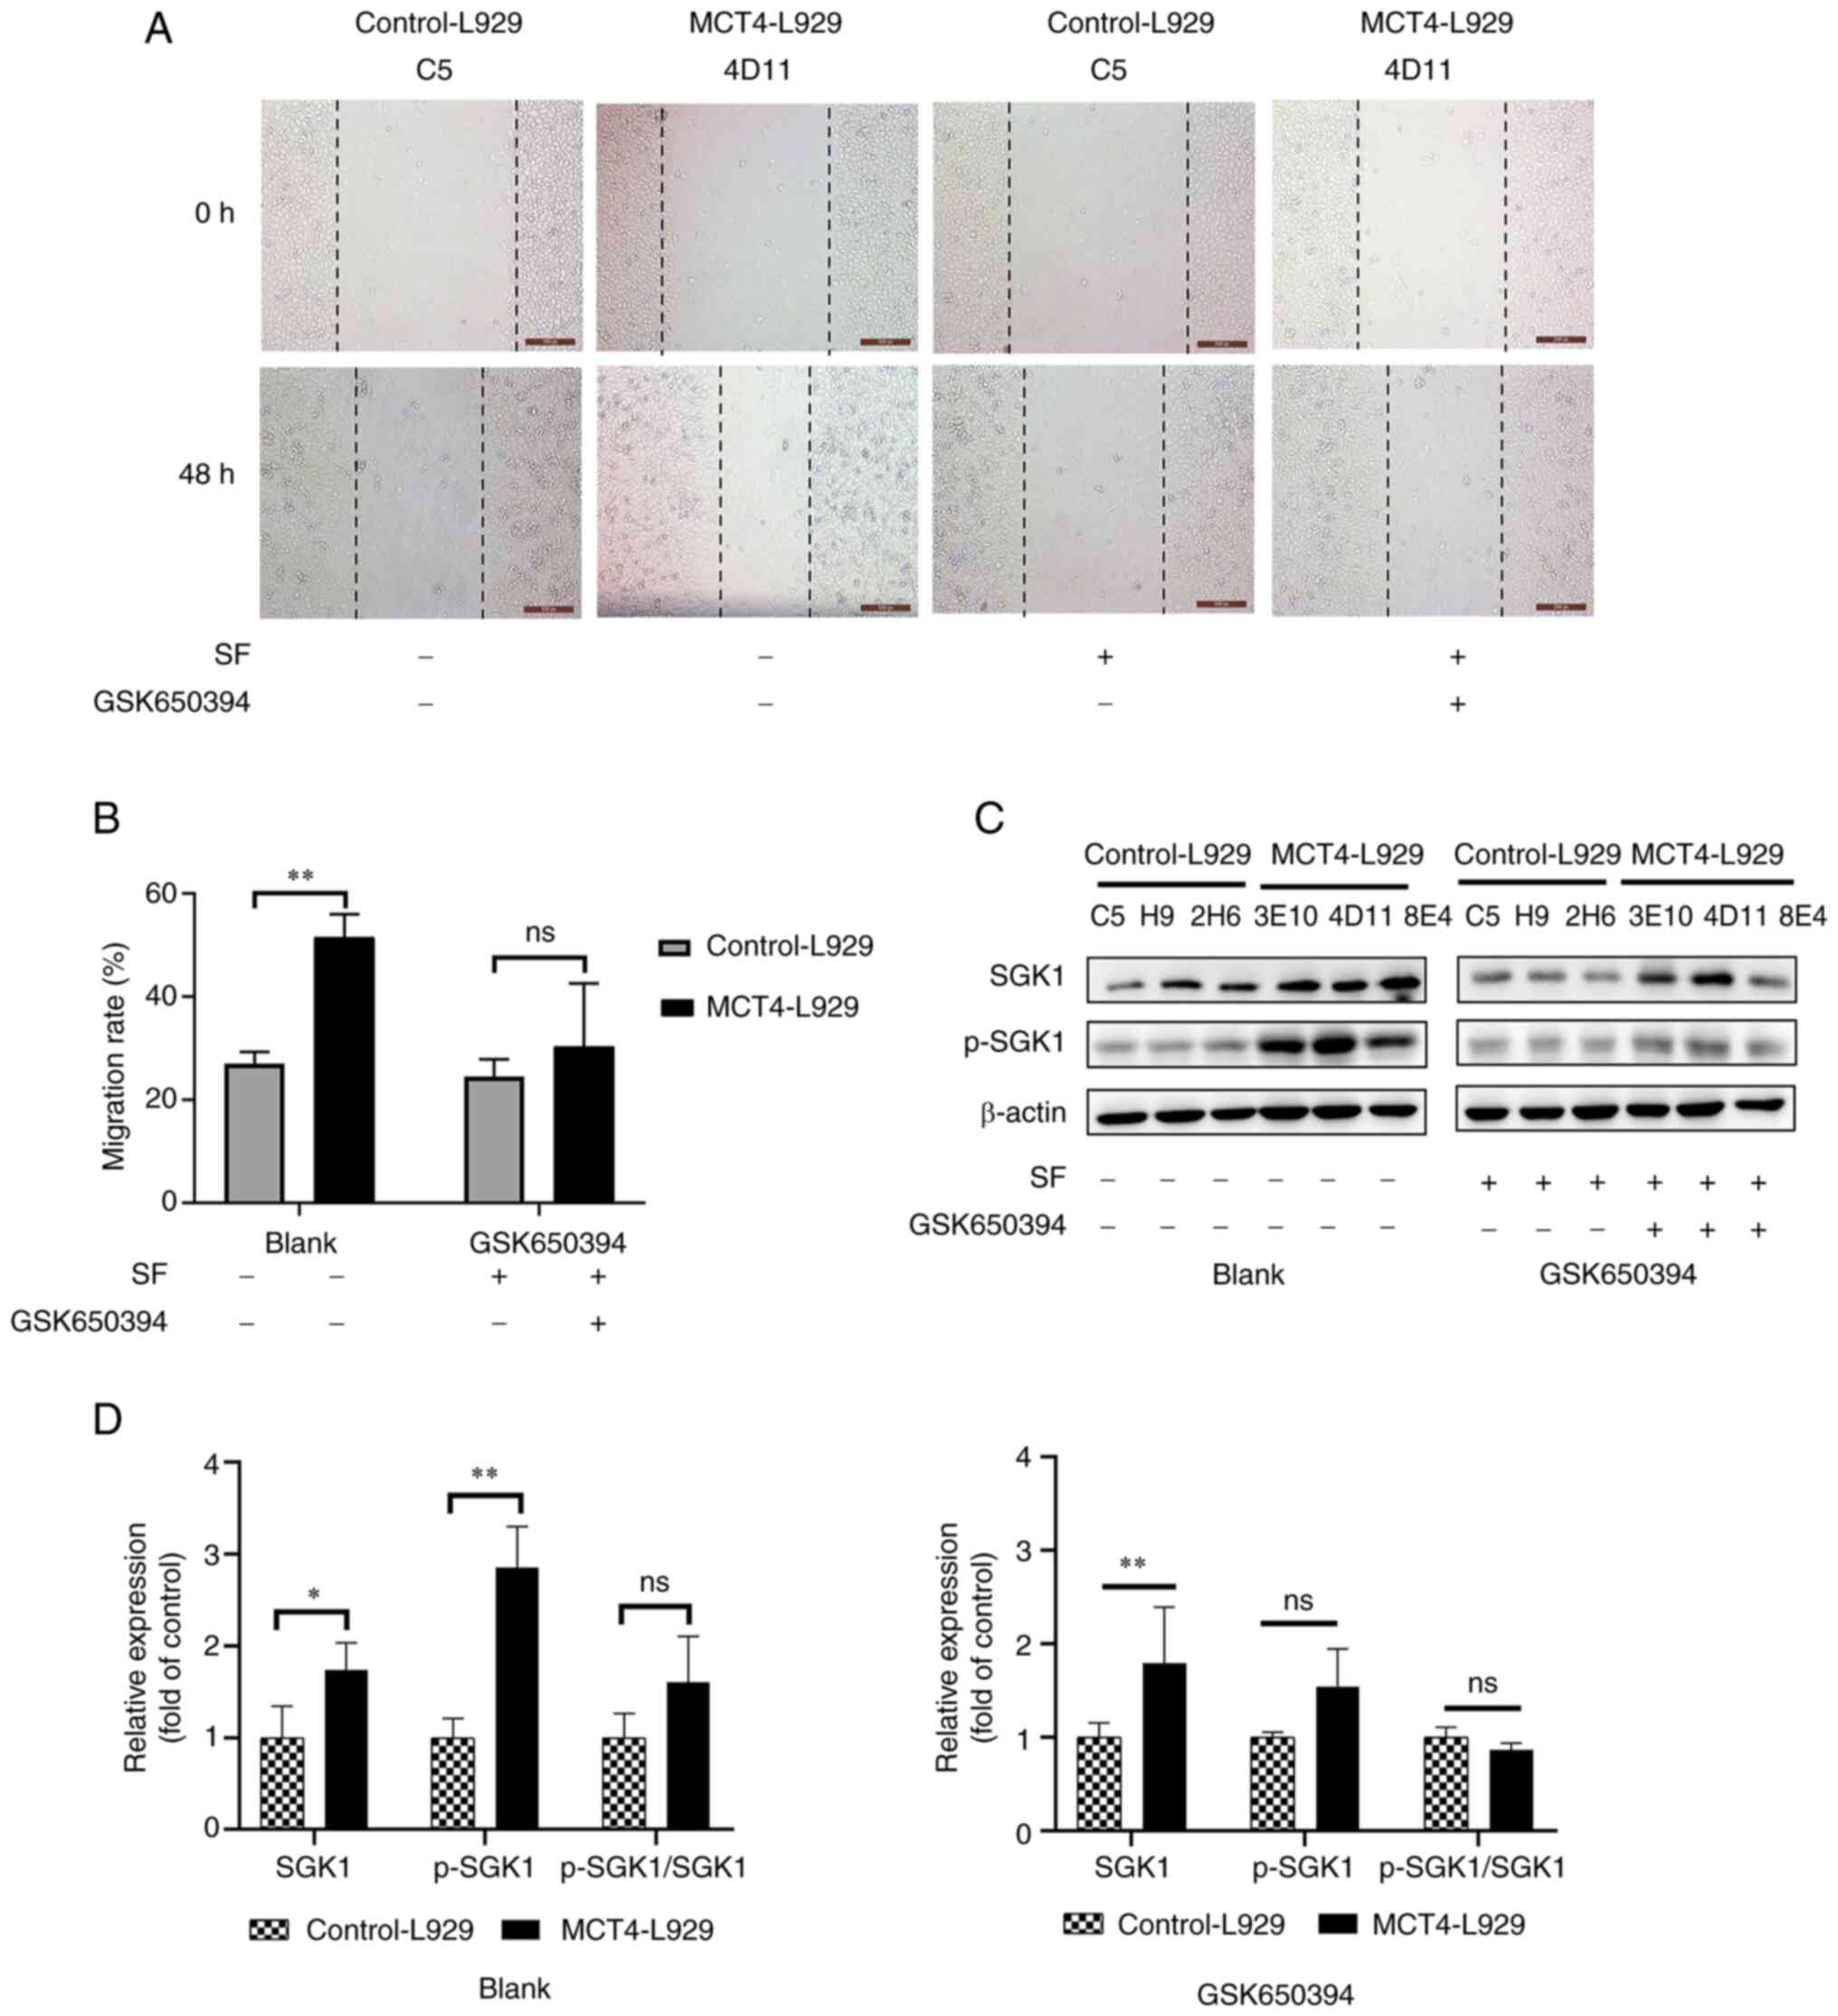
changes in IGF1R and p-IGF1R.SGK1 functions as an essential
AKT-independent mediator of the PI3K/mTOR signaling pathway in
cancer (62). The investigation of
SGK1 in the present study is particularly important as the
relationship between the PI3K-SGK1 pathway and cancer metastasis
has rarely been reported. To the best of our knowledge, the only
previous study that has examined this correlation demonstrated that
dexamethasone enhances breast cancer lung metastasis through the
PI3K-SGK1-connective tissue growth factor pathway (63). The migration rate of MCT4-L929 cells
treated with 5 µM GSK650394 was significantly reduced to a level
similar to that of the control-L929 cells (Fig. 6A and B). CCK-8 analysis revealed
that the number of MCT4-L929 and control-L929 cells was not
significantly different (Fig.
S1C). The phosphorylation of SGK1 in the MCT4-L929 cells was
significantly downregulated after GSK650394 treatment, whereas the
expression of SGK1 was unaffected (Fig.
6C and D). In the blank group, the ratio of phosphorylated
protein to total protein showed no significant difference between
MCT4-L929 and control-L929 cells as the expressions of both total
and phosphorylated proteins of SGK1 were increased in MCT4-L929
cells compared with control-L929 cells. In the GSK650394 group, the
ratio of phosphorylated SGK1 to their corresponding total proteins
also showed no significant difference between MCT4-L929 and
control-L929 cells.
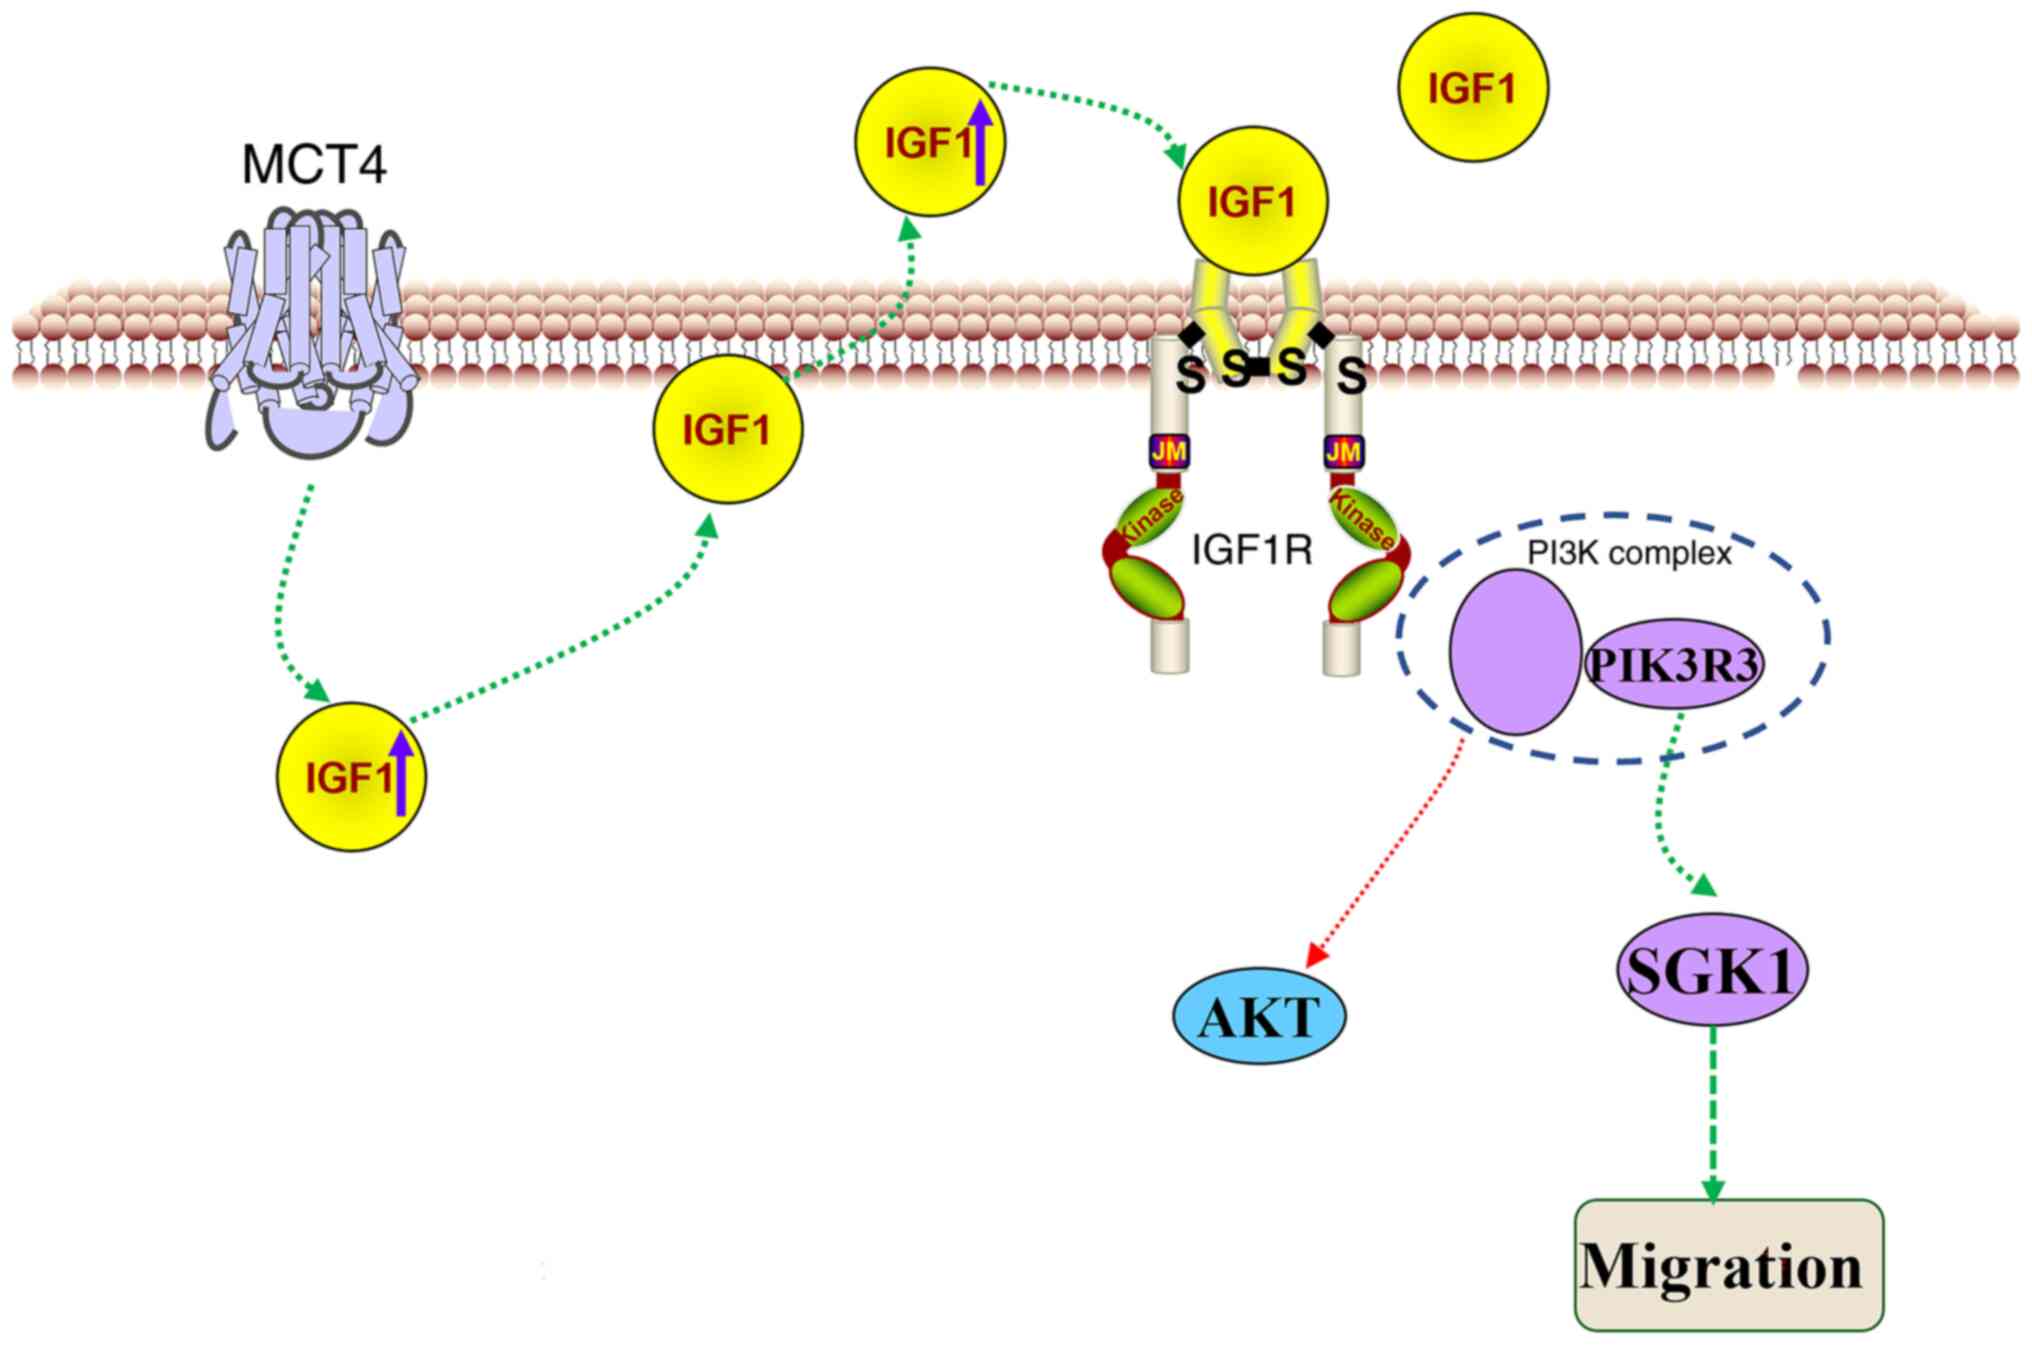
Discussion
In the present study, MCT4-overexpressing L929 cells
were used to investigate the potential pathways and mechanisms
through which MCT4 promotes cell migration. The results revealed
that MCT4 overexpression increases the transcript and protein
levels of IGF1, the mechanism of which is unknown. The expression
of IGF1 activates PIK3R3 and SGK1, which promote the migration of
L929 cells. Therefore, it is suggested that one possible pathway
through which MCT4 exerts its function is the
IGF1/IGF1R/PIK3R3/SGK1 axis (Fig.
7).
Previous studies have demonstrated that silencing
MCT4 in certain tumor cells can reduce the migration and invasion
of the cells, but the mechanism by which MCT4 promotes migration is
inconsistent in different tumor cell models (16,21,64,65).
For instance, MCT4 is reported to promote tumor cell invasion and
migration through the integrin β4-SRC-FAK and MEK-ERK pathways in
oral squamous cell carcinoma (16).
By contrast, MCT4 has been suggested to facilitate the metastasis
of renal cancer cells through integrin β1 (64), while MCT4 has been demonstrated to
promote hepatocellular migration via upregulation of the
trafficking protein particle complex subunit 5 (TRAPPC5) gene
(65). Furthermore, MCT4 has been
shown to promote the invasion of prostate cancer cells via the
regulation of invasion-associated genes, including VEGF, CD147,
MMP2 and MMP9 (21). These findings
are from studies in which MCT4 was silenced in one type of tumor
cell, and the mechanism by which MCT4 promotes migration varies
among the different tumor cell models. Silencing may sometimes be
transient or incomplete; however, in our previous study, MCT4-L929
cell lines were generated by stable transfection and it was
demonstrated that MCT4 promotes the migration and invasion of
non-cancerous L929 cells (24).
Therefore, it is suggested that the upregulated expression of MCT4
may promote the carcinogenesis of L929 cells. In the present study,
the possible mechanism by which MCT4 promotes the migration of L929
cells was investigated. In contrast to previous studies, the
possible mechanism was studied via the overexpression of MCT4
rather than by silencing MCT4, which provides some new information
on the promotion of tumor cell the migration and carcinogenesis by
MCT4.
The present study systematically analyzed the
transcriptome of three MCT4-L929 cell lines and compared it with
that of three control-L929 cell lines. Based on subsequent
validation studies, it is proposed that MCT4 may promote migration
by upregulating the expression of IGF1. Generally, IGF1 activates
its downstream pathway via the phosphorylation of IGF1R. In the
present study, the results indicated that an increase in the
expression of IGF1 may activate the downstream pathway by
increasing the expression and phosphorylation of IGF1R. It has
previously been shown that under hypoxic conditions, the expression
level of IGF1 is significantly upregulated in pancreatic fibroblast
cells and that of IGF1R is upregulated in pancreatic cancer cells
under the same cancer microenvironment, indicating a possible
association between IGF1 and IGF1R expression (50). Although previous studies have
reported that IGF1 or MCT4 promote tumor cell migration, the role
of IGF1 in MCT4-mediated cell migration has not been reported. It
has been shown that IGF1 promotes cell invasion and proliferation
via activation of the IGF1/PI3K/AKT1 pathway (66) and can activate the PI3K/SGK1 pathway
in cells (67). The role of SGK1 in
MCT4-mediated cell migration has not been reported. To the best of
our knowledge, the present study is the first to report that MCT4
overexpression promotes cell migration by upregulating the
expression of IGF1 and activating the IGF1/IGF1R/PIK3R3/SGK1 axis.
The findings of the present study may provide useful insights into
the mechanism underlying MCT4-mediated cell migration and provide
new ideas for the mechanistic investigation of MCT4-promoted tumor
cell metastasis. The findings may also generate new perspectives on
MCT4-mediated carcinogenesis, as promotion of the expression of
IGF1 by MCT4 may mediate cell carcinogenesis. It is hypothesized
that MCT4 may play an important role in the early stages of cancer
progression, in cells that are not already cancerous.
In the present study, the IGF1/IGF1R/PIK3R3/SGK1
axis was identified as a plausible pathway through which MCT4
promotes cell migration. This conclusion was achieved through the
study of a panel of MCT4-overexpressing cell lines compared with
control cell lines. Recently, a potent MCT4-specific inhibitor,
MSC-4381, has been reported that effectively suppresses the efflux
of lactate and decreases cell viability in cells with high MCT4
expression (68). It would be
worthwhile to investigate if MSC-4381 is able to eradicate the
function of MCT4 in activating the IGF1/IGF1R/PIK3R3/SGK1 axis.
This investigation will be undertaken in future studies.
The lack of in vivo validation is one of the
limitations of the present study. In previous studies, the
knockdown of MCT4 expression has been shown to decrease the
migration and invasion of lung cancer, oral squamous,
hepatocellular carcinoma, pancreatic ductal adenocarcinoma,
prostate cancer, glioma, bladder cancer and breast cancer cells
(13,16-19,21-23). However, to date, there are only two relevant
studies on the in vivo testing of MCT4 knockdown tumor cell
lines. In one study, the knockout of MCT4 in the 5637 human bladder
cancer cell line resulted in a significant reduction in the
tumorigenic ability of the cells in nude mice (17). In the other, TRAPPC5 expression was
significantly downregulated following the knockdown of MCT4 in
HCCLM3 highly metastatic liver cancer cells, and the knockdown of
TRAPPC5 in HCCLM3 cells resulted in a significant reduction in the
tumorigenicity of HCCLM3 cells in nude mice (65). Indeed, in a follow-up to the present
study, it is planned to investigate the effect of IGF1
overexpression on the migration of MCT4-L929 cells in vivo.
At present, a MCT4 knockout mouse model has been established which
will be used to compare the migration capability of spontaneous
tumors in knockout and wild-type mice. The in vivo results
will be reported upon completion of the experiments.
IGF1 has been reported to promote cell proliferation
and metastasis, and IGF1 exerts its function through activation of
the PI3K/AKT or STAT3 pathways (44,45,66,69).
However, in the present study, it was discovered that although MCT4
upregulates IGF1, the higher IGF1 expression did not increase the
proliferation of the L929 cells. In addition, the mRNA levels of
Akt1, Akt2 and Akt3 did not show any significant
differences between the MCT4-L929 and control-L929 cells, which
aligns with the results obtained from RNA-seq analysis.
Furthermore, the protein levels of AKT1, AKT2 and AKT3, as well as
their phosphorylation levels, exhibited no discernible variation
between the cell lines. The discrepancy between the present
observations and those of previous reports may originate from the
difference in IGF1 concentration. The concentration of IGF1
reported to promote cell proliferation is generally in the range of
10–100 ng/ml (44,45,66,69).
However, in the present study, the concentration of IGF1 in the
MCT4-L929 medium was only 150–250 pg/ml higher than that in the
control-L929 medium, which is markedly lower than that required to
accelerate proliferation.
The mechanism through which MCT4 increases the
expression of IGF1 is unknown. However, there have been some
interesting reports that may be relevant. It has been demonstrated
that under hypoxic conditions, E74 like ETS transcription factor 3
(also known as epithelium-specific ETS transcription factor 1 and
epithelial-restricted with serine box) promotes tumor angiogenesis
via the upregulation of IGF1 expression and secretion and
consequently improves endothelial cell proliferation and migration
(70). In addition, it has been
shown that IGF1 promotes the stability and expression of HIF1A
(71), and TGF-β1 upregulates MCT4
expression via HIF1A under hypoxic conditions (72). Therefore, the mechanism by which
MCT4 increases the expression of IGF1 is of academic interest and
will be investigated in future studies.
Supplementary Material
Supporting Data
Supporting Data
Acknowledgements
Not applicable.
Funding
Funding: No funding was received.
Availability of data and materials
The RNA-seq raw datasets generated and analyzed
during the current study are available in the National Center for
Biotechnology Information Sequence Read Archive (https://www.ncbi.nlm.nih.gov/bioproject/PRJNA859999).
Other datasets generated and/or analyzed during the current study
are available from the corresponding author on reasonable
request.
Authors' contributions
NM and YZ conceived and designed the study. XZ, SW
and YL performed the experiments and collected and analyzed the
results. HZ, XH, YYu, YC, YYa, XM, HH, and MZ assisted with the
experiments and data analysis. XZ and NM reviewed the literature
and wrote the manuscript. XZ and NM confirm the authenticity of all
the raw data. All authors read and approved the final version of
the manuscript.
Ethics approval and consent to
participate
Not applicable.
Patient consent for publication
Not applicable.
Competing interests
The authors declare that they have no competing
interests.
References
|
1
|
Chaffer C and Weinberg R: A perspective on
cancer cell metastasis. Science. 331:1559–1564. 2011. View Article : Google Scholar : PubMed/NCBI
|
|
2
|
Steeg PS: Tumor metastasis: Mechanistic
insights and clinical challenges. Nat Med. 12:895–904. 2006.
View Article : Google Scholar : PubMed/NCBI
|
|
3
|
Wu Y, Zhang T, Zhang X and Gao Q: Decoding
the complexity of metastasis. Cancer Biol Med. 19:284–288. 2022.
View Article : Google Scholar : PubMed/NCBI
|
|
4
|
Nakamura Y, Fujimoto M, Fukushima S,
Nakamura A, Hayashida N, Takii R, Takaki E, Nakai A and Muto M:
Heat shock factor 1 is required for migration and invasion of human
melanoma in vitro and in vivo. Cancer Lett. 354:329–335. 2014.
View Article : Google Scholar : PubMed/NCBI
|
|
5
|
Chiu WT, Shen SC, Chow JM, Lin CW, Shia LT
and Chen YC: Contribution of reactive oxygen species to
migration/invasion of human glioblastoma cells U87 via
ERK-dependent COX-2/PGE(2) activation. Neurobiol Dis. 37:118–129.
2010. View Article : Google Scholar : PubMed/NCBI
|
|
6
|
Ishimura N, Isomoto H, Bronk SF and Gores
GJ: Trail induces cell migration and invasion in
apoptosis-resistant cholangiocarcinoma cells. Am J Physiol
Gastrointest Liver Physiol. 290:G129–G136. 2006. View Article : Google Scholar : PubMed/NCBI
|
|
7
|
Malla RR and Kiran P: Tumor
microenvironment pathways: Cross regulation in breast cancer
metastasis. Genes Dis. 9:310–324. 2022. View Article : Google Scholar : PubMed/NCBI
|
|
8
|
Mosier JA, Schwager SC, Boyajian DA and
Reinhart-King CA: Cancer cell metabolic plasticity in migration and
metastasis. Clin Exp Metastasis. 38:343–359. 2021. View Article : Google Scholar : PubMed/NCBI
|
|
9
|
Hipolito A, Martins F, Mendes C,
Lopes-Coelho F and Serpa J: Molecular and metabolic reprogramming:
Pulling the strings toward tumor metastasis. Front Oncol.
11:6568512021. View Article : Google Scholar : PubMed/NCBI
|
|
10
|
Lu J: The Warburg metabolism fuels tumor
metastasis. Cancer Metastasis Rev. 38:157–164. 2019. View Article : Google Scholar : PubMed/NCBI
|
|
11
|
Jiang B: Aerobic glycolysis and high level
of lactate in cancer metabolism and microenvironment. Genes Dis.
4:25–27. 2017. View Article : Google Scholar : PubMed/NCBI
|
|
12
|
Contreras-Baeza Y, Sandoval PY, Alarcon R,
Galaz A, Cortés-Molina F, Alegría K, Baeza-Lehnert F, Arce-Molina
R, Guequén A, Flores CA, et al: Monocarboxylate transporter 4
(MCT4) is a high affinity transporter capable of exporting lactate
in high-lactate microenvironments. J Biol Chem. 294:20135–20147.
2019. View Article : Google Scholar : PubMed/NCBI
|
|
13
|
Kong SC, Nohr-Nielsen A, Zeeberg K,
Reshkin SJ, Hoffmann EK, Novak I and Pedersen SF: Monocarboxylate
transporters MCT1 and MCT4 regulate migration and invasion of
pancreatic ductal adenocarcinoma cells. Pancreas. 45:1036–1047.
2016. View Article : Google Scholar : PubMed/NCBI
|
|
14
|
Pinheiro C, Reis RM, Ricardo S,
Longatto-Filho A, Schmitt F and Baltazar F: Expression of
monocarboxylate transporters 1, 2, and 4 in human tumours and their
association with CD147 and CD44. J Biomed Biotechnol.
2010:4276942010. View Article : Google Scholar : PubMed/NCBI
|
|
15
|
Choi JW, Kim Y, Lee JH and Kim YS:
Prognostic significance of lactate/proton symporters MCT1, MCT4,
and their chaperone CD147 expressions in urothelial carcinoma of
the bladder. Urology. 84:245e249–215. 2014. View Article : Google Scholar
|
|
16
|
Zhu J, Wu YN, Zhang W, Zhang XM, Ding X,
Li HQ, Geng M, Xie ZQ and Wu HM: Monocarboxylate transporter 4
facilitates cell proliferation and migration and is associated with
poor prognosis in oral squamous cell carcinoma patients. PLoS One.
9:e879042014. View Article : Google Scholar : PubMed/NCBI
|
|
17
|
Dong S, Zheng L and Jiang T: Loss of
Lactate/Proton monocarboxylate transporter 4 induces ferroptosis
via the AMPK/ACC pathway and inhibition of autophagy on human
bladder cancer 5637 cell line. J Oncol. 2023:28303062023.
View Article : Google Scholar : PubMed/NCBI
|
|
18
|
Izumi H, Takahashi M, Uramoto H, Nakayama
Y, Oyama T, Wang KY, Sasaguri Y, Nishizawa S and Kohno K:
Monocarboxylate transporters 1 and 4 are involved in the invasion
activity of human lung cancer cells. Cancer Sci. 102:1007–1013.
2011. View Article : Google Scholar : PubMed/NCBI
|
|
19
|
Gao HJ, Zhao MC, Zhang YJ, Zhou DS, Xu L,
Li GB, Chen MS and Liu J: Monocarboxylate transporter 4 predicts
poor prognosis in hepatocellular carcinoma and is associated with
cell proliferation and migration. J Cancer Res Clin Oncol.
141:1151–1162. 2015. View Article : Google Scholar : PubMed/NCBI
|
|
20
|
Kong S, Nøhr-Nielsen A, Zeeberg K, Reshkin
SJ, Hoffmann EK, Novak I and Pedersen SF: Monocarboxylate
transporters MCT1 and MCT4 regulate migration and invasion of
pancreatic ductal adenocarcinoma cells. Pancreas. 45:1036–1047.
2016. View Article : Google Scholar : PubMed/NCBI
|
|
21
|
Sun Q, Hu LL and Fu Q: MCT4 promotes cell
proliferation and invasion of castration-resistant prostate cancer
PC-3 cell line. EXCLI J. 18:187–194. 2019.PubMed/NCBI
|
|
22
|
Reuss AM, Groos D, Ghoochani A, Buchfelder
M and Savaskan N: MCT4 promotes tumor malignancy in F98 glioma
Cells. J Oncol. 2021:66555292021. View Article : Google Scholar : PubMed/NCBI
|
|
23
|
Li Z, Wu Q and Sun S, Wu J, Li J, Zhang Y,
Wang C, Yuan J and Sun S: Monocarboxylate transporters in breast
cancer and adipose tissue are novel biomarkers and potential
therapeutic targets. Biochem Biophys Res Commun. 501:962–967. 2018.
View Article : Google Scholar : PubMed/NCBI
|
|
24
|
Li X, Zhou X, Liu Y, Fan J, Huo H, Yao J,
Wang L and Ma N: Overexpression of monocarboxylate transporter 4
promotes the migration and invasion of non-carcinogenic L929
fibroblast cells. Oncol Lett. 21:442021. View Article : Google Scholar : PubMed/NCBI
|
|
25
|
Hu D, Zheng Y, Ou X, Zhang L, Du X and Shi
S: Integrated analysis of anti-tumor roles of BAP1 in osteosarcoma.
Front Oncol. 12:9739142022. View Article : Google Scholar : PubMed/NCBI
|
|
26
|
Tang Y, Li M, Wang J, Pan Y and Wu FX:
CytoNCA: A cytoscape plugin for centrality analysis and evaluation
of protein interaction networks. Biosystems. 127:67–72. 2015.
View Article : Google Scholar : PubMed/NCBI
|
|
27
|
Girnita A, Girnita L, del Prete F,
Bartolazzi A, Larsson O and Axelson M: Cyclolignans as inhibitors
of the insulin-like growth factor-1 receptor and malignant cell
growth. Cancer Res. 64:236–242. 2004. View Article : Google Scholar : PubMed/NCBI
|
|
28
|
Bieghs L, Lub S, Fostier K, Maes K, Van
Valckenborgh E, Menu E, Johnsen HE, Overgaard MT, Larsson O,
Axelson M, et al: The IGF-1 receptor inhibitor picropodophyllin
potentiates the anti-myeloma activity of a BH3-mimetic. Oncotarget.
5:11193–11208. 2014. View Article : Google Scholar : PubMed/NCBI
|
|
29
|
Kong YL, Shen Y, Ni J, Shao DC, Miao NJ,
Xu JL, Zhou L, Xue H, Zhang W, Wang XX and Lu LM: Insulin
deficiency induces rat renal mesangial cell dysfunction via
activation of IGF-1/IGF-1R pathway. Acta Pharmacol Sin. 37:217–227.
2016. View Article : Google Scholar : PubMed/NCBI
|
|
30
|
Sherk AB, Frigo DE, Schnackenberg CG, Bray
JD, Laping NJ, Trizna W, Hammond M, Patterson JR, Thompson SK,
Kazmin D, et al: Development of a small-molecule serum- and
glucocorticoid-regulated kinase-1 antagonist and its evaluation as
a prostate cancer therapeutic. Cancer Res. 68:7475–7483. 2008.
View Article : Google Scholar : PubMed/NCBI
|
|
31
|
Mansley MK and Wilson SM: Effects of
nominally selective inhibitors of the kinases PI3K, SGK1 and PKB on
the insulin-dependent control of epithelial Na+ absorption. Br J
Pharmacol. 161:571–588.. 2010. View Article : Google Scholar : PubMed/NCBI
|
|
32
|
Harshitha R and Arunraj DR: Real-time
quantitative PCR: A tool for absolute and relative quantification.
Biochem Mol Biol Educ. 49:800–812. 2021. View Article : Google Scholar : PubMed/NCBI
|
|
33
|
Rodriguez LG, Wu X and Guan JL:
Wound-healing assay. Methods Mol Biol. 294:23–29. 2005.PubMed/NCBI
|
|
34
|
Li Q, Xu L, Li Y, Yang R, Qiao Q, Wang Y,
Wang L, Guo Y and Guo C: P2RY14 is a potential biomarker of tumor
microenvironment immunomodulation and favorable prognosis in
patients with head and neck cancer. Front Genet. 12:6707462021.
View Article : Google Scholar : PubMed/NCBI
|
|
35
|
Cho J, Yusuf R, Kook S, Attar E, Lee D,
Park B, Cheng T, Scadden DT and Lee BC: Purinergic P2Y(1)(4)
receptor modulates stress-induced hematopoietic stem/progenitor
cell senescence. J Clin Invest. 124:3159–3171. 2014. View Article : Google Scholar : PubMed/NCBI
|
|
36
|
Xu T, Xu S, Yao Y, Chen X, Zhang Q, Zhao
X, Wang X, Zhu J, Liu N, Zhang J, et al: P2RY14 downregulation in
lung adenocarcinoma: A potential therapeutic target associated with
immune infiltration. J Thorac Dis. 14:515–535. 2022. View Article : Google Scholar : PubMed/NCBI
|
|
37
|
Meng L, He X, Hong Q, Qiao B, Zhang X, Wu
B, Zhang X, Wei Y, Li J, Ye Z and Xiao Y: CCR4, CCR8, and P2RY14 as
prognostic factors in head and neck squamous cell carcinoma are
involved in the remodeling of the tumor microenvironment. Front
Oncol. 11:6181872021. View Article : Google Scholar : PubMed/NCBI
|
|
38
|
Wang H, Wang X, Xu L, Zhang J and Cao H:
High expression levels of pyrimidine metabolic rate-limiting
enzymes are adverse prognostic factors in lung adenocarcinoma: A
study based on the cancer genome atlas and gene expression omnibus
datasets. Purinergic Signal. 16:347–366. 2020. View Article : Google Scholar : PubMed/NCBI
|
|
39
|
Shah K, Moharram SA and Kazi JU: Acute
leukemia cells resistant to PI3K/mTOR inhibition display
upregulation of P2RY14 expression. Clin Epigenetics. 10:832018.
View Article : Google Scholar : PubMed/NCBI
|
|
40
|
Woods LT, Forti KM, Shanbhag VC, Camden JM
and Weisman GA: P2Y receptors for extracellular nucleotides:
Contributions to cancer progression and therapeutic implications.
Biochem Pharmacol. 187:1144062021. View Article : Google Scholar : PubMed/NCBI
|
|
41
|
Cohen P: Serum insulin-like growth
factor-i levels and prostate cancer risk-interpreting the evidence.
J Natl Cancer Inst. 90:876–879. 1998. View Article : Google Scholar : PubMed/NCBI
|
|
42
|
Wang X, Zhu Q, Lin Y, Wu L, Wu X, Wang K,
He Q, Xu C, Wan X and Wang X: Crosstalk between TEMs and
endothelial cells modulates angiogenesis and metastasis via
IGF1-IGF1R signalling in epithelial ovarian cancer. Br J Cancer.
117:1371–1382. 2017. View Article : Google Scholar : PubMed/NCBI
|
|
43
|
Peyrat J, Bonneterre J, Vennin P, Jammes
H, Beuscart R, Hecquet B, Djiane J, Lefebvre J and Demaille A:
Insulin-like growth factor 1 receptors (IGF1-R) and IGF1 in human
breast tumors. J Steroid Biochem Mol Biol. 37:823–827. 1990.
View Article : Google Scholar : PubMed/NCBI
|
|
44
|
Liu Y, Nelson MV, Bailey C, Zhang P, Zheng
P, Dome JS, Liu Y and Wang Y: Targeting the HIF-1α-IGFBP2 axis
therapeutically reduces IGF1-AKT signaling and blocks the growth
and metastasis of relapsed anaplastic Wilms tumor. Oncogene.
40:4809–4819. 2021. View Article : Google Scholar : PubMed/NCBI
|
|
45
|
Yang L, Tan Z, Li Y, Zhang X, Wu Y, Xu B
and Wang M: Insulin-like growth factor 1 promotes proliferation and
invasion of papillary thyroid cancer through the STAT3 pathway. J
Clin Lab Anal. 34:e235312020. View Article : Google Scholar : PubMed/NCBI
|
|
46
|
Chen ZL, Li XN, Ye CX, Chen HY and Wang
ZJ: Elevated levels of circRUNX1 in colorectal cancer promote cell
growth and metastasis via miR-145-5p/IGF1 signalling. Onco Targets
Ther. 13:4035–4048. 2020. View Article : Google Scholar : PubMed/NCBI
|
|
47
|
Wang H, Tang C, Na M, Ma W, Jiang Z, Gu Y,
Ma G, Ge H, Shen H and Lin Z: miR-422a inhibits glioma
proliferation and invasion by targeting IGF1 and IGF1R. Oncol Res.
25:187–194. 2017. View Article : Google Scholar : PubMed/NCBI
|
|
48
|
Lu X, Song X, Hao X, Liu X, Zhang X, Yuan
N, Ma H and Zhang Z: MiR-186-3p attenuates tumorigenesis of
cervical cancer by targeting IGF1. World J Surg Oncol. 19:2072021.
View Article : Google Scholar : PubMed/NCBI
|
|
49
|
Nagle AM, Levine KM, Tasdemir N, Scott JA,
Burlbaugh K, Kehm J, Katz TA, Boone DN, Jacobsen BM, Atkinson JM,
et al: Loss of E-cadherin enhances IGF1-IGF1R pathway activation
and sensitizes breast cancers to anti-IGF1R/InsR inhibitors. Clin
Cancer Res. 24:5165–5177. 2018. View Article : Google Scholar : PubMed/NCBI
|
|
50
|
Hirakawa T, Yashiro M, Doi Y, Kinoshita H,
Morisaki T, Fukuoka T, Hasegawa T, Kimura K, Amano R and Hirakawa
K: Pancreatic fibroblasts stimulate the motility of pancreatic
cancer cells through IGF1/IGF1R signaling under hypoxia. PLoS One.
11:e01599122016. View Article : Google Scholar : PubMed/NCBI
|
|
51
|
Fürstenberger G and Senn HJ: Insulin-like
growth factors and cancer. Lancet Oncol. 3:298–302. 2002.
View Article : Google Scholar : PubMed/NCBI
|
|
52
|
Matà R, Palladino C, Nicolosi M, Lo Presti
AR, Malaguarnera R, Ragusa M, Sciortino D, Morrione A, Maggiolini
M, Vella V and Belfiore A: IGF-I induces upregulation of DDR1
collagen receptor in breast cancer cells by suppressing MIR-199a-5p
through the PI3K/AKT pathway. Oncotarget. 7:7683–7700. 2016.
View Article : Google Scholar : PubMed/NCBI
|
|
53
|
Zhou J, Chen G, Tang Y, Sinha RA, Wu Y,
Yap CS, Wang G, Hu J, Xia X, Tan P, et al: Genetic and
bioinformatic analyses of the expression and function of PI3K
regulatory subunit PIK3R3 in an Asian patient gastric cancer
library. BMC Med Genomics. 5:1–8. 2012. View Article : Google Scholar : PubMed/NCBI
|
|
54
|
Zhu Y, Zhao H, Rao M and Xu S:
MicroRNA-365 inhibits proliferation, migration and invasion of
glioma by targeting PIK3R3. Oncol Rep. 37:2185–2192. 2017.
View Article : Google Scholar : PubMed/NCBI
|
|
55
|
Sun H and Feng X: MicroRNA-367 directly
targets PIK3R3 to inhibit proliferation and invasion of oral
carcinoma cells. Biosci Rep. 40:BSR201938672020. View Article : Google Scholar : PubMed/NCBI
|
|
56
|
Qi J, Wang WW, Chen W, Lu WY and Shang AQ:
Mechanism of miR-137 regulating migration and invasion of melanoma
cells by targeting PIK3R3 gene. J Cell Biochem. 120:8393–8400.
2018. View Article : Google Scholar : PubMed/NCBI
|
|
57
|
Bruhn MA, Pearson RB, Hannan RD and
Sheppard KE: Second AKT: The rise of SGK in cancer signalling.
Growth Factors. 28:394–408. 2010. View Article : Google Scholar : PubMed/NCBI
|
|
58
|
Sang Y, Kong P, Zhang S, Zhang L, Cao Y,
Duan X, Sun T, Tao Z and Liu W: SGK1 in human cancer: Emerging
roles and mechanisms. Front Oncol. 10:6087222020. View Article : Google Scholar : PubMed/NCBI
|
|
59
|
Liang X, Lan C, Jiao G, Fu W, Long X, An
Y, Wang K, Zhou J, Chen T, Li Y, et al: Therapeutic inhibition of
SGK1 suppresses colorectal cancer. Exp Mol Med. 49:e3992017.
View Article : Google Scholar : PubMed/NCBI
|
|
60
|
Greenawalt EJ, Edmonds MD, Jain N, Adams
CM, Mitra R and Eischen CM: Targeting of SGK1 by miR-576-3p
inhibits lung adenocarcinoma migration and invasion. Mol Cancer
Res. 17:289–298. 2019. View Article : Google Scholar : PubMed/NCBI
|
|
61
|
Liu W, Wang X, Wang Y, Dai Y, Xie Y, Ping
Y, Yin B, Yu P, Liu Z, Duan X, et al: SGK1 inhibition-induced
autophagy impairs prostate cancer metastasis by reversing EMT. J
Exp Clin Cancer Res. 37:732018. View Article : Google Scholar : PubMed/NCBI
|
|
62
|
Zhu R, Yang G, Cao Z, Shen K, Zheng L,
Xiao J, You L and Zhang T: The prospect of serum and
glucocorticoid-inducible kinase 1 (SGK1) in cancer therapy: A
rising star. Ther Adv Med Oncol. 12:17588359209409462020.
View Article : Google Scholar : PubMed/NCBI
|
|
63
|
Zhang Y, Shi G, Zhang H, Xiong Q, Cheng F,
Wang H, Luo J, Zhang Y, Shi P, Xu J, et al: Dexamethasone enhances
the lung metastasis of breast cancer via a PI3K-SGK1-CTGF pathway.
Oncogene. 40:5367–5378. 2021. View Article : Google Scholar : PubMed/NCBI
|
|
64
|
Gallagher SM, Castorino JJ and Philp NJ:
Interaction of monocarboxylate transporter 4 with beta1-integrin
and its role in cell migration. Am J Physiol Cell Physiol.
296:C414–C421. 2009. View Article : Google Scholar : PubMed/NCBI
|
|
65
|
Niu Z, Yang F, Li H, Wang J, Ni Q, Ma C,
Zhu H, Chang H, Zhou X, Lu J and Gao H: MCT4 promotes
hepatocellular carcinoma progression by upregulating TRAPPC5 gene.
J Hepatocell Carcinoma. 9:289–300. 2022. View Article : Google Scholar : PubMed/NCBI
|
|
66
|
Ma J, Sawai H, Matsuo Y, Ochi N, Yasuda A,
Takahashi H, Wakasugi T, Funahashi H, Sato M and Takeyama H: IGF-1
mediates PTEN suppression and enhances cell invasion and
proliferation via activation of the IGF-1/PI3K/Akt signaling
pathway in pancreatic cancer cells. J Surg Res. 160:90–101. 2010.
View Article : Google Scholar : PubMed/NCBI
|
|
67
|
Cheng CJ and Huang CL: Activation of
PI3-kinase stimulates endocytosis of ROMK via Akt1/SGK1-dependent
phosphorylation of WNK1. J Am Soc Nephrol. 22:460–471. 2011.
View Article : Google Scholar : PubMed/NCBI
|
|
68
|
Heinrich T, Sala-Hojman A, Ferretti R,
Petersson C, Minguzzi S, Gondela A, Ramaswamy S, Bartosik A,
Czauderna F, Crowley L, et al: Discovery of
5-2-[5-Chloro-2-(5-ethoxyquinoline-8-sulfonamido)phenyl]ethynyl-4-methoxypyridine-2-carboxylic
acid, a highly selective in vivo useable chemical probe to dissect
MCT4 biology. J Med Chem. 64:11904–11933. 2021. View Article : Google Scholar : PubMed/NCBI
|
|
69
|
Qiang YW, Yao L, Tosato G and Rudikoff S:
Insulin-like growth factor I induces migration and invasion of
human multiple myeloma cells. Blood. 103:301–308. 2004. View Article : Google Scholar : PubMed/NCBI
|
|
70
|
Seo SH, Hwang SY, Hwang S, Han S, Park H,
Lee YS, Rho SB and Kwon Y: Hypoxia-induced ELF3 promotes tumor
angiogenesis through IGF1/IGF1R. EMBO Rep. 23:e529772022.
View Article : Google Scholar : PubMed/NCBI
|
|
71
|
Fukuda R, Hirota K, Fan F, Jung YD, Ellis
LM and Semenza GL: Insulin-like growth factor 1 induces
hypoxia-inducible factor 1-mediated vascular endothelial growth
factor expression, which is dependent on MAP kinase and
phosphatidylinositol 3-kinase signaling in colon cancer cells. J
Biol Chem. 277:38205–38211. 2002. View Article : Google Scholar : PubMed/NCBI
|
|
72
|
Jena B, Das C, Banerjee I, Bharadwaj D,
Majumder R, Das S, Biswas A, Kundu M, Roy PK, Kundu CN and Mandal
M: TGF-β1 induced autophagy in cancer associated fibroblasts during
hypoxia contributes EMT and glycolysis via MCT4 upregulation. Exp
Cell Res. 417:1131952022. View Article : Google Scholar : PubMed/NCBI
|