Introduction
Lung cancer is one of the most common cancer types,
with high morbidity and mortality worldwide. Lung adenocarcinoma
(LUAD) is a prevalent pathological subtype of lung cancer,
accounting for >40% of all lung cancers. However, the 5-year
survival rate at the advanced stage is only 15% (1,2). In
recent years, numerous studies have been conducted to explore key
candidate biomarkers to guide clinicians, and multiple molecular
targeted therapies have been widely adopted in clinical practice,
which have markedly improved patients' overall survival (OS). Such
biomarkers include EGFR mutations, anaplastic lymphoma kinase
mutations and ROS proto-oncogene 1 rearrangement (3–5).
However, due to the heterogeneity of tumors and drug resistance of
LUAD, the recurrence and 5-year OS rates remain poor (6,7).
Therefore, the investigation of more biomarkers in LUAD may lead to
the identification of new molecular targets for its treatment. For
that reason, it is imperative to further explore and identify more
therapeutic targets for LUAD.
Forkhead box M1 (FOXM1) is a transcription factor of
the forkhead family, which has a critical role in numerous
physiological processes, such as cell proliferation and
differentiation, and organ development (8,9).
Numerous studies have indicated that FOXM1 is highly expressed in
several solid malignant tumors and associated with poor prognosis,
such as cervical, gastric and non-small cell lung cancer (10–12).
The centromere protein F (CENPF) is a nuclear antigen that is
associated with the cell cycle and is upregulated in hepatocellular
carcinoma and breast cancer (13,14). A
recent study found that FOXM1 and CENPF were co-expressed and
correlated with aggressive behavior in hepatocellular carcinoma
(15). It has been reported that
CENPF is a downstream target of FOXM1 and is regulated by FOXM1
(16). In addition, Aytes et
al (17) reported that FOXM1
and CENPF were able to promote tumor growth and metastasis,
indicating that they were biomarkers of poor prognosis in prostate
cancer. However, the role of FOXM1 and CENPF in LUAD has remained
to be determined.
In the present study, FOXM1 and CENPF were found to
be upregulated and correlated with poor prognosis in LUAD through
weighted gene co-expression network analysis (WGCNA),
univariate/multivariate Cox regression analysis and Kaplan-Meier
analysis (18). In addition, FOXM1
and CENPF expression were validated in clinicopathological
specimens. Furthermore, the functional roles of FOXM1 and CENPF in
cell proliferation and migration were studied in vitro by
knocking down the above genes. Finally, the present study indicated
that FOXM1 and CENPF may serve as novel prognostic biomarkers and
therapeutic targets of LUAD.
Materials and methods
Data collection and preprocessing
All the raw data of series matrix files and clinical
information from the GSE41271 (19), GSE42127 (20) and GSE32863 (21) datasets were downloaded from the Gene
Expression Omnibus (GEO) database (https://www.ncbi.nlm.nih.gov/geo/; accessed on 3 June
2022). The three matrix files originated from the GPL6884 Illumina
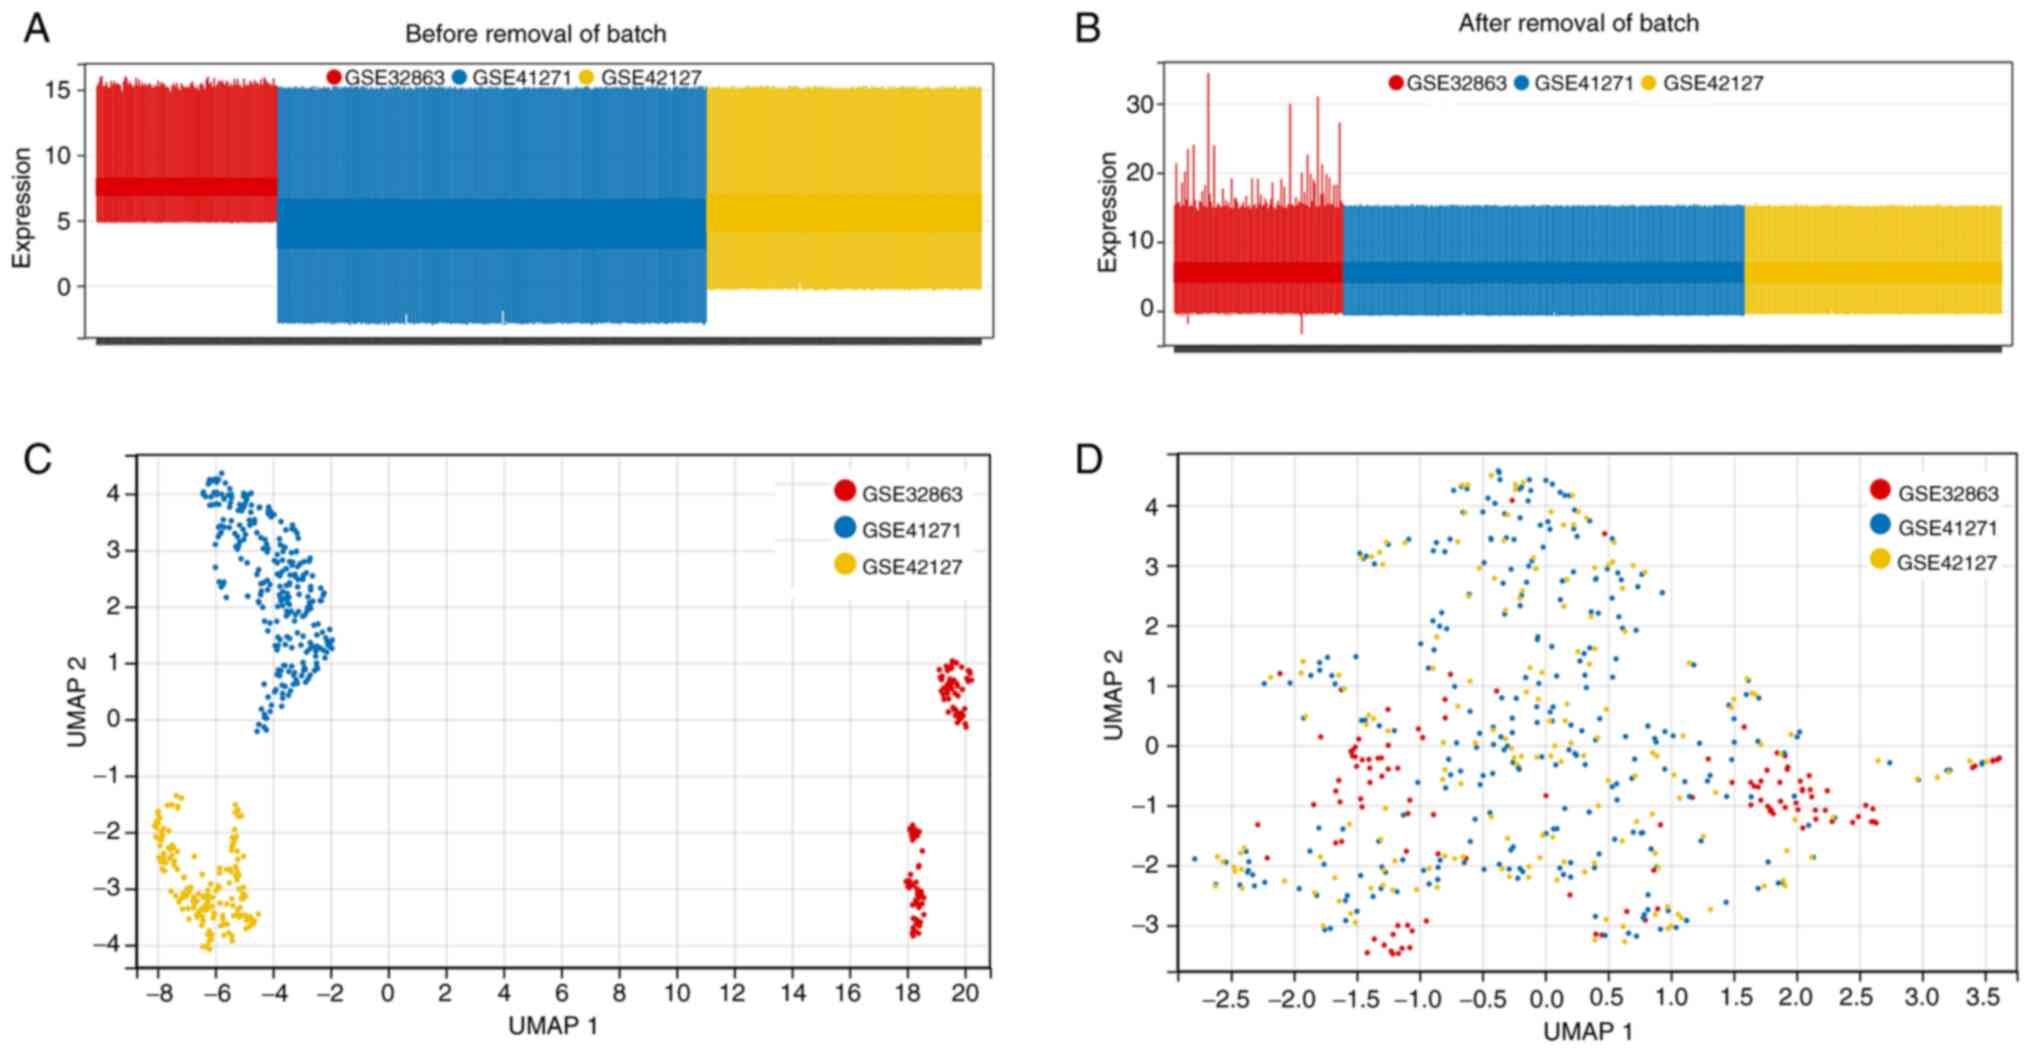
HumanWG-6 v3.0 Expression Bead Chip platform. After a series of
normalizations using the InSilicoMerging R package, the batch
effect among the three microarray datasets was removed using
empirical Bayes methods and the ‘combat’ algorithm. Finally, the
three datasets were merged into one big matrix file. Next, samples
from patients with squamous carcinoma, missing age of patients, OS
of <1 month and information with ambiguity were eliminated.
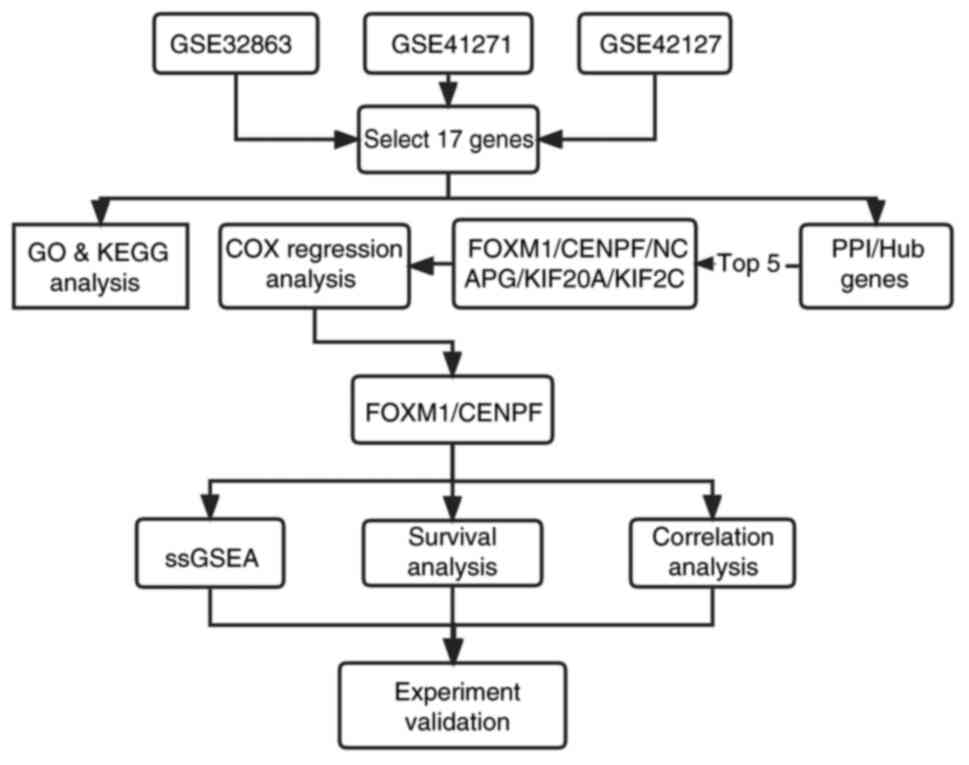
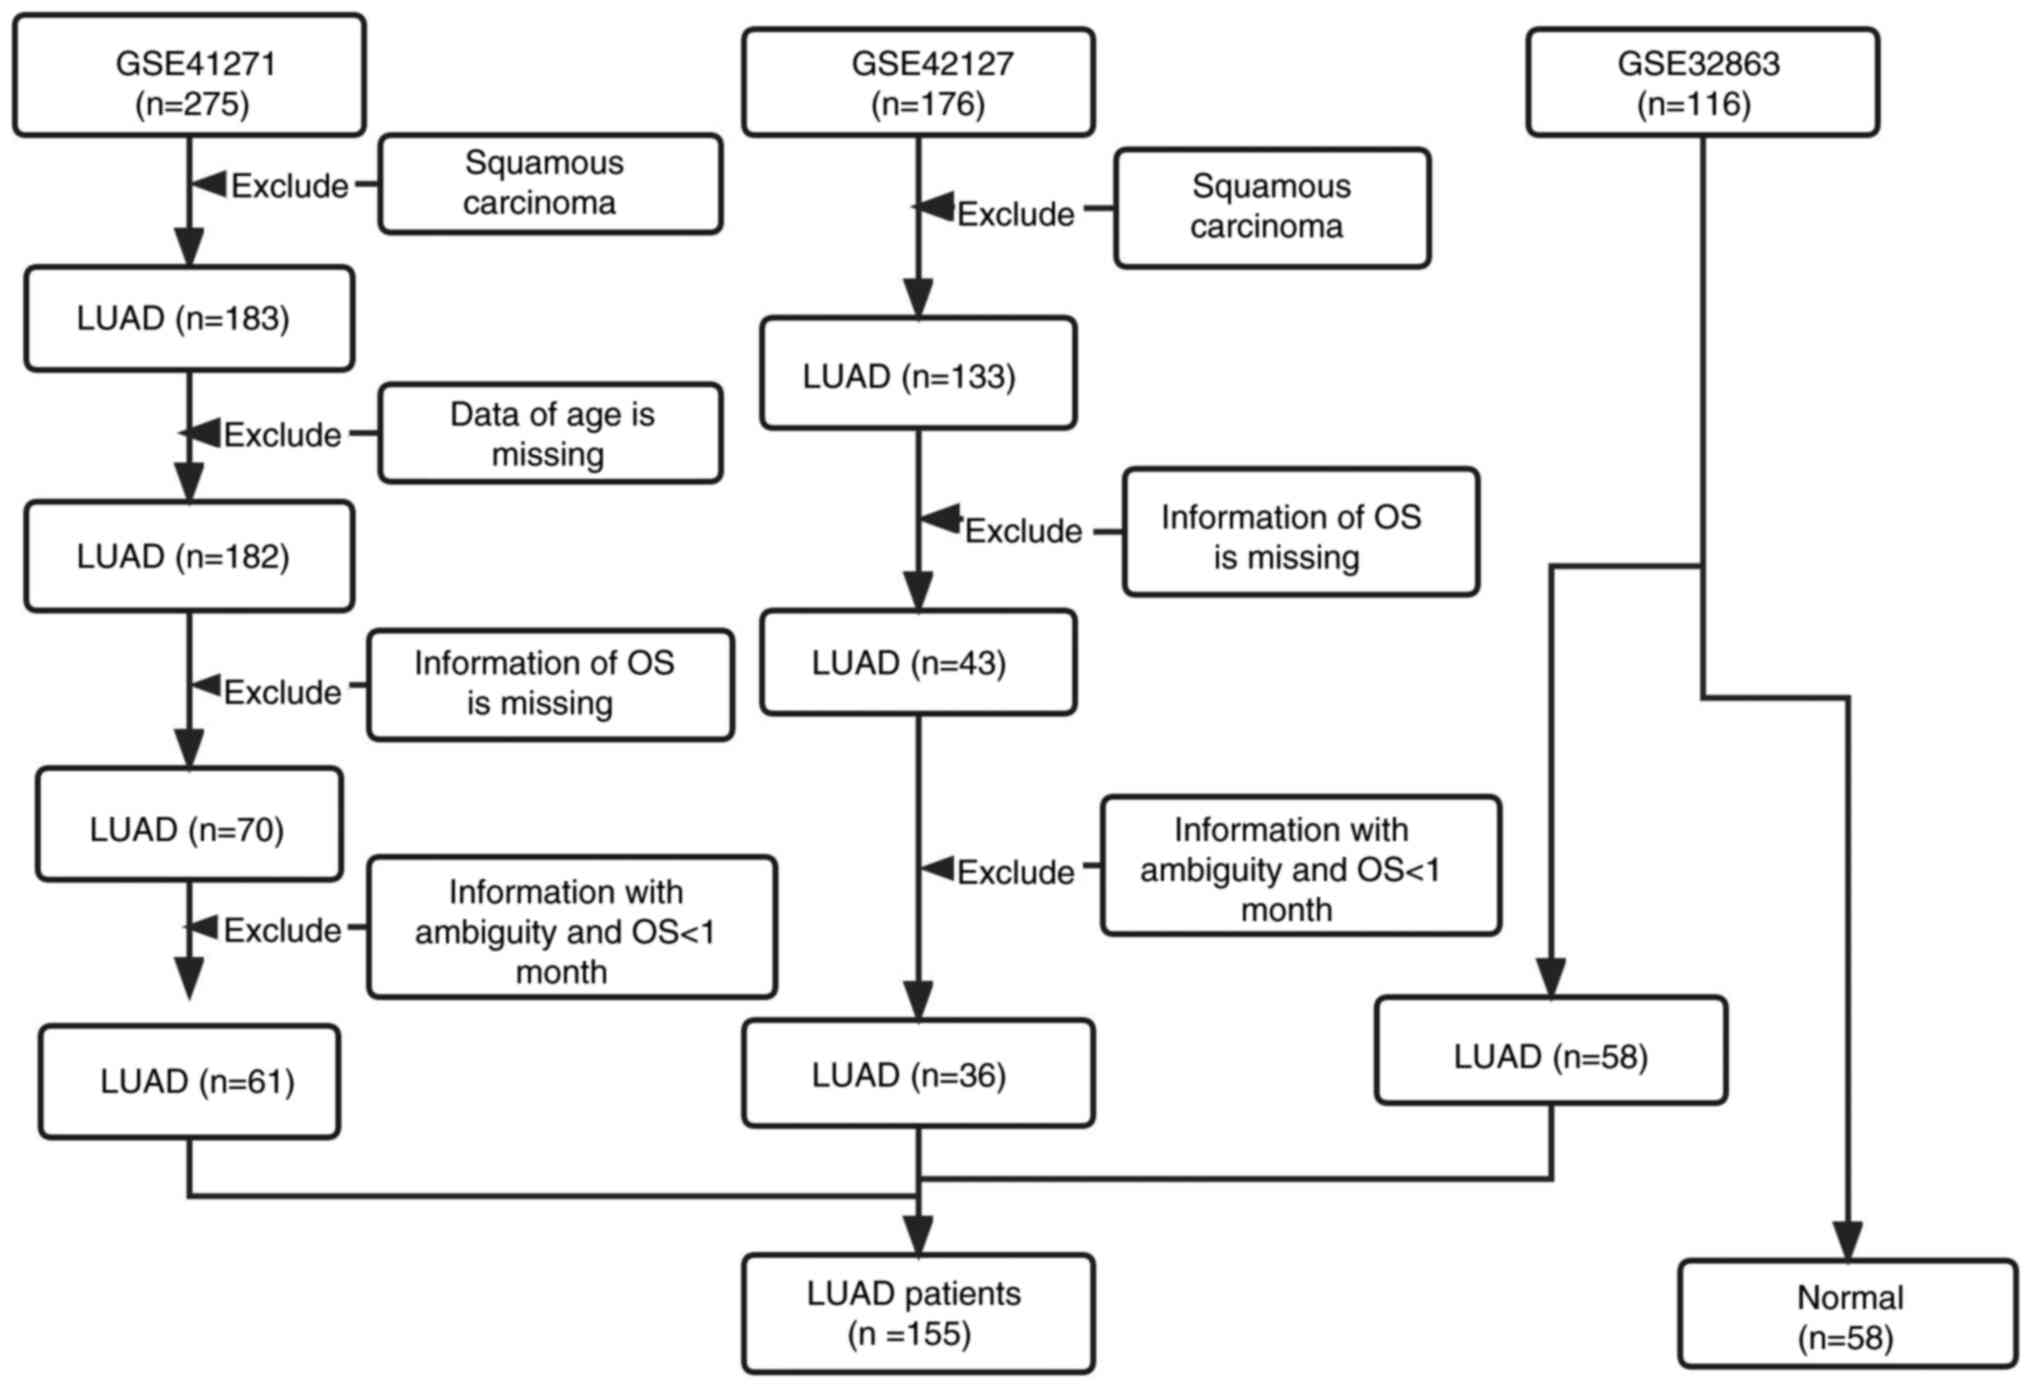
Finally, a total of 155 LUAD samples and 58 normal samples were
used for the following analysis of differentially expressed genes
(DEGs). A total of 97 LUAD cases had survival information that met
the study criterion (GSE41271, 61 cases; GSE42127, 36 cases), which
were included for the following WGCNA and survival-related
prognostic analysis (Table I). Flow
charts of the study's designed strategy for selecting patients are
presented in Figs. 1 and 2, respectively.
 | Table I.Clinical characteristics of patients
with LUAD in three datasets. |
Table I.
Clinical characteristics of patients
with LUAD in three datasets.
| Characteristic | GSE41271, n | GSE42127, n | GSE32863, n |
|---|
| Downloaded
samples |
|
|
|
|
Total | 275 | 176 | 116 |
|
LUAD | 183 | 133 | 58 |
|
Normal | 0 | 0 | 58 |
| Selected
samples |
|
|
|
|
Total | 61 | 36 | 116 |
|
LUAD | 61 | 36 | 58 |
|
Normal | 0 | 0 | 58 |
| OS≥1
month | 61 | 36 | NA |
| Age, years |
|
|
|
|
≤65 | 34 | 17 | 20 |
|
>65 | 27 | 19 | 39 |
| Sex |
|
|
|
|
Female | 26 | 14 | 45 |
|
Male | 35 | 22 | 14 |
| Stage |
|
|
|
| IA | 5 | 4 | 17 |
| IB | 17 | 15 | 18 |
|
IIA | 2 | 2 | 9 |
|
IIB | 8 | 6 | 2 |
|
IIIA | 15 | 4 | 12 |
|
IIIB | 11 | 4 | 0 |
| IV | 3 | 1 | 1 |
DEGs and survival analysis
DEGs in LUAD and normal samples were screened using
the limma package (version 3.40.6) in R software. Volcano plots and
heat maps were created to visualize DEGs. Genes with an adjusted
P<0.05 and |log2fold change (FC)|>1 were set as
the filtration criterion for DEGs.
For survival analysis, the ‘survival’ package of R
software (version 4.1) was used to integrate the survival time,
survival status and gene expression data in order to further assess
the significant prognosis-related genes using univariate regression
analysis, and P<0.05 was considered to indicate a statistically
significant difference.
WGCNA
The ‘WGCNA’ package was used to construct a WGCNA
(18). First, according to the gene
expression profiles, the standard deviation (SD) of each gene was
calculated, and genes in the top 25% with the smallest SD were
removed. The goodSamplesGenes function in the R software package
was used to eliminate outlier samples and the WGCNA package
(version 3.9) was used to analyze the original data.
To further analyze the module, the dissimilarity of
module eigengenes was calculated, a cut line for the module
dendrogram was selected and certain modules were merged. In
addition, modules with distances of <0.25 were merged and 13
co-expressed modules were obtained. Module-membership (MM) was
evaluated as the connectivity between gene expression values, while
the gene-significance (GS) represented the correlation between each
gene and OS. Genes with larger GS values had a greater influence on
traits and genes with larger MM values were more correlated with
modules. Genes in the key modules with |MM|>0.8 and |GS|>0.2
were selected as significant genes in the module.
Screening for candidate genes
A Venn diagram was used to display the overlapping
genes among DEGs, prognosis-related genes and WGCNA. The
overlapping genes were considered the candidate genes for further
analysis.
Gene ontology (GO)/Kyoto Encyclopedia
of Genes and Genomes (KEGG) enrichment analysis
For GO functional enrichment analysis, the GO
annotations of genes in the R package org.Hs.eg.db (version 3.1.0)
was used as the background to map the genes to the background set
using the R package Cluster Profiler (version 3.14.3). The minimum
gene set was set to 5 and the maximum to 5,000. P<0.05 was
considered to indicate a statistically significant difference.
For gene set functional enrichment analysis, KEGG
API was used (https://www.kegg.jp/kegg/rest/keggapi.html) to obtain
the latest gene annotations. The KEGG pathway enrichment analysis
was performed using the R software package Cluster Profiler
(version 3.14.3).
Hub genes
The STRING online tool (https://string-db.org/cgi/) is a system that searches
for known and predicted protein-protein interactions (PPIs). Such
interactions include both direct physical interactions and indirect
functional correlations between proteins. The 17 genes overlapping
in the Venn diagram were selected to build a PPI network using the
STRING database. Next, Cytoscape (version 3.9.1) was used to
visualize the network, followed by the Cytohubba plug-in to explore
hub genes in the network. The top 5 genes with the most connected
traits were identified using the maximum clique centrality
algorithm. Subsequently, the five candidate genes and clinical
parameters, such as age, sex and stage, were included in the
univariate and multivariate Cox regression analysis, and P≤0.05 was
considered to indicate a statistically significant difference.
FOXM1 and CENPF analysis in clinical
samples
For the purpose of assessing the prognostic value of
FOXM1 and CENPF expression in LUAD, the Kaplan-Meier plotter was
used to examine the relationship between FOXM1, CENPF and OS in
LUAD. Furthermore, a Pearson correlation analysis between FOXM1 and
CENPF was conducted in clinical samples from the GEO database.
Furthermore, to validate the correlation between FOXM1 and CENPF,
an analysis with the GEPIA (http://gepia.cancer-pku.cn/) public web database was
performed based on The Cancer Genome Atlas database (22). Based on its larger sample size and
credible analysis results, this website was used to validate the
correlation between FOXM1 and CENPF.
Single-sample (ss)GSEA
The GSEA software (version 3.0) was obtained from
the GSEA (23). According to gene
expression levels, genes were divided into high (≥50%) and low
expression groups (<50%). Background GSEA signature gene set
expression was obtained from the Molecular Signatures Database
(23,24), and the c2.cp.kegg.v7.4.symbols.gmt
subset was downloaded to evaluate related pathways and molecular
mechanisms. Classification into groups was performed based on gene
expression profiles and phenotypes, setting the minimum gene set to
5, the maximum gene set to 5,000 and 1,000 resampling. P<0.05
was considered to indicate a statistically significant
difference.
Immunohistochemistry (IHC) and
immunofluorescence (IF)
A total of 22 normal adjacent tissues and 22 LUAD
tissues (12 males and 10 females; mean age, 62.6 years; age range,
41–82 years), collected from The Second Hospital of Hebei Medical
University from 2018 to 2023 (approval no. 2022-R676) were fixed
with 4% paraformaldehyde for 24 h and then embedded in paraffin.
Samples were cut into 5-µm sections following deparaffinization and
dehydration. H&E staining was performed according to standard
protocols. IHC was conducted to investigate FOXM1 and CENPF protein
expression in LUAD and normal tissues. Tissues were incubated with
FOXM1 (cat. no. ab207298; dilution, 1:200; Abcam) and CENPF (cat.
no. 28568-1-AP; dilution, 1:200; Proteintech) antibodies overnight
at 4°C. The next day, tissues were incubated with a secondary
antibody (cat. no. PV-6001; ready-to-use; OriGene Technologies,
Inc.) for 1 h at 37°C. The nuclei were then stained with
hematoxylin following DAB kit (cat. no. ZLI-9018; OriGene
Technologies, Inc.) staining. The results were observed under a
bright-field microscope (Nikon Eclipse CI; Nikon Corporation).
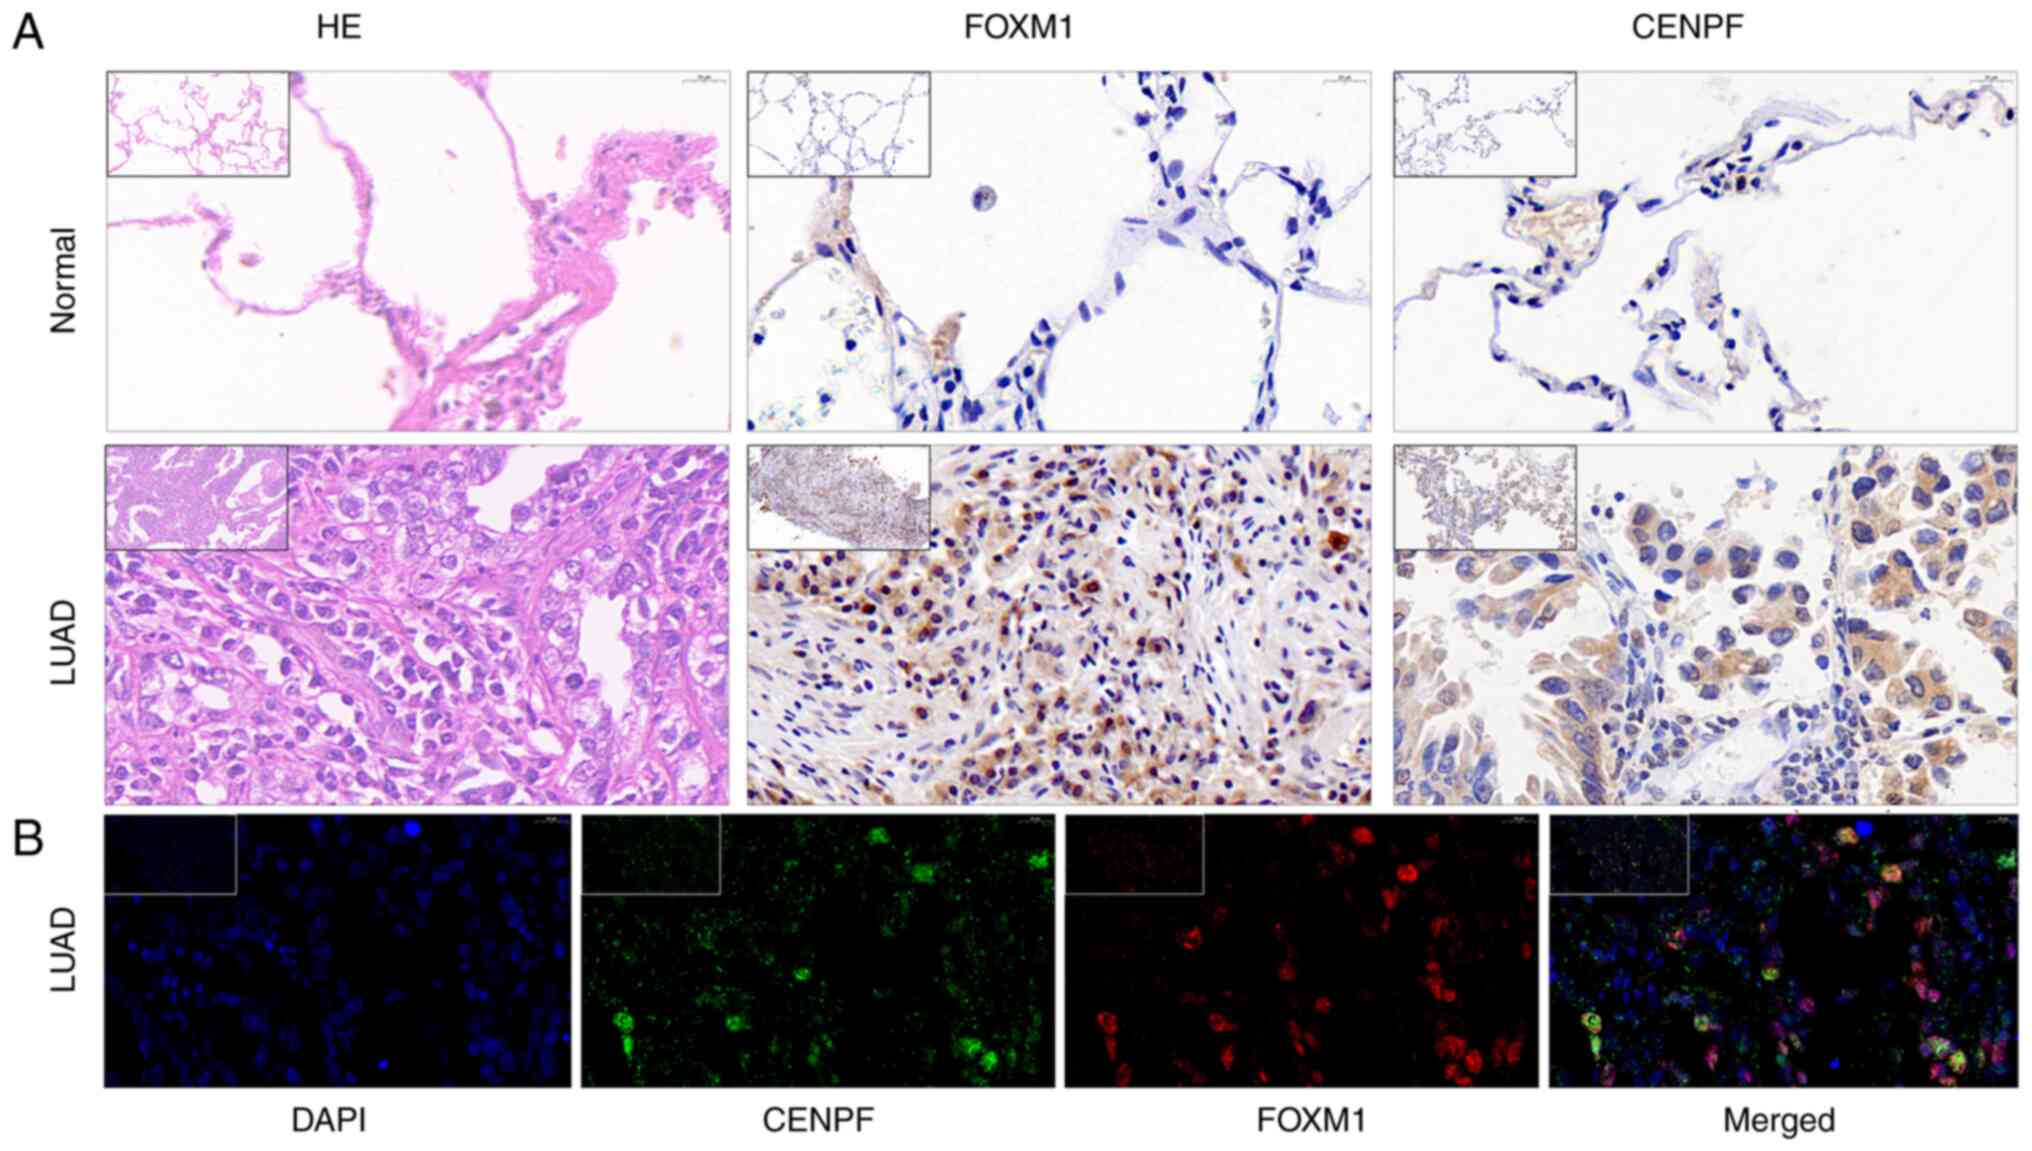
For IF, samples were prepared using CENPF (cat. no.
28568-1-AP; dilution, 1:3,000; Proteintech) and FOXM1 (cat. no.
ab207298; dilution, 1:200; Abcam) antibodies following the
manufacturer's instructions. In the fluorescent images, CENPF
appeared green and FOXM1 red. The clinicopathological data of the
subjects are listed in Table SI.
The results were observed under a bright-field microscope (Nikon
Eclipse CI).
Cell culture and transfection
In the previous bioinformatics analysis, FOXM1 and
CENPF were found to be highly expressed in LUAD as compared with
normal tissue, and to be significantly associated with poor
prognosis. Therefore, aiming to further investigate the role of
deregulated expression, gene expression was knocked down by
silencing FOXM1 and CENPF in A549 cells. The A549 human LUAD cell
line was purchased from Haixing Biosciences and cultured in
DMEM/F-12 (Gibco; Thermo Fisher Scientific, Inc.) medium containing
10% fetal bovine serum (cat. no. F7524; MilliporeSigma) in an
incubator with a humidified atmosphere with 5% CO2 at
37°C. Small inhibitory (si)RNA sequences targeting FOXM1 and CENPF
were constructed by and purchased from Guangzhou RiboBio Co., Ltd.
A total of 10 µl siRNA (100 nM) was transfected in each well of
six-well plates using riboFECT CP Transfection Reagent (Guangzhou
RiboBio Co., Ltd.), following the manufacturer's instructions. The
sequences of si-NC, si-FOXM1 and si-CENPF (Guangzhou RiboBio Co.,
Ltd.) are listed in Table II.
| Table II.siRNAs used in the present study. |
Table II.
siRNAs used in the present study.
| Name | Sequence |
|---|
| si-NC |
5′-TTCTCCGAACGTGTCACGT-3′ |
| si-FOXM1#1 |
5′-CCAACAATGCTAATATTCA-3′ |
| si-FOXM1#2 |
5′-GCAGAAACGACCGAATCCA-3′ |
| si-FOXM1#3 |
5′-AGTGCCAACCGCTACTTGA-3′ |
| si-CENPF#1 |
5′-GCAGAATCTTAGTAGTCAA-3′ |
| si-CENPF#2 |
5′-GCAACCATCTACTTGAAGA-3′ |
| si-CENPF#3 |
5′-GCAGCGAGATTGTTCTCAA-3 |
Reverse transcription-quantitative PCR
(RT-qPCR)
Total RNA was isolated from the A549 cells using
RNAiso Plus (Takara Bio, Inc.). Subsequently, 1 µg RNA was used for
cDNA conversion. cDNA was obtained by RT at 42°C for 15 min and
95°C for 3 min. PCR was conducted with SYBR Green (cat. no. FP205;
Tiangen Biotech Co., Ltd.) according to the manufacturer's
instructions. The thermocycling conditions for PCR using a
CFX96-Real-Time System (Bio-Rad Laboratories, Inc.), were as
follows: Initial denaturation at 95°C for 15 min, followed by
denaturation at 95°C for 10 sec, and annealing and extension at
60°C for 32 sec for a total of 40 cycles. Furthermore, the
expression relative to GAPDH was calculated using the
2−∆∆Cq method (25). The
specific primer sequences are listed in Table III.
| Table III.Primers used for PCR. |
Table III.
Primers used for PCR.
| Primer name | Sequence |
|---|
| FOXM1-F |
5′-ATACGTGGATTGAGGACCACT-3′ |
| FOXM1-R |
5′-TCCAATGTCAAGTAGCGGTTG-3′ |
| CENPF-F |
5′-ACCTTCACAACGTGTTAGACAG-3′ |
| CENPF-R |
5′-CTGAGGCTCTCATATTCGGCA-3′ |
| GAPDH-F |
5′-GACTCATGACCACAGTCCATGC-3′ |
| GAPDH-R |
5′-AGAGGCAGGGATGATGTTCTG-3′ |
Cell counting kit-8 (CCK-8) assay
A549 cells were planted overnight in 96-well plates
at a density of 3,000 cells/well and transfected with si-NC,
si-FOXM1 orsi-CENPF the next day. Cells were further incubated for
24, 48 and 72 h in a cell incubator. Subsequently, 20 µl CCK-8
reagent (Wuhan Servicebio Technology Co., Ltd.) was added to each
well and incubated at 37°C for 2 h in a cell incubator. The
absorbance of each well was measured at a wavelength of 450 nm
using a microplate reader.
Colony-formation assay
For the colony-formation assay, 500 cells/well were
incubated in a six-well plate overnight and transfected with si-NC,
si-FOXM1 orsi-CENPF the next day. After 48 h of incubation, the
medium was replaced and cells were incubated for 10 days. When
colonies were observed (>50 cells), cells were fixed with 4%
paraformaldehyde for 20 min and stained with 0.1% crystal violet
for 20 min at room temperature. Finally, colony numbers were
evaluated using ImageJ software (version 1.54d; National Institutes
of Health).
Migration assay
Transwell assay inserts (pore size, 8 µM; Corning,
Inc.) were used to evaluate the migration capability of A549 cells.
Cells were harvested following transfection for 24 h. A total of
2×10⁴ cells were transfected with si-NC, si-FOXM1 or
si-CENPF and seeded into the upper chamber in 100 µl medium with 2%
fetal bovine serum. Furthermore, 600 µl medium containing 20% fetal
bovine serum was added to the lower chamber and the plates were
incubated for an additional 24 h. Migrated cells were fixed with 4%
polyformaldehyde for 30 min and stained with 0.1% crystal violet
for 20 min at room temperature. The results were evaluated using
ImageJ software (version 1.54d; National Institutes of Health).
Wound-healing assay
A549 cells (3.5×10⁵ cells/well) were
seeded in six-well plates and transfected with si-NC, si-FOXM1 or
si-CENPF. When the cell confluence had reached 90%, the cell
monolayer was scratched with a 10-µl pipette tip to generate a
line-shaped wound, then debris cells were washed away with
phosphate-buffered saline. The scraped monolayer was incubated in
medium containing 1% fetal bovine serum for an additional 48 h.
Scratched fields were selected randomly and cell migration
distances were further calculated.
Statistical analysis
The χ2 test and non-parametric test were
used for count data. Unpaired Student's t-test or ANOVA were used
for measurement data and the Student-Newman-Keuls method was used
as the post-hoc test. Kaplan-Meier curves were drawn for survival
analysis by log-rank test. Univariate and multivariate Cox
regression analysis was used to explore the independent risk
factors for clinicopathological data and protein expression levels.
Statistical analysis was performed using SPSS 26.0 (IBM Corp.).
P<0.05 was considered to indicate a statistically significant
difference.
Results
DEG screening and prognosis-related
genes
Genes were screened using an adjusted P<0.05 and
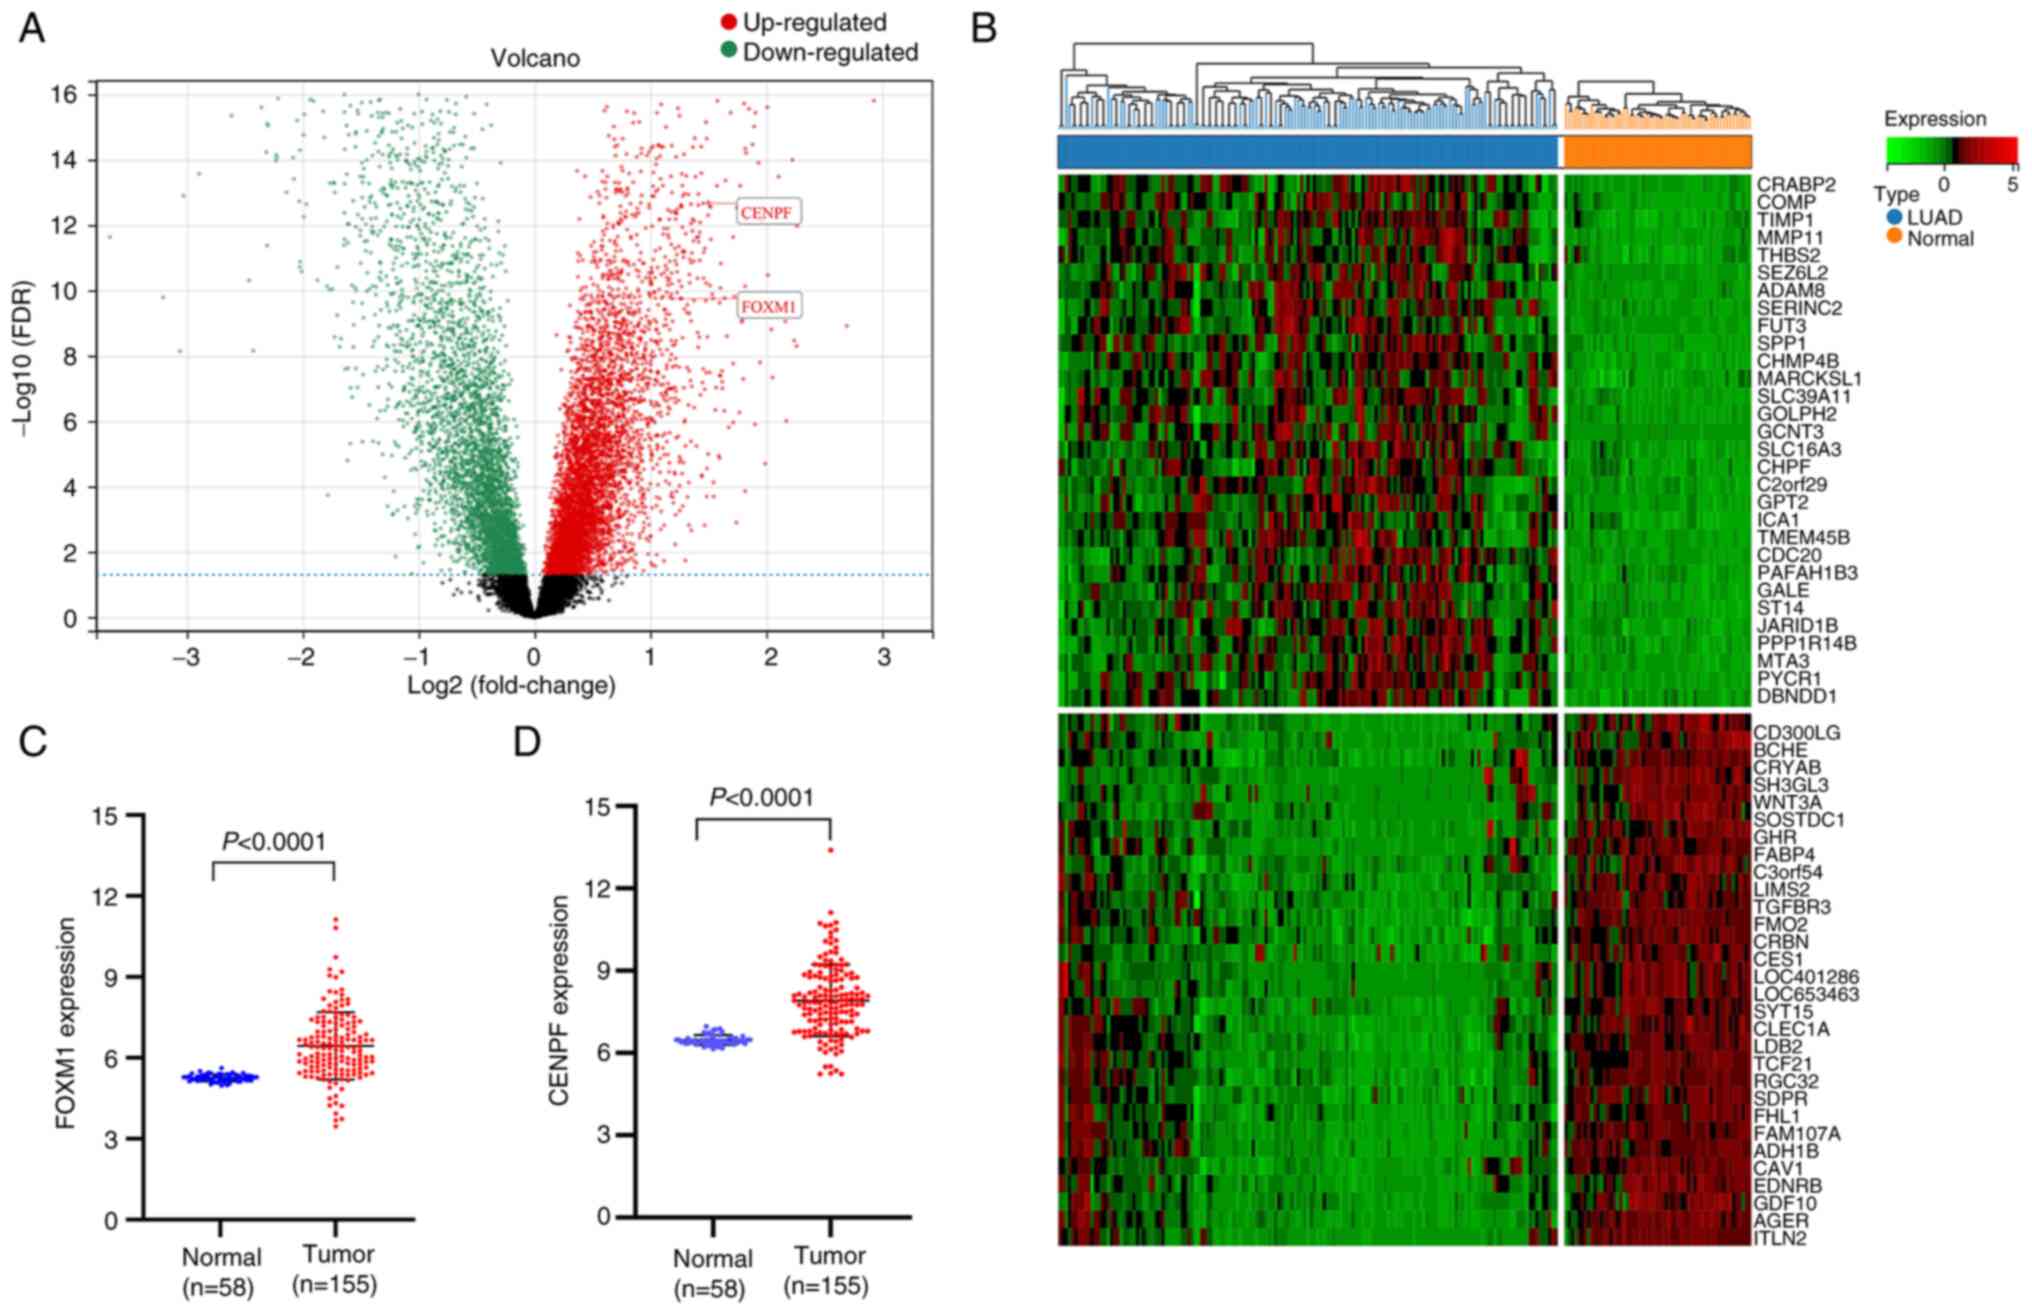
|log2FC|>1, and 1,018 DEGs were identified, including 416
upregulated and 602 downregulated genes (Table SII). The visualization results of
the normalization of original data and DEGs are presented in
Figs. 3 and 4 (FOXM1, logFC=1.187657,
P=7.80×10⁻¹²; CENPF, logFC=1.453464,
P=4.70×10⁻¹⁵).
Genes that were significantly associated with
prognosis were screened using univariate regression analysis with
log-rank P<0.05, likelihood P<0.05 and 95% confidence
interval <1 as the criteria. A total of 2,923 genes met the
screening criteria. Specific information of prognosis-related genes
selected by univariate regression analysis is presented in Table SIII [FOXM1, hazard ratio
(HR)=1.461737, 95% CI (1.178551–1.812968), P=0.000528; CENPF,
HR=1.260067, 95% CI (1.070011–1.48388), P=0.005448].
WGCNA
Clustering analysis was performed according to the
expression matrix and clinical characteristics of GSE41271 and
GSE42127. The clinical characteristics of the patients with LUAD
are presented in Table SIV. A
total of 97 LUAD samples with complete OS data and corresponding
series matrix files were used to determine the modules with highly
correlated genes by WGCNA. The clinical variables of sex, age,
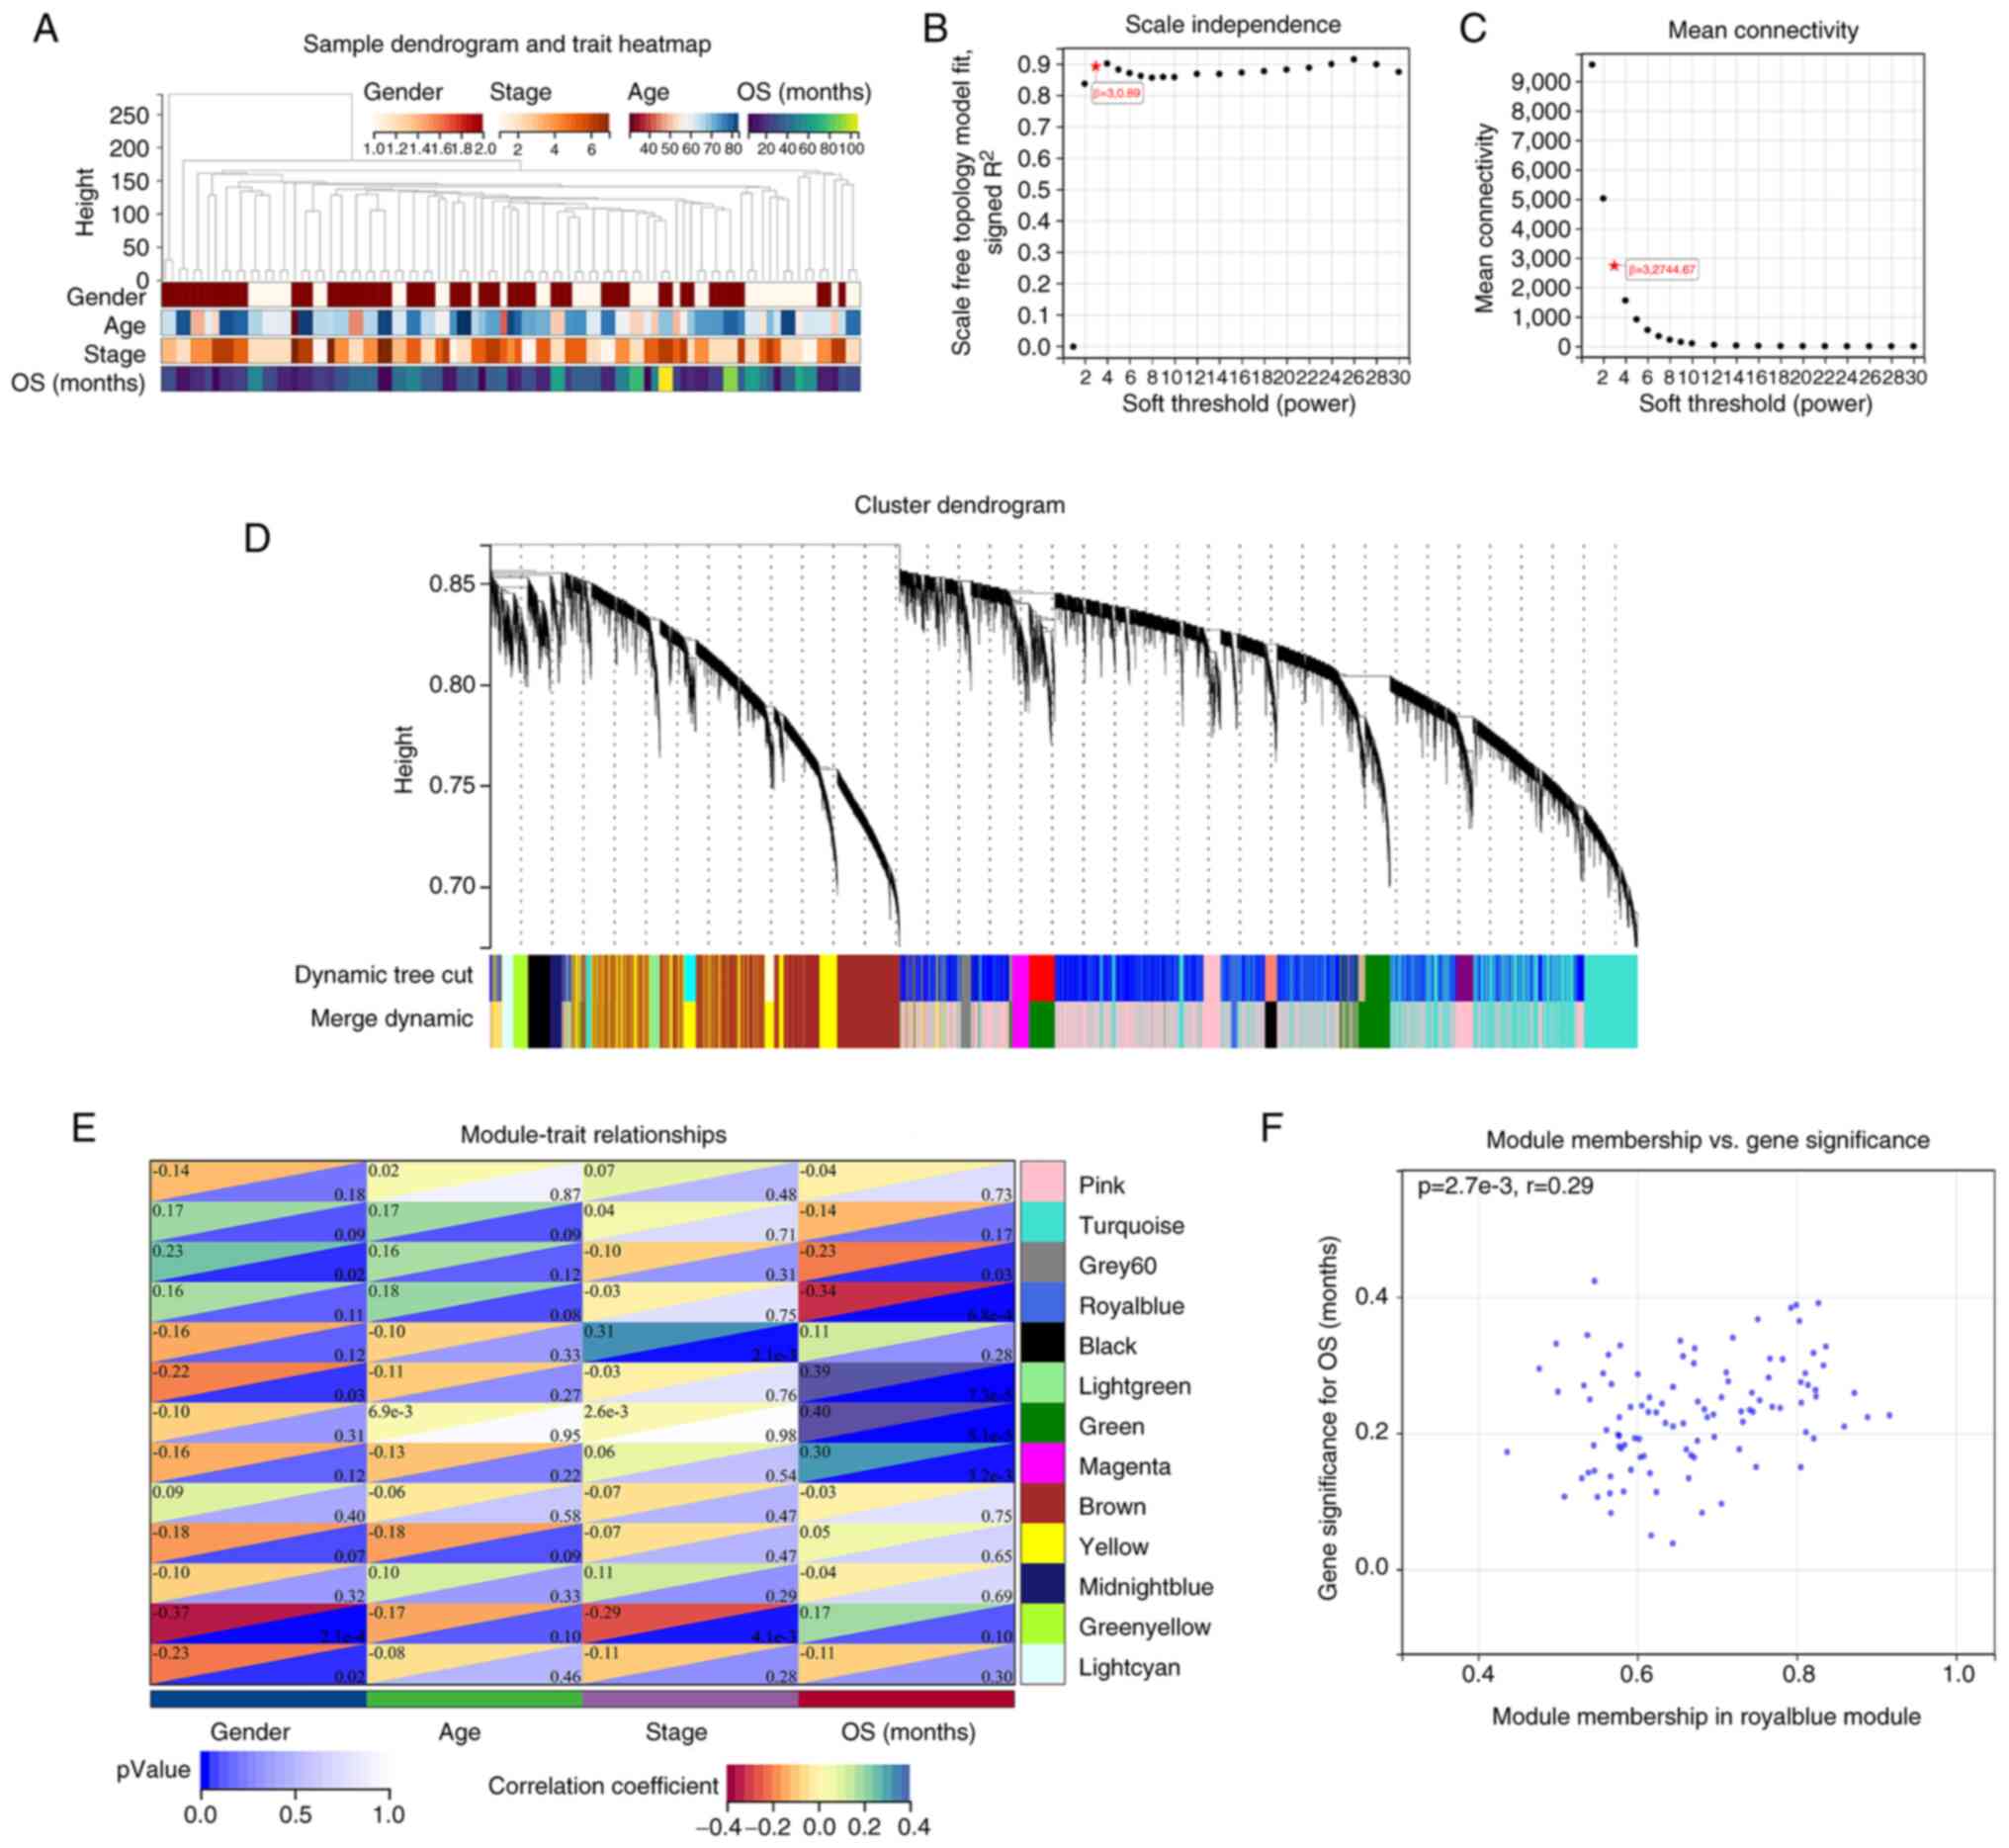
stage and OS were analyzed using WGCNA. A sample dendrogram and
trait heatmap are presented in Fig.
5A. A power value of β=30.89 was selected as the soft threshold
parameter to build a scale-free network (Fig. 5B), with the mean connectivity at
32,744.67 (Fig. 5C). Similar
expression patterns were gathered into the same module, and the
modules with a cutting height difference of <0.25 were merged. A
total of 13 co-expression modules were explored after preprocessing
hierarchical clustering (Fig. 5D).
The correlations among 13 modules are presented in the heatmap of
Fig. 5E. Next, the hierarchical
clustering and adjacency relationships between modules and clinical
traits were analyzed. Among the 13 modules, modules with a
significance of P<0.05 were selected for further analysis, and
the royal blue module exhibited the strongest negative correlation
with OS; thus, it was considered the key module for further
exploration. The royal blue module included a total of 103 genes
and is presented in Table SV.
Based on the cut-off criteria (|MM|>0.8 and |GS|>0.2), a
total of 16 genes with high connectivity in the clinically
significant module were explored (Fig.
5F; Table SVI).
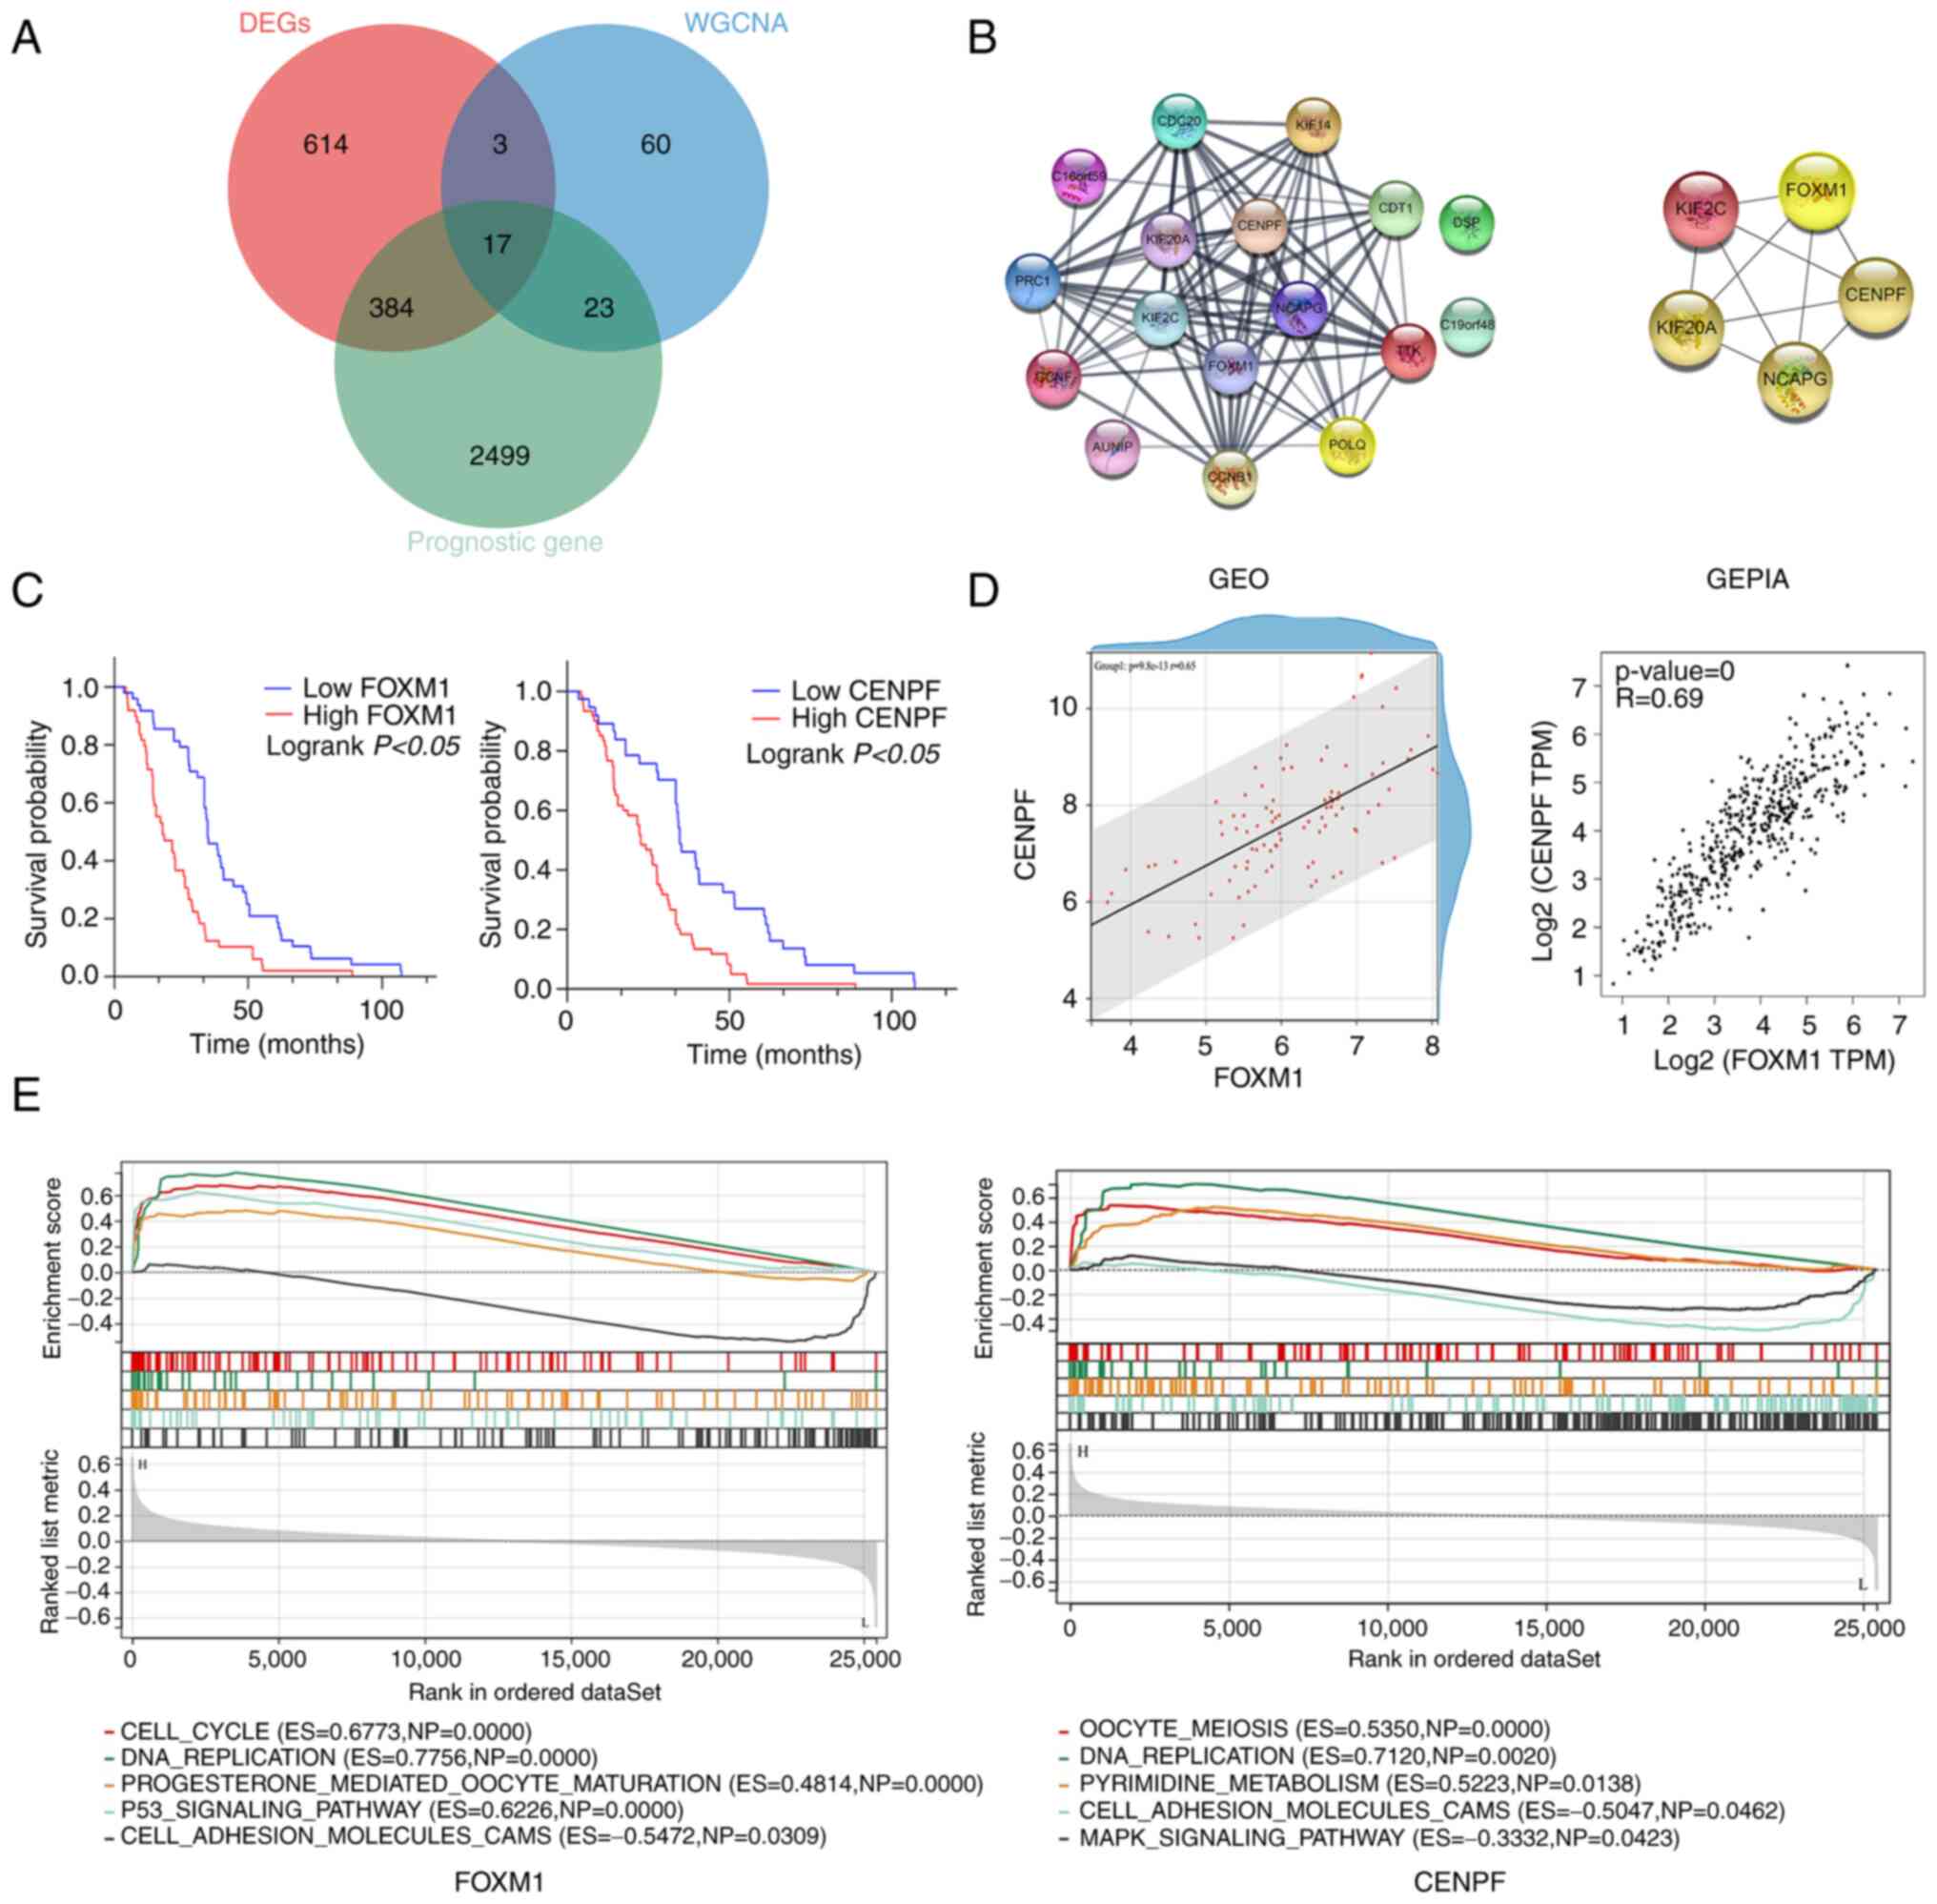
Screening of candidate genes
DEGs, prognosis-related and module-trait genes
(royal blue module from WGCNA) were overlapped and a total of 17
genes (CDC20, PRC1, CCNF, KIF20A, C19orf48, CENPF, KIF2C, TTK,
NCAPG, C16orf59, KIF14, AUNIP, FOXM1, POLQ, CDT1, DSP and CCNB1)
were screened out, as indicated in the Venn diagram (Fig. 6A).
GO/KEGG enrichment analysis
GO and KEGG enrichment analysis of 17 genes was
performed and the top five sorted by P-value (P<0.05) were as
follows. GO: ‘Mitotic sister chromatid segregation’
(P=2.13×10⁻¹³), ‘sister chromatid segregation’
(P=5.26×10⁻¹³), ‘nuclear chromosome segregation’
(P=7.66×10⁻¹²), ‘mitotic nuclear division’
(P=1.13×10⁻¹¹), ‘cell cycle process’
(P=1.99×10⁻¹¹), ‘microtubule cytoskeleton’
(P=4.93×10⁻⁸), ‘cytoskeletal part’
(P=4.93×10⁻⁸) and ‘protein kinase binding’
(P=5.51×10⁻⁴). KEGG: ‘Cell cycle’
(P=4.04×10⁻⁴), ‘oocyte meiosis’ (P=1.36×10⁻²)
and ‘cellular senescence’ (P=1.43×10⁻²). Detailed terms
of GO terms in the categories Biological Process, Cellular
Component and Molecular Function, as well as KEGG pathways, are
presented in Table SVII.
Identification of hub genes
A total of 17 genes were used to establish a PPI
network and the top five hub genes were selected (Fig. 6B). The five hub genes were FOXM1,
CENPF, KIF2C, KIF20A and NCAPG. The expression of FOXM1 and CENPF
was not only found to be statistically significant in the
univariate regression analysis but also in the multivariate
regression analysis for overall survival, as presented in Table IV. Thus, as independent predictors
of prognosis for patients with LUAD, FOXM1 and CENPF were selected
as the candidate genes for further experiments.
| Table IV.Univariate and multivariate COX
regression analysis for patients with lung adenocarcinoma with
regard to overall survival. |
Table IV.
Univariate and multivariate COX
regression analysis for patients with lung adenocarcinoma with
regard to overall survival.
|
| Univariate | Multivariate |
|---|
|
|
|
|
|---|
| Variable | HR | 95% CI | P-value | HR | 95% CI | P-value |
|---|
| Age | 1.017 | 0.997–1.037 | 0.10 | 1.014 | 0.991–1.037 | 0.23 |
| Sex | 1.197 | 0.791–1.811 | 0.39 | 1.055 | 0.643–1.731 | 0.83 |
| Stage | 1.123 | 0.999–1.263 | 0.05 | 1.180 | 1.040–1.339 | 0.01 |
| KIF2C | 1.239 | 1.039–1.478 | 0.02 | 0.796 | 0.500–1.267 | 0.34 |
| KIF20A | 1.293 | 1.060–1.576 | 0.01 | 1.148 | 0.770–1.712 | 0.50 |
| NCAPG | 1.227 | 1.022–1.472 | 0.03 | 0.697 | 0.446–1.089 | 0.11 |
| CENPF | 1.260 | 1.070–1.484 | <0.01 | 1.383 | 0.999–1.914 | 0.05 |
| FOXM1 | 1.462 | 1.179–1.814 | <0.01 | 1.762 | 1.201–2.586 | <0.01 |
FOXM1 and CENPF exhibited a higher expression in
LUAD vs. normal tissue (Fig. 4C and
D). Kaplan-Meier survival curves indicated that higher
expression of FOXM1 and CENPF resulted in poorer OS of patients
with LUAD (Fig. 6C). Furthermore,
correlation analysis revealed that FOXM1 expression was
significantly positively associated with that of CENPF expression,
both in the GEO datasets and GEPIA (Fig. 6D).
ssGSEA
According to the expression levels of FOXM1 and
CENPF, the filtered data matrix based on Fig. 2 was divided into high (≥50%) and low
expression (<50%) groups and ssGSEA analysis was performed. The
significant pathways and molecular functions are presented in
Fig. 6E. FOXM1: ‘CELL-CYCLE’
[Enrichment Score (ES)=0.6773, Normal P-value (NP)=0.0000],
‘DNA_REPLICATION’ (ES=0.7756, NP=0.0000),
‘PROGESTERONE_MEDIATED_OOCYTE_MATURATION’ (ES=0.4814, NP=0.0000),
‘P53_SIGNALING_PATHWAY’ (ES=0.6226, NP=0.0000),
‘CELL_ADHESION_MOLECULES_CAMS’ (ES=−0.5472, NP=0.0309). CENPF:
‘OOCYTE_MEIOSIS’ (ES=0.5350, NP=0.0000), ‘DNA_REPLICATION’
(ES=0.7120, NP=0.0020), ‘PYRIMIDINE_METABOLISM’ (ES=0.5223,
NP=0.0138), ‘CELL_ADHESION_MOLECULES_CAMS’ (ES=−0.5047, NP=0.0462),
‘MAPK_SIGALING_PATHWAY’ (ES=−0.3332, NP=0.0423).
FOXM1 and CENPF expression by IHC and
IF
IHC was performed to verify the expression of FOXM1
and CENPF in LUAD and normal lung tissue. These results indicated
that both FOXM1 and CENPF were more highly expressed in LUAD
compared with normal lung tissue (Fig.
7).
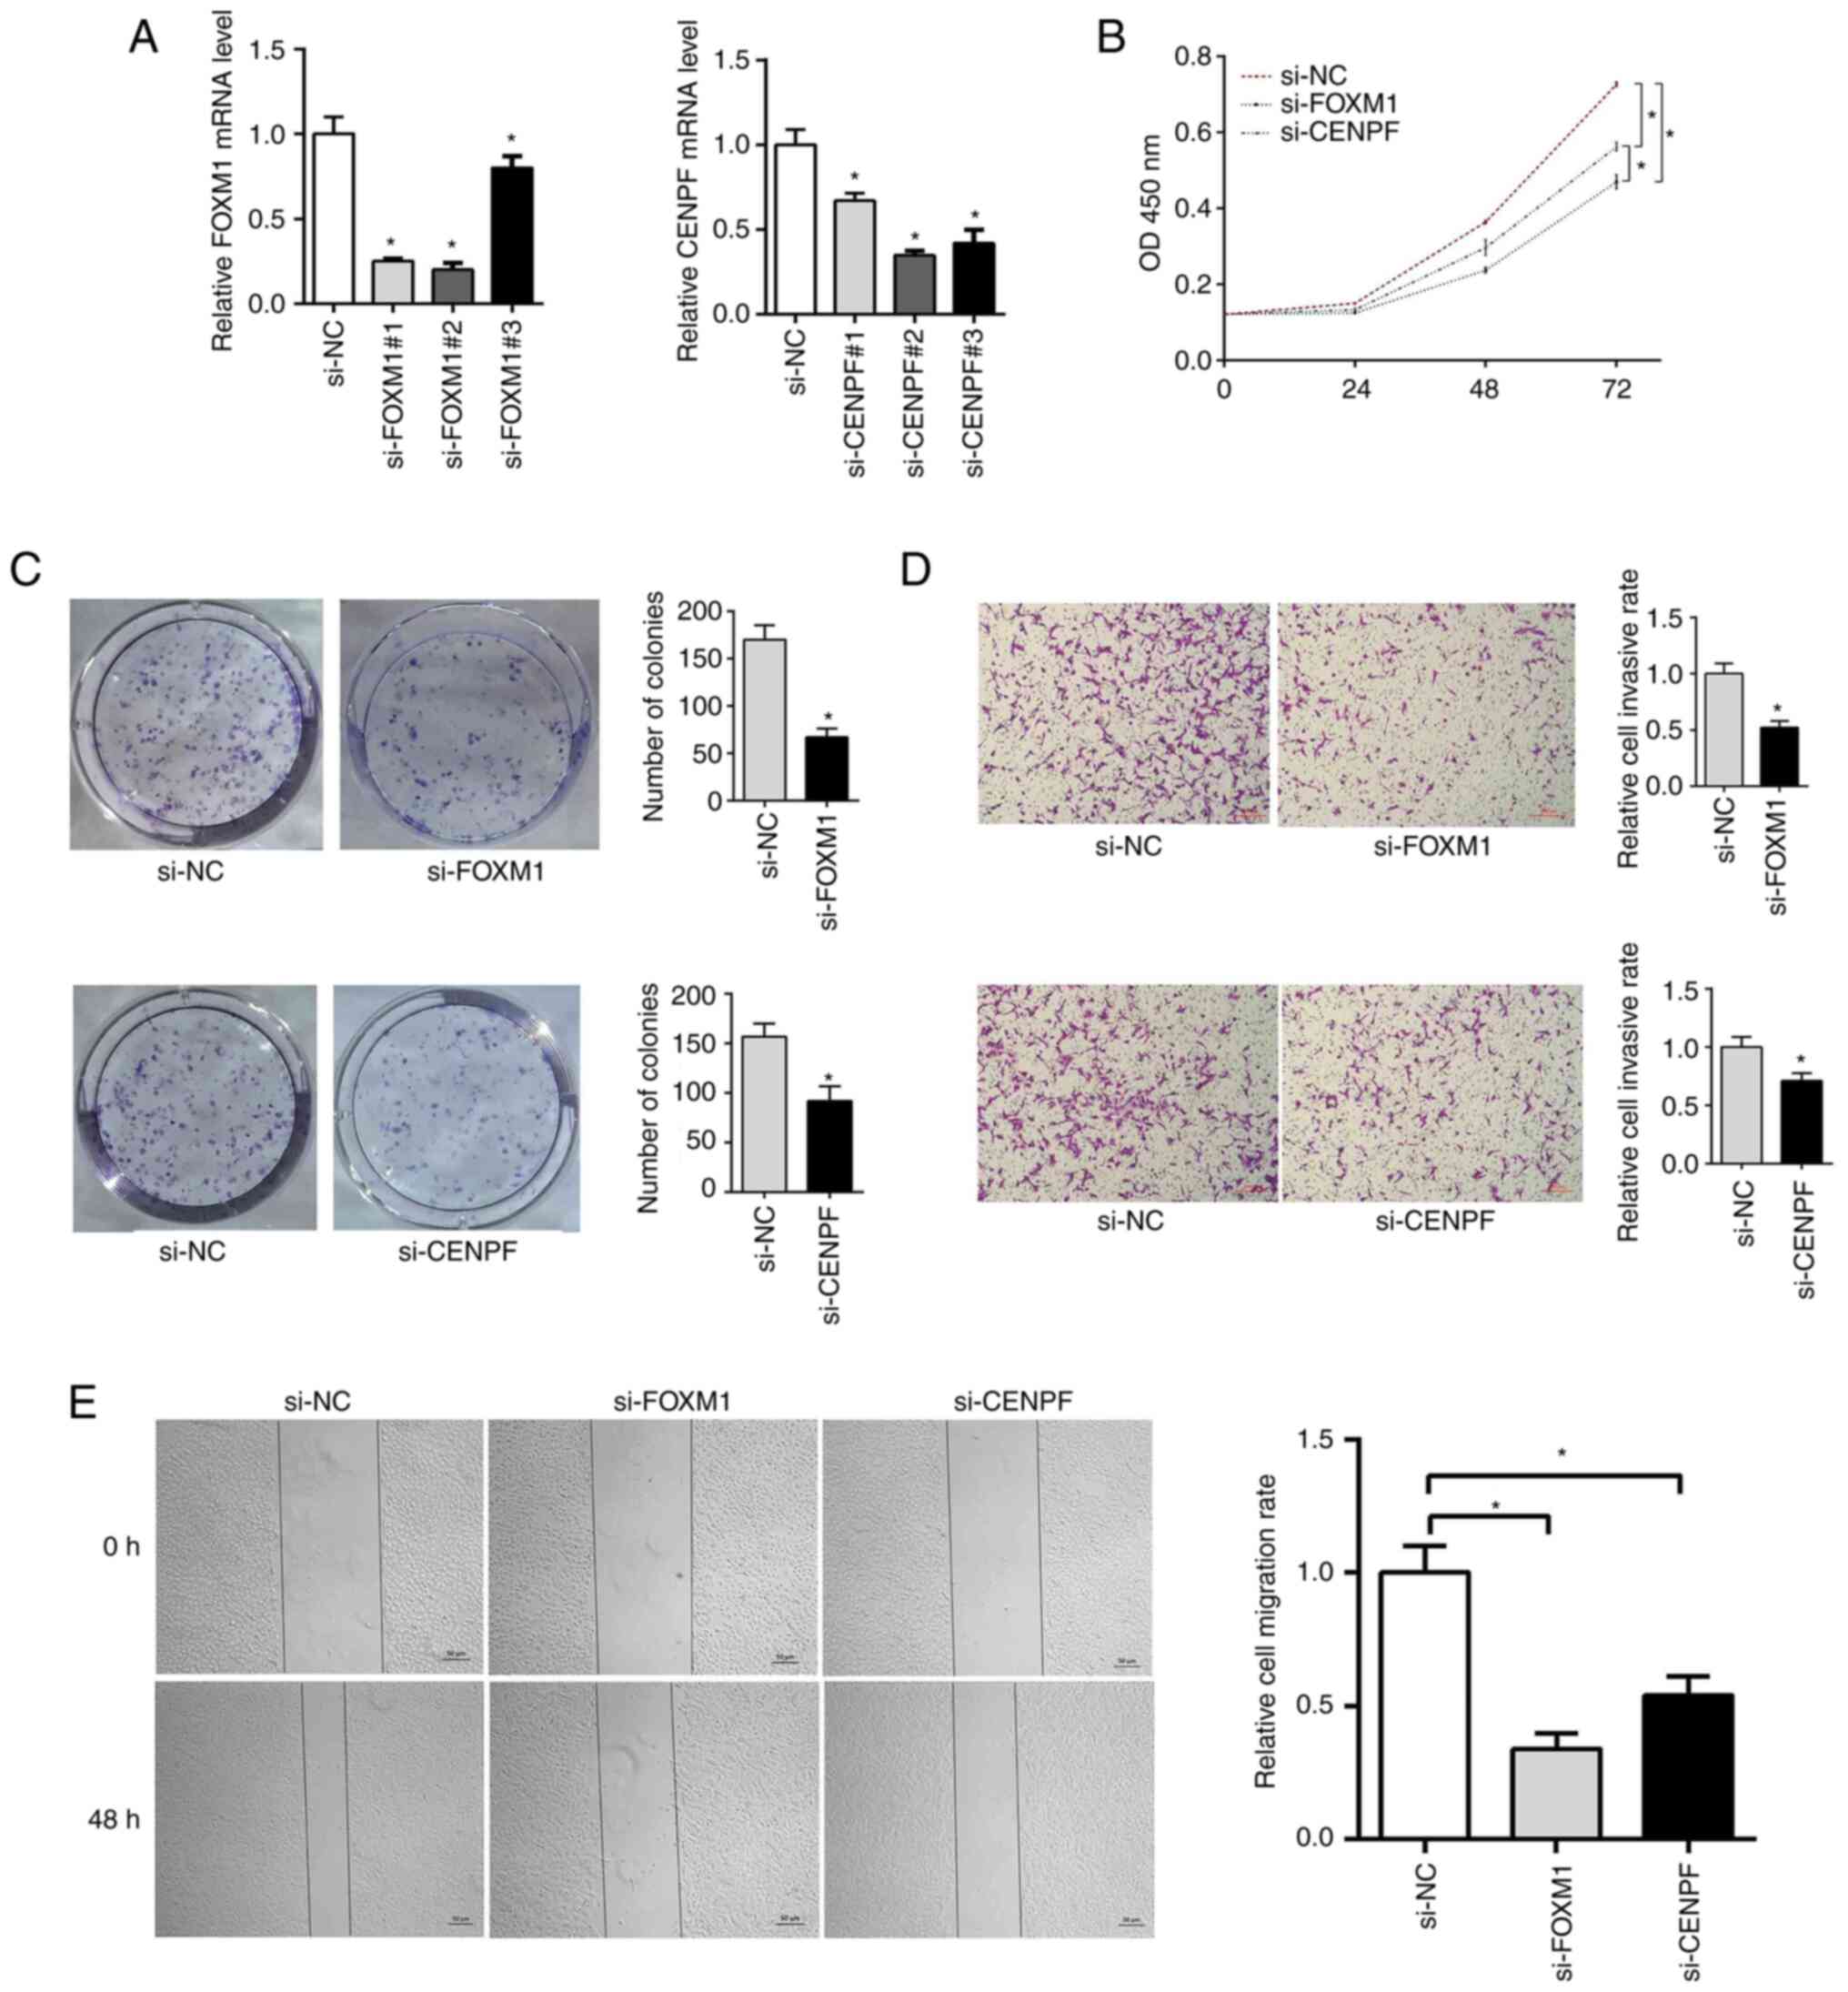
FOXM1 and CENPF knockdown inhibits
A549 cell proliferation
The RT-qPCR results indicated that si-FOXM1#2 and
si-CENPF#2 exhibited significant knockdown efficiency (Fig. 8A). To further investigate the
potential effect of FOXM1 and CENPF on cell proliferation, CCK-8
and cell colony formation assays were performed to evaluate cell
proliferation of A549 cells transfected with si-FOXM1 and si-CENPF.
The CCK-8 assay results suggested that cell proliferation in the
si-FOXM1 and si-CENPF groups was decreased compared with the si-NC
group (Fig. 8B). The
colony-formation assay indicated that the colony-formation rate was
significantly decreased in the si-FOXM1 and si-CENPF groups
compared with the si-NC group (Fig.
8C).
FOXM1 and CENPF silencing inhibits
A549 cell migration
Wound-healing and Transwell assays were performed to
determine the relative migration ability of A549 cells. It was
found that wound closure was significantly delayed in the si-FOXM1
and si-CENPF groups as compared with the si-NC group (Fig. 8E), which was also observed in the
Transwell assay (Fig. 8D).
Discussion
Lung cancer is the leading cause of cancer-related
mortality, contributing to 1/5 of all cancer-related mortalities
(26). LUAD is considered to be the
most typical subtype of non-small cell lung cancer, with a high
incidence and mortality worldwide (27). Molecular targeted therapies have
contributed to improvements in the clinical prognosis and survival
of patients. However, due to their continued use, acquired drug
resistance has developed (28).
Therefore, it is imperative to explore new and effective molecular
targets for LUAD treatment.
First, screening for DEGs and prognostic-related
genes identified 1,018 DEGs, among which 416 were upregulated and
602 downregulated (FOXM1, logFC=1.187657, P=7.80×10⁻¹²;
CENPF, logFC=1.453464, P=4.70×10⁻¹⁵). A total of 2,923
genes met the screening criteria for survival analysis [FOXM1,
HR=1.461737, 95% CI (1.178551–1.812968), P=0.000528; CENPF,
HR=1.260067, 95% CI (1.070011–1.48388), P=0.005448]. It was found
that both FOXM1 and CENPF had important research value in
predicting LUAD prognosis. High expression of these genes results
in poor survival. Furthermore, WGCNA of LUAD was performed, based
on the cut-off criteria (|MM|>0.8 and |GS|>0.2); a total of
16 genes (CENPF, FOXM1, C1orf135, C9orf100, CDC20, CDC25C, CDCA2,
CSE1L, NCAPG, KIF20A, KIF2C, MCM10, POLQ, PRC1, SGOL1 and TTK) with
high connectivity were identified in the clinically significant
module, which were found to affect survival time. In the present
study, it was found that FOXM1 and CENPF were not only
significantly positively correlated, as shown by correlation
analysis in the GEO dataset and GEPIA, but also with poor clinical
outcomes according to Kaplan-Meier analysis in LUAD. In addition,
DEGs, prognosis-related and module-trait genes (royal blue module
from WGCNA) were overlapped and screened out using a Venn diagram,
and a total of 17 genes were selected (CENPF, FOXM1, CDC20, PRC1,
CCNF, KIF20A, C19orf48, KIF2C, TTK, NCAPG, C16orf59, KIF14, AUNIP,
POLQ, CDT1, DSP and CCNB1). Next, a total of 17 genes were used to
establish a PPI network and the top five hub genes were selected
using Cytoscape. The five hub genes were FOXM1, CENPF, KIF2C,
KIF20A and NCAPG. When the 5 genes were analyzed in relation to the
clinicopathological features of the patients, FOXM1 and CENPF
expression was found to be statistically significant in both the
univariate and multivariate regression analysis for overall
survival. Finally, as independent predictors of prognosis for
patients, FOXM1 and CENPF were selected as the candidate genes for
further experiments.
FOXM1, also known as HNF-3, HFH-11 and Trident,
belongs to the family of Forkhead box proteins, characterized by a
conserved winged helix DNA-binding domain (29). It is a critical cell-cycle regulator
that works by regulating G1/S and G2/M phase transition of the cell
cycle and guaranteeing the proper course of mitosis cell division
(30). FOXM1 is a
proliferation-related transcription factor that is widely expressed
throughout the life cycle of the cell, involved in cell
proliferation, self-renewal, migration and metastasis, and
chemotherapy and radiation resistance (31,32).
It has been reported that FOXM1 maybe a potential therapeutic
target in human solid cancers (33). CENPF, a member of the centromere
protein family, is involved in the formation of the nuclear matrix
and regulates chromosome segregation during cell mitosis (34). CENPF has been reported to have a
role in mitosis regulation and cellular proliferation. It has been
reported that CENPF is highly expressed in several malignant tumors
and is an independent prognostic indicator (35). Shahid et al (36) found that CENPF is a critical
regulator of cancer metabolism, potentially through pyruvate kinase
M2, and determined the role of CENPF in tumor growth and aggression
in prostate cancer tissue and PC3 cells. The above study also
suggested that CENPF may enhance branched-chain amino acid
catabolism and promote cell proliferation and tumor formation in
prostate cancer, and was regarded as a prognostic biomarker for
prostate cancer progression. Consistent with the bioinformatics
analysis, the present study matches the findings that showed a
higher expression FOXM1 and CENPF in LUAD patients compared with
normal tissue. In clinical experiments, the protein expression of
FOXM1 and CENPF was detected in 22 cases of LUAD. It was revealed
that the expression of FOXM1 and CENPF was higher than that in
normal tissue. In the study of tumor biological behavior,
experimental models are limited and the exploration of
histopathological sections of clinical patients may better reveal
the applicability of biomarkers in humans. Therefore, the staining
of clinicopathological sections in a study with a large sample size
is important. Although histopathology staining was only performed
in 22 cases in the present study, the findings are still
representative. In addition, the staining of patient tissue
sections also verified the value of bioinformatics analysis in
tumor research to a certain extent. At least in the present study,
bioinformatics analysis was consistent with the results of clinical
histopathological slides.
In the present study, FOXM1 and CENPF knockdown was
able to significantly reduce the ability of cell proliferation and
migration of A549 cells and the difference was statistically
significant, which shows that these two genes were able to affect
the progression of LUAD. Consistently, a previous study also showed
that CENPF knockdown was able to significantly inhibit the
migration, proliferation and invasion of osteosarcoma cells
(37). Another study showed that
silencing of FOXM1 was able to suppress the proliferation, invasion
and migration of liver cancer stem cells (38). Previous studies have indicated that
FOXM1 overexpression significantly increased the ability of
tumorigenesis and progression (12,39).
The LUAD cell lines, NCI-H1650, H1299, H460, A549, HCC827 and
NCI-H358, were used, and western blotting and real-time PCR
analysis revealed that cells with high-level FOXM1expression
(NCI-1650 and A549) also showed a high expression of mesenchymal
markers (vimentin, N-cadherin) and low expression of epithelial
markers (E-cadherin), whereas cells with low-level FOXM1expression
(HCC827 and NCI-H358) showed the opposite. Subsequently, they chose
two cell lines expressing high levels of FOXM1 (A549, NCI-H1650)
and two expressing low levels (HCC827, NCI-H358), and carried out
western blot, real-time PCR and cell immunofluorescence analyses.
FOXM1 knockdown attenuated the flattening and spreading of
NCI-H1650 cells, whereas ectopic FOXM1 expression strongly promoted
the flattening and spreading of NCI-H358 cells. These results were
confirmed by migration and invasion assays, revealing that the
migratory and invasive ability were attenuated in FOXM1
siRNA-transfected NCI-H1650 cells, whereas both the migration and
invasion capacities of FOXM1-transfected NCI-H358 cells were
significantly higher than those of control cells. Consistent with
previous studies, the present study also came to the conclusion
that FOXM1 and CENPF expression are unfavorable prognostic factors
of LUAD. The relationship between FOXM1 and CENPF should be further
studied based on a large sample size in the future. In addition, in
previous studies (17,40), the two proteins were positively
correlated, therefore, it is reasonable to speculate that both
FOXM1 and CENPF may promote malignant biological processes such as
tumor invasion, proliferation and metastasis.
Although comprehensive bioinformatics analyses, as
well as in vivo and in vitro experiments were
performed in the present study, it should be noted that there are
several limitations. First, the details of the mechanisms through
which FOXM1 and CENPF regulate LUAD proliferation and migration are
unclear and require further research. In addition, it is imperative
that large-scale prospective clinical studies are conducted.
In conclusion, FOXM1 and CENPF were explored by
means of integrated bioinformatics analysis. Furthermore, in
vitro and in vitro experiments revealed FOXM1 and CENPF
as two potential biomarkers that are significantly upregulated in
LUAD, and the upregulation is closely associated with poor
prognosis in LUAD. This may open up novel perspectives and a
theoretical basis for more effective molecular targeted therapeutic
strategies for LUAD in the future.
Supplementary Material
Supporting Data
Supporting Data
Supporting Data
Supporting Data
Supporting Data
Supporting Data
Supporting Data
Acknowledgements
Not applicable.
Funding
Funding: No funding was received.
Availability of data and materials
The datasets generated and/or analyzed during the
current study are available in the GEO database under accession
nos. GSE41271, GSE42127 and GSE32863. Other data are available from
the corresponding author on reasonable request.
Authors' contributions
PPL performed all experiments and wrote the
manuscript. GM and ZBC collected clinical samples. SSZ and QS
participated in data analysis. ZGC designed the study and reviewed
the manuscript. All authors contributed to the article and have
read and approved the final submitted version. PPL, GM, ZBC, SSZ,
QS and ZGC confirm the authenticity of all the raw data.
Ethics approval and consent to
participate
The current study was approved by the Ethics
Committee of The Second Hospital of Hebei Medical University (code,
2022-R676). All patients enrolled in the study provided informed
consent for the use of their tissues and data.
Patient consent for publication
Not applicable.
Competing interests
The authors declare that they have no competing
interests.
References
|
1
|
Ferlay J, Colombet M, Soerjomataram I,
Parkin DM, Piñeros M, Znaor A and Bray F: Cancer statistics for the
year 2020: An overview. Int J Cancer. Apr 5–2021.(Epub ahead of
print). View Article : Google Scholar
|
|
2
|
Travis WD: Lung cancer pathology: Current
concepts. Clin Chest Med. 41:67–85. 2020. View Article : Google Scholar : PubMed/NCBI
|
|
3
|
Bergethon K, Shaw AT, Ou SH, Katayama R,
Lovly CM, McDonald NT, Massion PP, Siwak-Tapp C, Gonzalez A, Fang
R, et al: ROS1 rearrangements define a unique molecular class of
lung cancers. J Clin Oncol. 30:863–870. 2012. View Article : Google Scholar : PubMed/NCBI
|
|
4
|
Paez JG, Jänne PA, Lee JC, Tracy S,
Greulich H, Gabriel S, Herman P, Kaye FJ, Lindeman N, Boggon TJ, et
al: EGFR mutations in lung cancer: Correlation with clinical
response to gefitinib therapy. Science. 304:1497–1500. 2004.
View Article : Google Scholar : PubMed/NCBI
|
|
5
|
Solomon BJ, Mok T, Kim DW, Wu YL, Nakagawa
K, Mekhail T, Felip E, Cappuzzo F, Paolini J, Usari T, et al:
First-line crizotinib versus chemotherapy in ALK-positive lung
cancer. N Engl J Med. 371:2167–2177. 2014. View Article : Google Scholar : PubMed/NCBI
|
|
6
|
Lin JJ, Cardarella S, Lydon CA, Dahlberg
SE, Jackman DM, Jänne PA and Johnson BE: Five-year survival in
EGFR-Mutant metastatic lung adenocarcinoma treated with EGFR-TKIs.
J Thorac Oncol. 11:556–565. 2016. View Article : Google Scholar : PubMed/NCBI
|
|
7
|
Miller KD, Siegel RL, Lin CC, Mariotto AB,
Kramer JL, Rowland JH, Stein KD, Alteri R and Jemal A: Cancer
treatment and survivorship statistics, 2016. CA Cancer J Clin.
66:271–289. 2016. View Article : Google Scholar : PubMed/NCBI
|
|
8
|
Katoh M and Katoh M: Human FOX gene family
(Review). Int J Oncol. 25:1495–1500. 2004.PubMed/NCBI
|
|
9
|
Zhu H: Forkhead box transcription factors
in embryonic heart development and congenital heart disease. Life
Sci. 144:194–201. 2016. View Article : Google Scholar : PubMed/NCBI
|
|
10
|
He SY, Shen HW, Xu L, Zhao XH, Yuan L, Niu
G, You ZS and Yao SZ: FOXM1 promotes tumor cell invasion and
correlates with poor prognosis in early-stage cervical cancer.
Gynecol Oncol. 127:601–610. 2012. View Article : Google Scholar : PubMed/NCBI
|
|
11
|
Jiang D, Jiang L, Liu B, Huang H, Li W,
Zhang T, Zu G and Zhang X: Clinicopathological and prognostic
significance of FoxM1 in gastric cancer: A meta-analysis. Int J
Surg. 48:38–44. 2017. View Article : Google Scholar : PubMed/NCBI
|
|
12
|
Kong FF, Qu ZQ, Yuan HH, Wang JY, Zhao M,
Guo YH, Shi J, Gong XD, Zhu YL, Liu F, et al: Overexpression of
FOXM1 is associated with EMT and is a predictor of poor prognosis
in non-small cell lung cancer. Oncol Rep. 31:2660–2668. 2014.
View Article : Google Scholar : PubMed/NCBI
|
|
13
|
Kim HE, Kim DG, Lee KJ, Son JG, Song MY,
Park YM, Kim JJ, Cho SW, Chi SG, Cheong HS, et al: Frequent
amplification of CENPF, GMNN and CDK13 genes in hepatocellular
carcinomas. PLoS One. 7:e432232012. View Article : Google Scholar : PubMed/NCBI
|
|
14
|
Sun J, Huang J, Lan J, Zhou K, Gao Y, Song
Z, Deng Y, Liu L, Dong Y and Liu X: Overexpression of CENPF
correlates with poor prognosis and tumor bone metastasis in breast
cancer. Cancer Cell Int. 19:2642019. View Article : Google Scholar : PubMed/NCBI
|
|
15
|
Ho DW, Lam WM, Chan LK and Ng IO:
Investigation of functional synergism of CENPF and FOXM1 identifies
POLD1 as downstream target in hepatocellular carcinoma. Front Med
(Lausanne). 9:8603952022. View Article : Google Scholar : PubMed/NCBI
|
|
16
|
Laoukili J, Kooistra MR, Brás A, Kauw J,
Kerkhoven RM, Morrison A, Clevers H and Medema RH: FoxM1 is
required for execution of the mitotic programme and chromosome
stability. Nat Cell Biol. 7:126–136. 2005. View Article : Google Scholar : PubMed/NCBI
|
|
17
|
Aytes A, Mitrofanova A, Lefebvre C,
Alvarez MJ, Castillo-Martin M, Zheng T, Eastham JA, Gopalan A,
Pienta KJ, Shen MM, et al: Cross-species regulatory network
analysis identifies a synergistic interaction between FOXM1 and
CENPF that drives prostate cancer malignancy. Cancer Cell.
25:638–651. 2014. View Article : Google Scholar : PubMed/NCBI
|
|
18
|
Langfelder P and Horvath S: WGCNA: An R
package for weighted correlation network analysis. BMC
Bioinformatics. 9:5592008. View Article : Google Scholar : PubMed/NCBI
|
|
19
|
Sato M, Larsen JE, Lee W, Sun H, Shames
DS, Dalvi MP, Ramirez RD, Tang H, DiMaio JM, Gao B, et al: Human
lung epithelial cells progressed to malignancy through specific
oncogenic manipulations. Mol Cancer Res. 11:638–650. 2013.
View Article : Google Scholar : PubMed/NCBI
|
|
20
|
Tang H, Xiao G, Behrens C, Schiller J,
Allen J, Chow CW, Suraokar M, Corvalan A, Mao J, White MA, et al: A
12-gene set predicts survival benefits from adjuvant chemotherapy
in non-small cell lung cancer patients. Clin Cancer Res.
19:1577–1586. 2013. View Article : Google Scholar : PubMed/NCBI
|
|
21
|
Selamat SA, Chung BS, Girard L, Zhang W,
Zhang Y, Campan M, Siegmund KD, Koss MN, Hagen JA, Lam WL, et al:
Genome-scale analysis of DNA methylation in lung adenocarcinoma and
integration with mRNA expression. Genome Res. 22:1197–1211. 2012.
View Article : Google Scholar : PubMed/NCBI
|
|
22
|
Tang Z, Li C, Kang B, Gao G, Li C and
Zhang Z: GEPIA: A web server for cancer and normal gene expression
profiling and interactive analyses. Nucleic Acids Res 45 (W1).
W98–W102. 2017. View Article : Google Scholar : PubMed/NCBI
|
|
23
|
Subramanian A, Tamayo P, Mootha VK,
Mukherjee S, Ebert BL, Gillette MA, Paulovich A, Pomeroy SL, Golub
TR, Lander ES and Mesirov JP: Gene set enrichment analysis: A
knowledge-based approach for interpreting genome-wide expression
profiles. Proc Natl Acad Sci USA. 102:15545–15550. 2005. View Article : Google Scholar : PubMed/NCBI
|
|
24
|
Liberzon A, Subramanian A, Pinchback R,
Thorvaldsdóttir H, Tamayo P and Mesirov JP: Molecular signatures
database (MSigDB) 3.0. Bioinformatics. 27:1739–1740. 2011.
View Article : Google Scholar : PubMed/NCBI
|
|
25
|
Livak KJ and Schmittgen TD: Analysis of
relative gene expression data using real-time quantitative PCR and
the 2(−Delta Delta C(T)) method. Methods. 25:402–408. 2001.
View Article : Google Scholar : PubMed/NCBI
|
|
26
|
Bray F, Ferlay J, Soerjomataram I, Siegel
RL, Torre LA and Jemal A: Global cancer statistics 2018: GLOBOCAN
estimates of incidence and mortality worldwide for 36 cancers in
185 countries. CA Cancer J Clin. 68:394–424. 2018. View Article : Google Scholar : PubMed/NCBI
|
|
27
|
Hirsch FR, Scagliotti GV, Mulshine JL,
Kwon R, Curran WJ Jr, Wu YL and Paz-Ares L: Lung cancer: Current
therapies and new targeted treatments. Lancet. 389:299–311. 2017.
View Article : Google Scholar : PubMed/NCBI
|
|
28
|
Neel DS and Bivona TG: Resistance is
futile: Overcoming resistance to targeted therapies in lung
adenocarcinoma. NPJ Precis Oncol. 1:32017. View Article : Google Scholar : PubMed/NCBI
|
|
29
|
Clark KL, Halay ED, Lai E and Burley SK:
Co-crystal structure of the HNF-3/fork head DNA-recognition motif
resembles histone H5. Nature. 364:412–420. 1993. View Article : Google Scholar : PubMed/NCBI
|
|
30
|
Wang X, Kiyokawa H, Dennewitz MB and Costa
RH: The Forkhead Box m1b transcription factor is essential for
hepatocyte DNA replication and mitosis during mouse liver
regeneration. Proc Natl Acad Sci USA. 99:16881–16886. 2002.
View Article : Google Scholar : PubMed/NCBI
|
|
31
|
Kalin TV, Ustiyan V and Kalinichenko VV:
Multiple faces of FoxM1 transcription factor: Lessons from
transgenic mouse models. Cell Cycle. 10:396–405. 2011. View Article : Google Scholar : PubMed/NCBI
|
|
32
|
Halasi M and Gartel AL: Targeting FOXM1 in
cancer. Biochem Pharmacol. 85:644–652. 2013. View Article : Google Scholar : PubMed/NCBI
|
|
33
|
Borhani S and Gartel AL: FOXM1: A
potential therapeutic target in human solid cancers. Expert Opin
Ther Targets. 24:205–217. 2020. View Article : Google Scholar : PubMed/NCBI
|
|
34
|
Varis A, Salmela AL and Kallio MJ: Cenp-F
(mitosin) is more than a mitotic marker. Chromosoma. 115:288–295.
2006. View Article : Google Scholar : PubMed/NCBI
|
|
35
|
Li X, Li Y, Xu A, Zhou D, Zhang B, Qi S,
Chen Z, Wang X, Ou X, Cao B, et al: Apoptosis-induced translocation
of centromere protein F in its corresponding autoantibody
production in hepatocellular carcinoma. Oncoimmunology.
10:19921042021. View Article : Google Scholar : PubMed/NCBI
|
|
36
|
Shahid M, Kim M, Lee MY, Yeon A, You S,
Kim HL and Kim J: Downregulation of CENPF remodels prostate cancer
cells and alters cellular metabolism. Proteomics. 19:e19000382019.
View Article : Google Scholar : PubMed/NCBI
|
|
37
|
Ma Y, Guo J, Li D and Cai X:
Identification of potential key genes and functional role of CENPF
in osteosarcoma using bioinformatics and experimental analysis. Exp
Ther Med. 23:802022. View Article : Google Scholar : PubMed/NCBI
|
|
38
|
Chen L, Wu M, Ji C, Yuan M, Liu C and Yin
Q: Silencing transcription factor FOXM1 represses proliferation,
migration, and invasion while inducing apoptosis of liver cancer
stem cells by regulating the expression of ALDH2. IUBMB Life.
72:285–295. 2020. View Article : Google Scholar : PubMed/NCBI
|
|
39
|
Wei P, Zhang N, Wang Y, Li D, Wang L, Sun
X, Shen C, Yang Y, Zhou X and Du X: FOXM1 promotes lung
adenocarcinoma invasion and metastasis by upregulating SNAIL. Int J
Biol Sci. 11:186–198. 2015. View Article : Google Scholar : PubMed/NCBI
|
|
40
|
Lin SC, Kao CY, Lee HJ, Creighton CJ,
Ittmann MM, Tsai SJ, Tsai SY and Tsai MJ: Dysregulation of
miRNAs-COUP-TFII-FOXM1-CENPF axis contributes to the metastasis of
prostate cancer. Nat Commun. 7:114182016. View Article : Google Scholar : PubMed/NCBI
|