Introduction
Pancreatic ductal adenocarcinoma (PDAC) is the
seventh leading cause of cancer-associated mortality worldwide
(1). Despite improvements in
diagnostic and therapeutic methods, its 5-year survival rate
remains ~10%, which is the lowest among all of the cancer types
investigated in the USA (2). The
reasons why patients with PDAC exhibit a poor prognosis include its
rapid progression, limited medical treatments and low therapeutic
effect. The majority of patients are diagnosed after invasion and
distant metastasis (3–5), and are not candidates for surgical
tumor resection, and it is thus difficult to cure completely.
Therefore, it is important to develop a biomarker for early
prognosis and targeted drugs for PDAC.
Cancer stem cells (CSCs) have stemness properties
such as self-renewal, multipotency and the promotion of
tumorigenesis (6,7). CSCs exhibit resistance to standard
therapies, such as chemotherapy and radiotherapy, and therefore can
cause relapse after treatments (6–8). In
PDAC, cells with high aldehyde dehydrogenase 1 (ALDH1) activity
(ALDH1high) have stemness properties, such as
self-renewal, differentiation, and tumor formation (9–13).
ALDH1 is a detoxification enzyme that converts aldehydes into
carboxylic acids in cells, and has several subtypes, including
ALDH1A1 and ALDH1A3, which are known as CSC markers in several
types of cancer (9,14–16).
It is known that ALDH1A1 and ALDH1A3 expression levels are higher
in PDAC tumors than in normal tissues, and that high ALDH1A3
expression in PDACs is associated with poor clinical outcomes
(17–19).
Solute carrier family 20 member 1 (SLC20A1) is a
sodium/inorganic phosphate (Pi) symporter that is responsible for
Pi uptake into cells (20,21). Previous reports have shown that high
SLC20A1 expression is a prognostic factor for esophageal
carcinoma, and breast, lung, pancreatic and prostate cancers
(22–31). At the early tumor stage of estrogen
receptor-positive (ER+) breast cancer, high
SLC20A1 expression predicts a poor clinical outcome
(22). Furthermore, high
SLC20A1 expression is less effective for endocrine therapy
and predicts late recurrence in ER+ breast cancer
(22), and is also less effective
for radiotherapy in basal-like, claudin-low and ER+
subtypes of breast cancer (23,24).
In addition, SLC20A1 contributes to cell viability and tumor
formation of ALDH1-positive breast CSCs (23). In HeLa, HepG2, MC3T3-E1 and NIH3T3
cell lines, SLC20A1 small interfering RNA (siRNA) knockdown
(KD) has been shown to induce the suppression of cell proliferation
and cell motility, and to induce TNFα-mediated apoptosis (32–34).
However, the relationship between SLC20A1 expression and CSC
markers, such as ALDH1, in PDAC, and the role of SLC20A1 in
PDAC CSCs remains to be elucidated.
This study revealed that high SLC20A1
expression indicated a poor prognosis at the early tumor stage of
PDAC, and high expression levels of SLC20A1 and
ALDH1A3 indicated a poorer prognosis in PDAC. In addition,
the current results showed that SLC20A1 was involved in cell
survival and the formation of tumorspheres in ALDH1-positive PDAC
CSCs.
Materials and methods
Analysis of the pancreatic
adenocarcinoma [The Cancer Genome Atlas (TCGA), Pan-Cancer Atlas)]
dataset
The TCGA, Pan-Cancer Atlas dataset (n=184) (35,36)
was downloaded from cBioPortal (https://www.cbioportal.org/) (37,38) on
December 8, 2020. Data on SLC20A1 expression in normal
tissues and primary tumors that were not derived from the same
patients were downloaded from UALCAN (39). Statistical analyses were carried out
by BellCurve for Excel version 4.03 software (Social Survey
Research Information Co., Ltd.). The clinicopathological data of
the Pan-Cancer Atlas dataset are summarized in Table SI. TCGA, Pan-Cancer Atlas dataset
contains data on gene alterations, mRNA expression levels of
primary pancreatic cancer samples (n=177), overall survival (OS)
(n=177), disease-specific survival (DSS) (n=171), disease-free
interval (DFI) (n=69), progression-free interval (PFI) (n=177),
gene mutation (n=172) and copy number alteration (n=176). Beeswarm
plots were drawn in GraphPad Prism ver. 9.5.1 (GraphPad Software)
and analyzed expression of SLC20A1 gene in patients with
gene alternations. The optimal cutoff thresholds to classify the
patients into high- and low-mRNA expression groups were defined
using receiver operator characteristic curve (ROC) of
SLC20A1 and other stem cell markers, and was determined by
using the Youden's index. Survival curves of OS, DSS, DFI and PFI
were depicted using the Kaplan-Meier method, and were compared by
log-rank (Cochran-Mantel-Haenszel) test. Multivariate Cox
regression analysis with age at diagnosis and sex as confounding
factors was performed to evaluate the influence of gene expression,
and to estimate adjusted hazard ratios (HRs) for OS, DSS, DFI and
PFI statuses. Two-sided P<0.05 was considered to indicate a
statistically significant difference.
Cell lines and culture
The human PDAC cell line PANC-1 was purchased from
the American Type Culture Collection (CRL-1469; Manassas, Virginia,
USA). The MIA-PaCa-2 cell line was purchased from the Japanese
Cancer Research Resources Bank (JCRB0070; Tokyo, Japan). Both cell
lines were cultured in Dulbecco's Modified Eagle Medium (DMEM)
containing 10% fetal bovine serum (cat. no. 175012; Nichirei
Biosciences, Inc.), L-glutamine (cat. no. 073-05391; Wako, Tokyo,
Japan) and 1% penicillin/streptomycin (cat. no. 168-23191; Wako) at
37°C with 5% CO2. These cell lines were evaluated by
using a mycoplasma detecting kit (cat. no. 25235; Intron
Biotechnology, Inc.) and were negative for mycoplasma.
siRNA transfection
RNA interference-mediated SLC20A1 KD was
performed by transfection of the PDAC cell lines with
Dicer-Substrate Short Interfering RNA (DsiRNA) for SLC20A1
(sense strand, 5′-CUCUAGUGGCUUCAGUAUUGAACTG-3′; antisense strand,
5′-CAGUUCAAUACUGAAGCCACUAGAGGG-3′) (Integrated DNA Technologies,
Inc., Iowa, USA) (23). Control
DsiRNA (sense strand, 5′-CGUUAAUCGCGUAUAAUACGCGUAT-3′; antisense
strand, 5′-AUACGCGUAUUAUACGCGAUUAACGAC-3′) (Integrated DNA
Technologies, Inc., Iowa, USA) was used as a negative control (NC).
Transfection was performed using Lipofectamine® RNAiMAX
(cat. no. 13778-150; Thermo Fisher Scientific, Inc.). Cells were
transfected with 10 nM DsiRNA and incubated for 24 h, followed by
re-transfection with 10 nM DsiRNA and incubation for an additional
24 h, and were then subjected to assays. KD efficiency was
monitored by quantitative PCR (qPCR) as detailed in the next
section. In the tumorsphere formation, WST-8 assay, trypan-blue
assay, caspase-3/7 fluorometric assay, and apoptosis staining, qPCR
of SLC20A1 was performed 48 h after first DsiRNA
transfection. In the western blot analysis of proteins associated
with p38, JNK, p44/42 and Akt signaling, 48 h after DsiRNA
transfection, the subsequent tumorspheres were cultured for 72 h
(PANC-1) or 24 h (MIA-PaCa-2), and then qPCR were done.
qPCR
qPCR was conducted as previously described (17,23,40).
mRNA expression was examined with THUNDERBIRD probe qPCR Mix
(TOYOBO) according to the manufacturer's instructions. The reaction
conditions were as follows: 95°C for 1 min, followed by 45 cycles
of denaturation at 95°C for 10 sec and extension at 60°C for 1 min.
The following probes were used: SLC20A1 probe,
5′-/FAM/TTAGGCAACTGCACTGCACCATTCACGG/TAMRA/-3′; forward primer,
5′-GCGTGGACTTGAAAGAGGAAAC-3′; and reverse primer,
5′-CTGACGGCTTGACTGAACTGG-3′; ALDH1A1 probe,
5′-/6-FAM/TGGAAGAGA/ZEN/ACTGGGAGAGTACGGTT/3IABkFQ/-3′; forward
primer, 5′-GTTCTTCTGAGAGATTTTCACTGTG-3′; and reverse primer,
5′-TGGTGGATTCAAGATGTCTGG-3′ and ALDH1A3 probe, 5′-/6-FAM/AGA TAA
GCC/ZEN/CGACGTGGACAAGG/3IABkFQ/-3′; forward primer,
5′-CTCTGGAAGGCAACCTGTG-3′; and reverse primer,
5′-GGAGCAAATATGTGAAGTGGAAG-3′. Quantification was performed using
the calibration curve method (17,23,40).
We used the Eukaryotic 18S rRNA Endogenous Control (4319413E;
Thermo Fisher Scientific, Inc.) and normalization was performed
based on the internal control. The sequences were not
disclosed.
Tumorsphere culture
In vitro tumorsphere formation was carried
out as previously described (10,23,40–43).
After SLC20A1 KD, unsorted cells and isolated
ALDH1high cells were seeded in ultralow attachment
96-well plates (1×10³ cells/well) (cat. no. 655970;
Greiner Bio-One GmbH) and cultured for 5 days in medium containing
0.6% methylcellulose (cat. no. 22222-62; Nacalai Tesque, Inc.,
Kyoto, Japan). Images were captured using a microscope (DM5500B;
Leica Microsystems, Inc.). The number and size of tumorspheres
>314 µm2 were calibrated using ImageJ 1.51j8; Java
1.8.0_112 [64-bit] software (National Institutes of Health,
Bethesda, Maryland, USA).
WST-8 assay
The WST-8 assay was performed as previously
described (10,40,44,45).
After SLC20A1 KD, unsorted and sorted ALDH1high
cells were plated into 96-well plates (1×10³ cells/well)
(cat. no. 167008, Thermo Fisher Scientific, Inc.) and were
incubated for 5 days. A color reaction was carried out using Cell
Counting Reagent SF (cat. no. 07553-44, Nacalai Tesque, Inc.) and
the formed formazan dye was measured using a Sunrise Remote
microplate reader (Tecan Group, Ltd.) at 450 nm.
Trypan blue assay
The trypan blue assay was carried out as previously
described (40,44). Unsorted and sorted
ALDH1high cells were plated into 12-well plates (cat.
no. 150628; Thermo Fisher Scientific, Inc.) at a density of
2×10⁴ cells per well in the case of unsorted cells or
1.5×10⁴ cells per well for sorted ALDH1high
cells. After 48 h of incubation, cells were stained with 0.4% w/v
trypan blue solution (cat. no. 207-17081; Wako, Tokyo, Japan) and
trypan blue-positive cells were counted using a hemocytometer (cat.
no. 03-202-1; Erma Inc.).
Caspase-3/7 fluorometric assay
The Apo-ONE® Homo-geneous Caspase-3/7
Assay kit (cat. no. G7790; Promega Corporation) was used as
previously described (40,44). Unsorted and sorted
ALDH1high cells were plated into 96-well black plates
(cat. no. 3916; Corning, Inc.) at a density of 1×10⁴
cells per well, and were incubated for 48 h (unsorted cells) or 24
h (sorted ALDH1high cells). Apo-ONE® caspase
reagent was then added to the cells, and the mixture was incubated
for 30 min at room temperature. Fluorescence was measured using a
fluorescence plate reader (excitation, 485 nm; emission, 535 nm)
(ARVO; PerkinElmer, Inc.). The background fluorescence was measured
as the fluorescence from DMEM alone and was subtracted from all of
the experimental values.
Western blotting
PANC-1 and MIA-PaCa-2 cells from two-dimensional
monolayer culture or three-dimensional tumorspheres were lysed in
RIPA buffer containing a protease inhibitor (cat. no. 03969-21,
Nacalai Tesque, Inc.) and a phosphatase inhibitor (cat. no.
07575-51; Nacalai Tesque, Inc.). Western blotting was carried out
as previously described (40,44,45).
Extracts were then separated by SDS-PAGE on 8% gels and were
transferred onto Immobilon-P membranes (cat. no. ISEQ00010;
MilliporeSigma). The membranes were then blocked with 5% skim milk
or BSA in TBS-Tween 20, incubated with primary antibodies at 4°C
for 18 h, and then probed with horseradish peroxidase-conjugated
secondary antibodies. Specific signals were detected using the
chemiluminescence reagents Immunostar LD (cat. no. 290-69904; Wako)
or EzWestLumiOne (cat. no. 2332632; ATTO Corporation, Tokyo, Japan)
with ChemiDoc MP (Bio-Rad Laboratories, Inc.). The primary
antibodies were as follows: mouse anti-p-p38 monoclonal antibody
(mAb) (cat. no. 9216s; Cell Signaling Technology, Inc.; 1:3,000);
rabbit anti-p38 polyclonal antibody (pAb) (cat. no. 9212s; Cell
Signaling Technology, Inc. Danvers, MA, USA; 1:3,000); rabbit
anti-phosphorylated (p)-c-Jun N-terminal Kinase (JNK) pAb (cat. no.
9251s; Cell Signaling Technology, Inc.; 1:3,000); rabbit anti-JNK
pAb (cat. no. 9252s; Cell Signaling Technology, Inc.; 1:3,000);
rabbit anti-p-p44/p42 pAb (cat. no. 9101s; Cell Signaling
Technology, Inc.; 1:3,000); rabbit anti-p44/p42 pAb (cat. no.
9102s; Cell Signaling Technology, Inc.; 1:3,000); rabbit anti-p-Akt
S473 mAb (cat. no. 4060s; Cell Signaling Technology, Inc.;
1:3,000); rabbit anti-Akt mAb (cat. no. 2938s; Cell Signaling
Technology, Inc.; 1:3,000); rabbit anti-ALDH1A1 mAb (cat. no.
ab52492; Abcam; 1:5,000); rabbit anti-ALDH1A3 pAb (cat. no.
PA5-29188; Thermo Fisher Scientific, Inc.; 1:5,000); and mouse
anti-β-actin mAb (cat. no. 60008-1-Ig; ProteinTech Group, Inc.;
1:10,000). Goat anti-mouse and anti-rabbit IgG (cat. no. 7076S and
7074S, respectively; Cell Signaling Technology, Inc.) were used as
secondary antibodies according to the primary antibody used.
β-actin as the internal control was reprobed with mouse
anti-β-actin mAb after stripping targeted antibody. Stripping was
performed using Stripping solution (cat. no. 193-16375, Wako)
according to the manufacturer's protocol.
ALDEFLUOR assay
ALDH1high cells were isolated from the
PANC-1 and MIA-PaCa-2 cell lines using the ALDEFLUOR™
assay kit (cat. no. ST-01700; Stemcell Technologies, Inc.,
Vancouver, BC, Canada) according to the manufacturer's protocol as
previously described (10,40,44).
The cell population with the highest ALDH1 activity (5–10% of total
cells) was sorted as ALDH1high cells by the FACS Aria
III or FACS Melody cell sorters (BD Biosciences), whereas the cell
population with the lowest ALDH1 activity was sorted as
ALDH1low cells.
Apoptosis staining
Apoptotic staining of ALDH1high PANC-1
and ALDH1high MIA-PaCa-2 cells was performed using the
Cell Meter™ Apoptotic and Necrotic Multiplexing
Detection Kit I (cat. no. 22840; AAT Bioquest, Inc.) according to
the manufacturer's protocol. Living cells were stained with 0.1%
Hoechst 33342 (cat. no. H3570; Invitrogen; Thermo Fisher
Scientific, Inc.). Images were then captured using a microscope
(DMI6000B-AFC; Leica Corporation) and the number of stained cells
was counted with the counting software Katikaticounter (Vector
Laboratories, Inc.).
Statistical analysis
For the gene expression analysis, to analyze
SLC20A1 expression in normal tissues and primary tumors
using the downloaded data from UALCAN, P-values were calculated
using an unpaired Student's t-test. P-values for the comparisons of
gene expression among stages were calculated using the
Kruskal-Wallis test with Steel's post hoc test. Pearson's
correlation coefficients (r) were calculated and P-values were
calculated using the t-test for testing the population correlation
coefficient is zero (null hypothesis). To analyze the association
between gene expression of CSC markers such as SLC20A1,
ALDH1A1 and ALDH1A3, and gene mutation or copy number
alterations of KRAS, CDKN2A, TP53 and SMAD4, P-values
were calculated using the Kruskal-Wallis test with Steel's test.
Survival curves were plotted by the Kaplan-Meier method for
univariate analysis, and P-values were calculated by the
Cochran-Mantel-Haenszel generalized log-rank test. Multiplicity was
adjusted using the Bonferroni test as a post hoc test. A
multivariate Cox regression model with age and sex as a confounding
factor was performed to evaluate the effect of gene expression and
to estimate the adjusted HRs. Statistical analysis was performed
using BellCurve for Excel version 4.04 software (Social Survey
Research Information Co., Ltd.). Tumorsphere formation data and the
relative number of apoptotic cells are shown as the mean ± standard
deviation of three independent experiments, whereas data obtained
from the WST-8, trypan blue and caspase-3/7 fluorometric assays are
shown as the mean ± standard error (SE) of three independent
experiments and were analyzed using an unpaired Student's t-test.
To examine the siRNA knockdown efficiency, the statistical
significance between NC KD and SLC20A1 KD cells was
determined using an unpaired Student's t-test. Two-sided P<0.05
was considered to indicate a statistically significant difference.
For the mRNA expression analysis in ALDH1high and
ALDH1low MIA-PaCa-2 cells, data are shown as the mean ±
SE of three independent experiments and were analyzed using an
unpaired Student's t-test.
Results
High SLC20A1 gene expression is
associated with driver gene mutation for KRAS, CDKN2A, TP53 and
SMAD4 in PDAC
Our group previously reported that SLC20A1
gene expression was higher in breast cancer than in normal breast
tissues (23). The present study
explored SLC20A1 expression in PDAC. Unlike breast cancer,
SLC20A1 gene expression was not statistically significantly
different in PDAC tumors compared to normal tissues (Fig. S1A). Next, SLC20A1 expression
was compared according to tumor stages. Although SLC20A1
expression was largely unchanged between normal tissues and stage I
tumors, the expression of SLC20A1 gradually increased in the
order of stage II, III and IV compared with stage I (Fig. S1B). A similar expression pattern of
SLC20A1 was obtained from another dataset (Fig. S1C). There was no gene
amplification, deletion or fusion, and only 1 patient with PDAC had
a mutation in the SLC20A1 locus (0.57%, 1/175). In PDAC
progression, a multistep carcinogenesis proceeds from sequential
mutations in driver genes for KRAS, CDKN2A, TP53, and
SMAD4 in the premalignant state (46). Therefore, we next examined whether
these driver gene mutations were associated with SLC20A1
gene expression (Fig. 1).
SLC20A1 gene expression in PDAC tumors with KRAS
missense mutations, such as G12D, G12V, G12R and G12C, was
significantly higher than that in PDAC tumors without KRAS
mutations (Fig. 1A). TP53
missense and truncating mutations were also associated with high
SLC20A1 expression (Fig.
1C). In addition, SLC20A1 expression in PDAC tumors with
deep deletion and deletion of CDKN2A, TP53, or SMAD4
was higher than that with each diploid gene (Fig. 1F-H). KRAS missense mutations
are introduced during the early steps of premalignant progression
in PDAC. Therefore, these results suggested that high
SLC20A1 expression may be obtained during an early step of
PDAC progression.
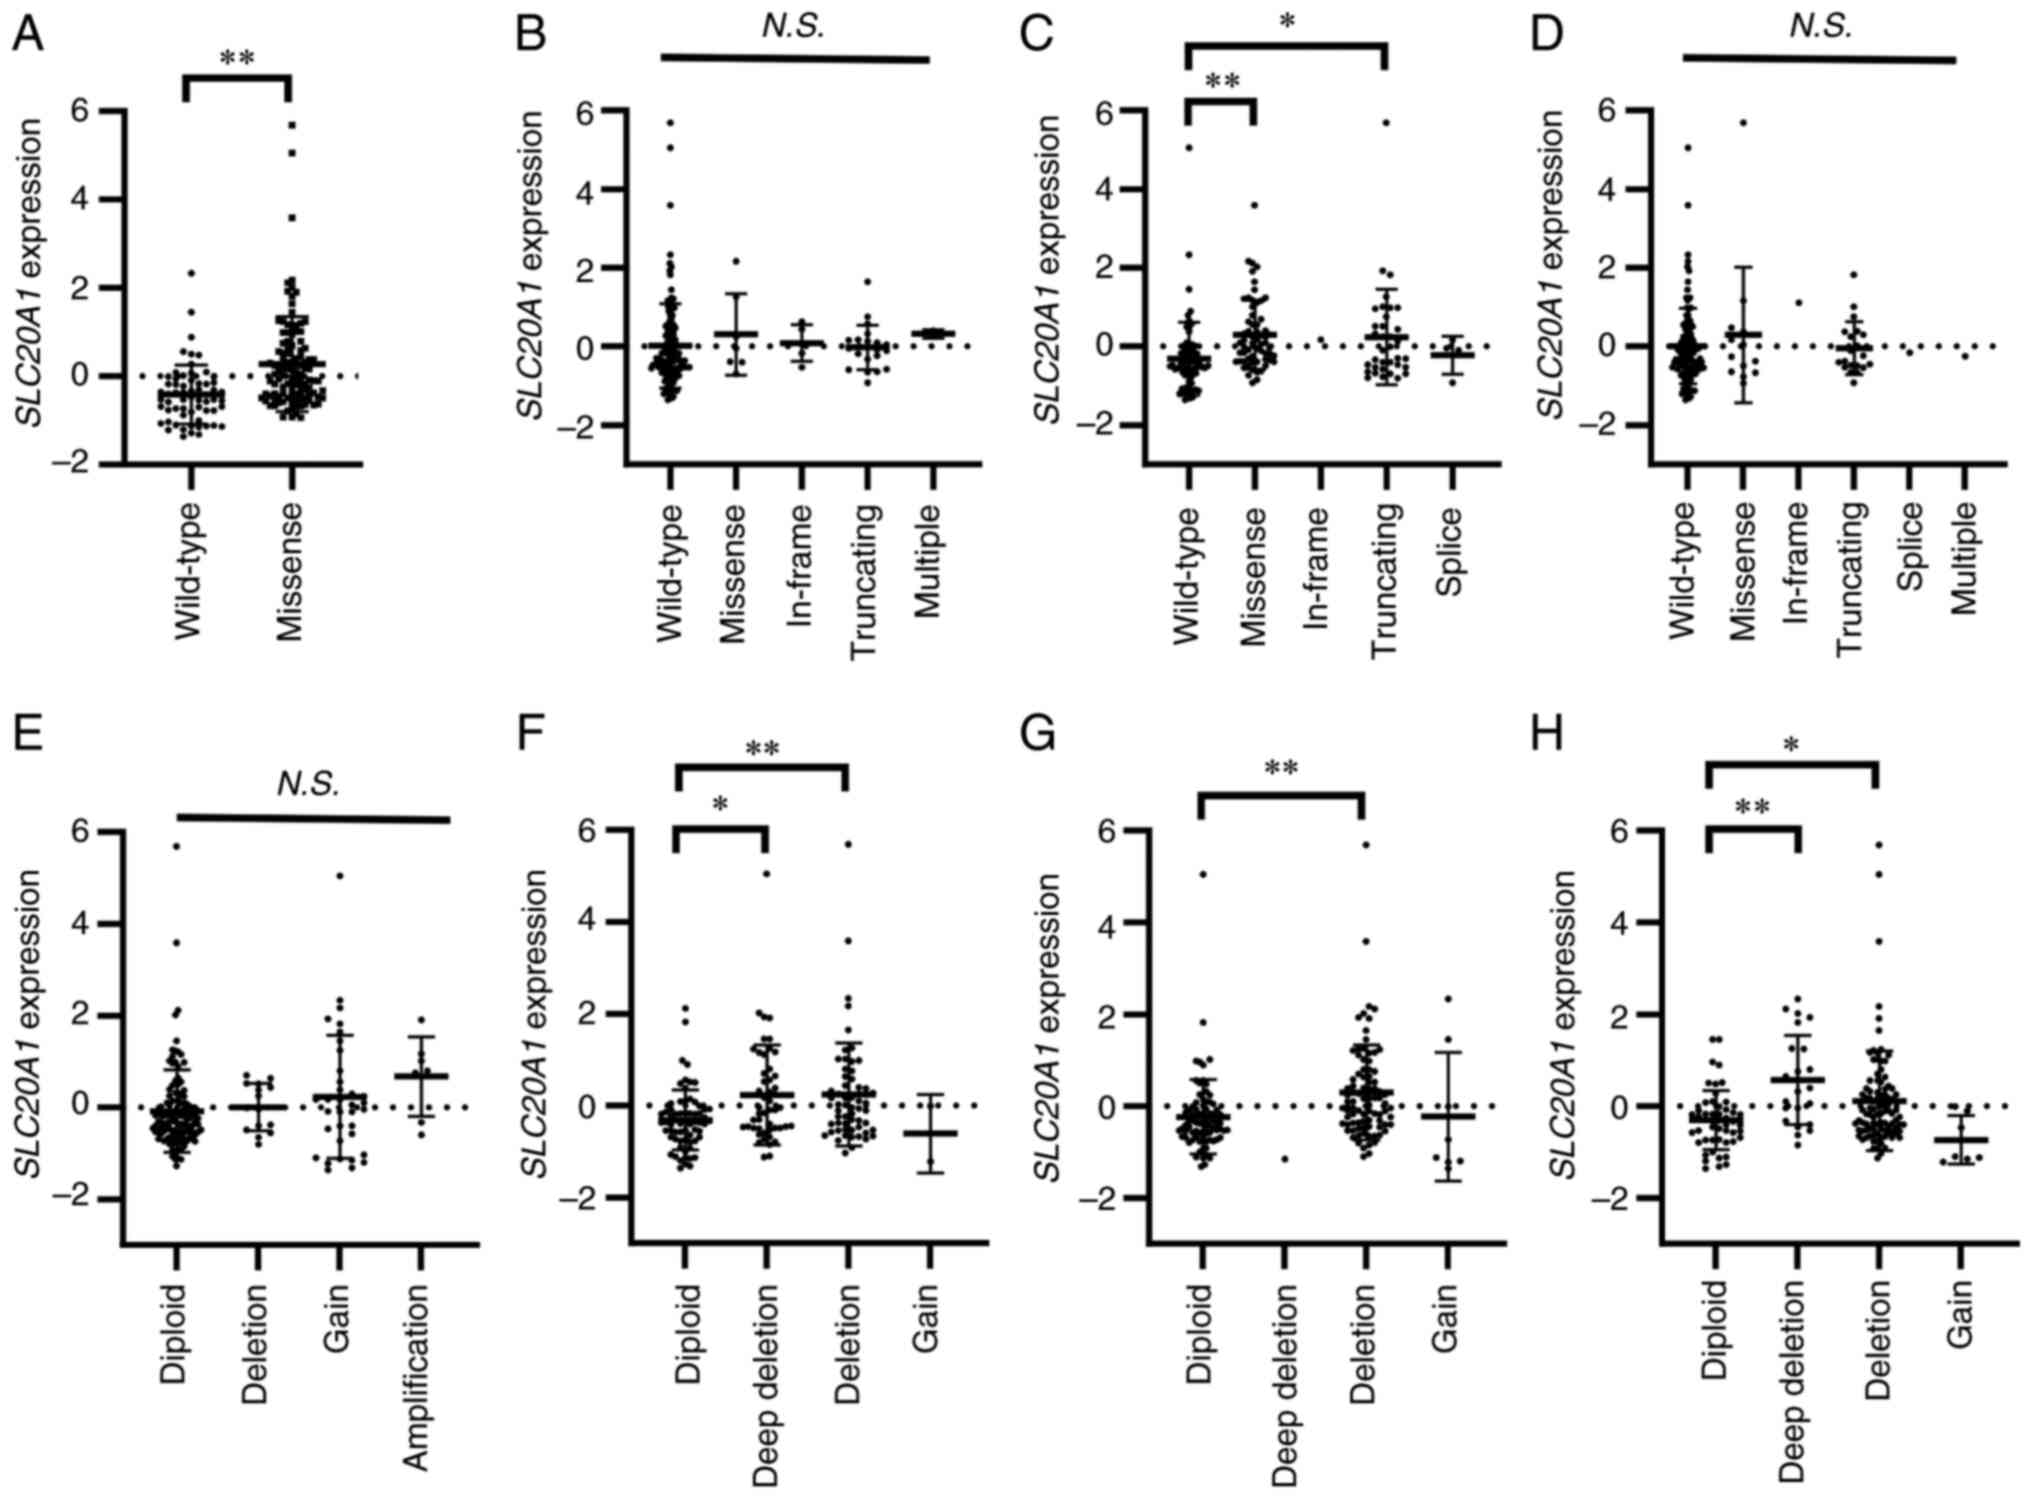 | Figure 1.Association between SLC20A1
gene expression and gene mutation or copy number alterations of
KRAS, CDKN2A, TP53 and SMAD4. (A-H) Beeswarm plots
showing the association between SLC20A1 gene expression and
driver gene status. (A-D) Comparison of SLC20A1 gene
expression and gene mutations (wild-type, missense, in-frame,
truncating, splice and multiple) of (A) KRAS, (B)
CDKN2A, (C) TP53 and (D) SMAD4. (E-H)
Comparison of SLC20A1 gene expression and copy number
alterations of (E) KRAS, (F) CDKN2A, (G) TP53
and (H) SMAD4. *P<0.05, **P<0.01; Kruskal-Wallis test
with Steel's test. SLC20A1, solute carrier family 20 member
1; KRAS, KRAS proto-oncogene, GTPase; CDKN2A, cyclin
dependent kinase inhibitor 2A; TP53, tumor protein p53;
SMAD4, SMAD family member 4; N.S., not
significant. |
Patients with SLC20A1high
at stage I have a poorer prognosis
To examine the association between SLC20A1
gene expression and the prognosis of different tumor stages, as
indicated by parameters such as OS, DSS, DFI and PFI, Kaplan-Meier
and multivariate Cox regression analyses were performed.
Kaplan-Meier analyses of all tumors indicated that patients with
SLC20A1high showed poorer prognoses than patients
with SLC20A1low (OS: P=0.0080; DSS: P=0.0050;
DFI: P=0.011; and PFI: P=0.0023) (Fig.
2A-D). Kaplan-Meier analyses at tumor stage I indicated that
patients with SLC20A1high showed poorer prognosis
than those with SLC20A1low (DSS: P=0.017; DFI:
P<0.001; and PFI: P<0.001) (Fig.
2E-H). At tumor stage II, Kaplan-Meier analyses comparing OS,
DSS and DFI did not show significant differences between patients
with SLC20A1high or SLC20A1low
(Fig. 2I-K). However, patients with
SLC20A1high showed poorer prognosis than patients
with SLC20A1low regarding PFI (P=0.026) (Fig. 2L). At tumor stages III and IV, there
was no significant differences between patients with
SLC20A1high or SLC20A1low
regarding OS, DSS or PFI (Fig.
2M-O). Notably, DFI data were not available as there were not
enough patients for analysis. Multivariate Cox regression analysis
of all patients with age at diagnosis and sex as confounding
factors also showed that patients with
SLC20A1high had poor clinical outcomes [OS:
HR=2.20, 95% confidence interval (CI)=1.16–4.15, DSS: HR=2.72, 95%
confidence interval (CI)=1.29–5.73; DFI: HR=4.08, 95%
CI=1.52–10.98; and PFI: HR=2.33, 95% CI=1.34–4.06] (Table I). At tumor stage II, patients with
SLC20A1high showed poor clinical outcome (stage
II: HR=1.93, 95% CI=1.07–3.48), but DSS could not be evaluated at
stage I, III or IV. In terms of PFI, patients with
SLC20A1high at stage II, III and IV had poor
prognosis (stage II: HR=1.81, 95% CI=1.10–2.97; stage III and IV:
HR=10.10, 95% CI=1.42–71.68) (Table
I). These results also suggested that SLC20A1 was
involved in cancer progression at an early stage and high
expression of SLC20A1 was associated with poor prognosis in
PDAC.
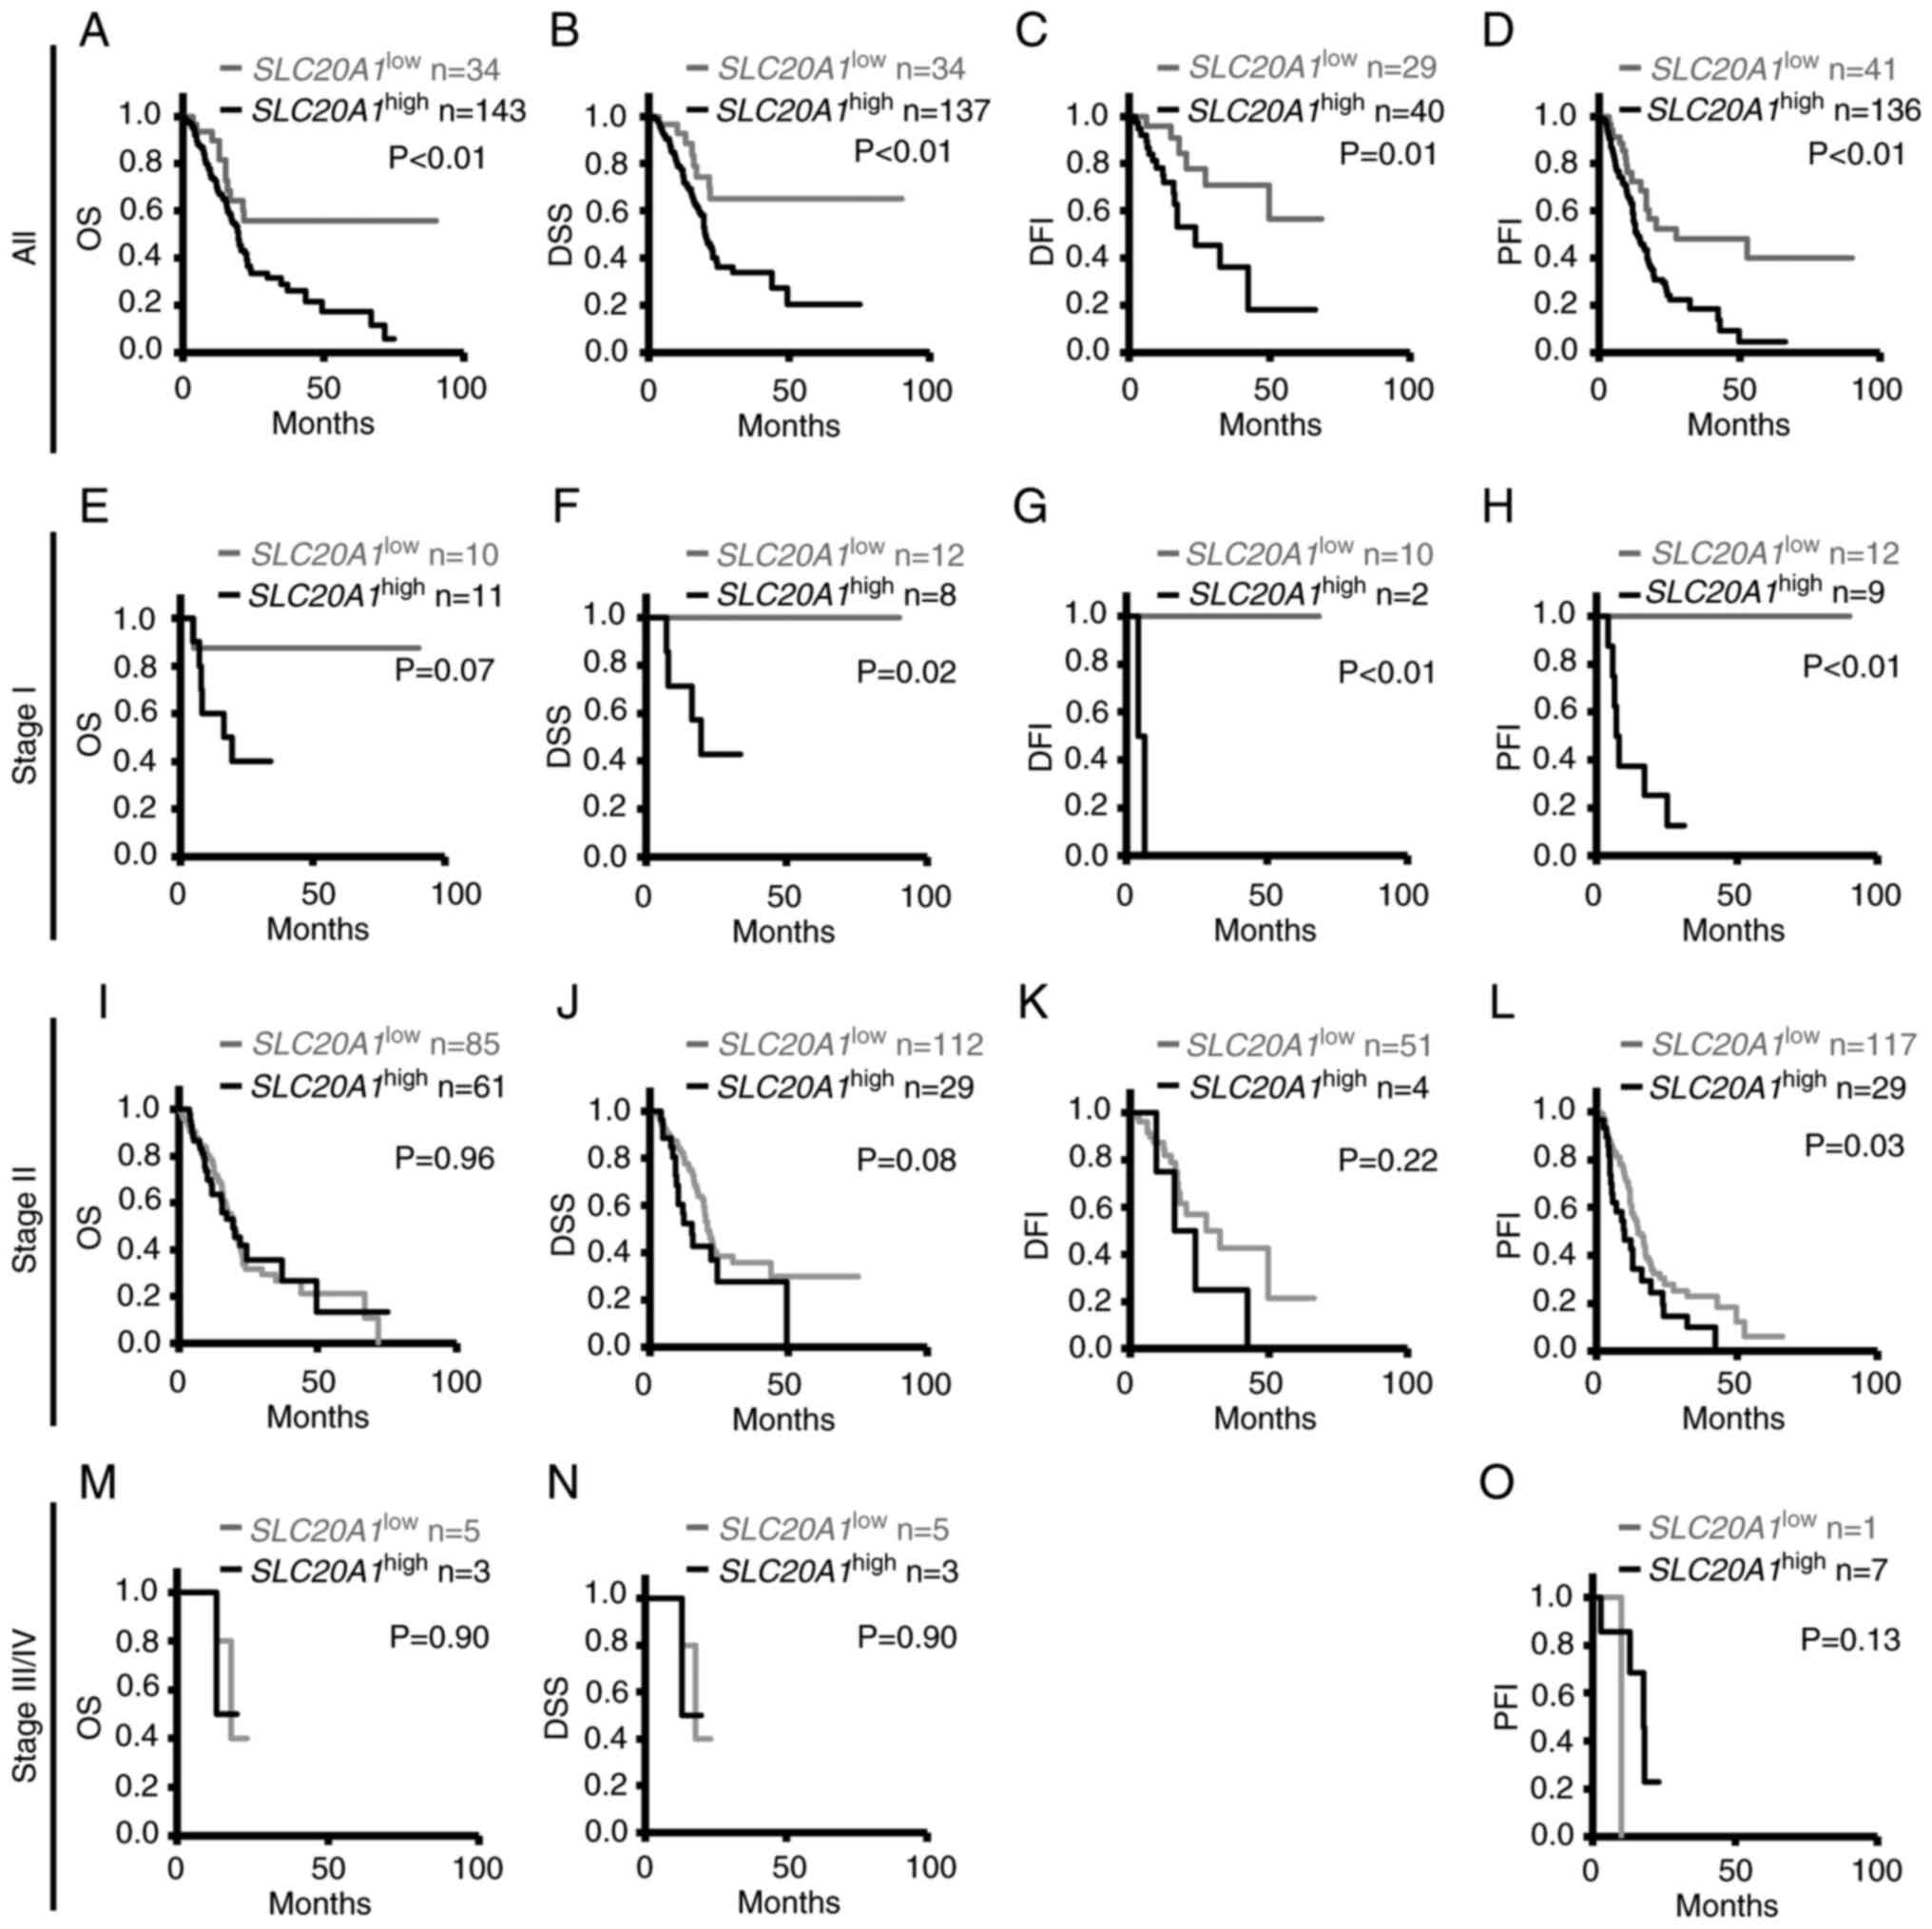 | Figure 2.Kaplan-Meier analyses of differences
in OS, DSS, DFI and PFI between SLC20A1high and
SLC20A1low groups of patients in pancreatic
cancer at tumor stages I, II and III/IV. The Cancer Genome Atlas
Pan-Cancer data were downloaded from cBioPortal. (A-D) All patients
with pancreatic cancer: (A) OS, (B) DSS, (C) DFI and (D) PFI. (E-H)
Patients at stage I: (E) OS, (F) DSS, (G) DFI and (H) PFI. (I-L)
Patients at stage II: (I) OS, (J) DSS, (K) DFI and (L) PFI. (M-O)
Patients at stage III/IV: (M) OS, (N) DSS and (O) PFI. DFI data
were not available as there were not enough patients for analysis.
(M and N) For DSS and OS analysis, the same patients were included
in the SLC20A1high and
SLC20A1low groups. P-values were calculated by
the Cochran-Mantel-Haenszel generalized log-rank test. OS, overall
survival; DSS, disease-specific survival; DFI, disease-free
interval; PFI, progression-free interval; SLC20A1, solute
carrier family 20 member 1; SLC20A1high, patients
with high expression of SLC20A1;
SLC20A1low, patients with low expression of
SLC20A1. |
 | Table I.Multivariate Cox regression analyses
of differences in OS, DSS, DFI and PFI between
SLC20A1high and SLC20A1low
groups of patients with pancreatic cancer at tumor stages I, II and
III/IV. |
Table I.
Multivariate Cox regression analyses
of differences in OS, DSS, DFI and PFI between
SLC20A1high and SLC20A1low
groups of patients with pancreatic cancer at tumor stages I, II and
III/IV.
| Survival
status | Hazard ratio | 95% confidence
interval | P-value |
|---|
| OS | 2.20 | 1.16–4.15 | 0.02 |
| DSS | 2.72 | 1.29–5.73 | <0.01 |
| DFI | 4.08 | 1.52–10.98 | <0.01 |
| PFI | 2.33 | 1.34–4.06 | <0.01 |
| Staging (OS) |
|
|
|
| Stage
I | 6.39 | 0.60–67.61 | 0.12 |
| Stage
II | 1.16 | 0.72–1.86 | 0.55 |
| Stage
III/IV |
| N.D. |
|
| Staging (DSS) |
|
|
|
| Stage
I |
| N.D. |
|
| Stage
II | 1.93 | 1.07–3.48 | 0.03 |
| Stage
III/IV |
| N.D. |
|
| Staging (DFI) |
|
|
|
| Stage
I |
| N.D. |
|
| Stage
II | 3.33 | 0.97–11.41 | 0.06 |
| Stage
III/IV |
| N.D. |
|
| Staging (PFI) |
|
|
|
| Stage
I |
| N.D. |
|
| Stage
II | 1.81 | 1.10–2.97 | 0.02 |
| Stage
III/IV | 10.10 | 1.42–71.68 | 0.02 |
SLC20A1 siRNA KD suppresses in vitro
tumorsphere formation and cell viability, and increases cell death
and caspase-3 activity
To investigate the roles of SLC20A1 in PDAC
cells, the present study next examined the effects of in
vitro loss of function via siRNA KD on tumor formation, cell
viability and cell death using two PDAC cell lines expressing
SLC20A1, namely PANC-1 and MIA-PaCa-2.
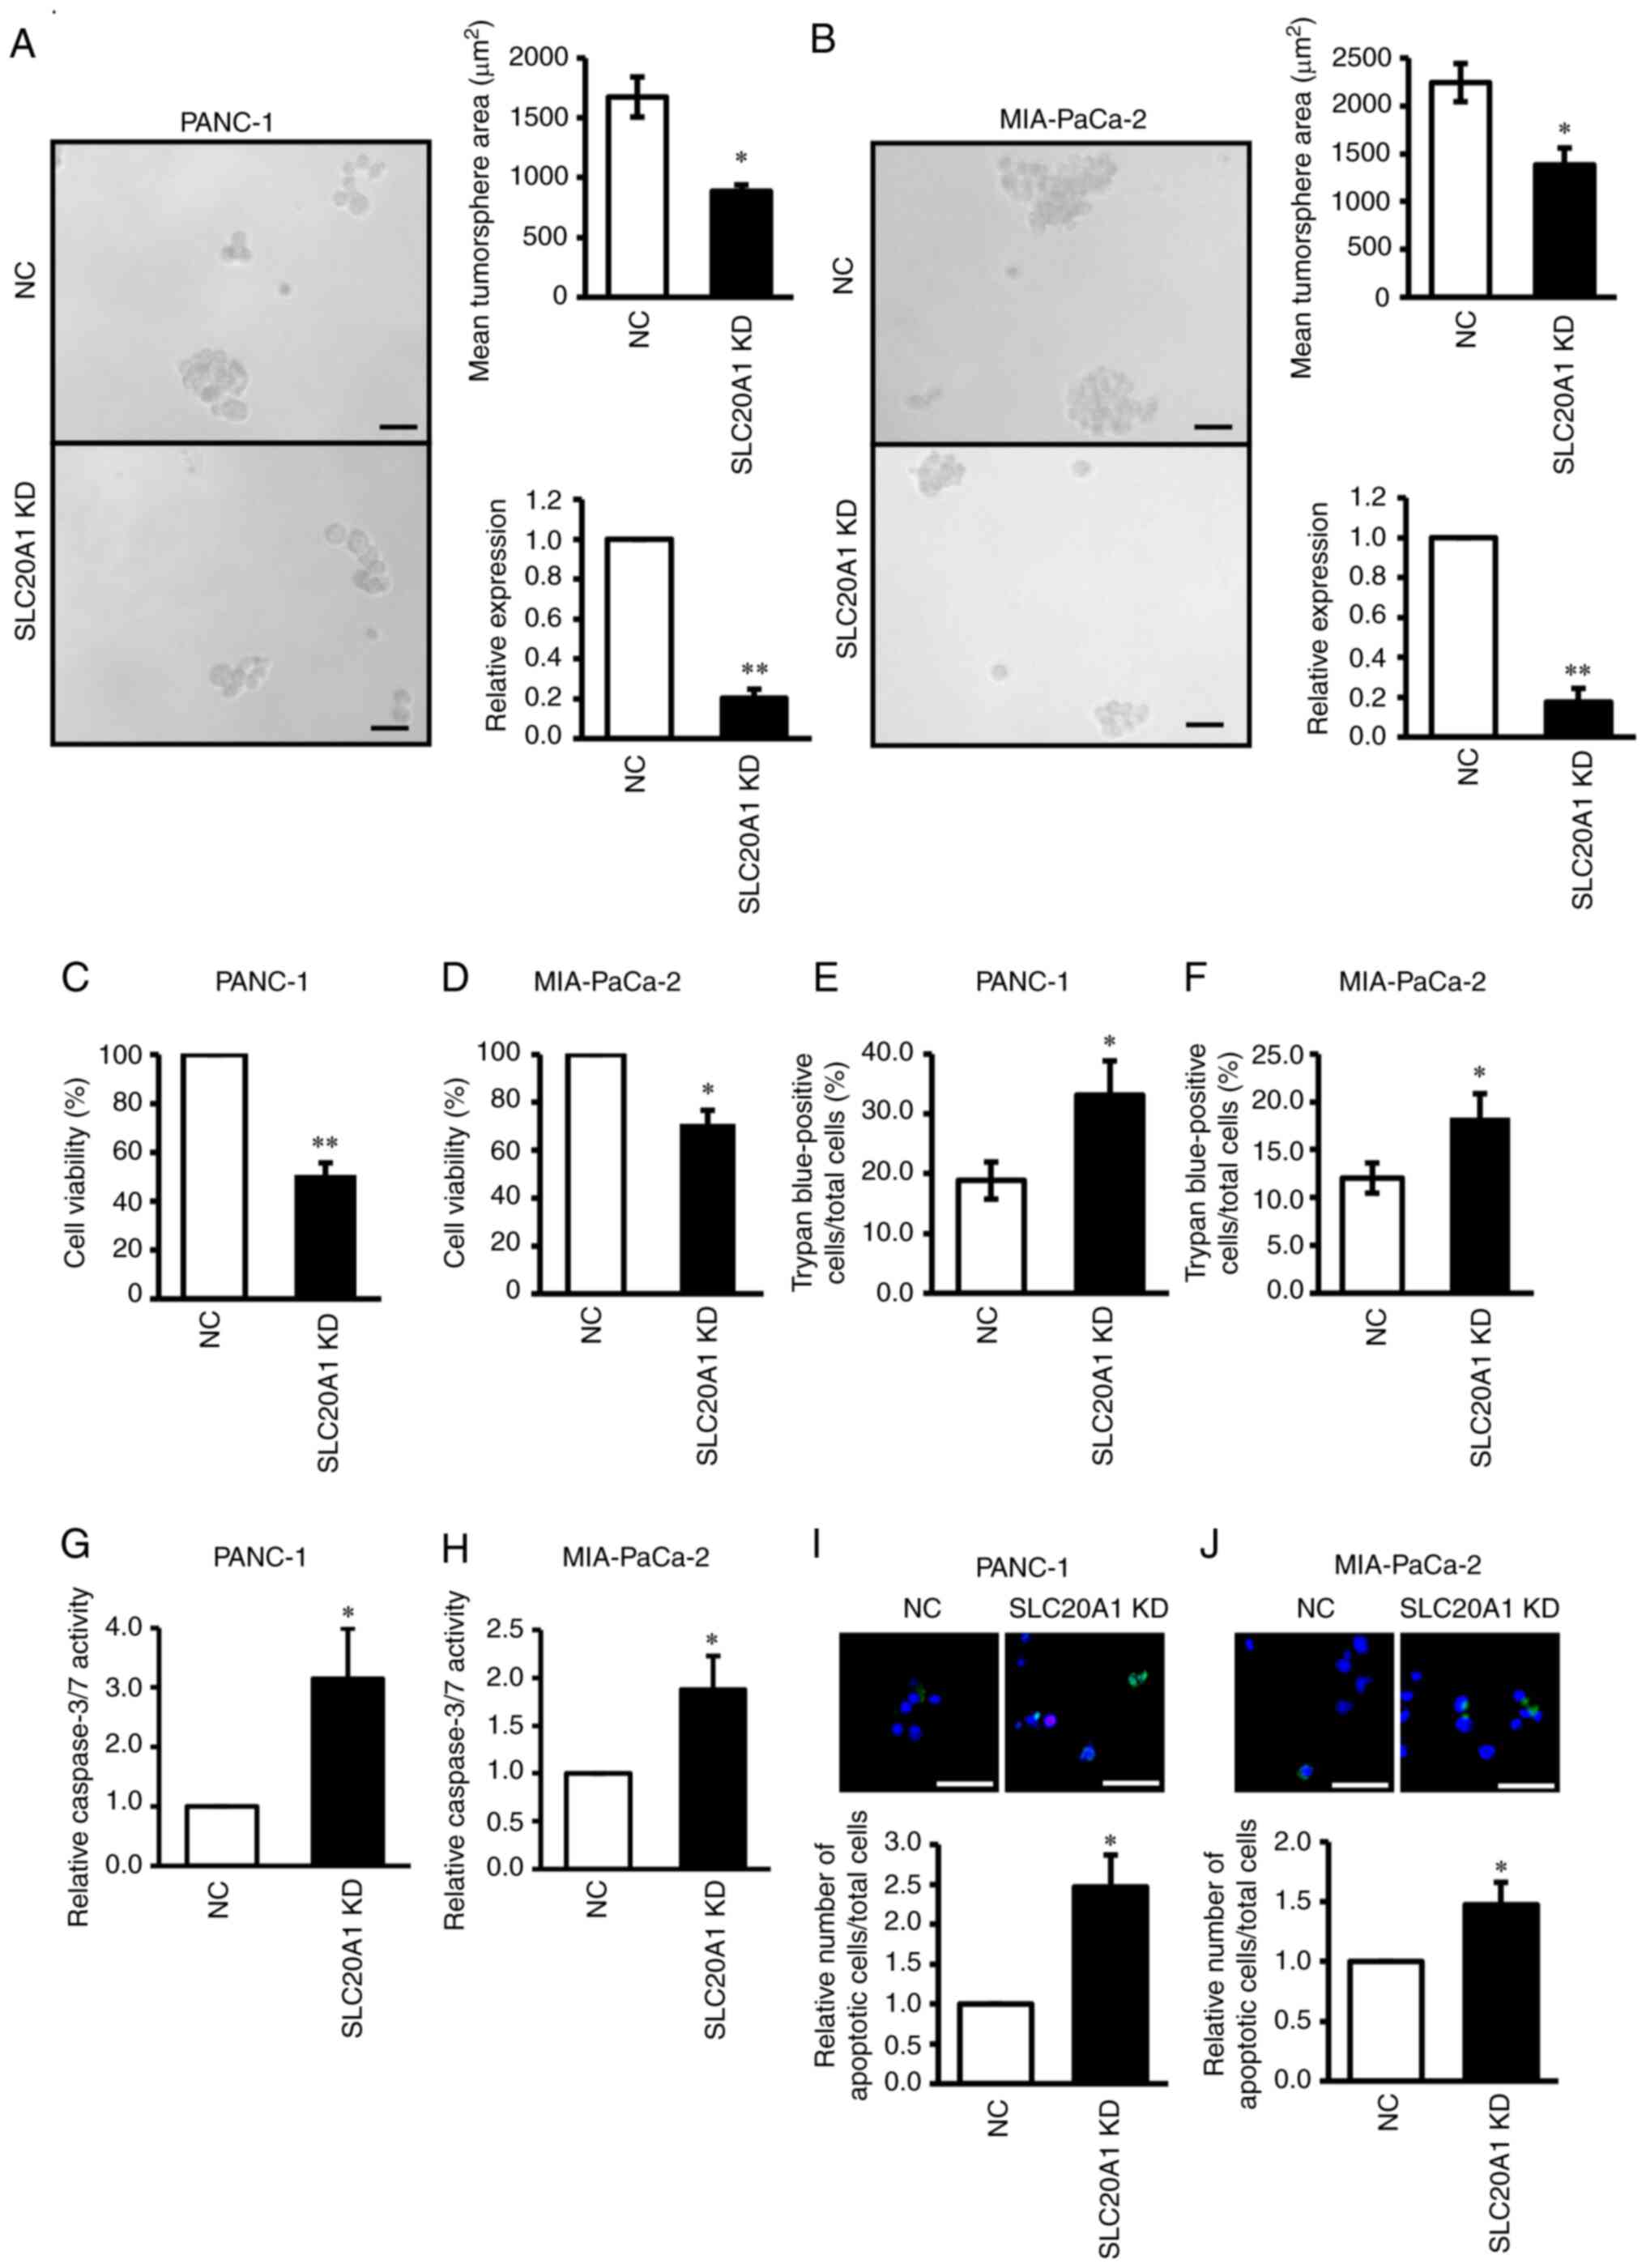
The results of the in vitro tumorsphere
formation assay revealed that SLC20A1 siRNA KD in PANC-1 and
MIA-PaCa-2 resulted in the suppression of tumorsphere formation in
comparison with NC siRNA KD cells (Fig.
3A and B). In addition, SLC20A1 siRNA KD suppressed the
viability of both PDAC cell lines (Fig.
3C and D).
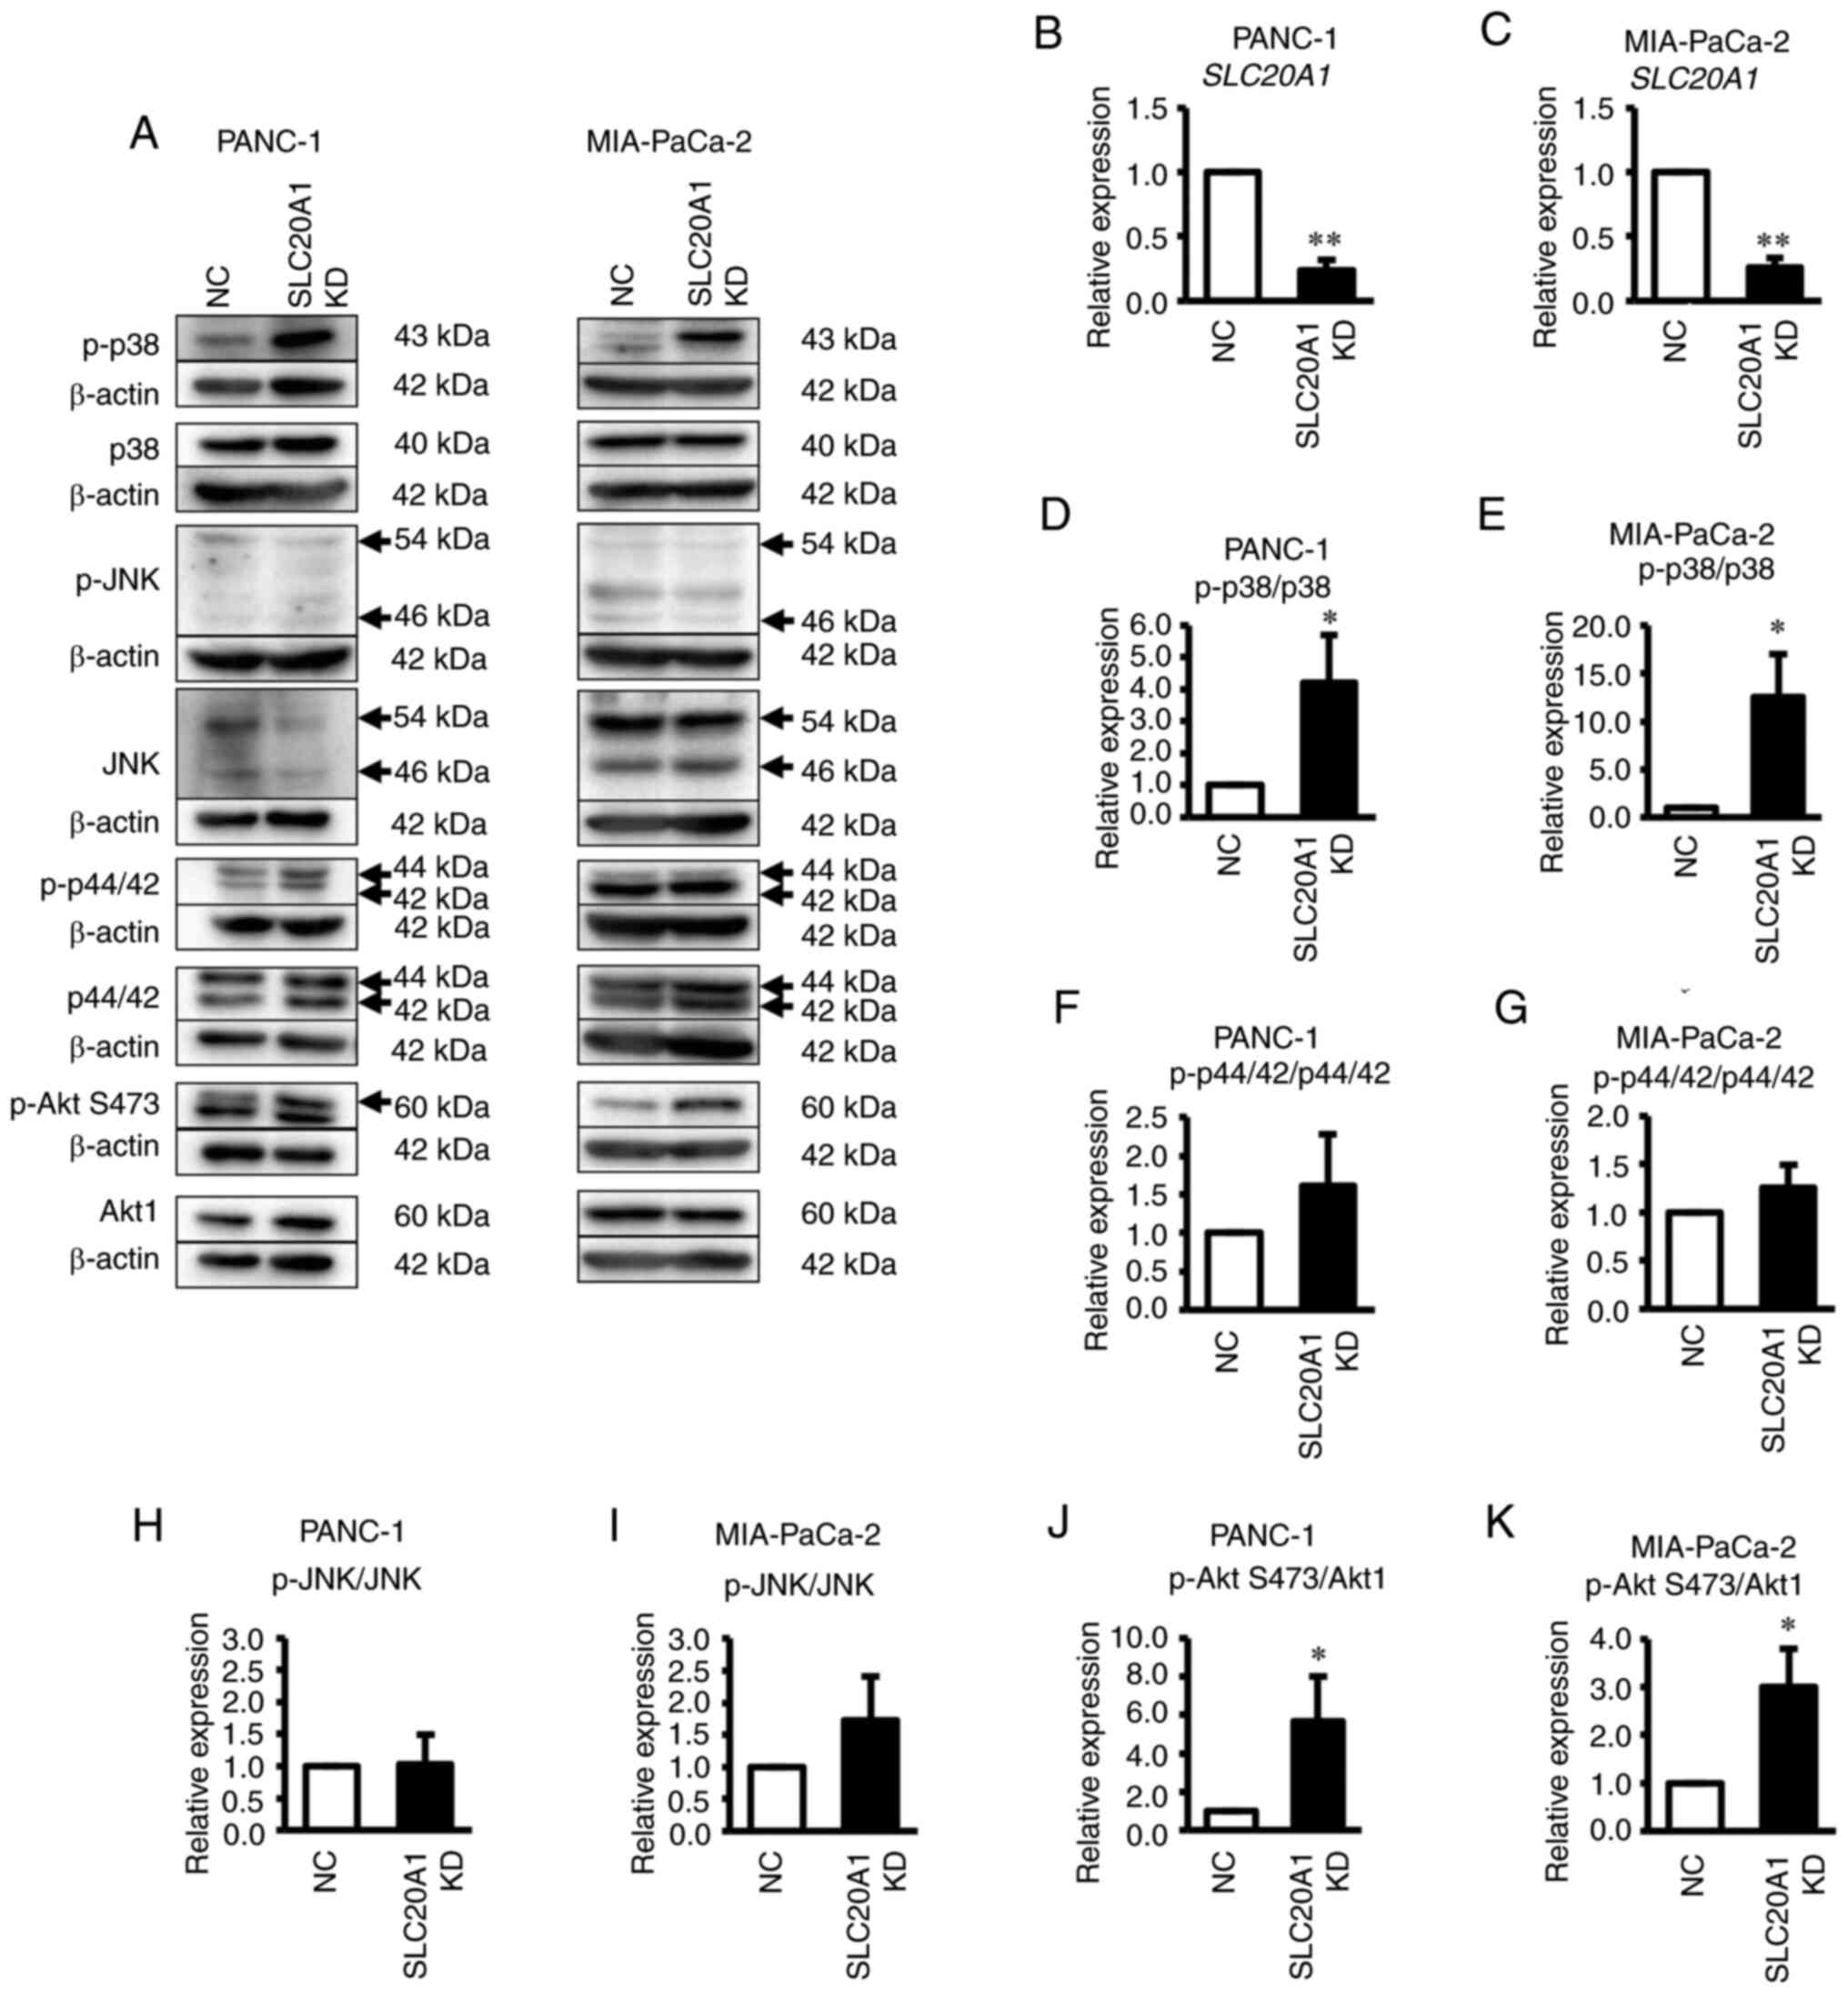
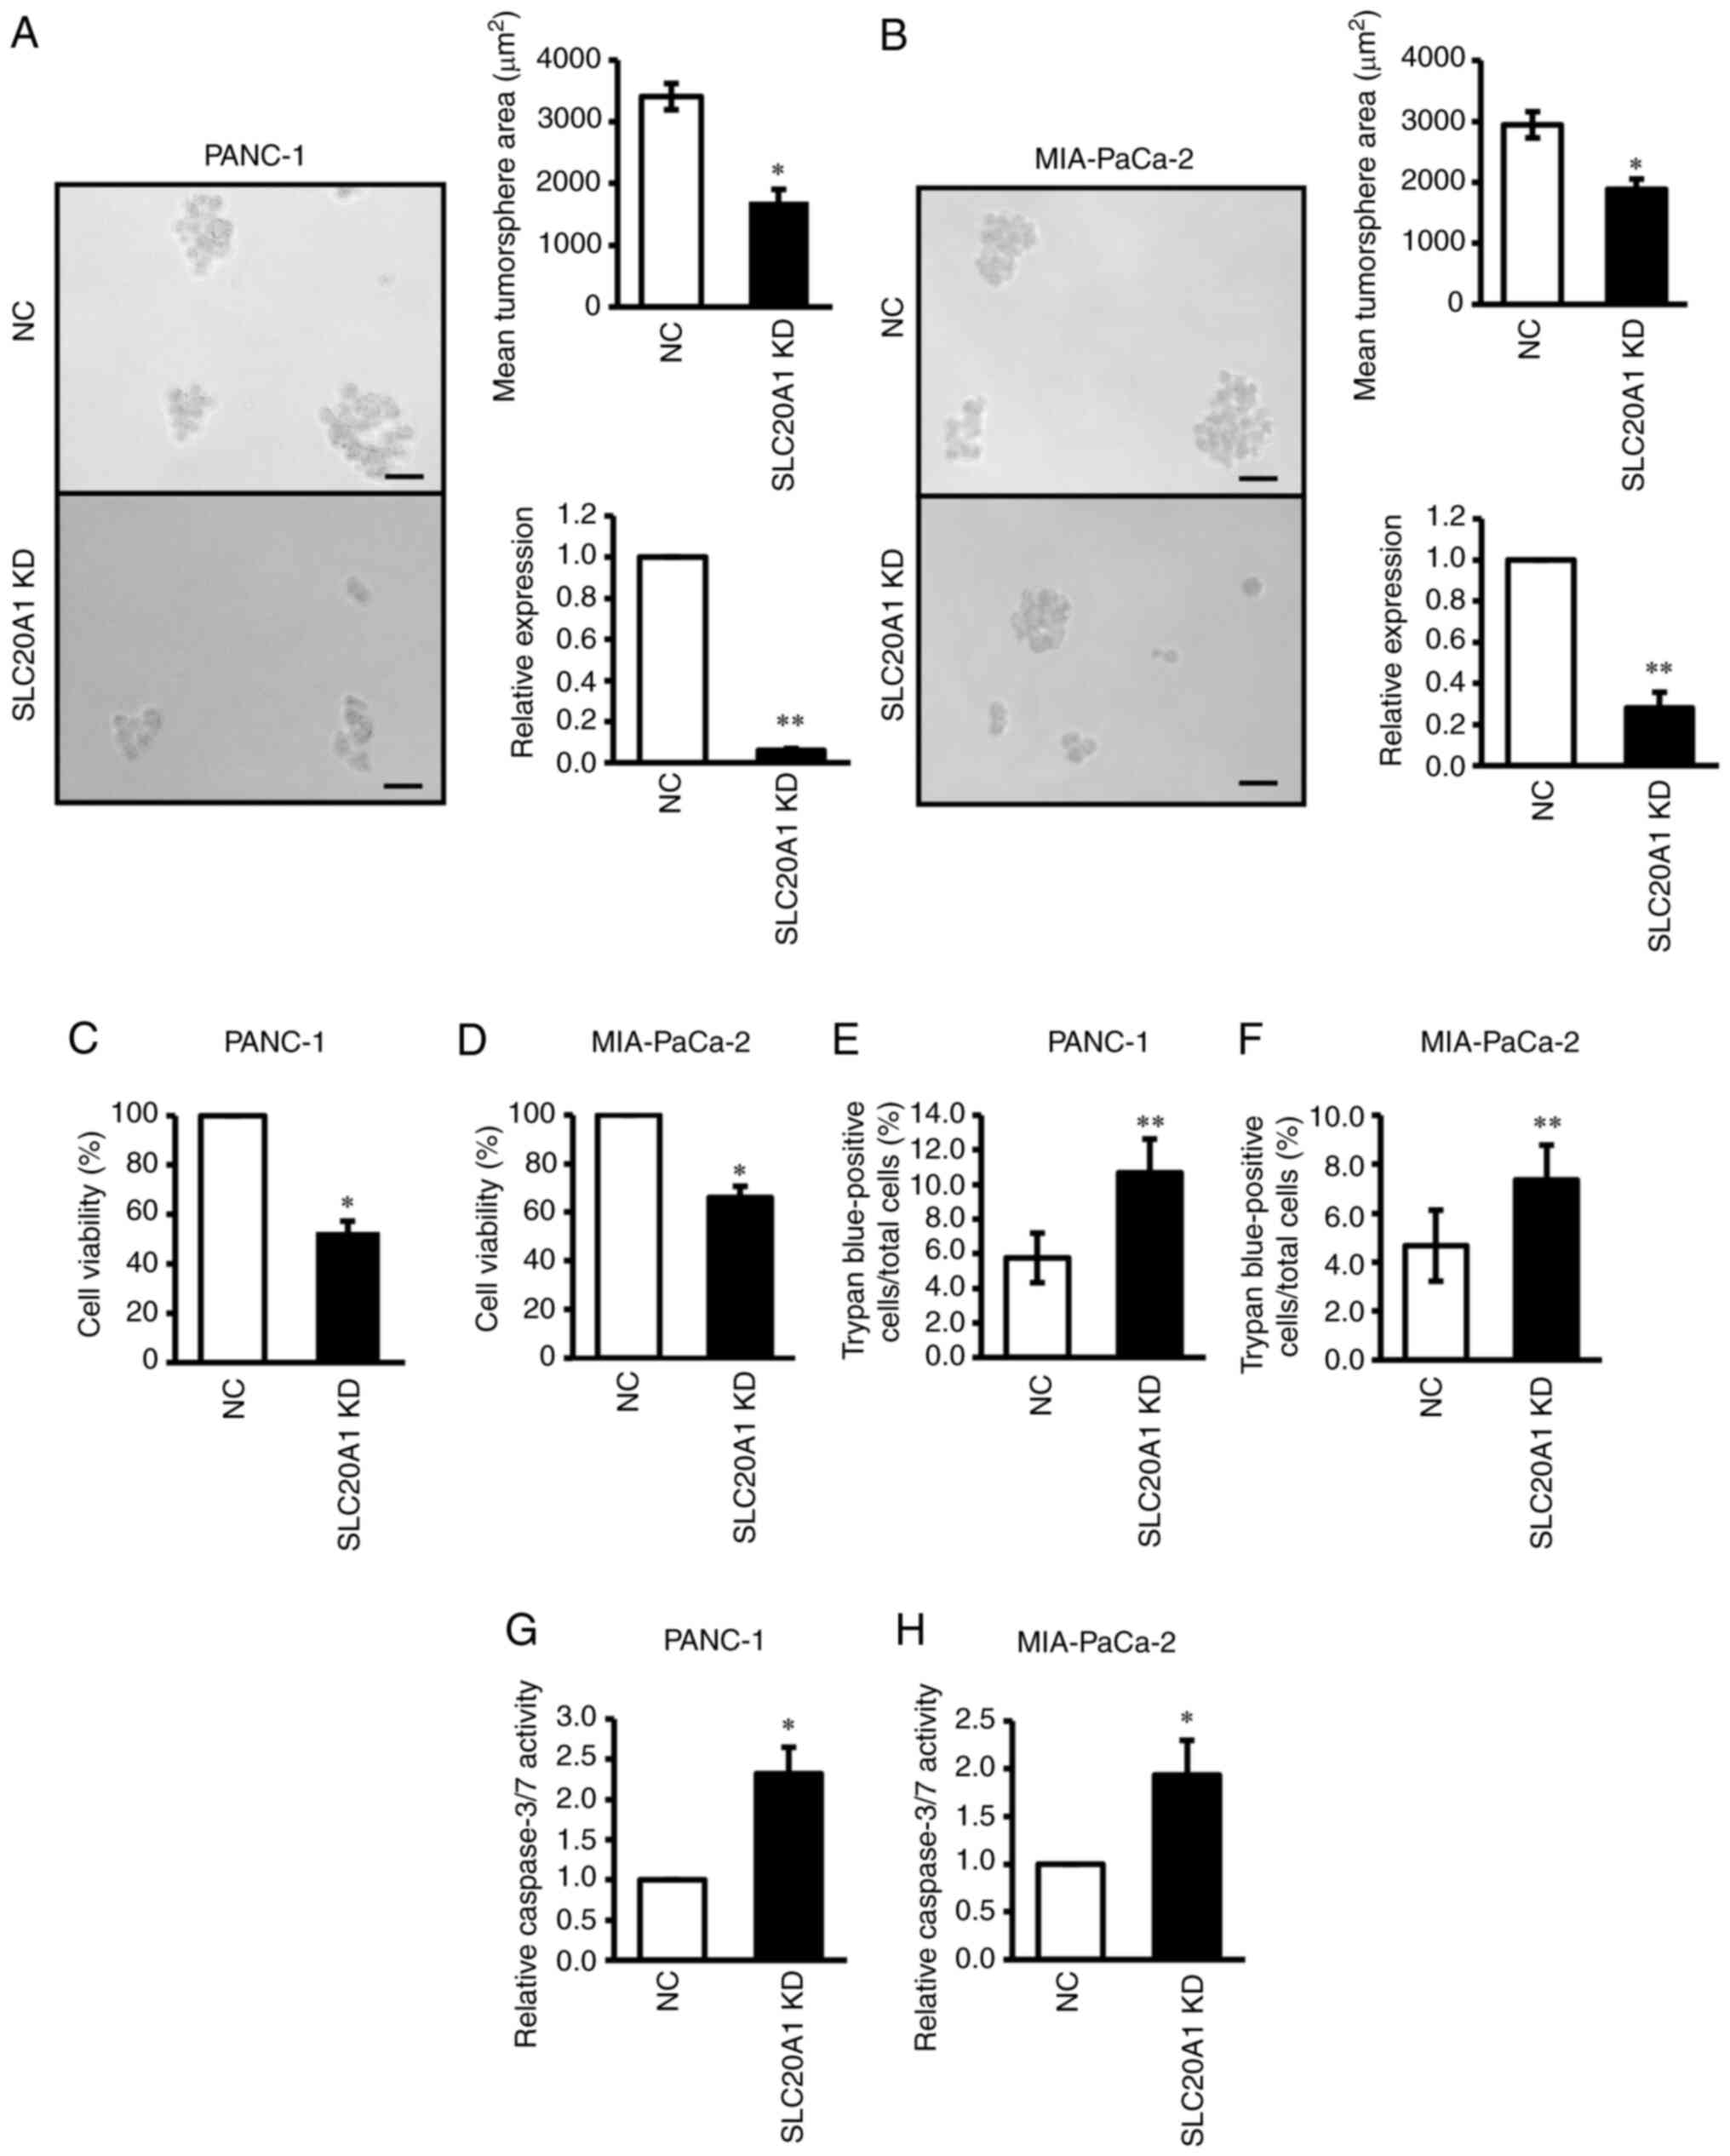 | Figure 3.Effects of SLC20A1 small
interfering RNA KD on the tumorsphere formation, viability, cell
death and apoptosis of pancreatic cancer cell lines. (A and B)
Representative images, mean tumorsphere area (µm) and relative
SLC20A1 mRNA expression following transfection with
SLC20A1 siRNA or NC siRNA in (A) PANC-1 and (B) MIA-PaCa-2
cells. Scale bar, 50 µm. Viability of (C) PANC-1 and (D) MIA-PaCa-2
cells was assessed using
5-{2,4-bis[(sodiooxy)sulfonyl]phenyl}-2-(2-methoxy-4-nitrophenyl)-3-(4-nitrophenyl)-3H-1,2λ5,3,4-tetrazol-2-ylium
assays. Trypan blue-positive (E) PANC-1 and (F) MIA-PaCa-2 cells.
The total cells and the stained cells were counted using a
hemocytometer and the percentage of the stained cells per total
cells was calculated. Relative caspase-3/7 activity of (G) PANC-1
and (H) MIA-PaCa-2 cells, as assessed by a caspase-3/7 fluorometric
assay. *P<0.05, **P<0.01 vs. NC; unpaired Student's t-test.
SLC20A1, solute carrier family 20 member 1; NC, negative
control; KD, knockdown; siRNA, small interfering RNA. |
A previous study has shown that SLC20A1
deficiency causes the promotion of caspase-3-dependent apoptosis in
HeLa cells stimulated with TNFα (32). Therefore, the current study next
examined apoptosis in these PDAC cell lines via trypan blue dye
exclusion assay and caspase-3/7 activity analysis. As shown in
Fig. 3E-H, SLC20A1 siRNA KD
induced an increase in the number of trypan blue-positive cells
(Fig. 3E and F) and enhanced
caspase-3/7 activity (Fig. 3G and
H). When the activity of the MAPK family and its downstream Akt
protein was examined, SLC20A1 deficiency was found to result
in the enhancement of the phosphorylation levels of p38 kinase and
Akt, but not ERK and JNK (Fig.
4A-S). Thus, SLC20A1 may suppress p38 stress
kinase-dependent cell death. Moreover, these results suggested that
SLC20A1 was required for cell survival and tumorsphere
formation via suppressing caspase-3-dependent apoptosis in PDAC
cells.
Patients with PDAC
SLC20A1high ALDH1A3high have a poor
prognosis
SLC20A1 is known to be involved in cell
viability and in vitro tumorsphere formation of
ALDH1-positive breast CSCs (23);
however, the roles of SLC20A1 in PDAC CSCs remain unclear.
Therefore, the association between SLC20A1 gene expression
and various stem cell markers, including ALDH1A1 and
ALDH1A3, was examined. As shown in Fig. S2, SLC20A1 gene expression
was positively correlated with stem cell markers, such as KLF4,
MET, NOTCH3, HIF1A and CD44, and tended to positively
correlate with ALDH1A3, whereas SLC20A1 gene
expression was negatively correlated with ALDH1A1.
Next, the association of SLC20A1 and stem
cell markers with clinical outcomes was examined by Kaplan-Meier
and multivariate Cox regression analyses. It is known that ALDH1A1,
ALDH1A3, CD44 and CD133 are pancreatic CSC markers due to their
properties of high tumorigenesis and therapy resistance (11–13,47–49).
Therefore, the present study next examined the association between
SLC20A1 and CSC markers, including the four aforementioned
genes. First, patients were divided into four groups according to
their expression levels of SLC20A1 and CSC markers:
SLC20A1highCSC markerhigh,
SLC20A1highCSC markerlow,
SLC20A1lowCSC markerhigh and
SLC20A1lowCSC markerlow. The prognosis
in each group was then compared regarding OS and DSS (Kaplan-Meier
analyses: Figs. 5A-D, S3A-H and S4A-K; Cox regression analyses: Tables II and III). In Kaplan-Meier curves, patients
with SLC20A1highALDH1A3high
(red line) exhibited a significantly poor clinical outcome compared
with the other three patient groups,
SLC20A1highALDH1A3low,
SLC20A1lowALDH1A3high and
SLC20A1lowALDH1A3low (Figs. 5B and S3F). On the other hand, patients with
SLC20A1highALDH1A1high
(Figs. 5A and S3E),
SLC20A1highCD44high (Figs. 5C and S3G) and
SLC20A1highCD133high (Figs. 5D and S3H) did not show a poorer outcome than
others. As determined by Cox regression analyses, some CSC markers,
such as ALDH1A3, CD44, HIF1A, KLF4, MET, MYC, STAT3 and
NOTCH3, were associated with a significantly worse prognosis
in the SLC20A1highCSC markerhigh group
compared with the SLC20A1lowCSC
markerlow group (Table
II). Thus, the current study subsequently focused on
ALDH1A3 as the CSC marker that may contribute with
SLC20A1 to results in a poorer prognosis in PDAC.
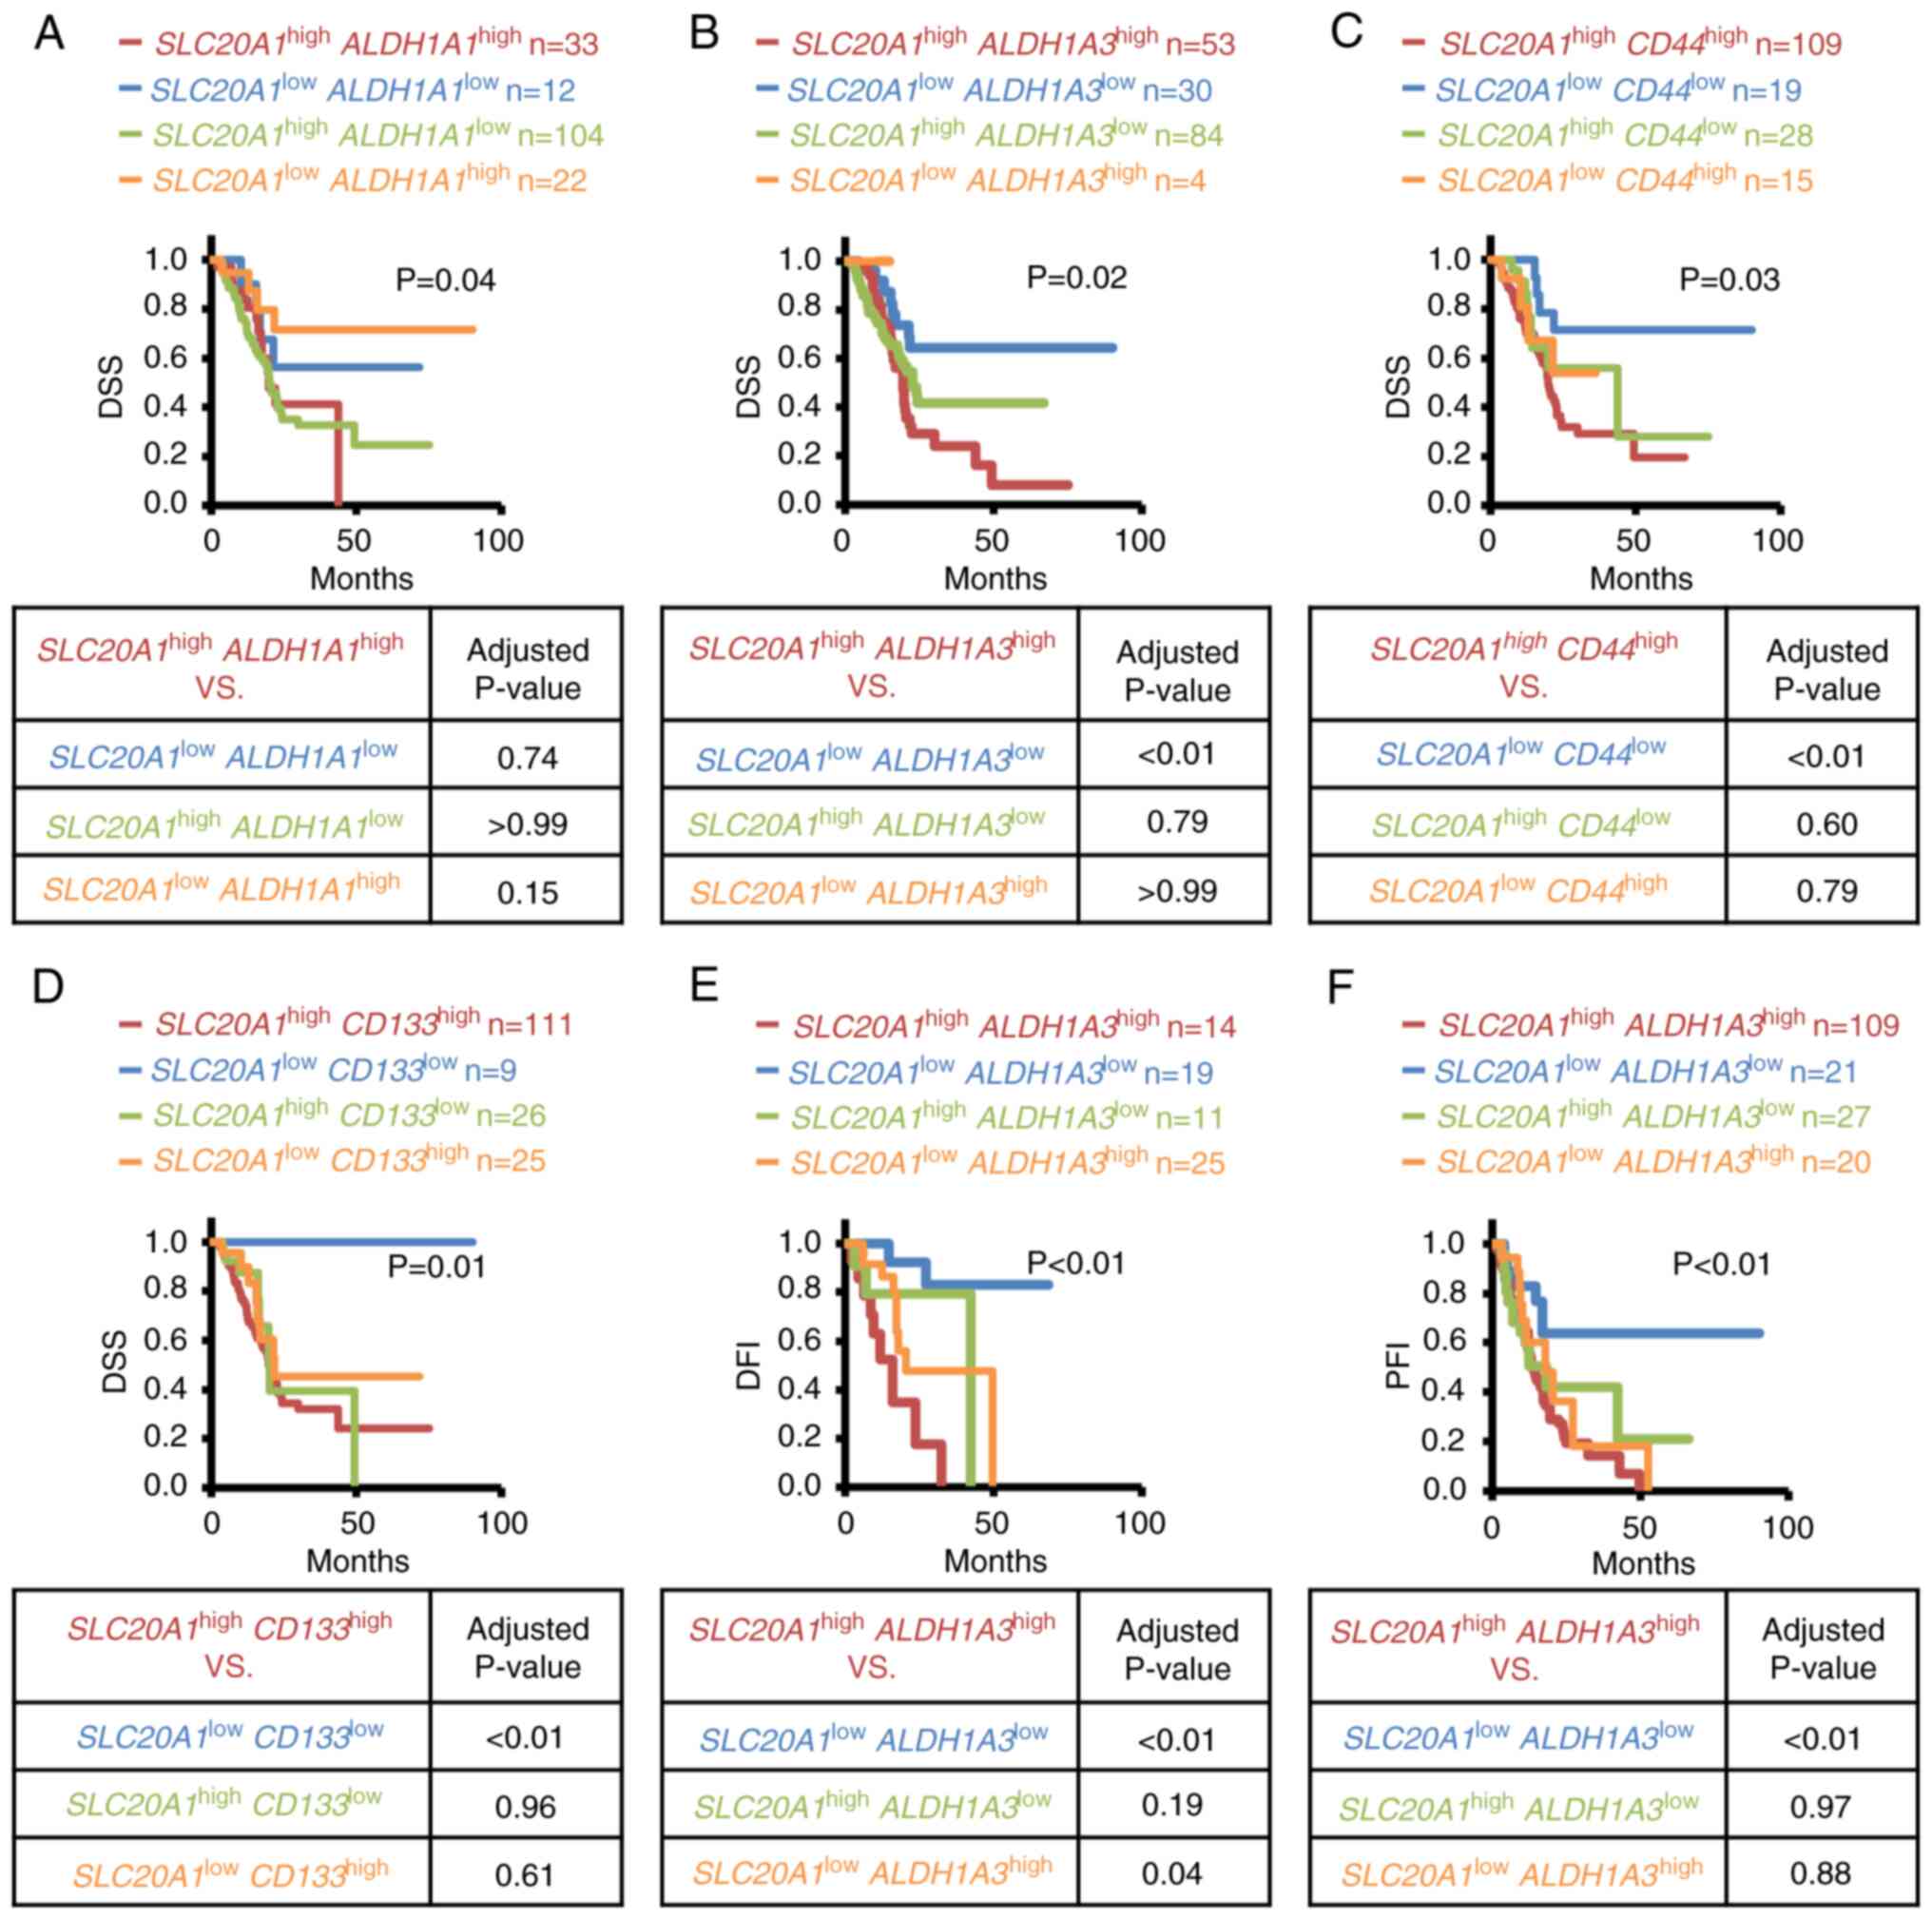 | Figure 5.Kaplan-Meier analyses of the
SLC20A1highCSC markerhigh,
SLC20A1lowCSC markerlow,
SLC20A1highCSC markerlow and
SLC20A1lowCSC markerhigh groups of
patients with pancreatic cancer. The Cancer Genome Atlas Pan-Cancer
data were downloaded from cBioPortal. (A-D) Comparison of DSS.
Adjusted P-values were determined for
SLC20A1highCSC markerhigh vs.
SLC20A1lowCSC markerlow,
SLC20A1highCSC markerlow or
SLC20A1lowCSC markerhigh groups using
the Bonferroni method. (A) ALDH1A1, (B) ALDH1A3, (C)
CD44 and (D) CD133. (E and F) Kaplan-Meier analyses
of (E) DFI and (F) PFI among
SLC20A1highALDH1A3high,
SLC20A1lowALDH1A3low,
SLC20A1highALDH1A3low and
SLC20A1lowALDH1A3high groups of
patients. Adjusted P-values were determined for
SLC20A1highALDH1A3high vs.
SLC20A1lowALDH1A3low,
SLC20A1highALDH1A3low or
SLC20A1lowALDH1A3high groups
using the Bonferroni method. (E) DFI and (F) PFI.
SLC20A1highCSC markerhigh, patients with high
expression of SLC20A1 and CSC marker;
SLC20A1lowCSC markerlow, patients with low
expression of SLC20A1 and CSC marker;
SLC20A1highCSC markerlow, patients with high
expression of SLC20A1 and low expression of CSC marker;
SLC20A1lowCSC markerhigh, patients with low
expression of SLC20A1 and high expression of CSC marker;
DSS, disease-specific survival; DFI, disease-free interval; PFI,
progression-free interval; SLC20A1, solute carrier family 20
member 1; CSC, cancer stem cell; ALDH1A1, aldehyde
dehydrogenase 1 family member A1; ALDH1A3, aldehyde
dehydrogenase 1 family member A3; CD44, CD44 molecule;
CD133, prominin 1. |
| Table II.Multivariate Cox regression analyses
of differences in DSS, DFI and PFI between groups based on
SLC20A1 and CSC marker expression. |
Table II.
Multivariate Cox regression analyses
of differences in DSS, DFI and PFI between groups based on
SLC20A1 and CSC marker expression.
| Survival
status | Hazard ratio | 95% confidence
interval | P-value |
|---|
| DSS:
SLC20A1highALDH1A1high vs. |
|
|
|
|
SLC20A1highALDH1A1low | 0.90 | 0.49–1.63 | 0.72 |
|
SLC20A1lowALDH1A1high | 3.00 | 0.96–9.41 | 0.06 |
|
SLC20A1lowALDH1A1low | 1.66 | 0.53–5.24 | 0.39 |
| DSS:
SLC20A1highALDH1A3high vs. |
|
|
|
|
SLC20A1highALDH1A3low | 1.47 | 0.88–2.44 | 0.14 |
|
SLC20A1lowALDH1A3high |
| N.D. |
|
|
SLC20A1lowALDH1A3low | 3.65 | 1.63–8.20 | <0.01 |
| DSS:
SLC20A1highCD44high vs. |
|
|
|
|
SLC20A1highCD44low | 1.62 | 0.80–3.28 | 0.18 |
|
SLC20A1lowCD44high | 1.82 | 0.66–5.04 | 0.25 |
|
SLC20A1lowCD44low | 4.11 | 1.46–11.59 | <0.01 |
| DSS:
SLC20A1highCD133high vs. |
|
|
|
|
SLC20A1highCD133low | 1.48 | 0.70–3.12 | 0.30 |
|
SLC20A1lowCD133high | 1.56 | 0.74–3.32 | 0.25 |
|
SLC20A1lowCD133low |
| N.D. |
|
| DSS:
SLC20A1highBMI1high vs. |
|
|
|
|
SLC20A1highBMI1low | 0.70 | 0.40–1.22 | 0.21 |
|
SLC20A1lowBMI1high | 3.46 | 1.23–9.70 | 0.02 |
|
SLC20A1lowBMI1low | 1.78 | 0.61–5.17 | 0.29 |
| DSS:
SLC20A1highHIF1Ahigh vs. |
|
|
|
|
SLC20A1highHIF1Alow | 1.52 | 0.91–2.54 | 0.11 |
|
SLC20A1lowHIF1Ahigh |
| N.D. |
|
|
SLC20A1lowHIF1Alow | 3.47 | 1.49–8.10 | <0.01 |
| DSS:
SLC20A1high KLF4high vs. |
|
|
|
|
SLC20A1highKLF4low | 1.87 | 0.75–4.69 | 0.18 |
|
SLC20A1lowKLF4high | 1.71 | 0.73–3.99 | 0.21 |
|
SLC20A1lowKLF4low | 5.04 | 1.91–13.30 | <0.01 |
| DSS:
SLC20A1highMEThigh vs. |
|
|
|
|
SLC20A1highMETlow | 2.55 | 1.46–4.44 | <0.01 |
|
SLC20A1lowMEThigh | 1.70 | 0.71–4.06 | 0.23 |
|
SLC20A1lowMETlow | 10.51 | 2.49–44.31 | <0.01 |
| DSS:
SLC20A1highMYChigh vs. |
|
|
|
|
SLC20A1highMYClow | 1.73 | 0.95–3.12 | 0.07 |
|
SLC20A1lowMYChigh | 1.65 | 0.69–3.94 | 0.26 |
|
SLC20A1lowMYClow | 7.86 | 1.87–32.95 | <0.01 |
| DSS:
SLC20A1highNANOGhigh vs. |
|
|
|
|
SLC20A1highNANOGlow | 0.90 | 0.44–1.83 | 0.77 |
|
SLC20A1lowNANOGhigh | 0.17 | 0.25–0.21 | 0.18 |
|
SLC20A1lowNANOGlow | 1.90 | 0.65–5.55 | 0.24 |
| DSS:
SLC20A1highNOTCH1high vs. |
|
|
|
|
SLC20A1highNOTCH1low | 0.60 | 0.35–1.04 | 0.07 |
|
SLC20A1lowNOTCH1high | 2.54 | 0.33–19.74 | 0.37 |
|
SLC20A1lowNOTCH1low | 1.74 | 0.71–4.27 | 0.22 |
| DSS:
SLC20A1highNOTCH3high vs. |
|
|
|
|
SLC20A1highNOTCH3low | 1.39 | 0.66–2.93 | 0.39 |
|
SLC20A1lowNOTCH3high | 1.89 | 0.75–4.80 | 0.18 |
|
SLC20A1lowNOTCH3low | 4.93 | 1.52–15.94 | <0.01 |
| DSS:
SLC20A1highPOU5F1high vs. |
|
|
|
|
SLC20A1highPOU5F1low | 0.70 | 0.41–1.21 | 0.20 |
|
SLC20A1lowPOU5F1high | 1.91 | 0.44–8.23 | 0.39 |
|
SLC20A1lowPOU5F1low | 2.07 | 0.82–5.22 | 0.12 |
| DSS:
SLC20A1highSOX2high vs. |
|
|
|
|
SLC20A1high
SOX2low | 0.63 | 0.33–1.18 | 0.15 |
|
SLC20A1low
SOX2high | 1.27 | 0.36–4.56 | 0.71 |
|
SLC20A1low
SOX2low | 1.85 | 0.63–5.46 | 0.26 |
| DSS:
SLC20A1highSTAT3high vs. |
|
|
|
|
SLC20A1highSTAT3low | 1.61 | 0.95–2.73 | 0.08 |
|
SLC20A1lowSTAT3high | 3.89 | 0.82–18.40 | 0.09 |
|
SLC20A1lowSTAT3low | 5.04 | 1.91–13.30 | <0.01 |
| DFI:
SLC20A1highALDH1A3high vs. |
|
|
|
|
SLC20A1highALDH1A3low | 3.18 | 0.67–15.07 | 0.15 |
|
SLC20A1lowALDH1A3high | 5.66 | 1.75–18.28 | <0.01 |
|
SLC20A1lowALDH1A3low | 54.54 | 5.66–525.68 | <0.01 |
| PFI:
SLC20A1highALDH1A3high vs. |
|
|
|
|
SLC20A1highALDH1A3low | 1.43 | 0.79–2.58 | 0.23 |
|
SLC20A1lowALDH1A3high | 1.42 | 0.69–2.89 | 0.34 |
|
SLC20A1lowALDH1A3low | 4.37 | 1.82–10.51 | <0.01 |
| Table III.Cox regression analyses of OS in CSC
markerhigh vs. CSC markerlow patients and
multivariate Cox regression analyses of differences in OS between
groups based on SLC20A1 and CSC marker expression. |
Table III.
Cox regression analyses of OS in CSC
markerhigh vs. CSC markerlow patients and
multivariate Cox regression analyses of differences in OS between
groups based on SLC20A1 and CSC marker expression.
| OS | Hazard ratio | 95% confidence
interval | P-value |
|---|
|
ALDH1A1high vs.
ALDH1A1low | 0.72 | 0.45–1.16 | 0.18 |
|
ALDH1A3high vs.
ALDH1A3low | 2.75 | 1.26–6.03 | 0.01 |
|
CD44high vs.
CD44low | 2.05 | 1.35–3.13 | <0.01 |
|
CD133high vs.
CD133low | 3.09 | 1.42–6.75 | <0.01 |
|
SLC20A1highALDH1A1high
vs. |
|
|
|
|
SLC20A1highALDH1A1low | 0.90 | 0.52–1.56 | 0.71 |
|
SLC20A1lowALDH1A1high | 1.83 | 0.74–4.45 | 0.19 |
|
SLC20A1lowALDH1A1low | 1.77 | 0.58–5.45 | 0.32 |
|
SLC20A1highALDH1A3high
vs. |
|
|
|
|
SLC20A1highALDH1A3low | 1.48 | 0.46–4.72 | 0.51 |
|
SLC20A1lowALDH1A3high | 1.32 | 0.61–2.88 | 0.48 |
|
SLC20A1lowALDH1A3low | 4.19 | 1.51–11.64 | <0.01 |
|
SLC20A1highCD44high
vs. |
|
|
|
|
SLC20A1highCD44low | 2.00 | 1.27–3.13 | <0.01 |
|
SLC20A1lowCD44high | 2.00 | 0.79–5.04 | 0.14 |
|
SLC20A1lowCD44low | 3.56 | 1.51–8.42 | <0.01 |
|
SLC20A1high
CD133high vs. |
|
|
|
|
SLC20A1highCD133low | 1.55 | 0.71–3.38 | 0.27 |
|
SLC20A1lowCD133high | 1.23 | 0.65–2.33 | 0.52 |
|
SLC20A1lowCD133low |
| N.D. |
|
In addition to OS and DSS-associated prognosis, the
DFI and PFI of the aforementioned four groups divided according to
SLC20A1 and ALDH1A3 were compared. Patients with
SLC20A1highALDH1A3high showed a
poorer clinical outcome than the other groups in terms of DFI
(Fig. 5E) and PFI (Fig. 5F). Next, multivariate Cox regression
analysis was conducted with confounding factors such as age at
diagnosis and sex, and the adjusted HR value was assessed. In
agreement with the results of the Kaplan-Meier analysis, patients
with SLC20A1highALDH1A3high had
the worst prognosis (Table II).
Furthermore, we next examined whether driver genes mutations were
associated with ALDH1 genes expression in PDAC. As shown in
Fig. S5, PDAC with TP53
truncating mutations showed high ALDH1A3 expression. By
contrast, PDAC with TP53 missense and truncating mutations
showed low ALDH1A1 expression.
These results suggested that SLC20A1 was
involved in cancer progression and contributed to poor clinical
outcome in ALDH1A3-positive PDAC.
SLC20A1 siRNA KD in
ALDH1high PDAC cells suppresses tumorsphere formation
and cell viability, and increases cell death and caspase-3
activity
Based on the poor prognosis of patients with
SLC20A1highALDH1A3high, the
current study next examined the roles of SLC20A1 in
ALDH1-positive pancreatic CSCs. As shown in Fig. S6A, both PANC-1 and MIA-PaCa-2 cell
lines expressed the ALDH1A3 protein; however, ALDH1A1 protein
expression was lower in PANC-1 cells. ALDH1high cells
derived from both PDAC cell lines exhibited CSC properties, such as
self-renewal, differentiation and tumorigenesis in serial passages
(PANC-1: Fig. S6B and C;
MIA-PaCa-2: Fig. S6G and H),
similar to our previous study on breast cancer (10). Notably, SLC20A1 mRNA
expression was enriched in ALDH1low PDAC cells compared
with in ALDH1high PDAC cells (PANC-1: Fig. S6D; MIA-PaCa-2: Fig. S6I). Next, in vitro
tumorsphere formation and WST-8 assays were performed.
SLC20A1 siRNA KD in ALDH1high cells suppressed
the tumorsphere formation and viability of both PDAC cell lines
(Fig. 6A-D). These results
suggested that SLC20A1 may be required for the tumor
formation and cell viability of ALDH1-positive PDAC CSCs.
 | Figure 6.Effects of SLC20A1 small
interfering RNA KD on the tumorsphere formation, viability, cell
death and apoptosis of ALDH1high pancreatic cancer
cells. Representative images, mean tumorsphere area and relative
SLC20A1 mRNA expression following transfection with
SLC20A1 siRNA or NC siRNA in (A) PANC-1 and (B) MIA-PaCa-2
ALDH1high cells. Scale bar, 50 µm. Viability of (C)
PANC-1 and (D) MIA-PaCa-2 ALDH1high cells was assessed
using
5-{2,4-bis[(sodiooxy)sulfonyl]phenyl}-2-(2-methoxy-4-nitrophenyl)-3-(4-nitrophenyl)-3H-1,2λ5,3,4-tetrazol-2-ylium
assays. Trypan blue-positive (E) PANC-1 and (F) MIA-PaCa-2
ALDH1high cells. The total cells and the stained cells
were counted using a hematocytometer and the percentage of the
stained cells per total cells was calculated. Relative caspase-3/7
activity of (G) PANC-1 and (H) MIA-PaCa-2 ALDH1high
cells, as assessed by a caspase-3/7 fluorometric assay. Apoptotic
cell staining and relative apoptosis of (I) PANC-1 and (J)
MIA-PaCa-2 ALDH1high cells. Representative
immunofluorescence staining of Apopxin™ Green (green),
7-amino-actinomycin D (red) and Hoechst 33342 staining (blue).
Scale bar, 50 µm. *P<0.05, **P<0.01 vs. NC; unpaired
Student's t-test. ALDH1high, high ALDH1 activity; SLC20A1,
solute carrier family 20 member 1; KD, knockdown; NC, negative
control; ALDH1, aldehyde dehydrogenase 1; siRNA, small interfering
RNA. |
To investigate the reason why
SLC20A1-deficient ALDH1high PDAC cells exhibited
suppressed tumorsphere formation and cell viability, trypan blue
dye exclusion and caspase-3/7 fluorometric assays were performed.
It was revealed that SLC20A1 siRNA KD in
ALDH1high cells significantly increased the number of
trypan blue-positive cells (Fig. 6E and
F). Furthermore, SLC20A1 siRNA KD in
ALDH1high cells resulted in the enhancement of caspase-3
activity (Fig. 6G and H) and
SLC20A1 siRNA KD in ALDH1high cells caused an
increase in cell apoptosis (Fig. 6I and
J). These results suggested that SLC20A1 was involved in
the survival of ALDH1-positive pancreatic CSCs via the suppression
of caspase-3-dependent apoptosis.
Discussion
The present study revealed that patients with
SLC20A1high in PDAC had a poorer prognosis than
patients with SLC20A1low, particularly at the
early tumor stages. Moreover, patients with
SLC20A1highALDH1A3high PDAC had
the poorest prognosis, and SLC20A1 was observed to be
involved in the tumorsphere formation and cell survival of
ALDH1-positive PDAC CSCs. Thus, SLC20A1 may be used as a
prognostic marker and new therapeutic target of ALDH1-positive
pancreatic CSCs.
Several genes, including SLC20A1, have been
reported as PDAC prognostic score by the analysis of OS (25,26).
The present survival analyses based on DSS, DFI and PFI in PDAC
were consistent with previous reports (Fig. 1; Table
I) (27,28). Notably, the present results revealed
that patients with SLC20A1high showed a poorer
prognosis than patients with SLC20A1low at tumor
stage I. In PDAC, early recurrence after resection is a serious
problem, even though the lesion may be found at resectable states
(3–5). In breast cancer, patients with
SLC20A1high have also been reported to exhibit a
poorer prognosis than patients with SLC20A1low at
stage I (22). Furthermore,
patients with SLC20A1high luminal A and B breast
cancer have a higher risk of recurrence >10 years later after
endocrine therapy (22). In PDAC,
however, SLC20A1high tumors progress in a short
interval of time after medical treatment. Furthermore, high
SLC20A1 gene expression may be associated with KRAS
missense and truncating mutations, and deep deletion and deletion
of CDKN2A, TP53 and SMAD4, which are introduced
during the premalignant progression of PDAC. Thus, SLC20A1
could contribute to the aggressive progression of PDAC from an
early stage.
SLC20A1 has previously been shown to be involved in
cell proliferation in pre-osteoblastic MC3T3-E1 and NIH3T3 cells
(33,34). SLC20A1 depletion causes an increase
in TNF-dependent p38 MAPK activation, a delay in entry to the
G2/M phase in HeLa cells (32,33),
and TNF-induced caspase-3-dependent apoptosis via the JNK signaling
pathway in HeLa cells (32). The
current study also revealed that SLC20A1 depletion caused
p38 phosphorylation, caspase-3 activation and increased cell death
in PDAC cells. Thus, SLC20A1 may be involved in cell
survival via the suppression of caspase-dependent apoptosis. The
SLC20A1 protein mediates the uptake of Pi into cells (20,21).
Notably, Pi uptake is not affected by SLC20A1-depletion (50) and SLC20A1 overexpression in MC3T3-E1
cells does not affect Pi uptake (34). Furthermore, the introduction of
Pi-uptake defective SLC20A1 (S128A) into SLC20A1-deficient cells
has been shown to restore cell viability (33). Thus, SLC20A1 may be involved in the
regulation of Pi uptake-dependent and -independent cell survival.
The detailed mechanism underlying the SLC20A1-dependent regulation
of cell survival remains to be elucidated. ALDH1A1 is used as a CSC
marker in PDAC (14,15). The present study revealed that
ALDH1high cells concentrated ALDH1-positive CSCs in
MIA-PaCa-2 and PANC-1 cells. As shown in Fig. S6A, although ALDH1A3 was highly
expressed in both MIA-PaCa-2 and PANC-1 cells, ALDH1A1 exhibited
less expression in PANC-1 cells. These results suggested that
ALDH1A3 may be a major gene of the ALDH1 family contributing
to ALDH1 activity in PDAC cells, as well as in breast cancer
(44,51). As aforementioned, although
SLC20A1 has been reported as a gene of PDAC prognostic score
(25,26), ALDH1A3 is not included in the
PDAC prognostic score. The present results suggested that ALDH1A3
is also an important factor in predicting the prognosis of PDAC.
Notably, ALDH1A3 has been reported to be a prognostic factor for
various types of cancers (10,16,17,40,44).
Both SLC20A1highALDH1A1high and
SLC20A1highALDH1A1low also have
poor prognoses. SLC20A1 may function in cells positive for
cancer stem cell markers other than ALDH1A3. In fact, as shown in
Fig. S2, SLC20A1 gene
expression is correlated with the expression of other stem
cell-related genes, such as CD44, in addition to
ALDH1A3. However, as shown in Figs. 1 and S5, SLC20A1 and ALDH1A3 gene
expression levels were associated with TP53 mutation. Other
than that, ALDH1A1 gene expression was inversely associated
with KRAS missense mutations and TP53 mutation. In
addition, as shown in Fig. S2,
although the SLC20A1 gene is correlated with the
ALDH1A3 gene, SLC20A1 gene is inversely correlated
with the ALDH1A1 gene. Thus, the SLC20A1 gene, but
not the ALDH1A1 gene, plays an important function in
ALDH1A3-positive cells.
SLC20A1 siRNA KD suppressed in vitro
tumorsphere formation, cell viability, p38 activation, caspase-3
activity and cell death in ALDH1high PDAC cells.
Notably, although SLC20A1 is enriched in ALDH1low
cells rather than ALDH1high cells, ALDH1high
PDAC cells exhibited tumorsphere forming ability, whereas
ALDH1low PDAC cells did not. These results suggested
that SLC20A1 was involved in the survival of ALDH1-positive
pancreatic CSCs by suppressing caspase-3-dependent apoptosis.
SLC20A1 is required for cell proliferation, whereas the phosphate
transport activity is independent of cell proliferation (33). Thus, SLC20A1 in
ALDH1low cells may contribute to functions other than
cell proliferation. Our previous report showed that SLC20A1
also contributes to the in vitro tumorsphere formation and
cell viability of ALDH1-positive breast CSCs (23). ALDH1 is known as a CSC marker in
multiple cancer types (9–16,18).
Therefore, these results suggested that SLC20A1 may be
involved in the stemness of ALDH1-positive CSCs, and may act as a
prognostic marker and therapeutic target in various types of cancer
types. In the present study, we only showed the experimental
results for loss-of-function of SLC20A1. Although we
examined the effect of transient and stable overexpression of
SLC20A1 in response to an expression vector in pancreatic
cell lines, the results were inconsistent and precise results could
not be obtained. Therefore, the validation of our findings in the
experiments for gain-of-function of SLC20A1 will be needed.
In the present study, we revealed the role of SLC20A1 in
PDAC stem cells via in vitro experiments, and by analyzing a
public dataset including data on gene mutations, gene expression,
and clinical information. It will be important to validate these
results via immunohistochemical analysis of patient samples and
analysis of PDAC model mice in the future.
In conclusion, the present study indicated that
SLC20A1 is involved in the tumorsphere formation and cell
survival of ALDH1-positive pancreatic CSCs, and contributes to
cancer progression and poor clinical outcome in PDAC. Therefore,
SLC20A1 may be used as a prognostic biomarker and new
therapeutic target for ALDH1-positive pancreatic CSCs.
Supplementary Material
Supporting Data
Supporting Data
Acknowledgements
The authors would like to thank Ms. Makoto Fujii
(Department of Medicinal and Life Sciences, Faculty of
Pharmaceutical Sciences, Tokyo University of Science, Noda, Japan)
for cell culturing technical support.
Funding
The present study was supported by Grant-in-Aid for Scientific
Research (C) of JSPS (grant no. 20K07207), JST Moonshot R&D
(grant no. JPMJPS2022), Tokyo University of Science Grant for
President's Research Promotion, Grant-in-Aid for Research Activity
Start-up (grant no. 21K20732), Grant-in-Aid for Early-Career
Scientists (grant no. 23K14352), JST SPRING (grant no. JPMJSP2151),
Grant-in-Aid for Special Research in Subsidies for ordinary
expenses of private schools from The Promotion and Mutual Aid
Corporation for Private Schools of Japan, Grant from Institute for
Environmental & Gender-specific Medicine, Juntendo University,
and Nagai Memorial Research Scholarship from the Pharmaceutical
Society of Japan.
Availability of data and materials
The data generated in the present study may be
requested from the corresponding author.
Authors' contributions
IM, TK, CO and YH performed the experiments. IM,
TK, CO, ST and KA confirmed the authenticity of all the raw data.
IM, TK, CO, YM, YT, HaM, ST, AO and HiM performed the
bioinformatics analysis. IM, TK, CO, ST, AO, HiM, YM, YT, HaM, YX,
KeS, KaS and SO contributed to interpretation of data. IM, TK, CO
and KA conceived the study. IM, TK, CO, AO, HiM, YM, YT, HaM and KA
drafted the manuscript. IM, TK, CO, ST, AO, HiM, YM, YT, HaM, KaS,
SO and KA contributed to discussion and review of the manuscript.
All authors have read and approved the final version of the
manuscript.
Ethics approval and consent to
participate
Not applicable.
Patient consent for publication
Not applicable.
Competing interests
The authors declare that they have no competing
interests.
References
|
1
|
Sung H, Ferlay J, Siegel RL, Laversanne M,
Soerjomataram I, Jemal A and Bray F: Global cancer statistics
2020:GLOBOCAN estimates of incidence and mortality worldwide for 36
cancers in 185 countries. CA Cancer J Clin. 71:209–249. 2021.
View Article : Google Scholar : PubMed/NCBI
|
|
2
|
Siegel RL, Miller KD, Wagle NS and Jemal
A: Cancer statistics, 2023. CA Cancer J Clin. 73:17–48. 2023.
View Article : Google Scholar : PubMed/NCBI
|
|
3
|
McGuigan A, Kelly P, Turkington RC, Jones
C, Coleman HG and McCain RS: Pancreatic cancer: A review of
clinical diagnosis, epidemiology, treatment and outcomes. World J
Gastroenterol. 24:4846–4861. 2018. View Article : Google Scholar : PubMed/NCBI
|
|
4
|
Grant TJ, Hua K and Singh A: Molecular
pathogenesis of pancreatic cancer. Prog Mol Biol Transl Sci.
144:241–275. 2016. View Article : Google Scholar : PubMed/NCBI
|
|
5
|
Kern SE, Hruban RH, Hidalgo M and Yeo CJ:
An introduction to pancreatic adenocarcinoma genetics, pathology
and therapy. Cancer Biol Ther. 1:607–613. 2002. View Article : Google Scholar : PubMed/NCBI
|
|
6
|
Reya T, Morrison SJ, Clarke MF and
Weissman IL: Stem cells, cancer, and cancer stem cells. Nature.
414:105–111. 2001. View Article : Google Scholar : PubMed/NCBI
|
|
7
|
Visvader JE and Lindeman GJ: Cancer stem
cells: Current status and evolving complexities. Cell Stem Cell.
10:717–728. 2012. View Article : Google Scholar : PubMed/NCBI
|
|
8
|
Diehn M, Cho RW, Lobo NA, Kalisky T, Dorie
MJ, Kulp AN, Qian D, Lam JS, Ailles LE, Wong M, et al: Association
of reactive oxygen species levels and radioresistance in cancer
stem cells. Nature. 458:780–783. 2009. View Article : Google Scholar : PubMed/NCBI
|
|
9
|
Ginestier C, Hur MH, Charafe-Jauffret E,
Monville F, Dutcher J, Brown M, Jacquemier J, Viens P, Kleer CG,
Liu S, et al: ALDH1 is a marker of normal and malignant human
mammary stem cells and a predictor of poor clinical outcome. Cell
Stem Cell. 1:555–567. 2007. View Article : Google Scholar : PubMed/NCBI
|
|
10
|
Nozaki Y, Tamori S, Inada M, Katayama R,
Nakane H, Minamishima O, Onodera Y, Abe M, Shiina S, Tamura K, et
al: Correlation between c-Met and ALDH1 contributes to the survival
and tumor-sphere formation of ALDH1 positive breast cancer stem
cells and predicts poor clinical outcome in breast cancer. Genes
Cancer. 8:628–639. 2017. View Article : Google Scholar : PubMed/NCBI
|
|
11
|
Kim MP, Fleming JB, Wang H, Abbruzzese JL,
Choi W, Kopetz S, McConkey DJ, Evans DB and Gallick GE: ALDH
activity selectively defines an enhanced tumor-initiating cell
population relative to CD133 expression in human pancreatic
adenocarcinoma. PLoS One. 6:e206362011. View Article : Google Scholar : PubMed/NCBI
|
|
12
|
Rasheed ZA, Yang J, Wang Q, Kowalski J,
Freed I, Murter C, Hong SM, Koorstra JB, Rajeshkumar NV, He X, et
al: Prognostic significance of tumorigenic cells with mesenchymal
features in pancreatic adenocarcinoma. J Natl Cancer Inst.
102:340–351. 2010. View Article : Google Scholar : PubMed/NCBI
|
|
13
|
Kim SK, Kim H, Lee DH, Kim TS, Kim T,
Chung C, Koh GY, Kim H and Lim DS: Reversing the intractable nature
of pancreatic cancer by selectively targeting ALDH-high,
therapy-resistant cancer cells. PLoS One. 8:e781302013. View Article : Google Scholar : PubMed/NCBI
|
|
14
|
Marcato P, Dean CA, Giacomantonio CA and
Lee PWK: Aldehyde dehydrogenase: Its role as a cancer stem cell
markaer comes down to the specific isoform. Cell Cycle.
10:1378–1384. 2011. View Article : Google Scholar : PubMed/NCBI
|
|
15
|
Shingh S, Arcaroli J, Thompson DC,
Messersmith W and Vasiliou V: Acetaldehyde and
retinaldehyde-metabolizing enzymes in colon and pancreatic cancers.
Adv Exp Med Biol. 815:281–294. 2015. View Article : Google Scholar : PubMed/NCBI
|
|
16
|
McLean ME, McLean MR, Cahill HF, Arun RP,
Walker OL, Wasson MCD, Fernando W, Venkatesh J and Marcato P: The
expanding role of cancer stem cell marker ALDH1A3 in cancer and
beyond. Cancers (Basel). 15:4922023. View Article : Google Scholar : PubMed/NCBI
|
|
17
|
Kasai T, Tamori S, Takasaki Y, Matsuoka I,
Ozaki A, Matsuda C, Harada Y, Sasaki K, Ohno S and Akimoto K: High
expression of PKCλ and ALDH1A3 indicates a poor prognosis, and PKCλ
is required for the asymmetric cell division of ALDH1A3-positive
cancer stem cells in PDAC. Biochem Biophys Res Commun. 669:85–94.
2023. View Article : Google Scholar : PubMed/NCBI
|
|
18
|
Jia J, Parikh H, Xiao W, Hoskins JW,
Pflicke H, Liu X, Collins I, Zhou W, Wang Z, Powell J, et al: An
integrated transcriptome and epigenome analysis identifies a novel
candidate gene for pancreatic cancer. BMC Medical Genom. 6:332013.
View Article : Google Scholar : PubMed/NCBI
|
|
19
|
Nie S, Qian X, Shi M, Li H, Peng C, Ding
X, Zhang S, Zhang B, Xu G, Lv Y, et al: ALDH1A3 accelerates
pancreatic cancer metastasis by promoting glucose metabolism. Flont
Oncol. 10:9152020. View Article : Google Scholar
|
|
20
|
Johann SV, Gibbons JJ and O'Hara B: GLVR1,
a receptor for gibbon ape leukemia virus, is homologous to a
phosphate permease of Neurospora crassa and is expressed at high
levels in the brain and thymus. J Virol. 66:1635–1640. 1992.
View Article : Google Scholar : PubMed/NCBI
|
|
21
|
Kavanaugh MP, Miller DG, Zhang W, Law W,
Kozak SL, Kabat D and Miller AD: Cell-surface receptors for gibbon
ape leukemia virus and amphotropic murine retrovirus are inducible
sodium-dependent phosphate symporters. Proc Natl Acad Sci USA.
91:7071–7075. 1994. View Article : Google Scholar : PubMed/NCBI
|
|
22
|
Onaga C, Tamori S, Matsuoka I, Ozaki A,
Motomura H, Nagashima Y, Sato T, Sato K, Xiong Y, Sasaki K, et al:
High expression of SLC20A1 is less effective for endocrine therapy
and predicts late recurrence in ER-positive breast cancer. PLoS
One. 17:e02687992022. View Article : Google Scholar : PubMed/NCBI
|
|
23
|
Onaga C, Tamori S, Motomura H, Ozaki A,
Matsuda C, Matsuoka I, Fujita T, Nozaki Y, Hara Y, Kawano Y, et al:
High SLC20A1 expression is associated with poor prognoses in
claudin-low and basal-like breast cancers. Anticancer Res.
41:43–54. 2021. View Article : Google Scholar : PubMed/NCBI
|
|
24
|
Onaga C, Tamori S, Matsuoka I, Ozaki A,
Motomura H, Nagashima Y, Sato T, Sato K, Tahata K, Xiong Y, et al:
High SLC20A1 expression is associated with poor prognosis for
radiotherapy of estrogen receptor-positive breast cancer. Cancer
Diagn Progn. 2:429–442. 2022. View Article : Google Scholar : PubMed/NCBI
|
|
25
|
Haider S, Wang J, Nagano A, Desai A,
Arumugam P, Dumartin L, Fitzgibbon J, Hagemann T, Marshall JF,
Kocher HM, et al: A multi-gene signature predicts outcome in
patients with pancreatic ductal adenocarcinoma. Genome Med.
6:1052014. View Article : Google Scholar : PubMed/NCBI
|
|
26
|
Canlı SD, Dedeoğlu E, Akbar MW,
Küçükkaraduman B, İşbilen M, Erdoğan ÖŞ, Erciyas SK, Yazıcı H,
Vural B and Güre AO: A novel 20-gene prognostic score in pancreatic
adenocarcinoma. PLoS One. 15:e02318352020. View Article : Google Scholar : PubMed/NCBI
|
|
27
|
Ouyang J, Hu Z, Tong J, Yang Y, Wang J,
Chen X, Luo T, Yu S, Wang X and Huang S: Construction and
evaluation of a nomogram for predicting survival in patients with
lung cancer. Aging (Albany NY). 14:2775–2792. 2022. View Article : Google Scholar : PubMed/NCBI
|
|
28
|
Okamoto T, Onaga C, Matsuoka I, Ozaki A,
Matsuda C, Kasai T, Xiong Y, Harada Y, Sato T, Nakano Y, et al:
High SLC20A1 expression indicates poor prognosis in prostate
cancer. Cancer Diagn Progn. 3:439–448. 2023. View Article : Google Scholar : PubMed/NCBI
|
|
29
|
Sato K and Akimoto K: Expression levels of
KMT2C and SLC20A1 identified by information-theoretical analysis
are powerful prognostic biomarkers in estrogen receptor-positive
breast cancer. Clin Breast Cancer. 17:e135–e142. 2017. View Article : Google Scholar : PubMed/NCBI
|
|
30
|
Shen T, Wang M and Wang X: Identification
of prognosis-related Hub RNA binding proteins function through
regulating metabolic processes in tongue cancer. J Cancer.
12:2230–2242. 2021. View Article : Google Scholar : PubMed/NCBI
|
|
31
|
Dong Z, Wang J, Zhan T and Xu S:
Identification of prognostic risk factors for esophageal
adenocarcinoma using bioinformatics analysis. Onco Targets Ther.
11:4327–4337. 2018. View Article : Google Scholar : PubMed/NCBI
|
|
32
|
Salaün C, Leroy C, Rousseau A, Boitez V,
Beck L and Friedlander G: Identification of a novel
transport-independent function of PiT1/SLC20A1 in the regulation of
TNF-induced apoptosis. J Biol Chem. 285:34408–34418. 2010.
View Article : Google Scholar : PubMed/NCBI
|
|
33
|
Beck L, Leroy C, Salaün C, Margall-Ducos
G, Desdouets C and Friedlander G: Identification of a novel
function of PiT1 critical for cell proliferation and independent of
its phosphate transport activity. J Biol Chem. 284:31363–31374.
2009. View Article : Google Scholar : PubMed/NCBI
|
|
34
|
Byskov K, Jensen N, Kongsfelt IB, Wielsøe
M, Pedersen LE, Haldrup C and Pedersen L: Regulation of cell
proliferation and cell density by the inorganic phosphate
transporter PiT1. Cell Div. 7:72012. View Article : Google Scholar : PubMed/NCBI
|
|
35
|
Cancer Genome Atlas Research Network, .
Weinstein JN, Collisson EA, Mills GB, Shaw KR, Ozenberger BA,
Ellrott K, Shmulevich I, Sander C and Stuart JM: The cancer genome
atlas pan-cancer analysis project. Nat Genet. 45:1113–1120. 2013.
View Article : Google Scholar : PubMed/NCBI
|
|
36
|
Hoadley KA, Yau C, Hinoue T, Wolf DM,
Lazar AJ, Drill E, Shen R, Taylor AM, Cherniack AD, Thorsson V, et
al: Cell-of-origin patterns dominate the molecular classification
of 10,000 tumors from 33 types of cancer. Cell. 173:291–304. 2018.
View Article : Google Scholar : PubMed/NCBI
|
|
37
|
Cerami E, Gao J, Dogrusoz U, Gross BE,
Sumer SO, Aksoy BA, Jacobsen A, Byrne CJ, Heuer ML, Larsson E, et
al: The cBio cancer genomics portal: an open platform for exploring
multidimensional cancer genomics data. Cancer Discov. 2:401–404.
2012. View Article : Google Scholar : PubMed/NCBI
|
|
38
|
Gao J, Aksoy BA, Dogrusoz U, Dresdner G,
Gross B, Sumer SO, Sun Y, Jacobsen A, Sinha R, Larssson E, et al:
Integrative analysis of complex cancer genomics and clinical
profiles using the cBioPortal. Sci Signal. 6:pl12013. View Article : Google Scholar : PubMed/NCBI
|
|
39
|
Chandrashekar DS, Bashel B, Balasubramanya
SAH, Creighton CJ, Ponce-Rodriguez I, Chakravarthi BVSK and
Varambally S: UALCAN: A portal for facilitating tumor subgroup gene
expression and survival analyses. Neoplasia. 19:649–658. 2017.
View Article : Google Scholar : PubMed/NCBI
|
|
40
|
Nozaki Y, Motomura H, Tamori S, Kimura Y,
Onaga C, Kanai S, Ishihara Y, Ozaki A, Hara Y, Harada Y, et al:
High PKCλ expression is required for ALDH1-positive cancer stem
cell function and indicates a poor clinical outcome in late-stage
breast cancer patients. PLoS One. 15:e02357472020. View Article : Google Scholar : PubMed/NCBI
|
|
41
|
Motomura H, Tamori S, Yatani MK, Namiki A,
Onaga C, Ozaki A, Takasawa R, Mano Y, Sato T, Hara Y, et al: GLO 1
and PKCλ regulate ALDH1-positive breast cancer stem cell survival.
Anticancer Res. 41:5959–5971. 2021. View Article : Google Scholar : PubMed/NCBI
|
|
42
|
Ozaki A, Motomura H, Tamori S, Onaga C,
Nagashima Y, Kotori M, Matsuda C, Matsuda A, Mochizuki N, Sato T,
et al: High expression of p62 and ALDH1A3 is associated with poor
prognosis in luminal b breast cancer. Anticancer Res. 42:3299–3312.
2022. View Article : Google Scholar : PubMed/NCBI
|
|
43
|
Xiong Y, Motomura H, Tamori S, Ozaki A,
Onaga C, Hara Y, Sato K, Tahata K, Harada Y, Sasaki K, et al: High
expression of CD58 and ALDH1A3 predicts a poor prognosis in
basal-like breast cancer. Anticancer Res. 42:5223–5232. 2022.
View Article : Google Scholar : PubMed/NCBI
|
|
44
|
Tamori S, Nozaki Y, Motomura H, Nakane H,
Katayama R, Onaga C, Kikuchi E, Shimada N, Suzuki Y, Noike M, et
al: Glyoxalase 1 gene is highly expressed in basal-like human
breast cancers and contributes to survival of ALDH1-positive breast
cancer stem cells. Oncotarget. 9:36515–36529. 2018. View Article : Google Scholar : PubMed/NCBI
|
|
45
|
Motomura H, Ozaki A, Tamori S, Onaga C,
Nozaki Y, Waki Y, Takasawa R, Yoshizawa K, Mano Y, Sato T, et al:
Glyoxalase 1 and protein kinase Cλ as potential therapeutic targets
for late-stage breast cancer. Oncol Lett. 22:5472021. View Article : Google Scholar : PubMed/NCBI
|
|
46
|
Connor AA and Gallinger S: Pancreatic
cancer evolution and heterogeneity: Integrating omics and clinical
data. Nat Rev Cancer. 22:131–142. 2022. View Article : Google Scholar : PubMed/NCBI
|
|
47
|
Hong SP, Wen J, Bang S, Park S and Song
SY: CD44-positive cells are responsible for gemcitabine resistance
in pancreatic cancer cells. Int J Cancer. 125:2323–2331. 2009.
View Article : Google Scholar : PubMed/NCBI
|
|
48
|
Hermann PC, Huber SL, Herrler T, Aicher A,
Ellwart JW, Guba M, Bruns CJ and Heeschen C: Distinct populations
of cancer stem cells determine tumor growth and metastatic activity
in human pancreatic cancer. Cell Stem Cell. 1:313–323. 2007.
View Article : Google Scholar : PubMed/NCBI
|
|
49
|
Maeda S, Shinchi H, Kurahara H, Mataki Y,
Maemura K, Sato M, Natsugoe S, Aikou T and Takao S: CD133
expression is correlated with lymph node metastasis and vascular
endothelial growth factor-C expression in pancreatic cancer. Br J
Cancer. 98:1389–1397. 2008. View Article : Google Scholar : PubMed/NCBI
|
|
50
|
Beck L, Leroy C, Cormier SB, Forand A,
Salaün C, Paris N, Bernier A, Ureña-Torres P, Prié D, Ollero M, et
al: The phosphate transporter PiT1 (Slc20a1) revealed as a new
essential gene for mouse liver development. PLoS One. 5:e91482010.
View Article : Google Scholar : PubMed/NCBI
|
|
51
|
Marcato P, Dean CA, Liu RZ, Coyle KM,
Bydoun M, Wallace M, Clements D, Turner C, Mathenge EG, Gujar SA,
et al: Aldehyde dehydrogenase 1A3 influences breast cancer
progression via differential retinoic acid signaling. Mol Oncol.
9:17–31. 2015. View Article : Google Scholar : PubMed/NCBI
|