Introduction
Papillary renal cell carcinoma (PRCC) affects
>400,000 people worldwide each year, mainly affecting people
>60 years old, with 2/3 of patients being male (1). Among them, clear cell (cc) RCC is the
most prevalent type of kidney cancer, an aggressive cancer that
originates from the proximal tubular epithelium and its metastatic
form is closely associated with high mortality (2). Although early detection allows ccRCC
to be successfully treated with surgical or ablation strategies,
≤1/3 of patients have or develop metastases (3). Metastatic ccRCC is almost always fatal
and is biologically different from non-metastatic disease;
therefore, exploring its underlying mechanisms is crucial to
developing anti-ccRCC therapeutic options.
Cancer cells sustain a unique energy metabolism
network to facilitate cell survival, growth, progression and
metastasis in adverse environments (4). Glycolysis is the initial process in
the breakdown of glucose to harness energy for cellular metabolism.
During glycolysis, cancer cells take up more glucose than healthy
cells, and lactic acid is produced from pyruvate which reduces the
pH of the tumor (5). A recent study
confirmed that glycolysis is closely related to invasion status,
clinical stage, patient prognosis and tumor drug resistance, and
affects the occurrence and development of ccRCC (6). Moreover, ferroptosis is a form of
non-apoptotic cell death driven by iron-dependent lipid
peroxidation, which is associated with a variety of metabolic
disorders and disruption of homeostasis. In addition, ferroptosis
has been studied in hepatocellular carcinoma, and breast, lung,
pancreatic, gastric and cervical cancer, and other tumors
exhibiting ferroptosis suppression (7). Furthermore, ferroptosis is associated
with numerous physiological processes such as mitochondrial
function, lipid metabolism and oxidative stress; induction of
ferroptosis plays a pivotal role in inhibiting tumor progression
(8). The core mechanism of
ferroptosis is lipid peroxidation which is dependent on iron and
its impact on tumors still exists in ccRCC (9,10).
Enolase 2 (ENO2), a crucial member of the enolase
family, is the rate-limiting enzyme in glycolysis catalyzing the
conversion of 2-phosphoglycerate to phosphoenolpyruvate (11,12).
ENO2, which mainly exists in neuroendocrine tissues and neurons, is
a long-chain acidic dimer protein with 433 amino acids that
encompasses two enolate isoenzymes αγ and γγ (13). ENO2 is a well-established tumor
biomarker in various cancers, such as prostate cancer, pancreatic
ductal adenocarcinoma, small-cell lung cancer, metastatic
neuroblastoma and the microvascular invasion status of liver cancer
(12,14). Recent studies demonstrated that
overexpression of ENO2 is associated with increased cell
proliferation and glycolysis enrichment in PRCC (15–17). A
similar trend was also observed in bone marrow mononuclear cells of
hematological tumors (18). In
addition, ENO2 promotes colorectal cancer metastasis by activating
yes-associated protein 1 (YAP1)-induced epithelial-mesenchymal
transition, while inhibiting the activation of the Hippo-YAP1
pathway induces ferroptosis in small-cell lung cancer cells
(19,20). Tumorigenesis and metastasis of ccRCC
can be promoted by regulating microRNA-498/Hippo-YAP1 axis
(21). However, to the best of our
knowledge, the role of ENO2 in ccRCC has not been extensively
studied mechanistically.
The present study aimed to evaluate the effect of
ENO2 on ccRCC by regulating the expression of ENO2 and analyzing
the mechanism of ENO2 on ccRCC through YAP1 signaling.
Materials and methods
Cell culture and transfection
The HK-2 normal human renal tubular epithelial cell
line, and the 786-O, ACHN, Caki-1 and 769-PRCC cell lines were
purchased from the American Type Culture Collection. All the cells
were cultured in RPMI-1640 (Gibco; Thermo Fisher Scientific, Inc.)
supplemented with 10% fetal bovine serum (Biochrom, Ltd.), 100
mg/ml streptomycin and 100 µl/ml penicillin in a humidified
atmosphere with 5% CO2 at 37°C to adjust the cell
concentration to 2×10⁶ cells/ml.
ENO2 small-interfering (si)RNAs, namely si-ENO2#1
and si-ENO2#2, were synthesized by Shanghai GenePharma Co., Ltd.,
and the corresponding negative control (si-NC) was also obtained.
The YAP-overexpressing plasmid DNA (OV-YAP) used to overexpress the
YAP gene in cells, and an empty vector control, were obtained from
Addgene, Inc. Cells were seeded in 6-well plates for western
blotting and cultured for 24 h before treatment. Caki-1 cells were
transfected with 100 nM recombinants at 37°C for 48 h using 6 µl of
Lipofectamine® 2000 (Thermo Fisher Scientific, Inc.) and
2 µg of the vector. Reverse transcription-quantitative (RT-q)PCR
and western blotting were used to screen the Caki-1 cells
transfected with si-ENO2#1 and OV-YAP1 after incubation for 48 h at
37°C. Transfected cells were then used for subsequent experiments.
The sequences of the siRNAs used were as follows: si-ENO2#1,
5′-CCCACAGTGGAGGTGGATCTCTATA-3′; si-ENO2#2,
5′-GGTGGATCTCTATACTGCCAAAGGT-3′; si-NC,
5′-CACTGAAGGTGGAGGTCTTCACATC-3′.
RT-qPCR
Total RNA was extracted using TRIzol®
reagent (Invitrogen; Thermo Fisher Scientific, Inc.), and 2 µg
first-strand cDNA was synthesized using the Maxima First-Strand
Complementary DNA Synthesis Kit (Thermo Fisher Scientific, Inc.)
according to the manufacturer's instructions. Maxima SYBR Green
qPCR Master Mix (Thermo Fisher Scientific, Inc.) was used to
perform qPCR with β-actin was used as the internal reference. The
thermocycling conditions were as follows: Initial denaturation at
95°C for 7 min, followed by 40 cycles of 95°C for 15 sec and 60°C
for 30 sec, and then a final extension at 72°C for 30 sec. The
2−ΔΔCq method was used to calculate the relative
expression of mRNA. The following primer sets were used for qPCR:
ENO2 forward (F), 5′-GTGTCTCTGGCCGTGTGTAA-3′, reverse (R),
5′-TCTCCAGGATATTGGGGGCA-3′; GAPDH F, 5′-AATGGGCAGCCGTTAGGAAA-3′, R,
5′-GCGCCCAATACGACCAAATC-3′.
Western blotting
Total protein was extracted from cells using RIPA
lysis buffer (Beyotime Institute of Biotechnology), and protein
content was quantified using a BCA kit (Beyotime Institute of
Biotechnology). After protein samples (30 µg/lane) were subjected
to protein separation using 10% SDS-PAGE, the bands were
transferred onto a PVDF membrane. PVDF membranes were blocked with
5% skim milk at room temperature for 2 h. Membranes were then
incubated with primary antibodies against ENO2 (cat. no. A12341;
1:2,000; ABclonal Biotech Co., Ltd.), glucose transporter 1 (cat.
no. ab115730; GLUT1; 1:2,000; Abcam), pyruvate kinase muscle
isozyme M2 (cat. no. ab85555; PKM2; 1:2,000; Abcam), hexokinase 2
(cat. no. ab209847; HK2; 1:1,000; Abcam), acyl-CoA synthetase
long-chain family member 4 (cat. no. PA5-27137; ACSL4; 1:1,000;
Thermo Fisher Scientific, Inc.), GSH peroxidase 4 (cat. no.
ab125066; GPX4; 1:1,000; Abcam), ferritin heavy chain 1 (cat. no.
3998S; FTH1; 1:1,000; Cell Signaling Technology, Inc.), solute
carrier family 7 member 11 (PA1-16893; SLC7A11; 1:1,000; Thermo
Fisher Scientific, Inc.), large tumor suppressor kinase 1 (cat. no.
PA5-78278; LATS1; 1:1,000; Thermo Fisher Scientific, Inc.), YAP1
(cat. no. ab52771; 1:1,000; Abcam) and GAPDH (cat. no. ab9485;
1:3,000; Abcam) for 12 h at 4°C. The strips were then incubated
with the Goat Anti-Rabbit IgG H&L (HRP-conjugated) secondary
antibody (cat. no. ab205718; 1:3,000; Abcam) for 2 h at room
temperature, and the signal was detected using an enhanced
chemiluminescence kit (Thermo Fisher Scientific, Inc.). Finally,
the expression levels were semi-quantitatively analyzed using
Image-Pro Plus (version 6.0; Media Cybernetics, Inc.).
Measurement of extracellular
acidification rate (ECAR)
ECAR was evaluated using the Seahorse XFe 96
Extracellular Flux Analyzer (Seahorse Bioscience; Agilent
Technologies, Inc.) with Seahorse XF Glycolysis Stress Test Kit
following the manufacturer's protocols. Treated Caki-1 cells were
evenly spread on a 24-well XF cell culture plate at a density of
5×10⁴ cells per well. Data of ECAR were assessed using
the Seahorse XF-96 Wave software version 2.6 and ECAR is shown in
mpH/min.
Ferroptosis analysis
Ferroptosis analysis was carried out using the Iron
Assay Kit (ScienCell Research Laboratories, Inc.) in a 96-well
plate following the manufacturer's recommendations. To prepare iron
standards, cell lysates were homogenized and diluted to ensure
absorbance readings fell within the standard curve range. Finally,
cell absorbance was measured at 590 nm. PKM2 activator DASA-58
(HY-19330) was purchased from MedChemExpress. DASA-58 (30 µM) was
dissolved in dimethyl sulfoxide for 2 days at room temperature and
was used for activating PKM2.
The reactive oxygen species (ROS) levels of the
cells were evaluated using the ROS Assay Kit (Beyotime Institute of
Biotechnology). Briefly, cells were collected and incubated with
100 µM diacetyl dichlorofluorescein (DCFH-DA) for 30 min. Images
were captured using a fluorescence microscope (Bx51; Olympus
Corporation). Determination of mean fluorescence intensity of
dihydroethidium was determined using a FACSCalibur (BD
Biosciences). The density of relative fluorescence intensity was
analyzed using ImageJ 1.43b software (National Institutes of
Health).
Mitochondrial membrane potential
assay
Mitochondrial membrane potential was evaluated using
JC-1 according to the manufacturer's protocol (Beyotime Institute
of Biotechnology). Briefly, Caki-1 cells were cultured in 6-well
plates with 3×10⁵ cells/well. After 24 h, cells were
treated with SPIO-Serum at a concentration of 100 µg Fe/ml for 24
h. Cells were stained with JC-1 for 20 min in the dark at 37°C and
analyzed using flow cytometry as aforementioned (BD Biosciences),
and observed under a fluorescence microscope (magnification, ×200;
Olympus Corporation). The JC-1 excitation wavelength was 488 nm and
the approximate emission wavelengths of the JC-1 monomeric and
aggregate forms were 529 and 590 nm, respectively.
Detection of biochemical factors
The level of glutathione (GSH) in cell lysates was
measured using the GSH Assay Kit (cat. no. CS0260; Sigma Aldrich;
Merck KGaA) according to the manufacturer's instructions. The
levels of malonaldehyde (MDA) and 4-hydroxynonenal (4-HNE), and the
activities of superoxide dismutase (SOD) and GSH-peroxidase
(GSH-Px) were determined using commercial MDA, 4-HNE, SOD and
GSH-Px assay kits (Nanjing Jiancheng Bioengineering Institute),
respectively, following the manufacturer's instructions. Absorbance
at 450 nm was recorded, and the data were used to calculate the
levels of various cytokines based on the standard curves.
Glucose uptake and lactic acid
concentration
Glucose uptake level in ccRCC cells was measured
using the Glucose Uptake Assay Kit (colorimetric; cat. no.
ab136955; Abcam). To measure lactic acid concentration in culture
medium from Caki-1 cells, a lactic acid assay kit (Nanjing
Jiancheng Bioengineering Institute) was used according to the
manufacturer's instructions. This kit provided a reliable method to
assess lactic acid levels, ensuring that the results were
consistent and reliable.
Intracellular ATP detection assay
Cells were trypsinized and lysed on ice with lysis
buffer provided with an ATP Assay Kit (cat. no. BC0300; Beijing
Solarbio Science & Technology Co., Ltd.). The supernatant was
then collected and incubated with ATP detection reagent following
the manufacturer's instructions. Luminescence was measured using a
spectrophotometer (Biotek Synergy H1; BioTek; Agilent Technologies,
Inc.) and normalized to the protein concentration.
Mitochondrial function evaluation
Mitochondrial respiration experiment was used to
detect mitochondrial oxidative phosphorylation ability. The
mitochondrial permeability transition pore (mPTP) assay kit (cat.
no. C2009S; Beyotime Institute of Biotechnology) was used to detect
the opening of mPTP. Then, Caki-1 cells were seeded into 24-well
plates, and 500 µl fluorescence quenching solution was added to
each well and incubated for 30 min. The incubating solution was
then replaced with preheated DMEM/F12 and incubated in the dark for
30 min. After washing twice with PBS, the cell fluorescence was
observed under a fluorescence microscope.
Statistical analysis
All data are expressed as the mean ± standard
deviation. The results were analyzed with GraphPad Prism (version
8.0; Dotmatics). One-way ANOVA followed by Tukey's post hoc test
was used to compare differences between multiple groups. P<0.05
was considered to indicate a statistically significant
difference.
Results
ENO2 is expressed at high levels in
ccRCC cell lines
The expression of ENO2 in the ccRCC cell lines
786-O, ACHN, 769-P and Caki-1 was measured using RT-qPCR and
western blotting. The expression of ENO2 was significantly higher
in ccRCC cell lines compared with that in the HK-2 normal human
renal tubular epithelial cell line, with the most pronounced
increase in the Caki-1 cells (Fig. 1A
and B). Therefore, Caki-1 cells were selected for subsequent
experimentation.
Interference with ENO2 inhibits
glycolysis levels in ccRCC cells
Additionally, to further study the mechanism of
ENO2, transfection was used to interfere with the expression of
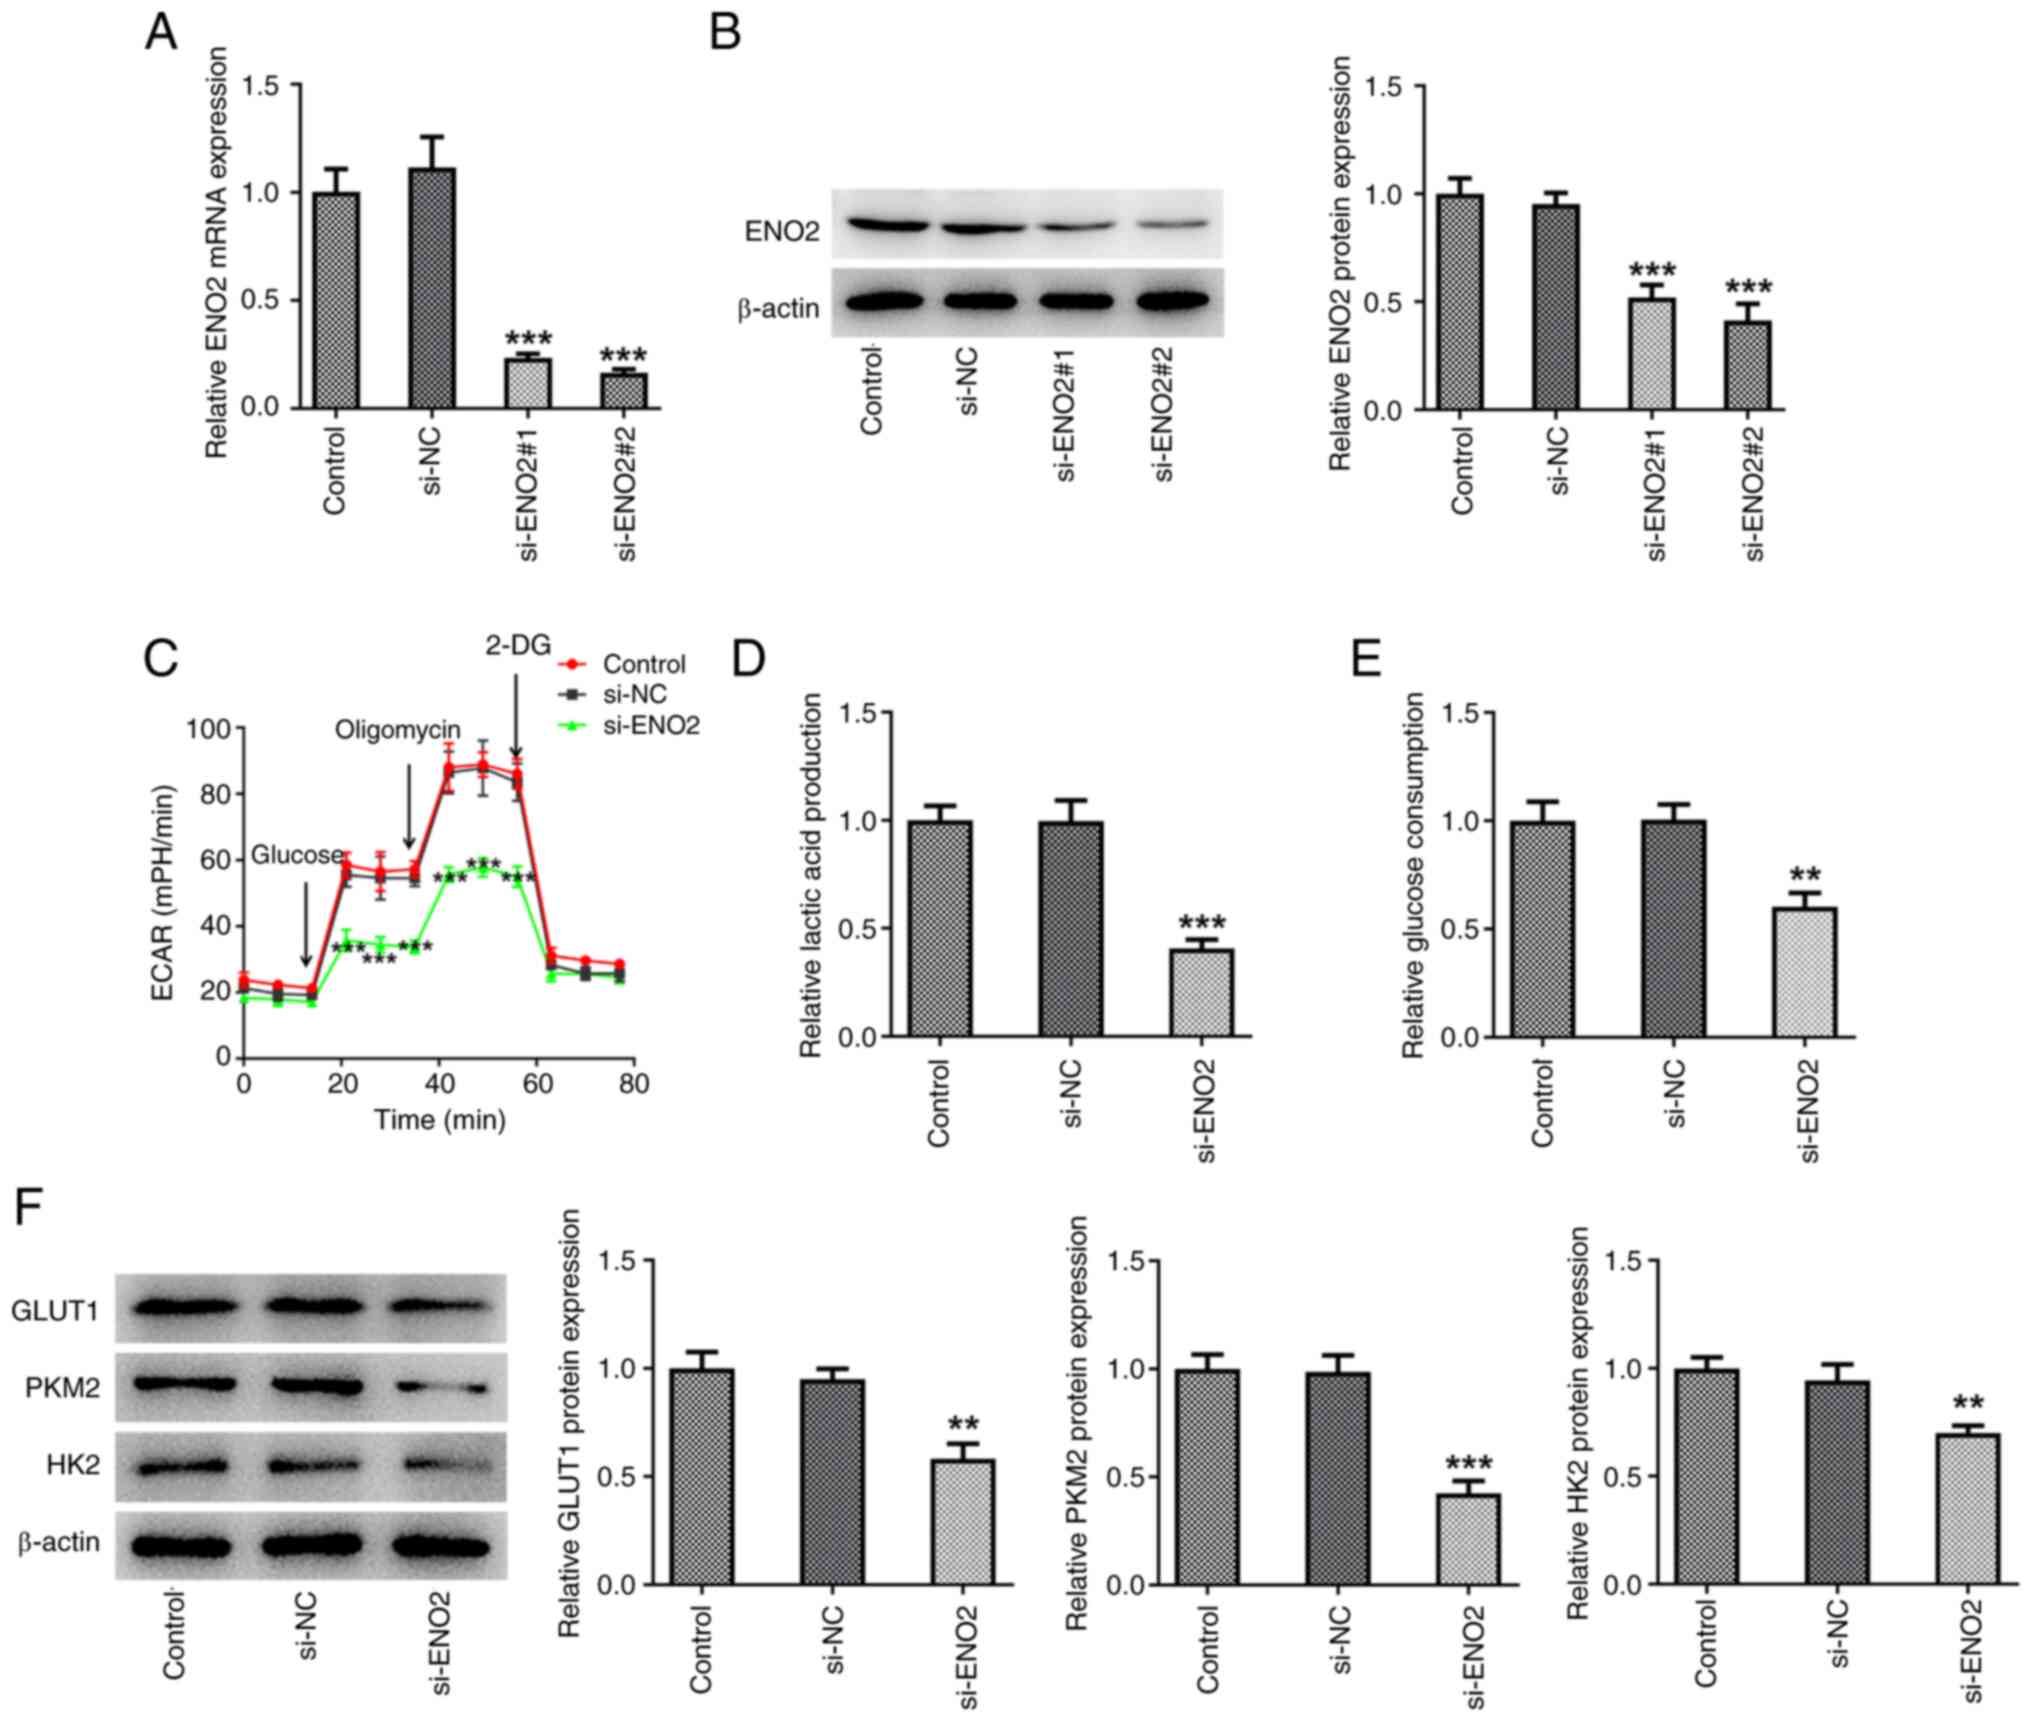
ENO2 (Fig. 2A and B). Subsequently,
the effect of ENO2 interference on glycolysis in ccRCC cell lines
was studied. The levels of ECAR, lactic acid and glucose in Caki-1
cells were significantly reduced compared with those in the si-NC
group (Fig. 2C-E). Moreover,
western blotting showed that the protein expression of GLUT1, HK2
and PKM2 was decreased in the si-ENO2 Caki-1 cell group (Fig. 2F).
ENO2 interference promotes ferroptosis
levels in ccRCC cells
The cytotoxicity of ferroptosis is associated with
the production of ROS (22). To
investigate the role of ROS in the si-ENO2-induced ferroptosis, the
DCFH-DA probe was used to monitor intracellular ROS production.
After ENO2 interference, total iron levels, intracellular ROS
levels, MDA and 4-HNE levels were significantly increased, while
the levels of SOD, GSH-Px and those of the ferroptosis-related
proteins GPX4, FTH1 and SLC7A11 were significantly decreased; the
protein expression of ACSL4 was significantly increased in Caki-1
cells (Fig. 3A-G). These results
suggested that si-ENO2 induced ferroptosis in Caki-1 cells.
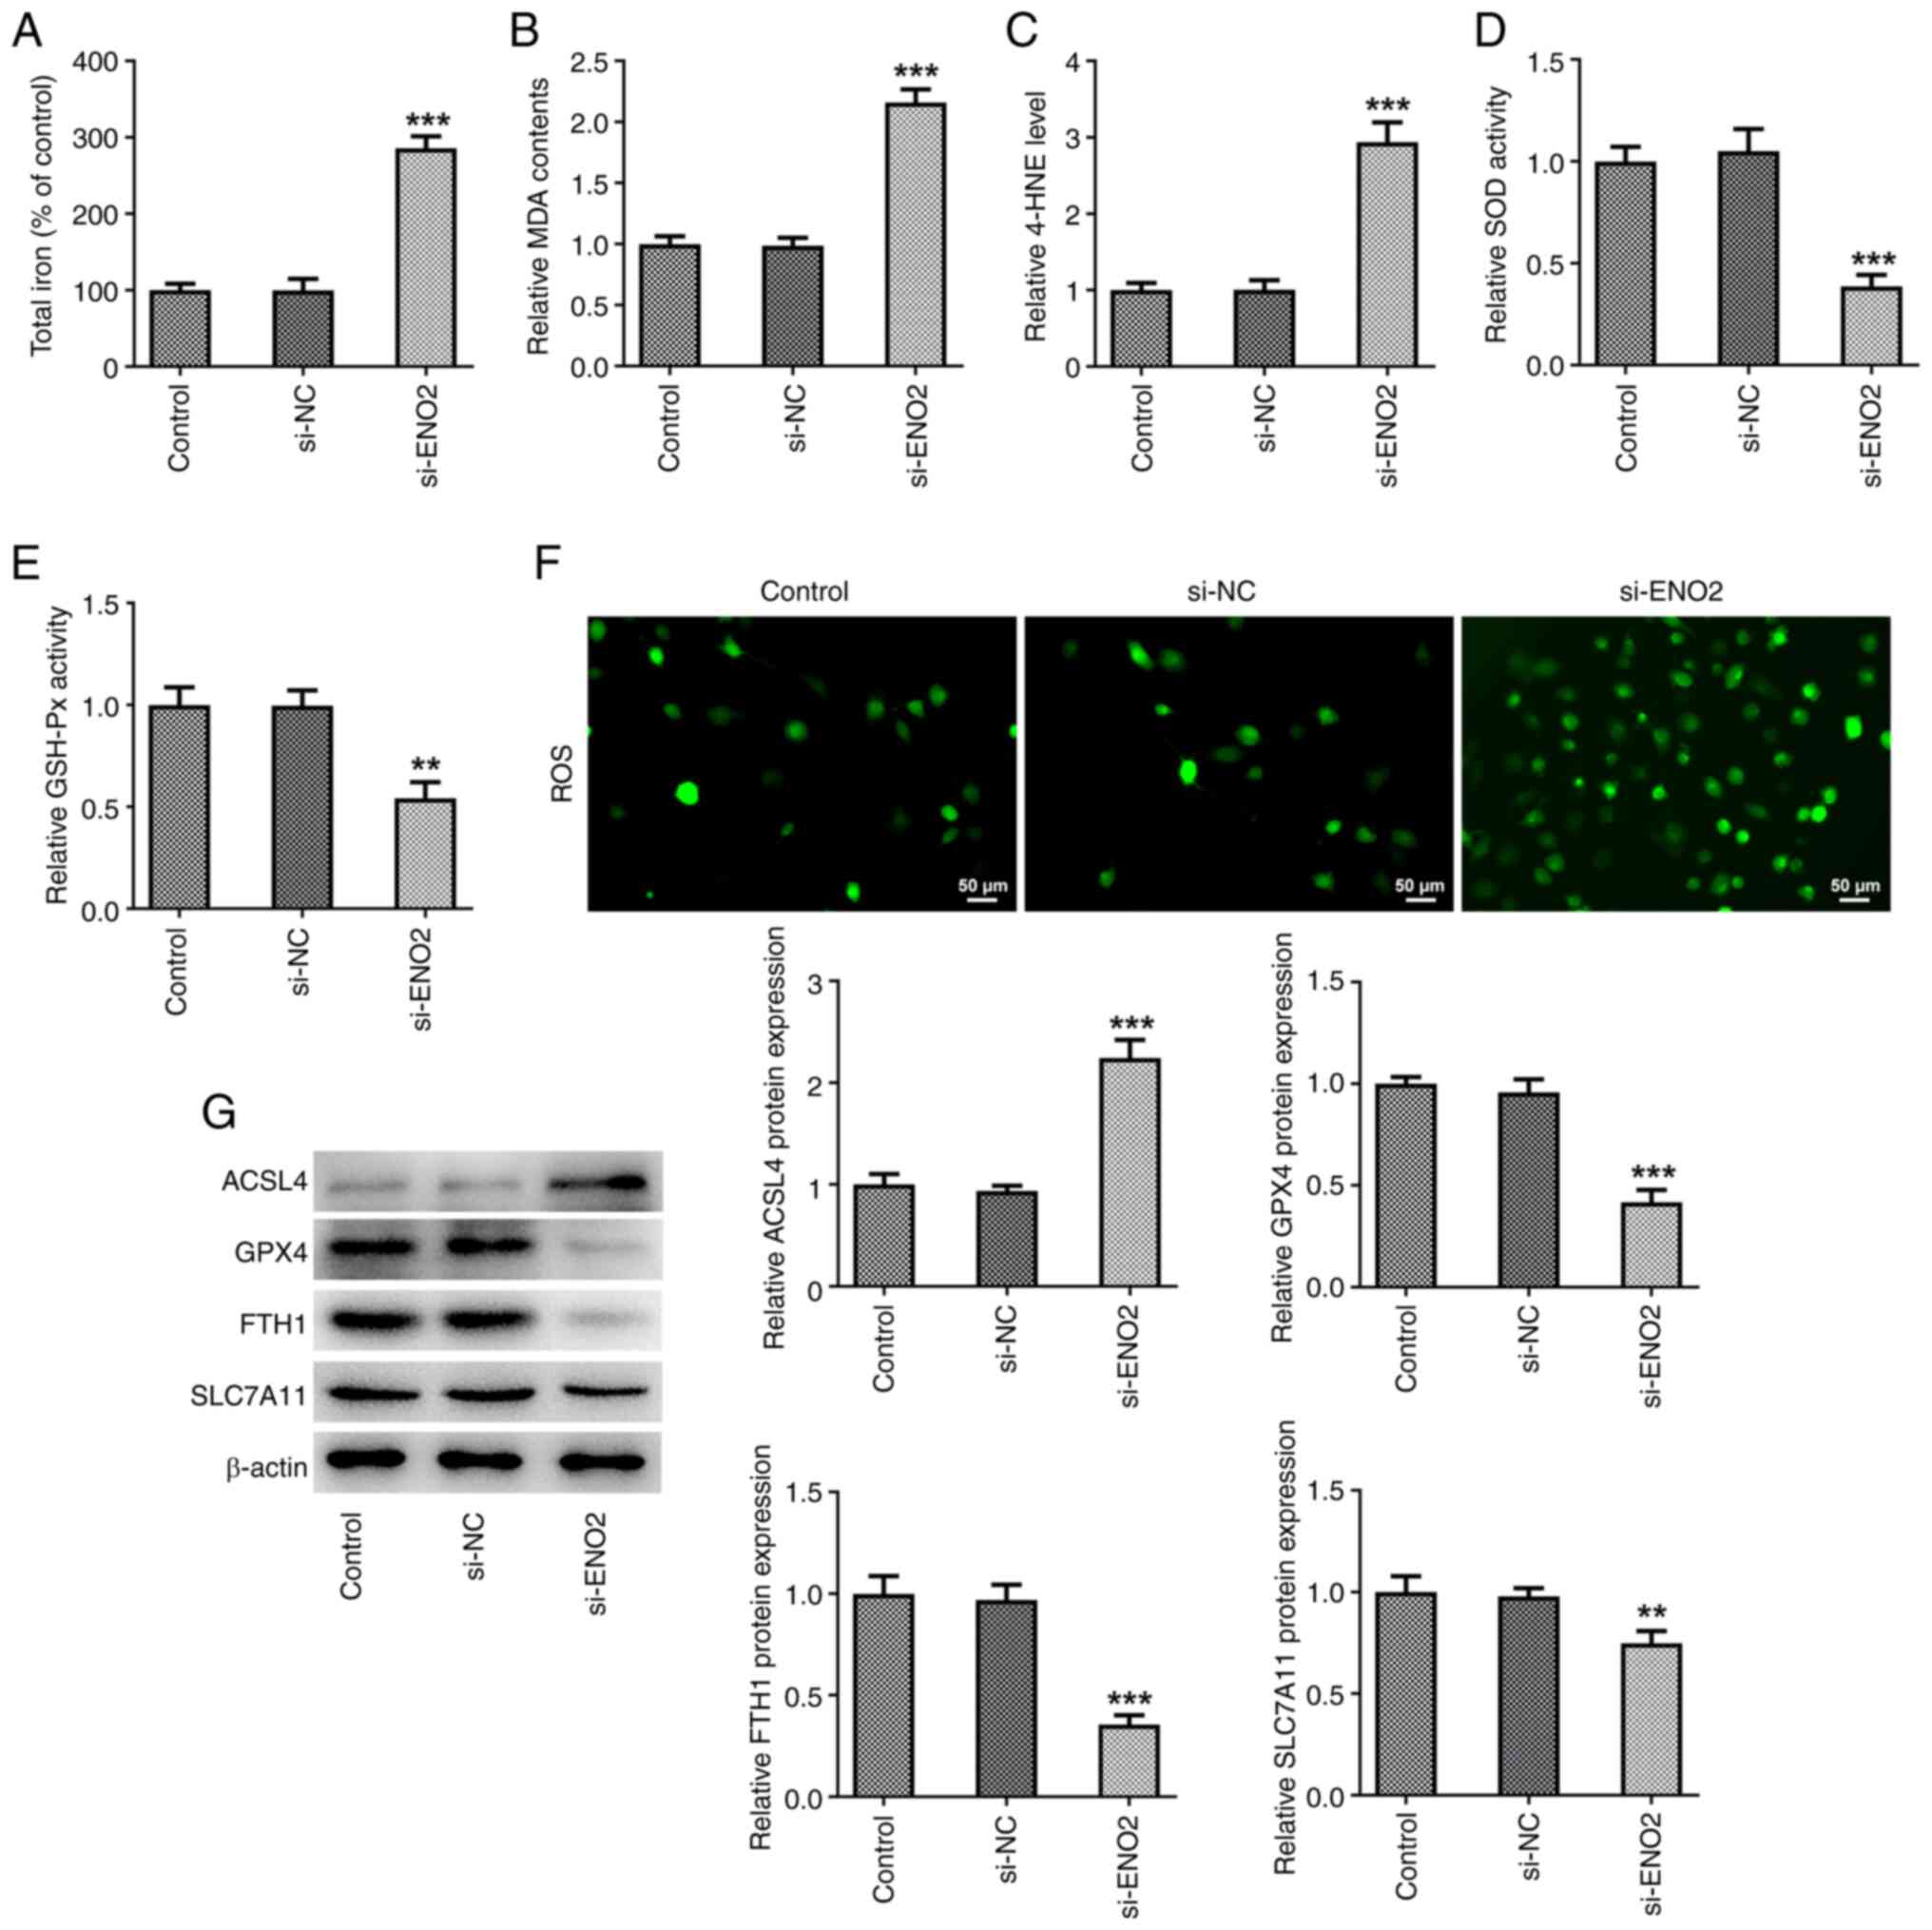 | Figure 3.Effects of ENO2 interference on
ferroptosis in clear cell renal cell carcinoma cells. (A) Total
iron levels. (B) MDA level. (C) 4-HNE level. (D) SOD activity. (E)
GSH-Px activity. (F) Intracellular reactive oxygen species levels.
(G) Protein levels of ACSL4, GPX4, FTH1 and SLC7A11 estimated
through western blotting. **P<0.01 and ***P<0.001 vs. si-NC.
Statistical significance was determined using one-way ANOVA
followed by Tukey's post hoc test. si-NC, small-interfering RNA
negative control; MDA, malonaldehyde; 4-HNE, 4-hydroxynonenal; SOD,
superoxide dismutase; GSH-Px, glutathione peroxidase; ACSL4,
ferroptosis-related proteins acyl-CoA synthetase long-chain family
member 4; GPX4, glutathione peroxidase 4; FTH1, ferritin heavy
chain 1; SLC7A11, solute carrier family 7 member 11; ENO2, enolase
2. |
ENO2 interference affects
mitochondrial function in ccRCC cells
Excessive ROS production changes the shape of
mitochondria, leading to apoptosis. Moreover, mitochondrial
membrane potential manifests normal structure and function of
mitochondria, while depolarization of membrane potential indicates
impaired mitochondrial structure and function (23,24).
Hence, in the present study, a JC-1 fluorescence probe was used to
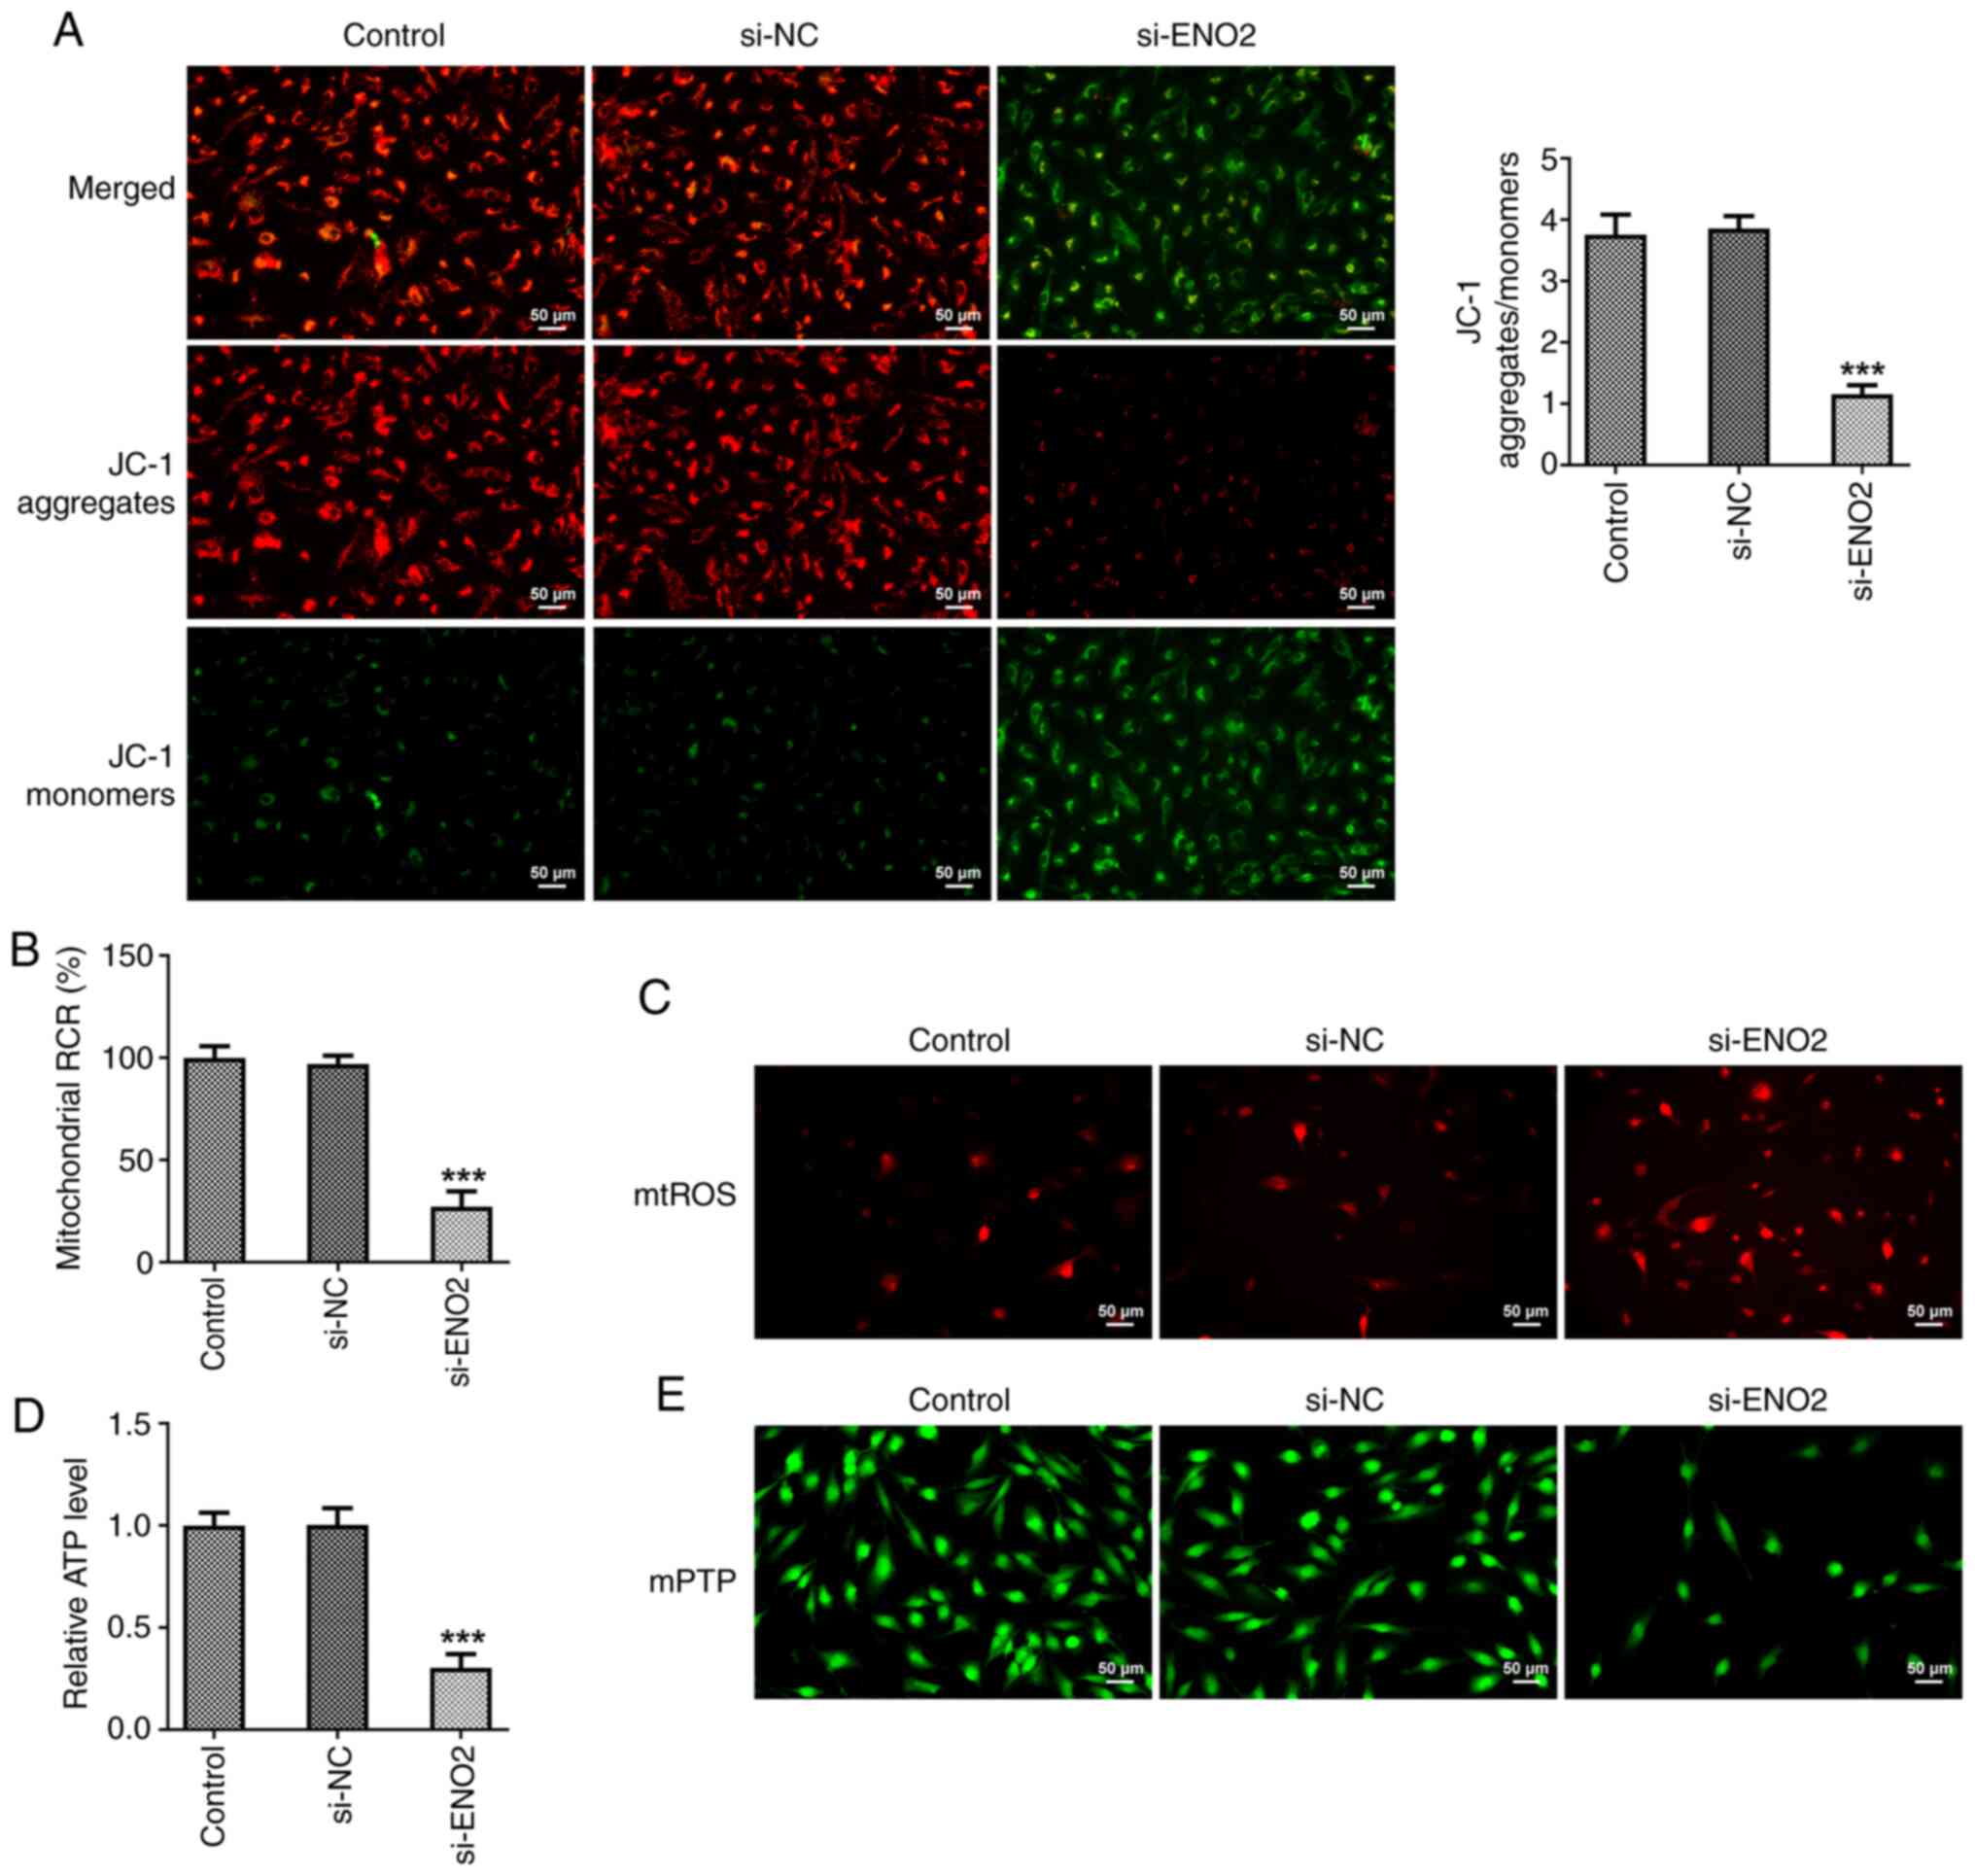
measure mitochondrial membrane potential in ccRCC cells. Compared
with the si-NC group, si-ENO2 significantly caused the
depolarization of mitochondrial membrane potential in ccRCC cells
(Fig. 4A). Furthermore, the
mitochondrial ROS content and membrane mPTP opening of ccRCC cells
were increased, while the ATP content and mitochondrial oxidative
phosphorylation capacity were decreased in ccRCC cells after
interference with ENO2 (Fig.
4B-E).
ENO2 interference affects ferroptosis
levels in ccRCC by inhibiting the glycolysis process
The aforementioned results showed that ENO2 had the
highest impact on PKM2, so it was hypothesized that ENO2 may affect
the glycolysis process through PKM2. Therefore, the PKM2 activator
DASA-58 was used to treat ccRCC cells. To further explore whether
ENO2 affects the level of ferroptosis in ccRCC cells by inhibiting
the glycolytic process, the DCFH-DA probe was used to monitor
intracellular ROS production. The results showed that adding the
glycolysis agonist DASA-58 reversed the effects of interference
with ENO2 on total iron levels and intracellular ROS, MDA and 4-HNE
levels, SOD and GSH-Px activities, as well as expression of the
ferroptosis-related proteins GPX4, FTH1, SLC7A11 and ACSL4
(Fig. 5A-G). These results
indicated that si-ENO2 affects the level of ferroptosis in ccRCC
cells by inhibiting the glycolytic process.
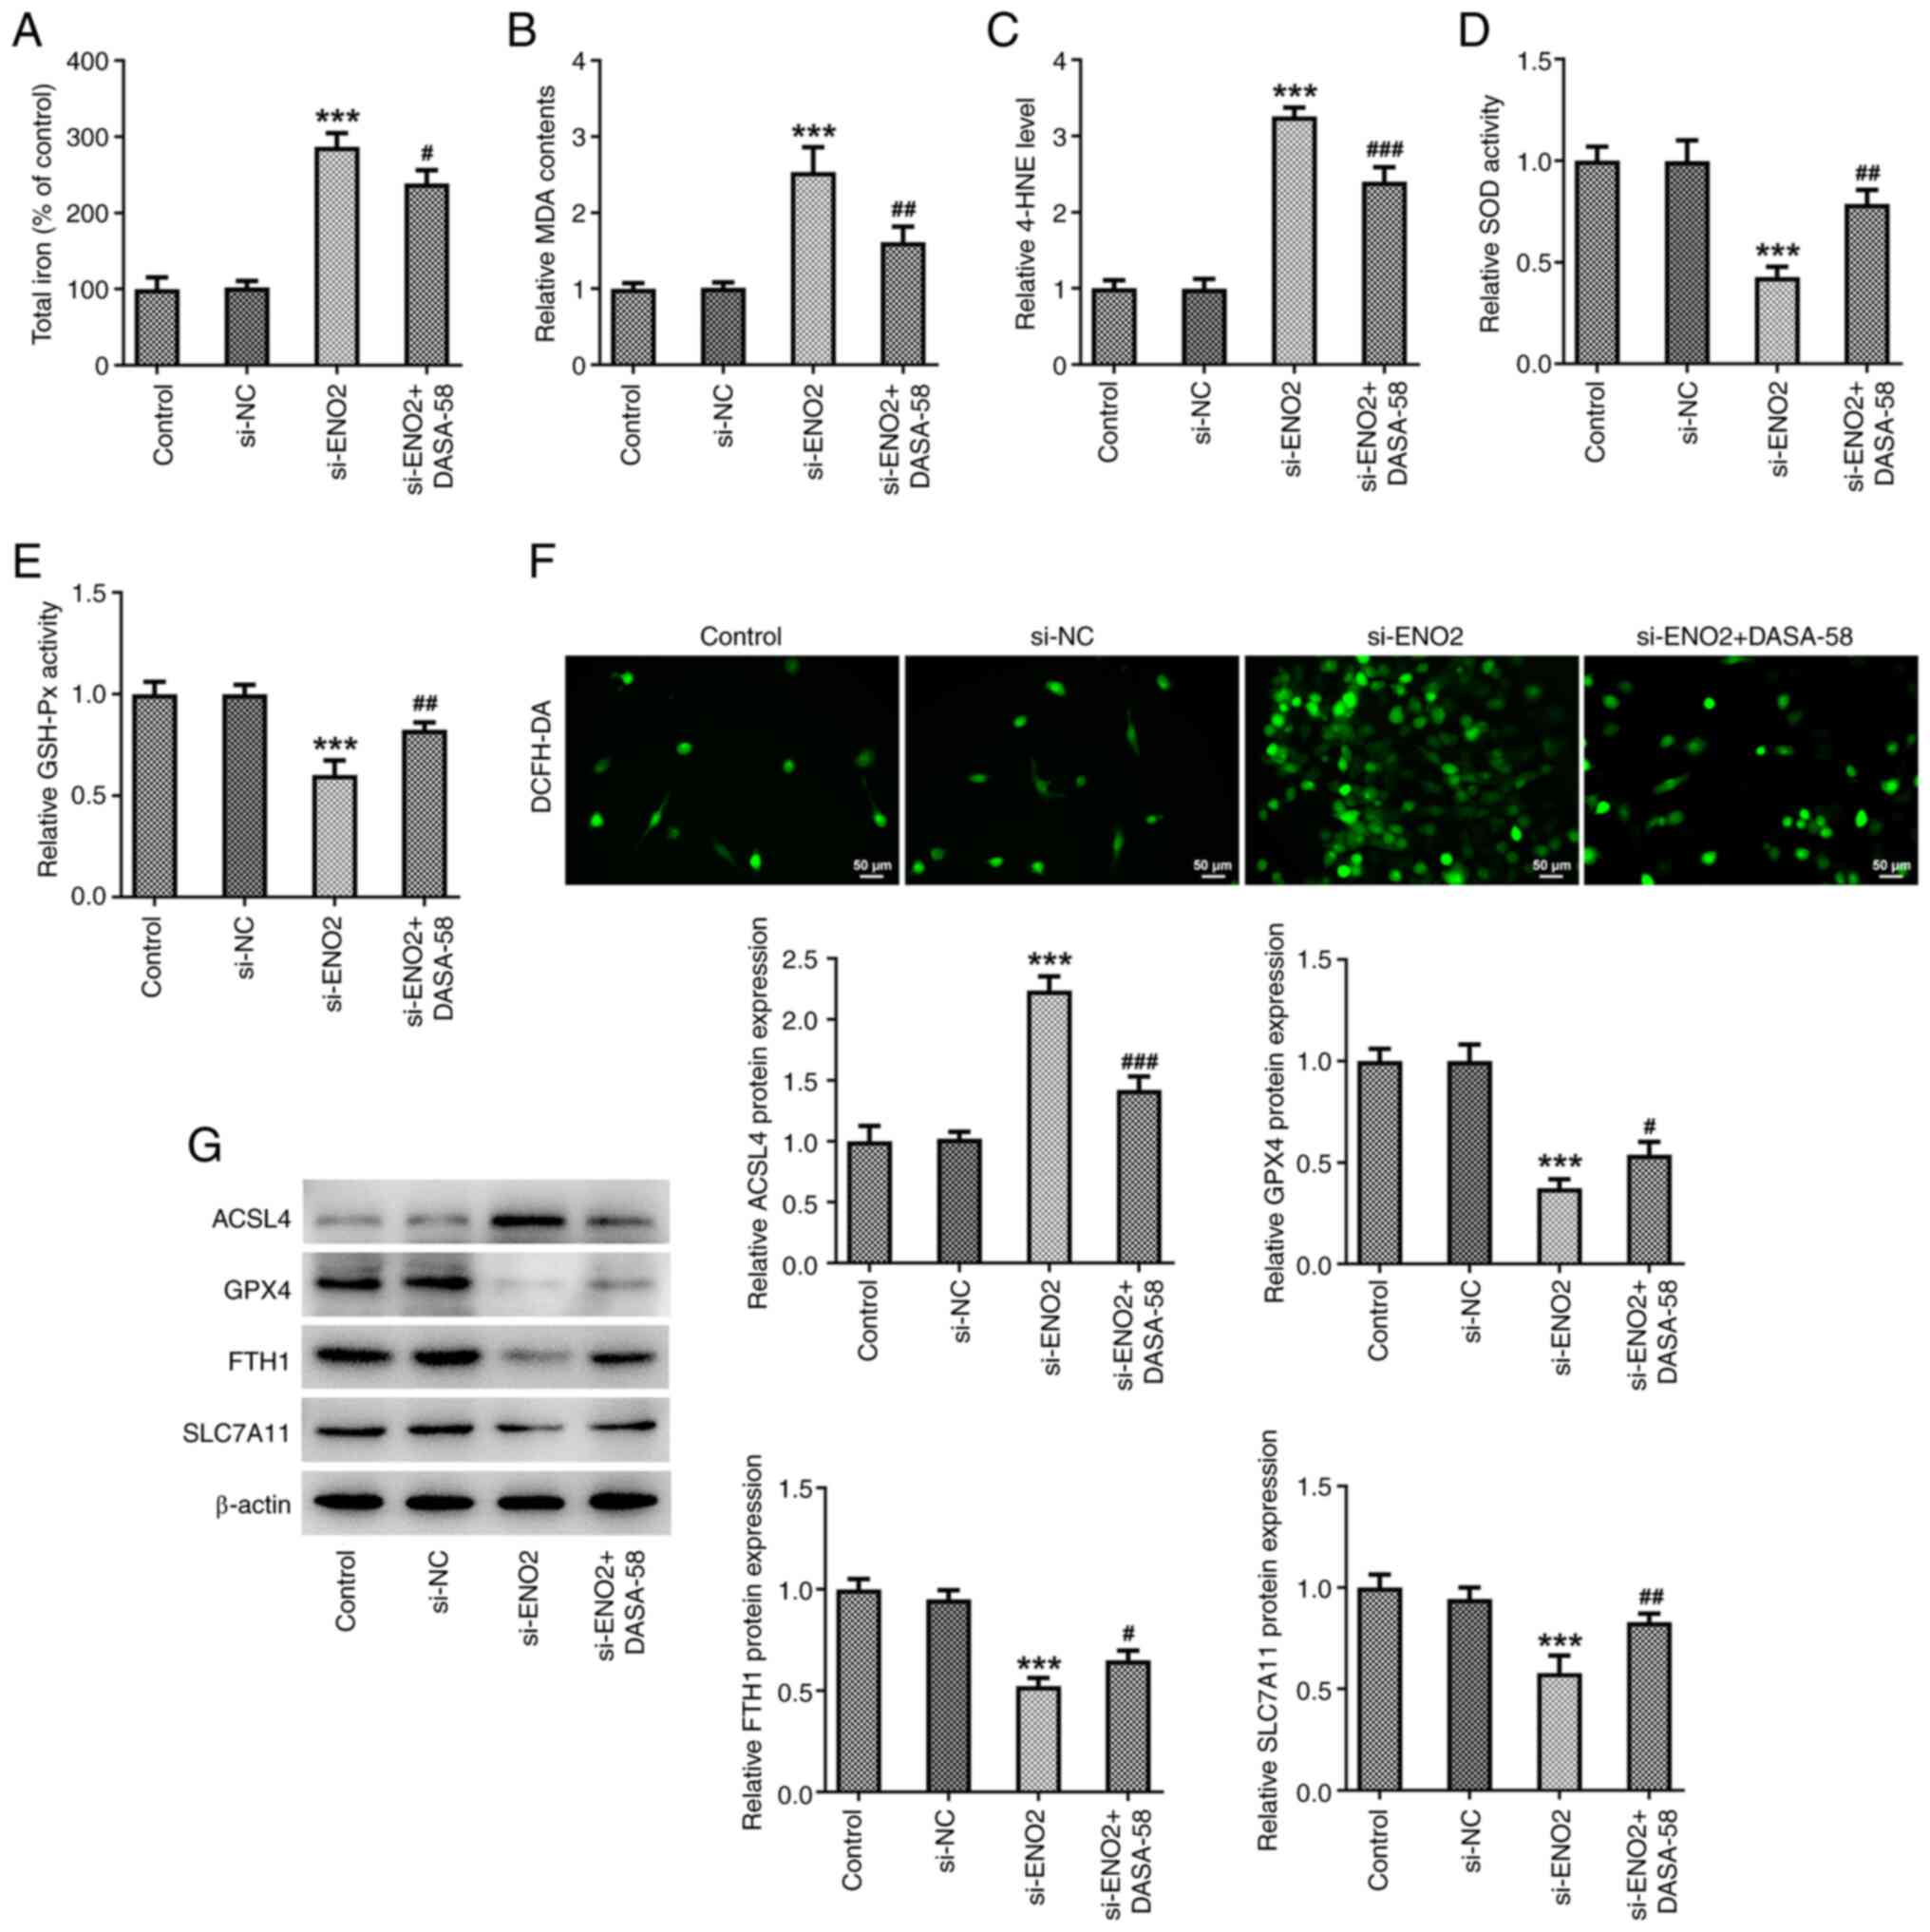 | Figure 5.ENO2 interference affects ferroptosis
levels in clear cell renal cell carcinoma cells by inhibiting the
glycolysis process. (A) Total iron levels; (B) MDS level; (C) 4-HNE
levels. (D) SOD activity; (E) GSH-Px activity. (F) Intracellular
reactive oxygen species levels. (G) Protein levels of ACSL4, GPX4,
FTH1 and SLC7A11 were estimated through western blotting.
***P<0.001 vs. si-NC, #P<0.05,
##P<0.01, ###P<0.001 vs. si-ENO2.
Statistical significance was determined using one-way ANOVA
followed by Tukey's post hoc test. si-NC, small-interfering RNA
negative control; ENO2, enolase 2; si-ENO2, small-interfering RNA
targeting ENO2; MDA, malonaldehyde; 4-HNE, 4-hydroxynonenal; SOD,
superoxide dismutase; GSH-Px, glutathione peroxidase; ACSL4,
ferroptosis-related proteins acyl-CoA synthetase long-chain family
member 4; GPX4, glutathione peroxidase 4; FTH1, ferritin heavy
chain 1; SLC7A11, solute carrier family 7 member 11. |
ENO2 interference affects ferroptosis
and glycolysis by regulating Hippo-YAP1 signaling in ccRCC
cells
To explore whether ENO2 affects ferroptosis and
glycolysis by regulating Hippo-YAP1 signaling in ccRCC cells, the
expression levels of proteins related to the Hippo-YAP1 signaling
pathway were investigated using western blotting. The results
showed that after interference with ENO2, the expression of LATS1
and YAP1 were significantly downregulated in ccRCC cells (Fig. 6A). Subsequently, to further explore
the effect of ENO2 on autophagy in ccRCC cells through the
Hippo-YAP1 signaling, an overexpression plasmid of YAP1 was
constructed, and western blotting was used to detect the expression
level of YAP1 (Fig. 6B). The
results indicated that YAP1 overexpression reversed the effects of
ENO2 interference on total iron levels, intracellular ROS, MDA and
4-HNE levels, SOD and GSH-Px activities, as well as the expression
of ferroptosis-related proteins GPX4, FTH1, SLC7A11 and ACSL4
proteins (Fig. 6C-F). These results
suggest that si-ENO2 affects ferroptosis in ccRCC cells by
regulating Hippo-YAP1 signaling. Subsequently, the effect of
si-ENO2 + OV-YAP1 on glycolysis in ccRCC cells was studied.
Compared with the si-ENO2 group, the si-ENO2 + OV-YAP1 group
significantly increased ECAR, lactic acid and glucose levels in the
culture medium by affecting Hippo-YAP1 signaling in ccRCC cells
(Fig. 7A-C). Western blotting
results also showed that the expression of GLUT1, HK2 and PKM2 were
significantly increased in the si-ENO2 + OV-YAP1 group (Fig. 7D).
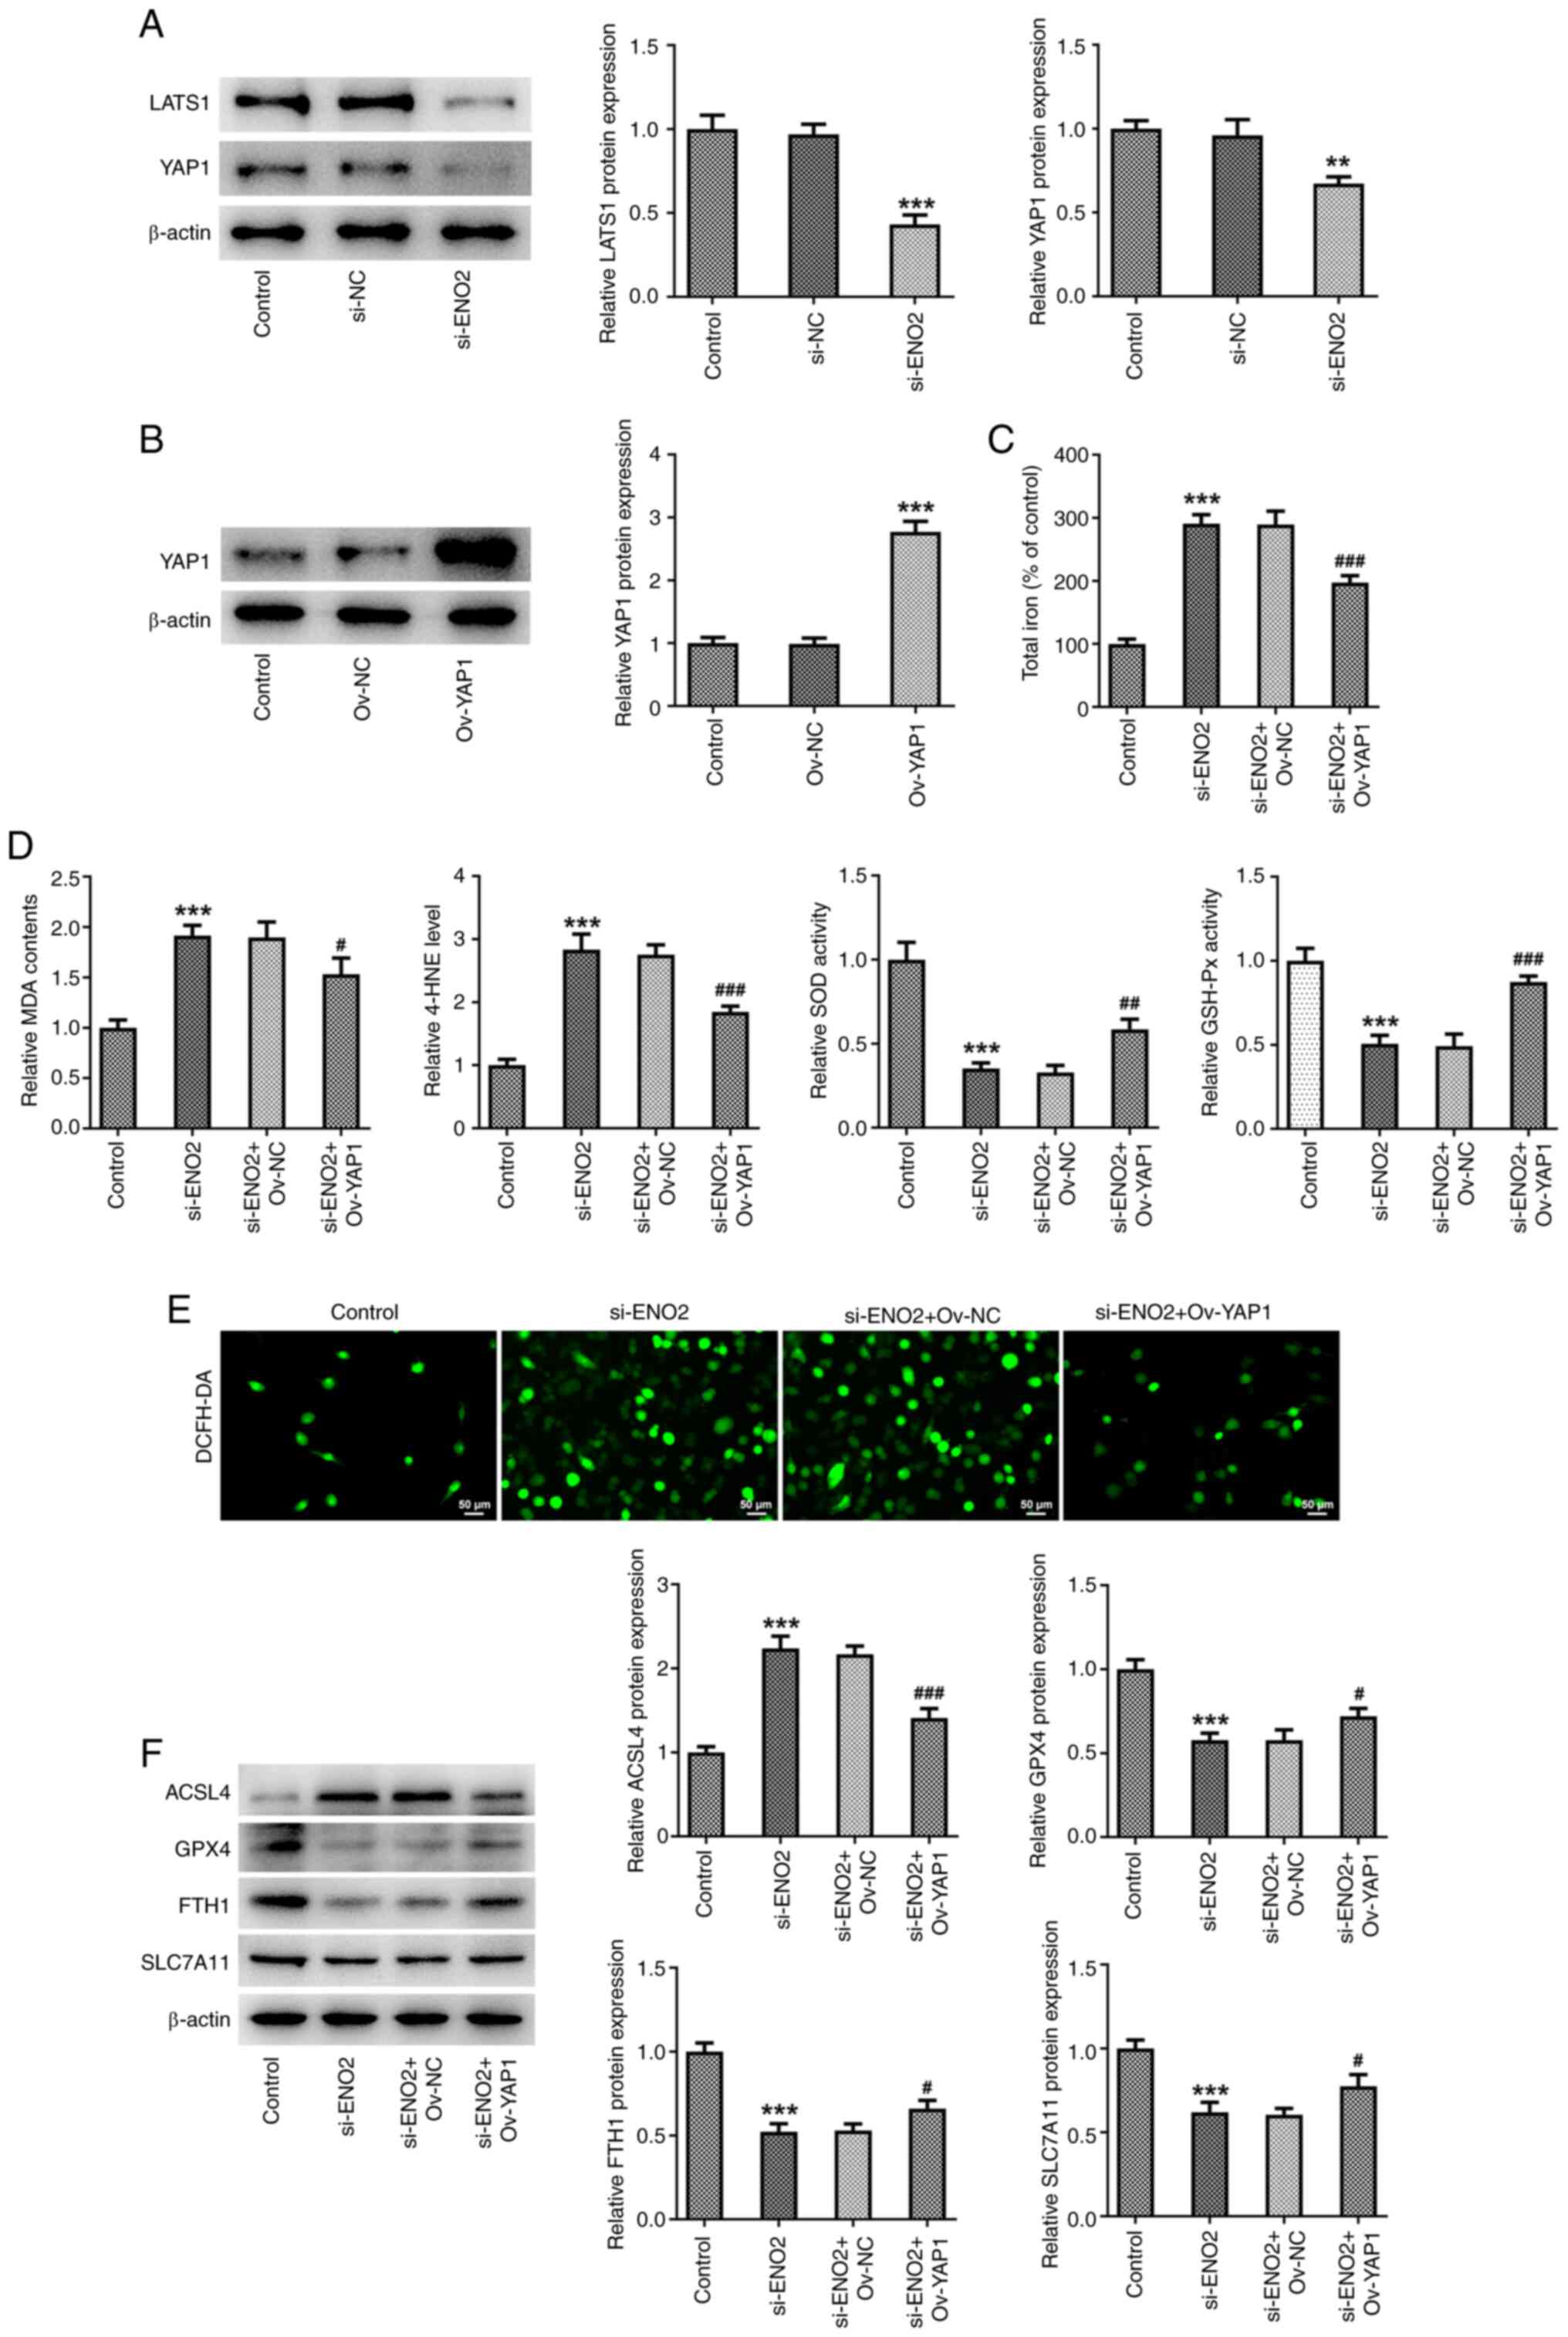 | Figure 6.Effects of interference with ENO2 on
ferroptosis through regulating Hippo-YAP1 signaling in ccRCC cells.
(A) Protein levels of YAP1 and LATS1 were estimated by western
blotting. (B) Protein levels of YAP1 were estimated by western
blotting. (C) Total iron levels. (D) MDA, 4-HNE, SOD and GSH-Px
levels. (E) Intracellular ROS levels. (F) Protein levels of
ferroptosis-related proteins ACSL4, GPX4, FTH1 and SLC7A11 were
estimated by western blotting. **P<0.01, ***P<0.001 vs.
control, #P<0.05, ##P<0.01,
###P<0.001 vs. si-ENO2+Ov-YAP1. Statistical
significance was determined using one-way ANOVA followed by Tukey's
post hoc test. si-NC, small-interfering RNA negative control; ENO2,
enolase 2; si-ENO2, small-interfering RNA targeting ENO2; ccRCC,
clear cell renal cell carcinoma; MDA, malonaldehyde; 4-HNE,
4-hydroxynonenal; SOD, superoxide dismutase; GSH-Px, glutathione
peroxidase; ACSL4, ferroptosis-related proteins acyl-CoA synthetase
long-chain family member 4; GPX4, glutathione peroxidase 4; FTH1,
ferritin heavy chain 1; SLC7A11, solute carrier family 7 member 11;
ROS, reactive oxygen species; YAP1, yes-associated protein 1;
LATS1, large tumor suppressor kinase 1; Ov, overexpression. |
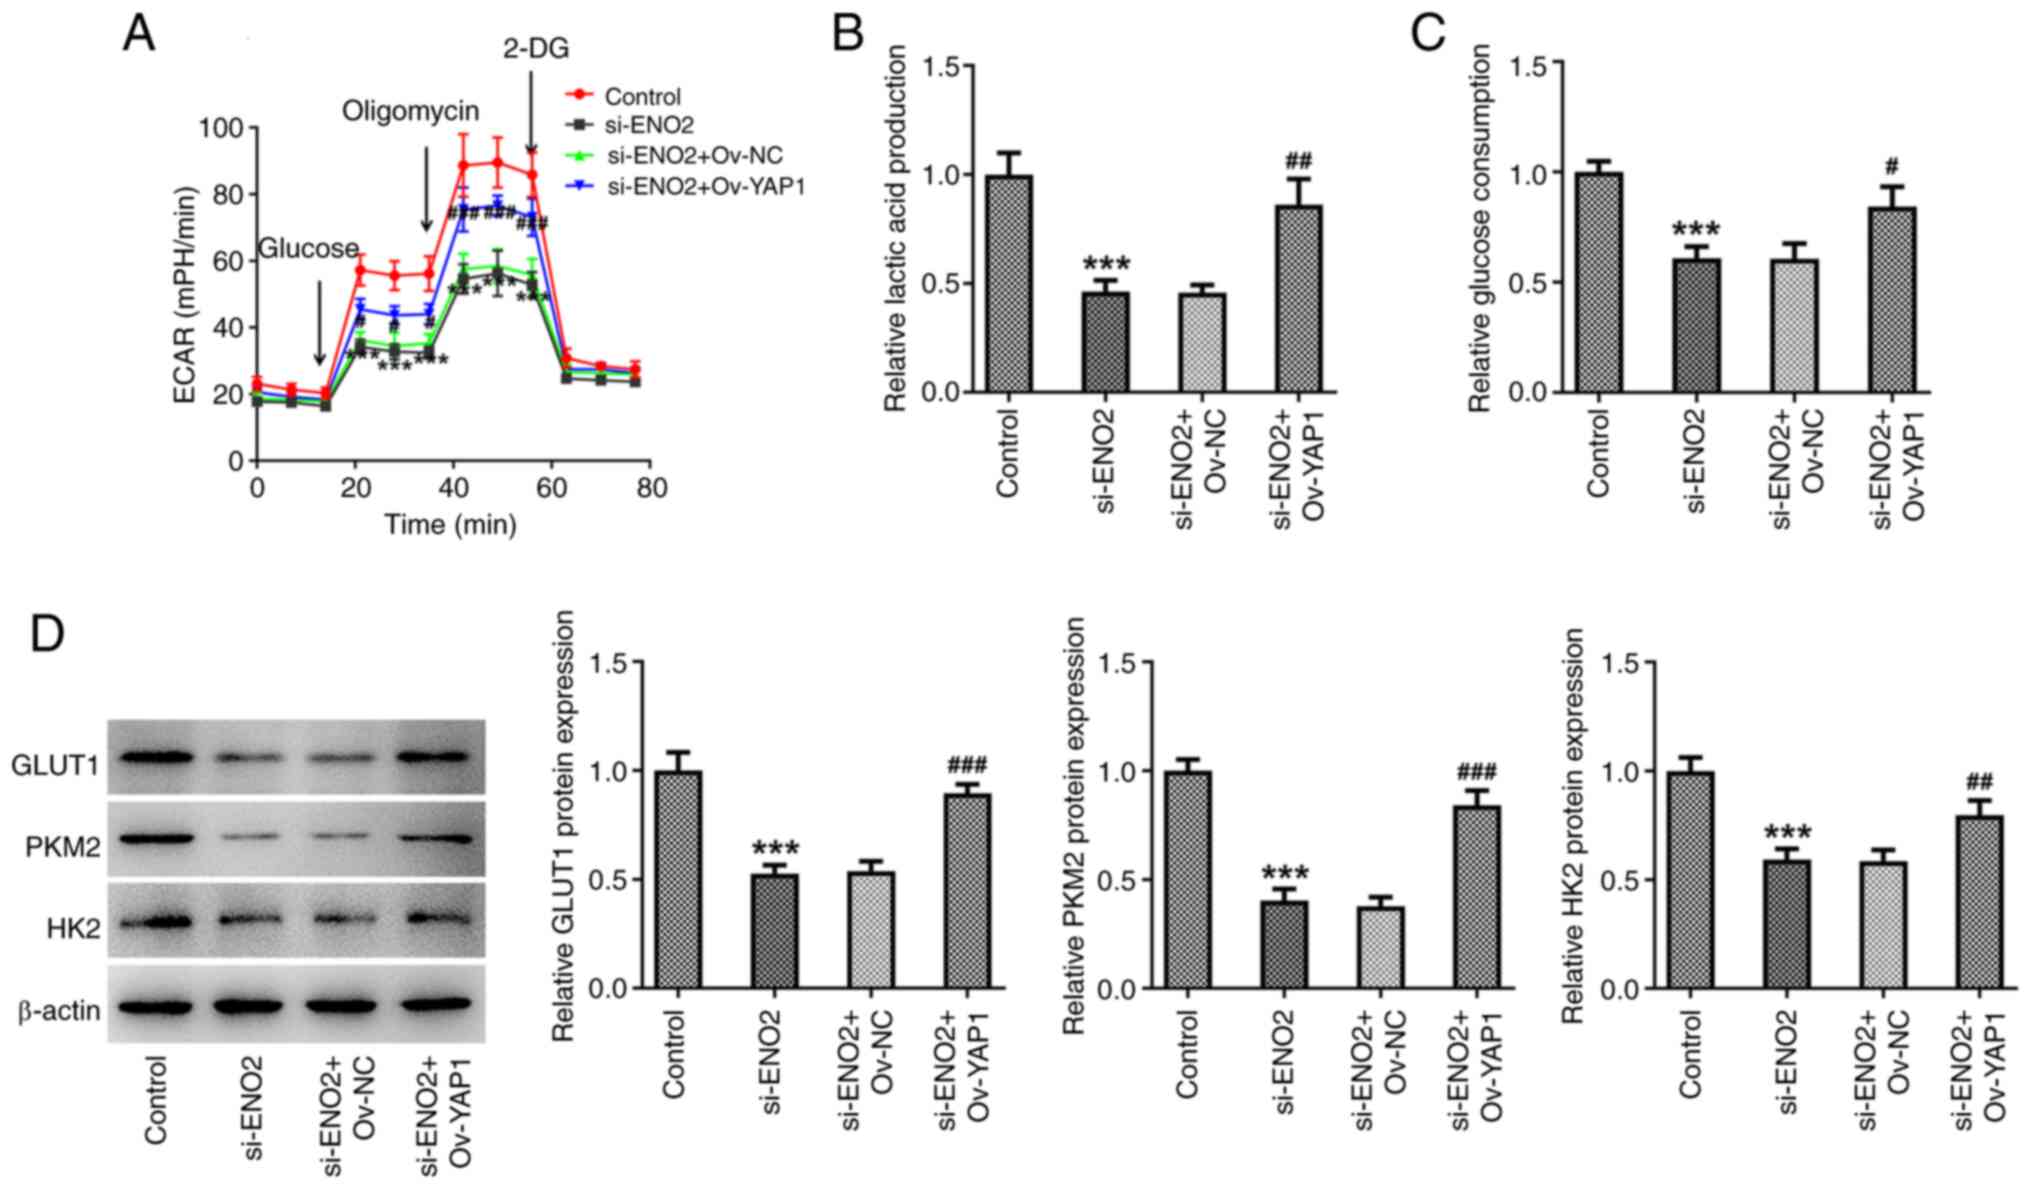 | Figure 7.Effects of interference with ENO2 on
glycolysis through regulating Hippo-YAP1 signaling in ccRCC cells.
(A) ECAR assessment. (B) Levels of lactic acid. (C) Levels of
glucose. (D) Protein levels of GLUT1, PKM2 and HK2 estimated by
western blotting. ***P<0.001 vs. control, #P<0.05,
##P<0.01, ###P<0.001 vs.
si-ENO2+Ov-YAP1. Statistical significance was determined using
one-way ANOVA followed by Tukey's post hoc test. si-NC,
small-interfering RNA negative control; ENO2, enolase 2; si-ENO2,
small-interfering RNA targeting ENO2; YAP1, yes-associated protein
1; ccRCC, clear cell renal cell carcinoma; ECAR, extracellular
acidification rate; GLUT1, glucose transporter 1; PKM2, pyruvate
kinase muscle isozyme M2; HK2, hexokinase 2; Ov,
overexpression. |
Interference with ENO2 affects
mitochondrial function by regulating Hippo-YAP1 signaling in ccRCC
cells
The probe JC-1 is a sensitive fluorescent dye used
to detect changes in mitochondrial membrane potential. Moreover, a
change in JC-1 fluorescence emission from red to green indicates
depolarization of the mitochondrial membrane. Further experiments
in the present study showed that compared with interference with
ENO2, the depolarization of the mitochondrial membrane potential in
the si-ENO2+OV-YAP1 group was significantly improved (Fig. 8A). In addition, compared with
interference with ENO2, the mitochondrial ROS content and membrane
mPTP opening of ccRCC cells in the si-ENO2+OV-YAP1 group were
reduced, while the ATP content and mitochondrial oxidative
phosphorylation capacity were increased (Fig. 8B-E). These results demonstrated that
interference with ENO2 affected mitochondrial function by
modulating Hippo-YAP1 signaling in ccRCC cells.
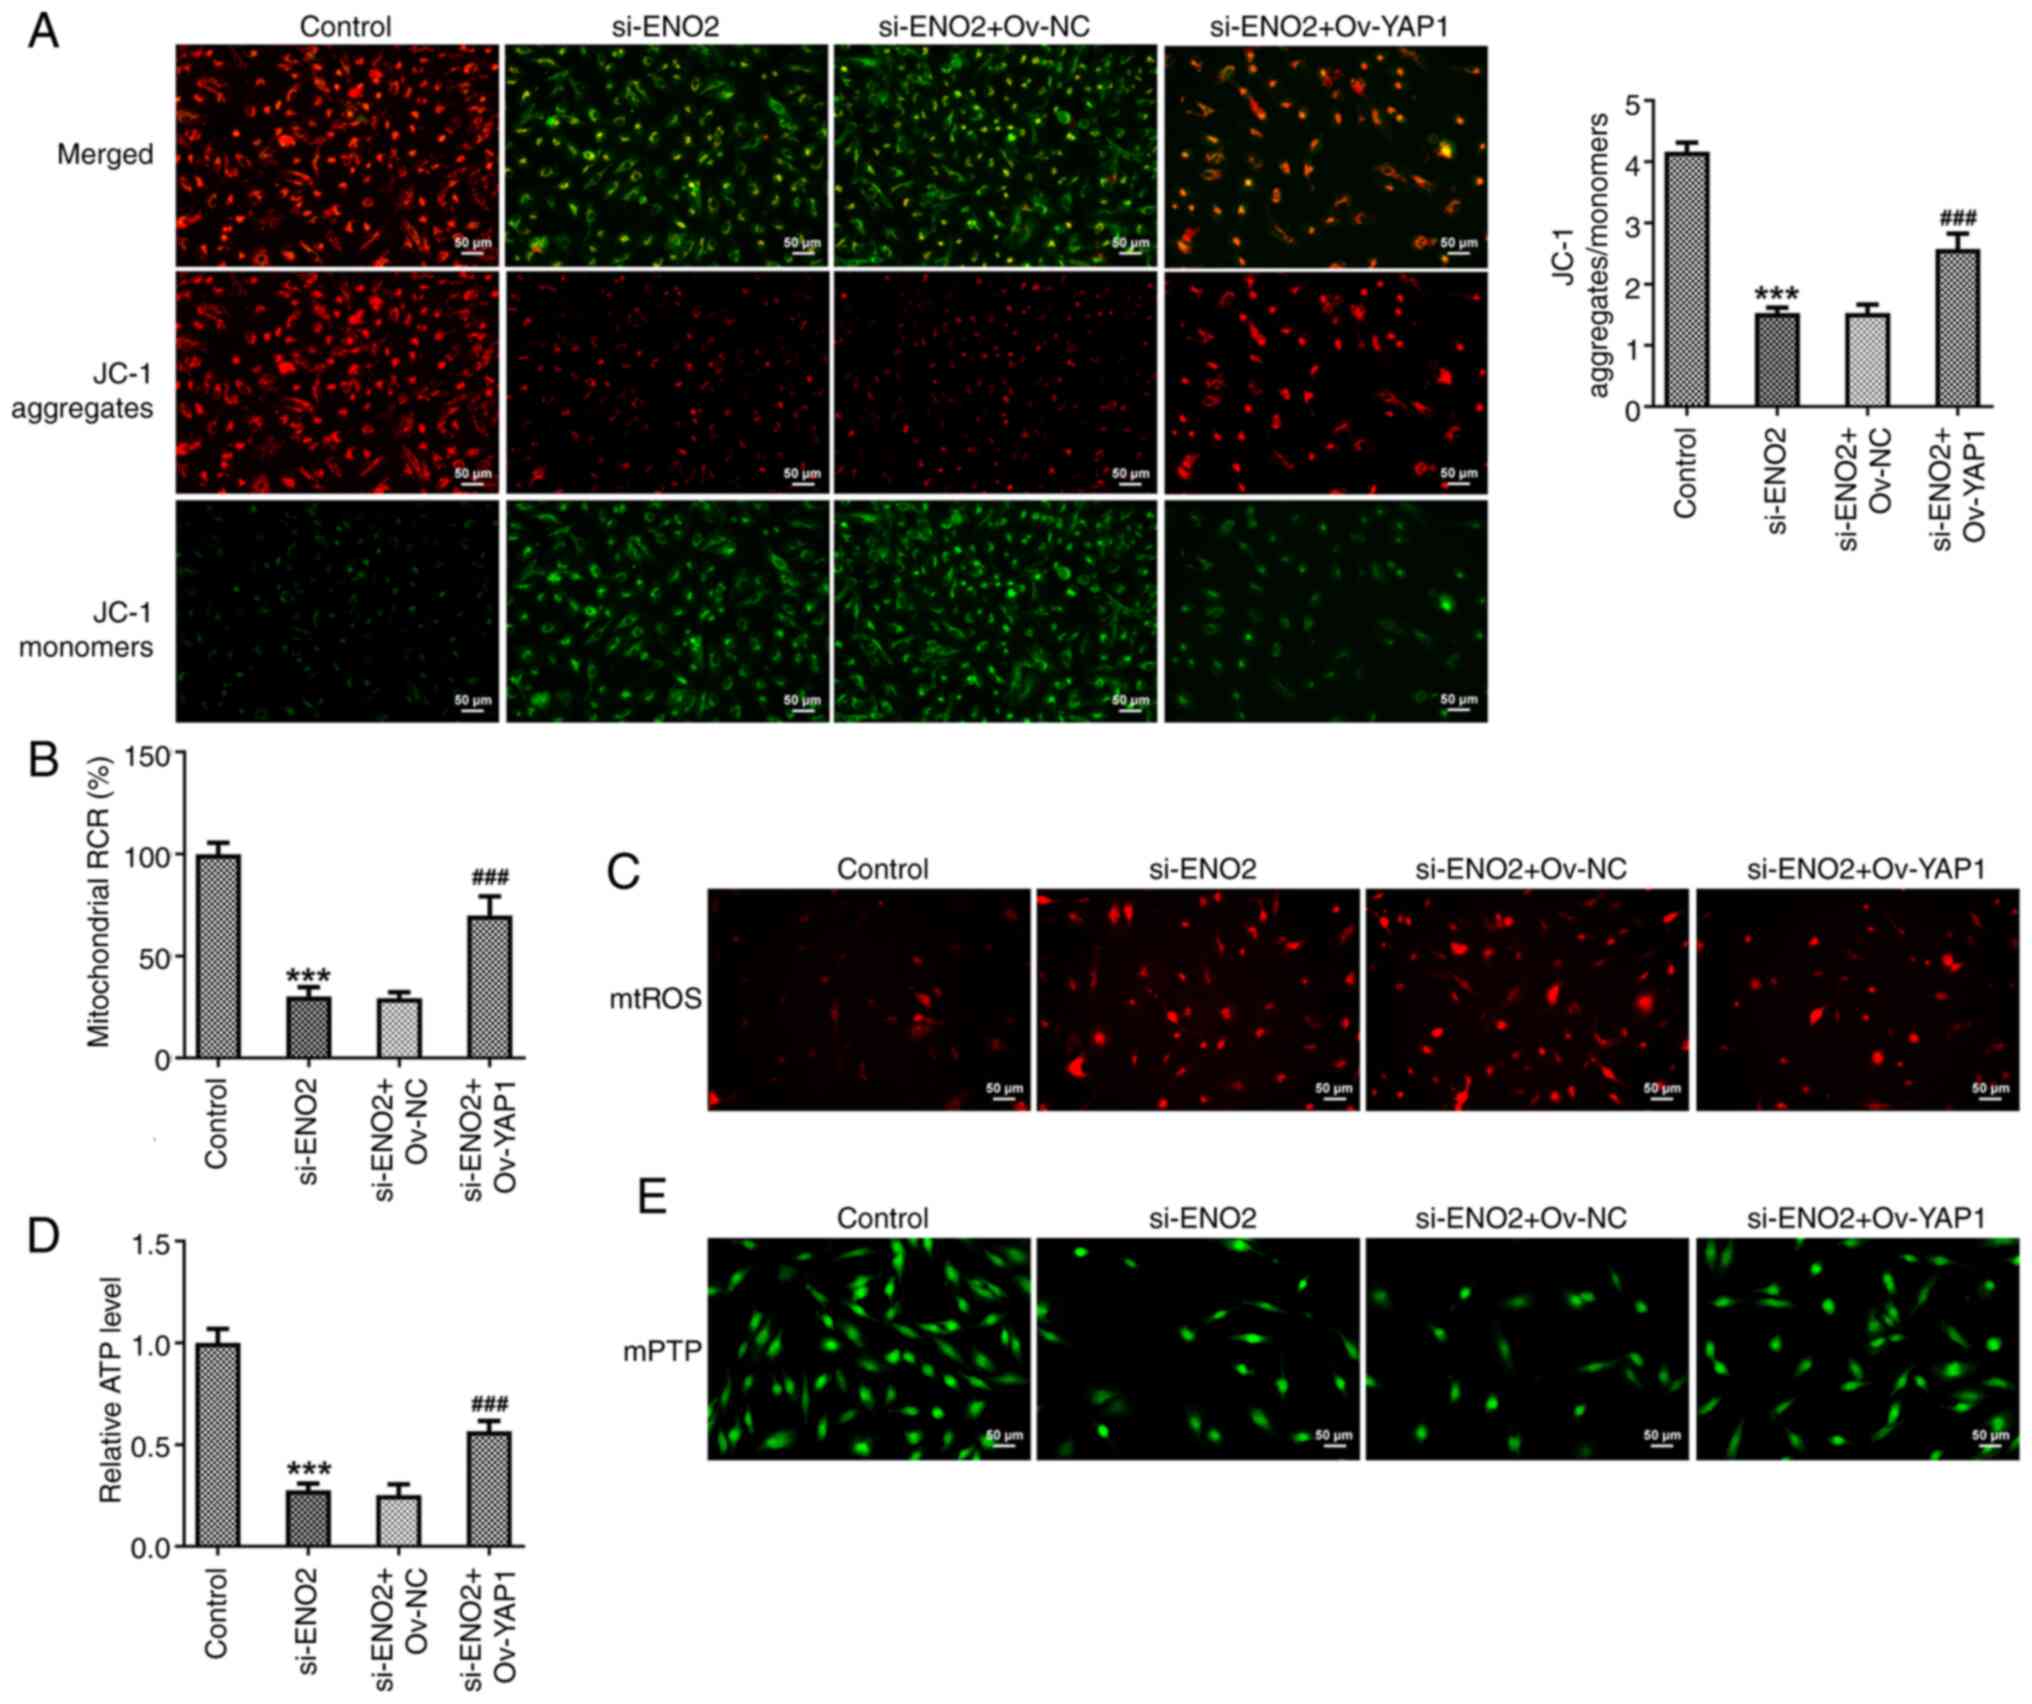 | Figure 8.Effects of interference with ENO2 on
mitochondrial function through regulating Hippo-YAP1 signaling in
ccRCC cells. (A) Mitochondrial membrane potential was detected
using a JC-1 fluorescence probe. (B) Capacity of mitochondrial
oxidative phosphorylation. (C) mtROS content. (D) ATP content. (E)
The opening of mitochondrial membrane mPTP. ***P<0.001 vs.
control, ###P<0.001 vs. si-ENO2+Ov-YAP1. Statistical
significance was determined using one-way ANOVA followed by Tukey's
post hoc test. si-NC, small-interfering RNA negative control; ENO2,
enolase 2; si-ENO2, small-interfering RNA targeting ENO2; YAP1,
yes-associated protein 1; ccRCC, clear cell renal cell carcinoma;
Ov, overexpression; mtROS, mitochondrial reactive oxygen species;
mPTP, mitochondrial permeability transition pore; RCR, respiratory
control ratio. |
Discussion
Tumor cells manifest aberrant metabolism
characterized by excessive glycolysis even in the presence of
sufficient amounts of oxygen. This phenomenon, also known as
aerobic glycolysis or Warburg effect, promotes cancer growth with
accelerated glucose uptake and lactic acid production (25,26).
Glycolysis is quite crucial in cancer, and cancer cells exhibit
elevated expression of key enzymes (including GLUT1, PKM2 and HK2)
involved in the process of glycolysis to lead to increased amounts
of energy. Furthermore, cancer cells can produce energy via
fermentation of lactic acid, a product of glycolysis (27). Glycolytic genes and the Warburg
effect have been studied in bladder, breast, gastric, liver and
prostate cancer (28–31). Previous research demonstrated that
the Warburg effect is more noticeable in ccRCC than in other tumors
(32). Metabolic profiling-based
studies showed that ccRCC manifests as increased metabolite levels
during glycolysis and decreased metabolite levels during oxidative
phosphorylation, indicating that glycolysis is active in ccRCC
(33–35). Hence, the present study investigated
the expression of glycolysis-related genes in ccRCC cell lines to
identify biomarkers that can predict disease prognosis.
ENO2 is a critical gene in glycolysis that can
stimulate cell growth, upregulate glycolysis-related genes and
initiate the Akt signaling pathway by phosphorylation of glycogen
synthase kinase 3β, thereby inducing cell proliferation and
glycolysis (14). Increased ENO2
expression is found in various tumors. High expression of ENO2 in
glioma and colorectal cancer is linked to glycolysis in tumor cells
(36,37). Increased ENO2 expression stimulates
glycolysis in gastric cancer cells, contributing to tumor growth
and liver metastasis (38).
Regarding the Warburg effect in ccRCC, previous research proposed
that ENO2 expression is notably increased in tissue and serum of
patients with ccRCC (39,40). Additionally, elevated serum ENO2
levels are associated with clinical stage, tumor grade and disease
recurrence. Thus, ENO2 is a potential biomarker for ccRCC prognosis
(41,42). The present data showed that ENO2
expression was more prominent in ccRCC cell lines compared with
that in HK-2 normal human renal tubular epithelial cell lines.
Furthermore, the levels of ECAR, lactic acid and glucose in the
Caki-1 cells culture medium were significantly reduced. Moreover,
western blotting showed that the expression of GLUT1, HK2 and PKM2
was decreased in the si-ENO2 Caki-1 cells group. Thus, ENO2 served
a critical function in inhibiting glycolysis of ccRCC cells, which
is consistent with previous research (37).
Previous studies reported that ferroptosis exerts a
crucial role in ischemic organ damage, neurodegenerative diseases
and tumor cell death (43,44). Furthermore, recent research
suggested that ferroptosis is considered a targeted susceptibility
and exerts tumor suppressor effects by killing tumor cells in ccRCC
(45,46). Thus, triggering ferroptosis could be
a novel promising strategy for treating cancers. The present study
also revealed that total iron levels, intracellular ROS, MDA and
4-HNE levels, and the protein expression of ACSL4 were
significantly increased, while SOD and GSH-Px activities and the
protein expression of GPX4, FTH1 and SLC7A11 were significantly
decreased after interference with ENO2 in ccRCC cells. These
results suggested that ENO2 interference induced ferroptosis in
ccRCC cells. Moreover, iron overload causes cardiac mitochondrial
dysfunction as indicated by increased mitochondrial ROS levels and
mitochondrial membrane potential depolarization (47). Additionally, mitochondria are
essential organelles in cells and closely linked to ferroptosis in
recent studies (48,49). The present study suggested that the
interference of ENO2 caused the depolarization of mitochondrial
membrane potential, increased mitochondrial ROS content, decreased
ATP content and induced ROS accumulation, thereby disrupting
mitochondrial function in ccRCC cells. Since the current study
showed that ENO2 has the greatest impact on PKM2, it was further
explored whether ENO2 affects glycolysis through PKM2, thereby
affecting the level of ferroptosis in ccRCC cells. DASA-58, a
highly specific small-molecule PKM2 activator, leads to a decrease
in glycolytic and pentose phosphate pathway intermediates by
activating the enzyme (50).
Furthermore, PKM2 is directly involved in the metabolic
reprogramming (aerobic glycolysis) associated with cancer and the
inflammatory response (51–53). The present results indicated that
ENO2 interference affected the level of ferroptosis in ccRCC cells
by inhibiting the glycolytic process. A recent study demonstrated
that ENO2 inhibited the activation of the Hippo-YAP1 pathway,
thereby inducing ferroptosis in small-cell lung cancer cells
(20). It was shown that
interference of ENO2 could modulate Hippo-YAP1 signaling in ccRCC
cells. In addition, interference of ENO2 affects ferroptosis,
glycolysis and mitochondrial function by regulating Hippo-YAP1
signaling in ccRCC cells.
The current study has a certain limitation that
should be acknowledged; it lacks further validation of the use of
ferroptosis inhibitors when conducting ferroptosis studies.
Therefore, it is crucial to use ferroptosis to further verify the
in-depth mechanisms of ENO2 interference affecting ferroptosis
levels in ccRCC.
Collectively, the present study demonstrates that
ENO2 is expressed at high levels in ccRCC cells, and interference
of ENO2 inhibits glycolysis, promotes ferroptosis levels and
affects mitochondrial function by regulating Hippo-YAP1 signaling
in ccRCC cells.
Acknowledgements
Not applicable.
Funding
Funding: No funding was received.
Availability of data and materials
The data generated in the present study may be
requested from the corresponding author.
Authors' contributions
HL and XL conceived and designed the study. YW
acquired and interpreted the data. HL was a major contributor in
writing the manuscript. YM collected and analyzed the data. HL, XL
and YM confirm the authenticity of all the raw data. All authors
read and approved the final version of the manuscript.
Ethics approval and consent to
participate
Not applicable.
Patient consent for publication
Not applicable.
Competing interests
The authors declare that they have no competing
interests.
References
|
1
|
Bray F, Ferlay J, Soerjomataram I, Siegel
RL, Torre LA and Jemal A: Global cancer statistics 2018: GLOBOCAN
estimates of incidence and mortality worldwide for 36 cancers in
185 countries. CA Cancer J Clin. 68:394–424. 2018. View Article : Google Scholar : PubMed/NCBI
|
|
2
|
Motzer RJ, Bacik J and Mazumdar M:
Prognostic factors for survival of patients with stage IV renal
cell carcinoma: Memorial sloan-kettering cancer center experience.
Clin Cancer Res. 10:6302S–6303S. 2004. View Article : Google Scholar : PubMed/NCBI
|
|
3
|
Jonasch E, Gao J and Rathmell WK: Renal
cell carcinoma. BMJ. 349:g47972014. View Article : Google Scholar : PubMed/NCBI
|
|
4
|
Pavlova NN and Thompson CB: The emerging
hallmarks of cancer metabolism. Cell Metab. 23:27–47. 2016.
View Article : Google Scholar : PubMed/NCBI
|
|
5
|
Miranda-Galvis M and Teng Y: Targeting
Hypoxia-driven metabolic reprogramming to constrain tumor
progression and metastasis. Int J Mol Sci. 21:54872020. View Article : Google Scholar : PubMed/NCBI
|
|
6
|
Zhang Y, Chen M, Liu M, Xu Y and Wu G:
Glycolysis-related genes serve as potential prognostic biomarkers
in clear cell renal cell carcinoma. Oxid Med Cell Longev.
2021:66998082021.PubMed/NCBI
|
|
7
|
Tang B, Yan R, Zhu J, Cheng S, Kong C,
Chen W, Fang S, Wang Y, Yang Y, Qiu R, et al: Integrative analysis
of the molecular mechanisms, immunological features and
immunotherapy response of ferroptosis regulators across 33 cancer
types. Int J Biol Sci. 18:180–198. 2022. View Article : Google Scholar : PubMed/NCBI
|
|
8
|
Torti SV and Torti FM: Iron and cancer:
2020 Vision. Cancer Res. 80:5435–5448. 2020. View Article : Google Scholar : PubMed/NCBI
|
|
9
|
Dixon SJ, Lemberg KM, Lamprecht MR, Skouta
R, Zaitsev EM, Gleason CE, Patel DN, Bauer AJ, Cantley AM, Yang WS,
et al: Ferroptosis: An iron-dependent form of nonapoptotic cell
death. Cell. 149:1060–1072. 2012. View Article : Google Scholar : PubMed/NCBI
|
|
10
|
Hao J, Chen Q, Feng Y, Jiang Q, Sun H,
Deng B, Huang X, Guan J, Chen Q, Liu X, et al: Combination
treatment with FAAH inhibitors/URB597 and ferroptosis inducers
significantly decreases the growth and metastasis of renal cell
carcinoma cells via the PI3K-AKT signaling pathway. Cell Death Dis.
14:2472023. View Article : Google Scholar : PubMed/NCBI
|
|
11
|
Reed GH, Poyner RR, Larsen TM, Wedekind JE
and Rayment I: Structural and mechanistic studies of enolase. Curr
Opin Struct Biol. 6:736–743. 1996. View Article : Google Scholar : PubMed/NCBI
|
|
12
|
Zheng Y, Wu C, Yang J, Zhao Y, Jia H, Xue
M, Xu D, Yang F, Fu D, Wang C, et al: Insulin-like growth factor
1-induced enolase 2 deacetylation by HDAC3 promotes metastasis of
pancreatic cancer. Signal Transduct Target Ther. 5:532020.
View Article : Google Scholar : PubMed/NCBI
|
|
13
|
Marangos PJ, Parma AM and Goodwin FK:
Functional properties of neuronal and glial isoenzymes of brain
enolase. J Neurochem. 31:727–732. 1978. View Article : Google Scholar : PubMed/NCBI
|
|
14
|
Liu CC, Wang H, Wang WD, Wang L, Liu WJ,
Wang JH, Geng QR and Lu Y: ENO2 promotes cell proliferation,
glycolysis, and glucocorticoid-resistance in acute lymphoblastic
leukemia. Cell Physiol Biochem. 46:1525–1535. 2018. View Article : Google Scholar : PubMed/NCBI
|
|
15
|
Huebbers CU, Adam AC, Preuss SF, Schiffer
T, Schilder S, Guntinas-Lichius O, Schmidt M, Klussmann JP and
Wiesner RJ: High glucose uptake unexpectedly is accompanied by high
levels of the mitochondrial ß-F1-ATPase subunit in head and neck
squamous cell carcinoma. Oncotarget. 6:36172–36184. 2015.
View Article : Google Scholar : PubMed/NCBI
|
|
16
|
Huang J, Yang M, Liu Z, Li X, Wang J, Fu
N, Cao T and Yang X: PPFIA4 promotes colon cancer cell
proliferation and migration by enhancing tumor glycolysis. Front
Oncol. 11:6532002021. View Article : Google Scholar : PubMed/NCBI
|
|
17
|
Liu C, Liu D, Wang F, Xie J, Liu Y, Wang
H, Rong J, Xie J, Wang J, Zeng R, et al: Identification of a
glycolysis- and lactate-related gene signature for predicting
prognosis, immune microenvironment, and drug candidates in colon
adenocarcinoma. Front Cell Dev Biol. 10:9719922022. View Article : Google Scholar : PubMed/NCBI
|
|
18
|
Lang L, Wang F, Ding Z, Zhao X, Loveless
R, Xie J, Shay C, Qiu P, Ke Y, Saba NF and Teng Y: Blockade of
glutamine-dependent cell survival augments antitumor efficacy of
CPI-613 in head and neck cancer. J Exp Clin Cancer Res. 40:3932021.
View Article : Google Scholar : PubMed/NCBI
|
|
19
|
Lv C, Yu H, Wang K, Chen C, Tang J, Han F,
Mai M, Ye K, Lai M and Zhang H: ENO2 promotes colorectal cancer
metastasis by interacting with the LncRNA CYTOR and activating
YAP1-induced EMT. Cells. 11:23632022. View Article : Google Scholar : PubMed/NCBI
|
|
20
|
Zheng S, Mo J, Zhang J and Chen Y: HIF-1α
inhibits ferroptosis and promotes malignant progression in
non-small cell lung cancer by activating the Hippo-YAP signalling
pathway. Oncol Lett. 25:902023. View Article : Google Scholar : PubMed/NCBI
|
|
21
|
Liu G, Zhou J, Piao Y, Zhao X, Zuo Y and
Ji Z: Hsa_circ_0085576 promotes clear cell renal cell carcinoma
tumorigenesis and metastasis through the miR-498/YAP1 axis. Aging
(Albany NY). 12:11530–11549. 2020. View Article : Google Scholar : PubMed/NCBI
|
|
22
|
Wang J, Zhao Z, Liu Y, Cao X, Li F, Ran H,
Cao Y and Wu C: ‘Mito-Bomb’: A novel mitochondria-targeting
nanosystem for ferroptosis-boosted sonodynamic antitumor therapy.
Drug Deliv. 29:3111–3122. 2022. View Article : Google Scholar : PubMed/NCBI
|
|
23
|
Zhang M, Zhong H, Cao T, Huang Y, Ji X,
Fan GC and Peng T: Gamma-aminobutyrate transaminase protects
against lipid overload-triggered cardiac injury in mice. Int J Mol
Sci. 23:21822022. View Article : Google Scholar : PubMed/NCBI
|
|
24
|
Huang SX, Partridge MA, Ghandhi SA,
Davidson MM, Amundson SA and Hei TK: Mitochondria-derived reactive
intermediate species mediate asbestos-induced genotoxicity and
oxidative stress-responsive signaling pathways. Environ Health
Perspect. 120:840–847. 2012. View Article : Google Scholar : PubMed/NCBI
|
|
25
|
Doherty JR and Cleveland JL: Targeting
lactate metabolism for cancer therapeutics. J Clin Invest.
123:3685–3692. 2013. View
Article : Google Scholar : PubMed/NCBI
|
|
26
|
Liberti MV and Locasale JW: The Warburg
effect: How does it benefit cancer cells? Trends Biochem Sci.
41:211–218. 2016. View Article : Google Scholar : PubMed/NCBI
|
|
27
|
Abbaszadeh Z, Çeşmeli S and Biray Avcı Ç:
Crucial players in glycolysis: Cancer progress. Gene.
726:1441582020. View Article : Google Scholar : PubMed/NCBI
|
|
28
|
Guo Y, Liang F, Zhao F and Zhao J:
Resibufogenin suppresses tumor growth and Warburg effect through
regulating miR-143-3p/HK2 axis in breast cancer. Mol Cell Biochem.
466:103–115. 2020. View Article : Google Scholar : PubMed/NCBI
|
|
29
|
Han S, Yang S, Cai Z, Pan D, Li Z, Huang
Z, Zhang P, Zhu H, Lei L and Wang W: Anti-Warburg effect of
rosmarinic acid via miR-155 in gastric cancer cells. Drug Des Devel
Ther. 9:2695–2703. 2015.PubMed/NCBI
|
|
30
|
Zheng J, Luo J, Zeng H, Guo L and Shao G:
125I suppressed the Warburg effect viaregulating
miR-338/PFKL axis in hepatocellular carcinoma. Biomed Pharmacother.
119:1094022019. View Article : Google Scholar : PubMed/NCBI
|
|
31
|
Liu Y, Liang T, Qiu X, Ye X, Li Z, Tian B
and Yan D: Down-regulation of Nfatc1 suppresses proliferation,
migration, invasion, and Warburg effect in prostate cancer cells.
Med Sci Monit. 25:1572–1581. 2019. View Article : Google Scholar : PubMed/NCBI
|
|
32
|
Morais M, Dias F, Teixeira AL and Medeiros
R: MicroRNAs and altered metabolism of clear cell renal cell
carcinoma: Potential role as aerobic glycolysis biomarkers. Biochim
Biophys Acta Gen Subj. 1861:2175–2185. 2017. View Article : Google Scholar : PubMed/NCBI
|
|
33
|
Hakimi AA, Reznik E, Lee CH, Creighton CJ,
Brannon AR, Luna A, Aksoy BA, Liu EM, Shen R, Lee W, et al: An
integrated metabolic atlas of clear cell renal cell carcinoma.
Cancer Cell. 29:104–116. 2016. View Article : Google Scholar : PubMed/NCBI
|
|
34
|
Grønningsæter IS, Fredly HK, Gjertsen BT,
Hatfield KJ and Bruserud O: Systemic metabolomic profiling of acute
myeloid leukemia patients before and during disease-stabilizing
treatment based on all-trans retinoic acid, valproic acid, and
low-dose chemotherapy. Cells. 8:12292019. View Article : Google Scholar
|
|
35
|
Fang Z, Sun Q, Yang H and Zheng J: SDHB
suppresses the tumorigenesis and development of ccRCC by inhibiting
glycolysis. Front Oncol. 11:6394082021. View Article : Google Scholar : PubMed/NCBI
|
|
36
|
Kounelakis MG, Zervakis ME, Giakos GC,
Postma GJ, Buydens LM and Kotsiakis X: On the relevance of
glycolysis process on brain gliomas. IEEE J Biomed Health Inform.
17:128–135. 2013. View Article : Google Scholar : PubMed/NCBI
|
|
37
|
Yeh CS, Wang JY, Chung FY, Lee SC, Huang
MY, Kuo CW, Yang MJ and Lin SR: Significance of the glycolytic
pathway and glycolysis related-genes in tumorigenesis of human
colorectal cancers. Oncol Rep. 19:81–91. 2008.PubMed/NCBI
|
|
38
|
Wang Q, Chen C, Ding Q, Zhao Y, Wang Z,
Chen J, Jiang Z, Zhang Y, Xu G, Zhang J, et al: METTL3-mediated
m6A modification of HDGF mRNA promotes gastric cancer
progression and has prognostic significance. Gut. 69:1193–1205.
2020. View Article : Google Scholar : PubMed/NCBI
|
|
39
|
Sanders E and Diehl S: Analysis and
interpretation of transcriptomic data obtained from extended
Warburg effect genes in patients with clear cell renal cell
carcinoma. Oncoscience. 2:151–186. 2015. View Article : Google Scholar : PubMed/NCBI
|
|
40
|
Teng PN, Hood BL, Sun M, Dhir R and
Conrads TP: Differential proteomic analysis of renal cell carcinoma
tissue interstitial fluid. J Proteome Res. 10:1333–1342. 2011.
View Article : Google Scholar : PubMed/NCBI
|
|
41
|
Rasmuson T, Grankvist K and Ljungberg B:
Serum gamma-enolase and prognosis of patients with renal cell
carcinoma. Cancer. 72:1324–1328. 1993. View Article : Google Scholar : PubMed/NCBI
|
|
42
|
Takashi M, Sakata T and Kato K: Use of
serum gamma-enolase and aldolase A in combination as markers for
renal cell carcinoma. Jpn J Cancer Res. 84:304–309. 1993.
View Article : Google Scholar : PubMed/NCBI
|
|
43
|
Qiu Y, Cao Y, Cao W, Jia Y and Lu N: The
application of ferroptosis in diseases. Pharmacol Res.
159:1049192020. View Article : Google Scholar : PubMed/NCBI
|
|
44
|
Li Y, Feng D, Wang Z, Zhao Y, Sun R, Tian
D, Liu D, Zhang F, Ning S, Yao J and Tian X: Ischemia-induced ACSL4
activation contributes to ferroptosis-mediated tissue injury in
intestinal ischemia/reperfusion. Cell Death Differ. 26:2284–2299.
2019. View Article : Google Scholar : PubMed/NCBI
|
|
45
|
Zou Y, Henry WS, Ricq EL, Graham ET,
Phadnis VV, Maretich P, Paradkar S, Boehnke N, Deik AA, Reinhardt
F, et al: Plasticity of ether lipids promotes ferroptosis
susceptibility and evasion. Nature. 585:603–608. 2020. View Article : Google Scholar : PubMed/NCBI
|
|
46
|
Wang J, Yin X, He W, Xue W, Zhang J and
Huang Y: SUV39H1 deficiency suppresses clear cell renal cell
carcinoma growth by inducing ferroptosis. Acta Pharm Sin B.
11:406–419. 2021. View Article : Google Scholar : PubMed/NCBI
|
|
47
|
Kumfu S, Chattipakorn S, Fucharoen S and
Chattipakorn N: Mitochondrial calcium uniporter blocker prevents
cardiac mitochondrial dysfunction induced by iron overload in
thalassemic mice. Biometals. 25:1167–1175. 2012. View Article : Google Scholar : PubMed/NCBI
|
|
48
|
Fang X, Wang H, Han D, Xie E, Yang X, Wei
J, Gu S, Gao F, Zhu N, Yin X, et al: Ferroptosis as a target for
protection against cardiomyopathy. Proc Natl Acad Sci USA.
116:2672–2680. 2019. View Article : Google Scholar : PubMed/NCBI
|
|
49
|
She H, Tan L, Du Y, Zhou Y, Guo N, Zhang
J, Du Y, Wang Y, Wu Z, Ma C, et al: VDAC2 malonylation participates
in sepsis-induced myocardial dysfunction via mitochondrial-related
ferroptosis. Int J Biol Sci. 19:3143–3158. 2023. View Article : Google Scholar : PubMed/NCBI
|
|
50
|
Anastasiou D, Yu Y, Israelsen WJ, Jiang
JK, Boxer MB, Hong BS, Tempel W, Dimov S, Shen M, Jha A, et al:
Pyruvate kinase M2 activators promote tetramer formation and
suppress tumorigenesis. Nat Chem Biol. 8:839–847. 2012. View Article : Google Scholar : PubMed/NCBI
|
|
51
|
Yang L, Xie M, Yang M, Yu Y, Zhu S, Hou W,
Kang R, Lotze MT, Billiar TR, Wang H, et al: PKM2 regulates the
Warburg effect and promotes HMGB1 release in sepsis. Nat Commun.
5:44362014. View Article : Google Scholar : PubMed/NCBI
|
|
52
|
Rao J, Wang H, Ni M, Wang Z, Wang Z, Wei
S, Liu M, Wang P, Qiu J, Zhang L, et al: FSTL1 promotes liver
fibrosis by reprogramming macrophage function through modulating
the intracellular function of PKM2. Gut. 71:2539–2550. 2022.
View Article : Google Scholar : PubMed/NCBI
|
|
53
|
Zhou X, Xie F, Wang L, Zhang L, Zhang S,
Fang M and Zhou F: The function and clinical application of
extracellular vesicles in innate immune regulation. Cell Mol
Immunol. 17:323–334. 2020. View Article : Google Scholar : PubMed/NCBI
|


