Introduction
Breast cancer is the most common cancer in the
world, according to the International Agency for Research on Cancer
(1). According to the World Health
Organization's report in 2020, approximately 2.3 million new cases
of breast cancer surpassed the incidence of lung cancer, which was
previously the most common cancer (2). According to cancer statistics in Japan
and the United States, the 5-year survival rates of patients with
breast cancer (all stages combined) were approximately 92.3%
(2009–2011) and 91% (2012–2018), respectively (3,4). These
findings appear to indicate higher survival rates than for other
serious types of cancer. Furthermore, if this cancer is not treated
or becomes resistant to treatment, it can spread to distant sites.
The histological or immunological characteristics of this cancer
are classified as subtypes. Breast cancer is classified into four
types based on the immunohistochemical expression of hormone
receptors: estrogen receptor positive (ER+),
progesterone receptor positive (PR+), human epidermal
growth factor receptor 2-positive (HER2+), and
triple-negative, which is defined by the absence of expression of
any of the above receptors (5).
HER2 expression accounts for 15–25% of breast cancers, and during
breast carcinogenesis, its overexpression is one of the first
events to occur (6,7). HER2 also increases the detection rate
of metastatic or recurrent breast cancers by 50–80%. The epidermal
growth factor receptor (EGFR) family includes HER2, which is a
transmembrane receptor protein. It is a protein found on the cell
surface that promotes cell proliferation. It is encoded by the gene
erb-b2 on the long arm of chromosome 17 (8). In a previous study using serum
metabolome analysis of patients who were resistant to anti-HER2
monoclonal antibody therapy, chemotherapy, and radiotherapy, we
discovered that the concentrations of phospholipid metabolites,
such as phosphatidylcholine and sphingomyelin (SM), increase with
cancer recurrence (9). Furthermore,
immunological analysis of resected recurrent cancer tissue revealed
that HER2+ areas and neutral sphingomyelinase-2 were
compressed. In breast cancer, SM-containing lipids may be involved
in cancer growth and remodeling of the signaling along with the
HER2 protein (10). To confirm the
dynamics of SM observed in the patient, the present study examined
SM expression in breast cancer cell lines with or without HER2
expression (MCF7 and BT474) after radiation, as well as the
relationship between radioresistant cancer and SM.
Materials and methods
Cell preparation and culture
The human breast cancer cell lines MCF7
(ER+, PR+, and HER2−) and BT474
(ER+, PR+, and HER2+) were
obtained from the RIKEN BioResource Center and the National
Institute of Biomedical Innovation, Health, and Nutrition,
respectively. MCF7 cells were cultured in Minimum Essential Media
(Nacalai Tesque Co., Ltd.) containing 10% heat-inactivated fetal
bovine serum (FBS; Japan Bioserum) and 1% penicillin/streptomycin
in a humidified atmosphere at 37°C under 5% CO2. BT474
cells were grown in RPMI-1640 (Thermo Fisher Scientific, Tokyo,
Japan) supplemented with 10% heat-inactivated FBS and 1%
penicillin/streptomycin in a humidified atmosphere of 37°C under 5%
CO2. Viable cells were determined using the trypan blue
(Nacalai Tesque) exclusion assay, which were then counted using a
Burker-Turk hemocytometer (SLGC, Saitama, Japan).
Irradiation
X-ray irradiation (150 kVp, 20 mA with 0.5 mm
aluminum and 0.3 mm copper filters) was carried out using an X-ray
generator (MBR-1520R-3; Hitachi Medical Co. Ltd.) with a 45 cm
distance between the focus and target. During irradiation, the dose
was monitored using a thimble ionization chamber next to the
samples. The dose rate was 1 Gy/min. The cell viability test using
the trypan blue exclusion assay was performed post 24 h after
exposure to IR.
Clonogenic potency assay after
irradiation
The clonogenic potency assay was performed using
colony forming cells. It was tested in a basic medium enriched with
2.6% methyl cellulose (Nacalai Tesque Inc.). The cells
(5.0×10²) following irradiation were suspended in 1 ml
of methylcellulose medium. This mixture was transferred to 24-well
cell culture plates (Corning Inc.) at 0.3 ml/well and incubated at
37°C for 7 days in a humidified atmosphere of 95% air/5%
CO2. Colonies with more than 50 cells were counted using
an inversion microscope.
Flow cytometry for cell cycle
distribution analysis
MCF7 and BT474 cells were seeded in a 60 mm dish
containing 4 ml of culture medium. These cells were irradiated at 1
to 4 Gy and incubated for 12 h. The harvested cells
(5×10⁵ cells) were treated with cold 70% ethanol for
over 5 min on ice before adding RNaseI. These cells were stained
with propidium iodide (50 µg/ml, FUJIFILM Wako Pure Chemical Co.
Ltd.) for 30 min in the dark. Cell cycle distribution analysis was
done with a Cell Lab Quanta™ Sc MPL (Beckman Coulter).
Kaluza analysis software (version 2.1; Beckman Coulter) was used to
identify the sub-G1, G0/G1, S, and
G2/M phases.
Quantitation of SM
The total SMs in the cell culture supernatant and
within the cell were quantified using a Sphingomyelinase
Fluorometric Assay kit (Cayman Chemical Co. Ltd.). The experimental
samples that reacted with sphingomyelinase were broken down into
ceramide and phosphorylcholine. Resorufin, a fluorescent molecule,
was then produced from ceramide using alkaline phosphatase, choline
oxidase, and an H2O2 reaction. The
fluorescence (Ex530/Em590) of these samples
was measured with a microplate reader (TriStar LB 941; Berthold
Tech.).
Total RNA extraction and reverse
transcription-quantitative polymerase chain reaction
Total RNA was obtained from culture cells using the
RNeasy® Plus Mini kit (Qiagen Inc.) and measured using a
NanoDrop system (Thermo Fisher Scientific, Inc.). Total RNA quality
was determined using a 2100 Bioanalyzer (Agilent Technologies
Inc.), and first-strand cDNA was synthesized using ReverTra
Ace® qPCR RT Master Mix (Toyobo Co. Ltd.) following the
manufacturer's protocol. mRNA expression was then assessed using
quantitative polymerase chain reaction (qPCR) with the Power
SYBR™ Green PCR Master Mix (Life Technologies Inc.) and
a SmartCycler® II (Takara Bio Inc.). Thermocycler
conditions were 95°C for 10 min, followed by 40 cycles of 95°C for
15 sec and 60°C for 1 min. The relative levels of sphingomyelin
synthase 1 (SGMS1) and sphingomyelin synthase 2
(SGMS2) were determined using the 2−ΔΔCq method
(11,12) in cells subjected to X-irradiation
after 24 h of no irradiation, after normalization with the
housekeeping gene ACTB. The genetic sequences for SGMS1,
SGMS2 and ACTB were referred by NCBI Gene database (https://www.ncbi.nlm.nih.gov/gene/). The
accession numbers were as follows: SGMS1 (NM_147156.4), SGMS2
(NM_001136257.2) and ACTB (NM_001101.5). The oligonucleotide primer
sets used for reverse transcription-quantitative polymerase chain
reaction were designed by Primer3 software (13), and supplied by Eurofins Genomics
Inc. (Table I). ACTB was selected
as the housekeeping gene for normalization based on MIQE
guidelines.
 | Table I.Sequences of human SGMS1,
SGMS2 and ACTB real time polymerase chain reaction
primers. |
Table I.
Sequences of human SGMS1,
SGMS2 and ACTB real time polymerase chain reaction
primers.
| Accession
number | Primer name | Primer sequence
(5′-3′) |
|---|
| NM_147156.4 | SGMS1
forward |
TCGGAACAGTGACTGCTGAC |
|
| SGMS1
reverse |
GAAATGCTCCAGAGGCTCAC |
| NM_152621.6 | SGMS2
forward |
TGGAAAACATCCCCAAATGT |
|
| SGMS2
reverse |
AGCACCAAAGGATGTTGACC |
| NM_001101.5 | ACTB
forward |
GGACTTCGAGCAAGAGATGG |
|
| ACTB
reverse |
AGCACTGTGTTGGCGTACAG |
Statistical analysis
The statistical analysis was carried out using
OriginLab software version 9.1 (OriginLab) and Office 365
(Microsoft) with an add-in software (OMS Publishing, Inc.). Cell
damage analysis, sphingomyelin quantitation and mRNA expression
data were obtained from 4 independent experiments and two
replications, and were compared using the Tukey-Kramer test after
one-way ANOVA. The clonogenic surviving curves were fitted by the
Levenberg-Marquardt algorithm, which combines the Gauss-Newton and
steepest-descent methods, non-linear models based on the equation y
= 1-(1-exp(−x/D0))n, and the values
for D0 (37% survival dose) and n (number of
targets) were determined using a single-hit multitarget equation
(14). Sphingomyelin quantitation
data and mRNA expression data were compared with the non-irradiated
condition. Statistical significance was determined at a
P<0.05.
Results
Cell viability under exposure to
ionizing radiation (IR)
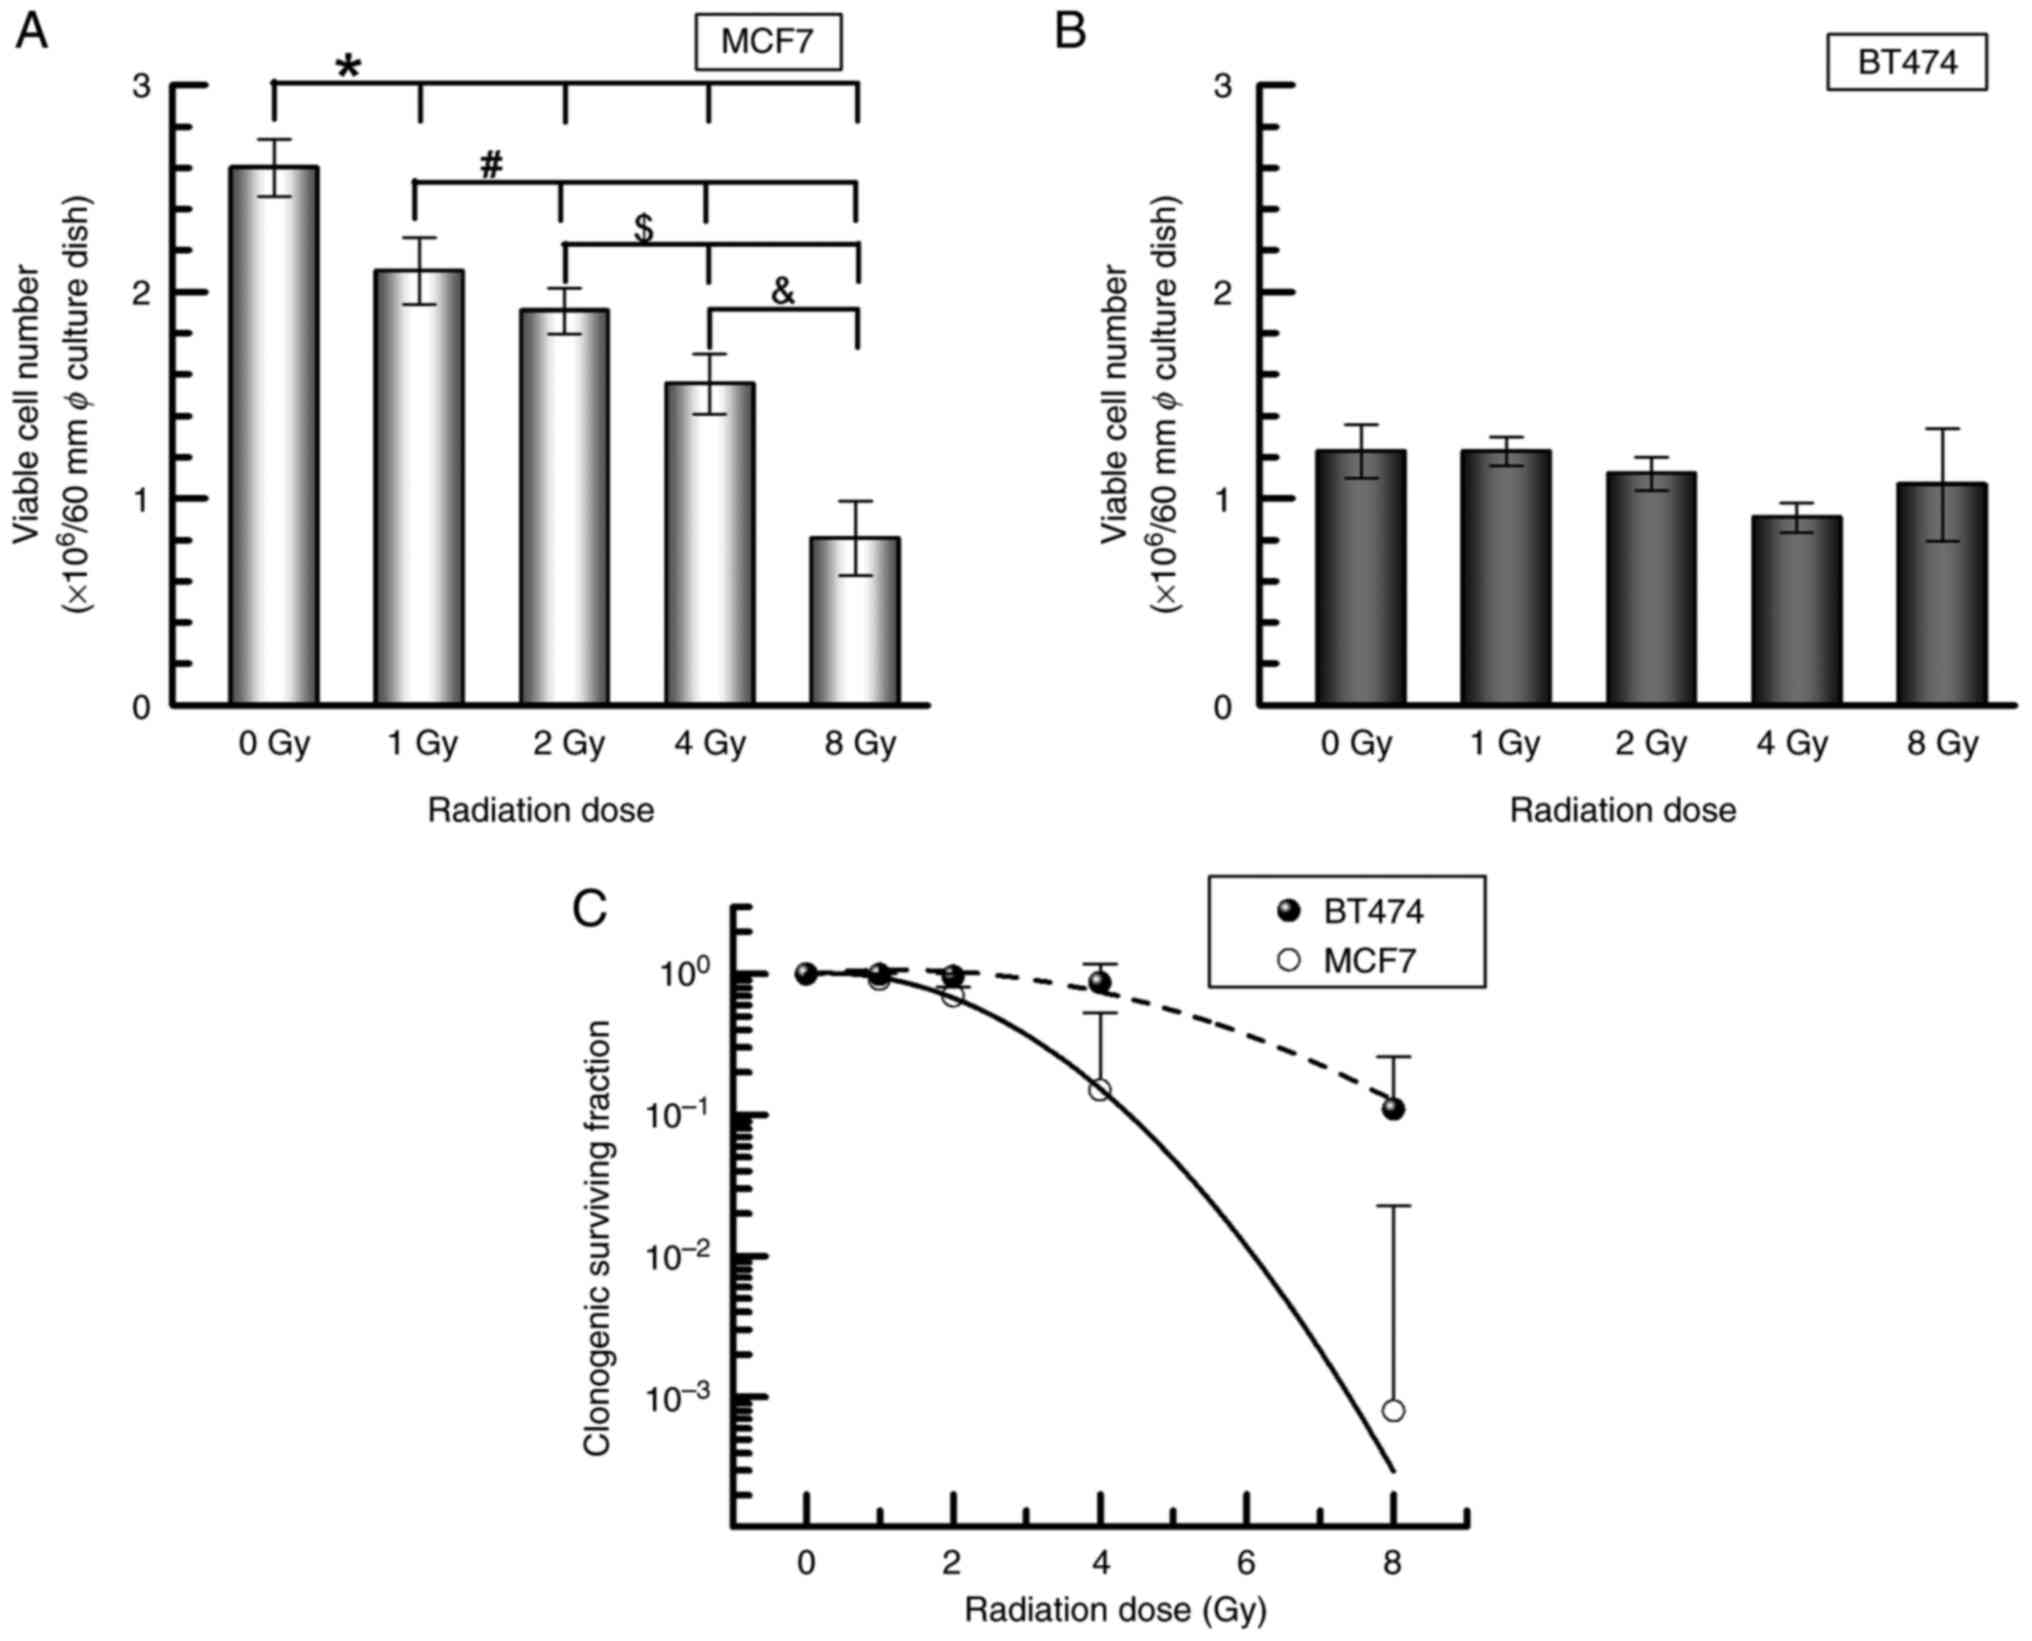
To clarify the proliferation potency under IR
exposure, both MCF7 and BT474 cells were exposed to IR until 8 Gy,
and cell numbers were calculated after 24 h, as well as a
clonogenic potency assay after incubation. MCF7 cells showed a
significant decrease of viable cells in a dose-dependent manner
(nonirradiation control, 2.6±0.1×10⁶ cells/ml; 1 Gy,
2.1±0.2×10⁶ cells/ml, P<0.05; 2 Gy,
1.9±0.1×10⁶ cells/ml, P<0.05; 4 Gy,
1.5±0.2×10⁶ cells/ml, P<0.01; 8 Gy,
0.8±0.2×10⁶ cells/ml, P<0.01) (Fig. 1A). BT474 cells exposed to 1–8 Gy
irradiation had a similar number of viable cells as the
nonirradiated control (1.2±0.1×10⁶ cells/ml) (Fig. 1B). Furthermore, BT474 demonstrated a
higher clonogenic potency when exposed to IR than MCF7 (Fig. 1C).
Alteration of cell cycle distribution
by IR
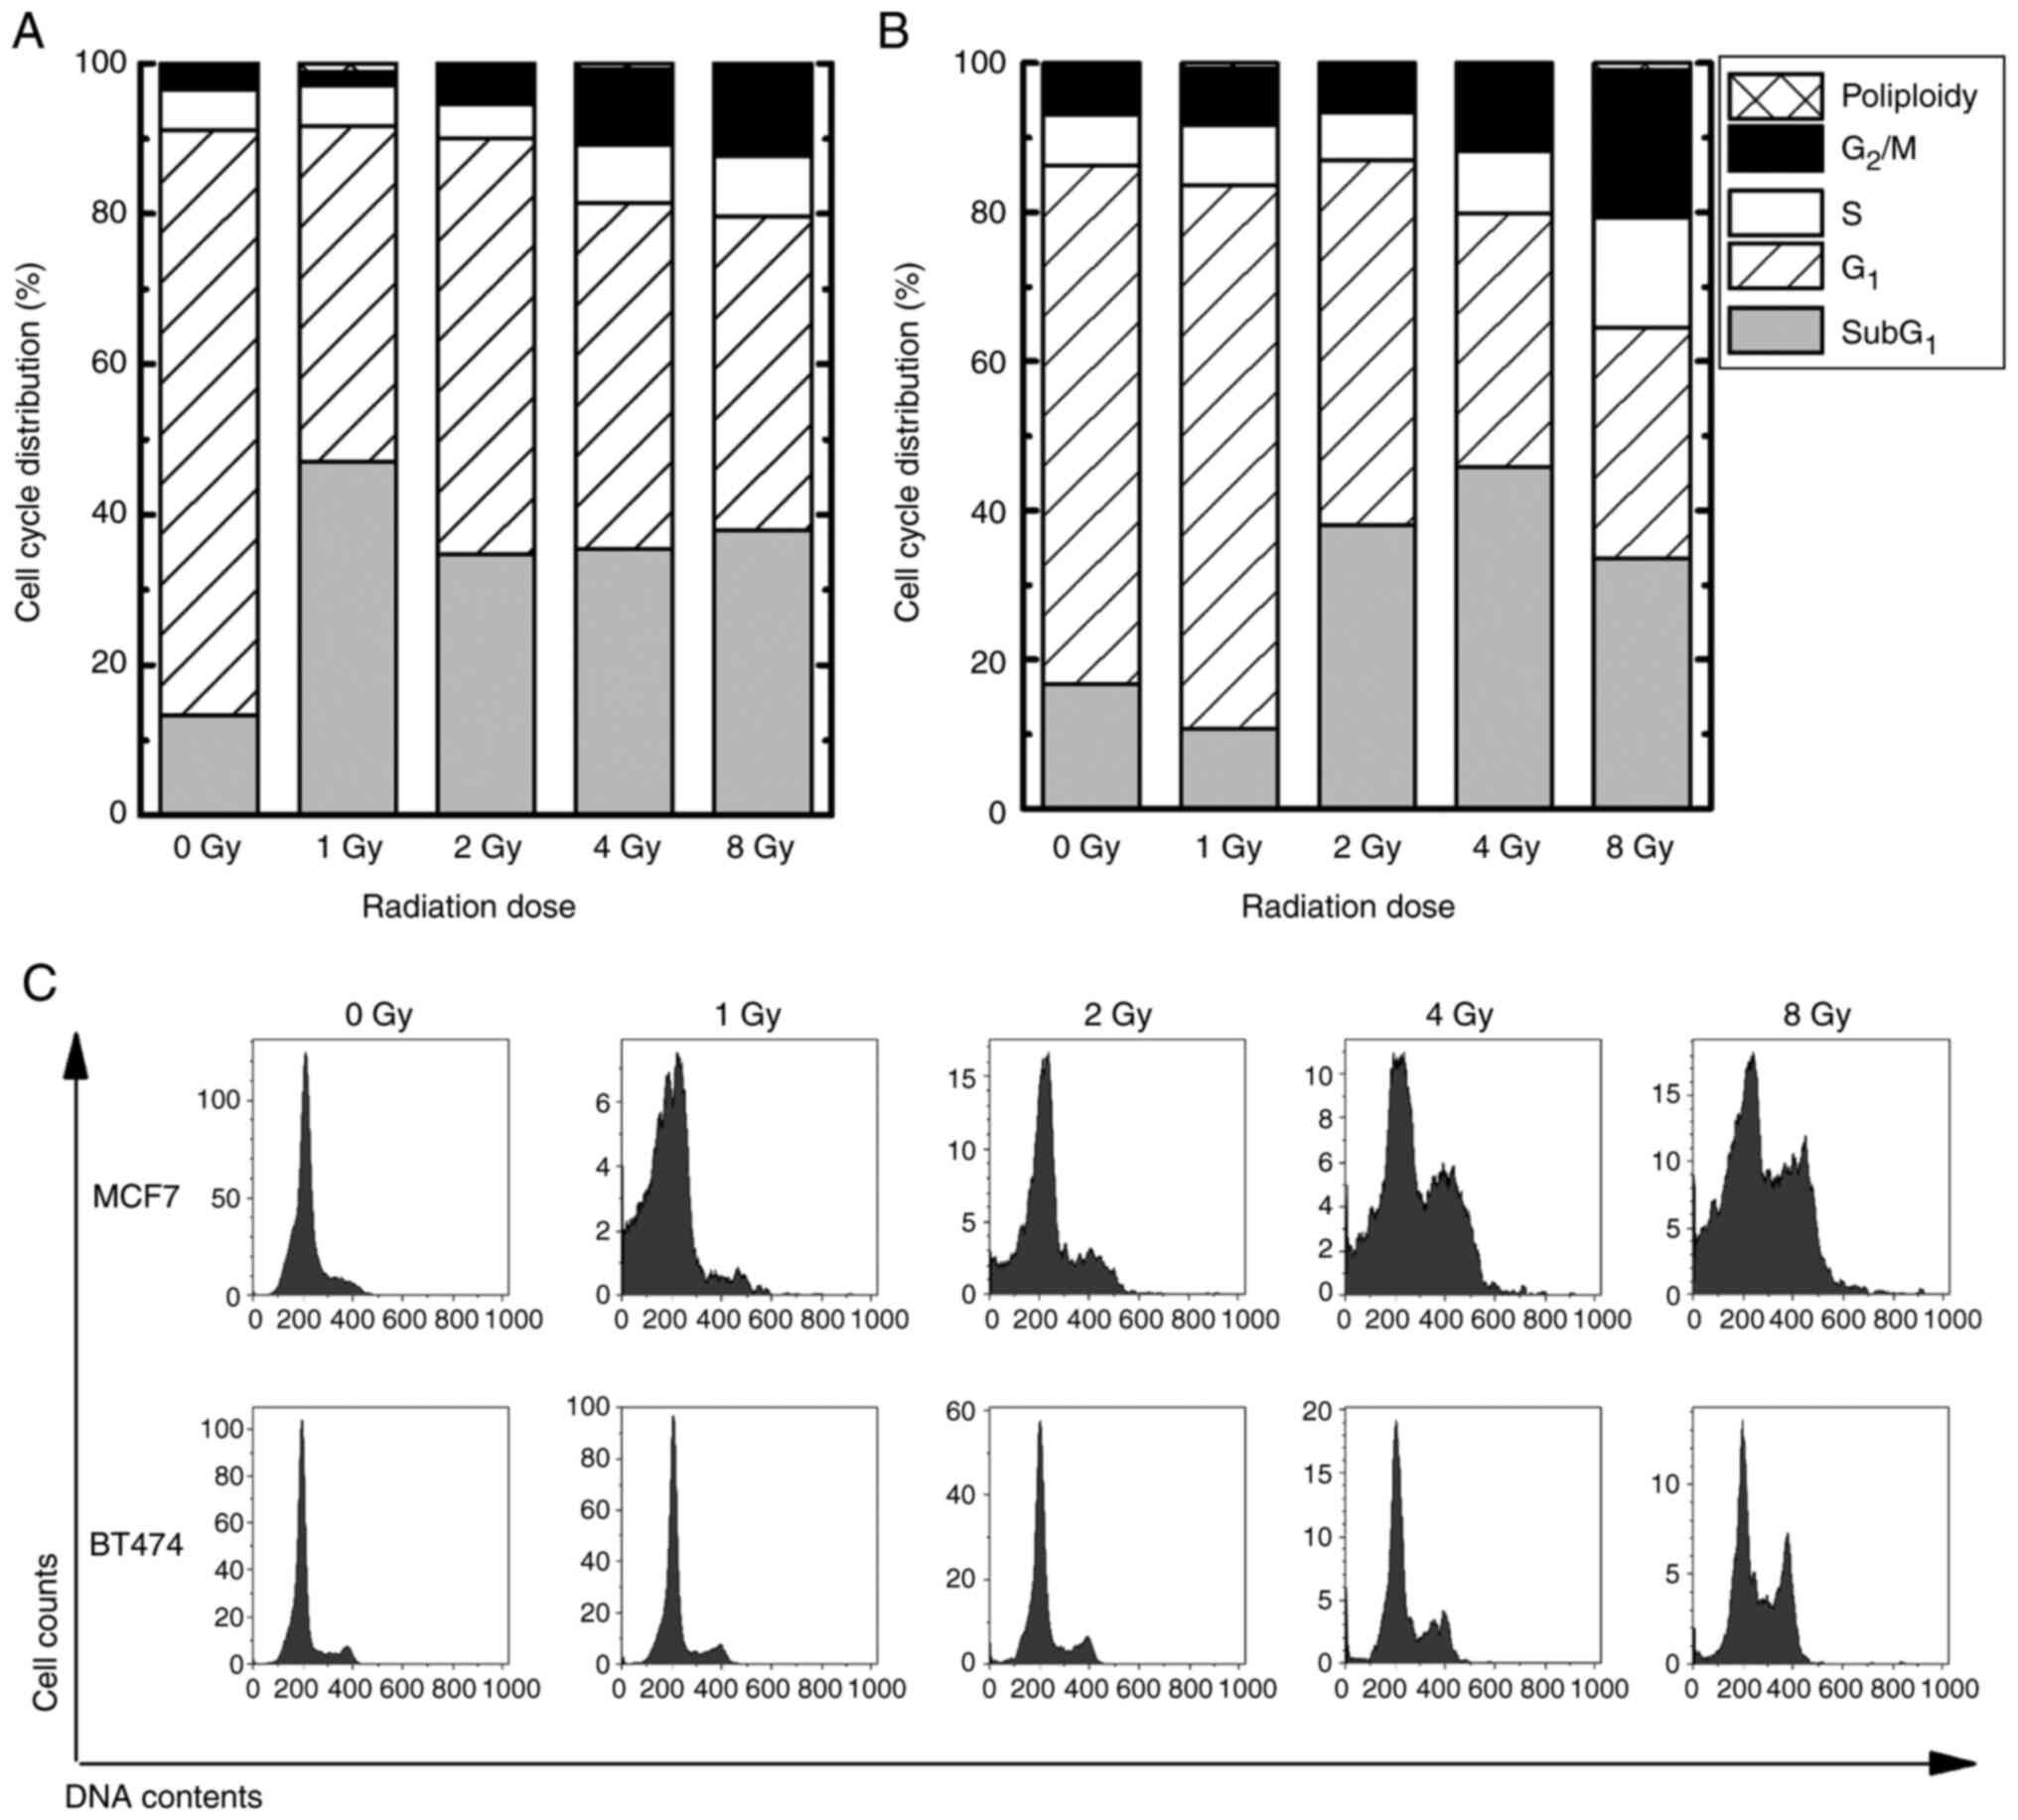
Cell cycle distribution in MCF7 and BT474 cells was
assessed using flow cytometry. In the G2/M phase, both MCF7 and
BT474 cells exposed to 4–8 Gy IR had a significant upregulation
(MCF7 exposed to 4Gy, 10.2±2.7%, P<0.05; MCF7 exposed to 8 Gy,
11.7±3.6%, P<0.05; BT474 exposed to 4 Gy, 11.3±2.6%, P<0.05;
BT474 exposed to 8Gy, 19.9±4.9%, P<0.05) in comparison to the
nonirradiated control (MCF7, 3.4±0.1%; BT474, 6.6±0.3%) (Fig. 2). In the sub-G1 phase,
which indicates apoptotic cells, MCF7 cells exposed to 1–8 Gy were
upregulated by approximately 35% (P<0.05), compared to
nonirradiated controls (13.3%). In contrast, BT474 cells exposed to
2–8 Gy showed an approximate 40% upregulation (P<0.05) compared
to nonirradiated controls (16.6%).
Quantitation of intra and
extracellular SM
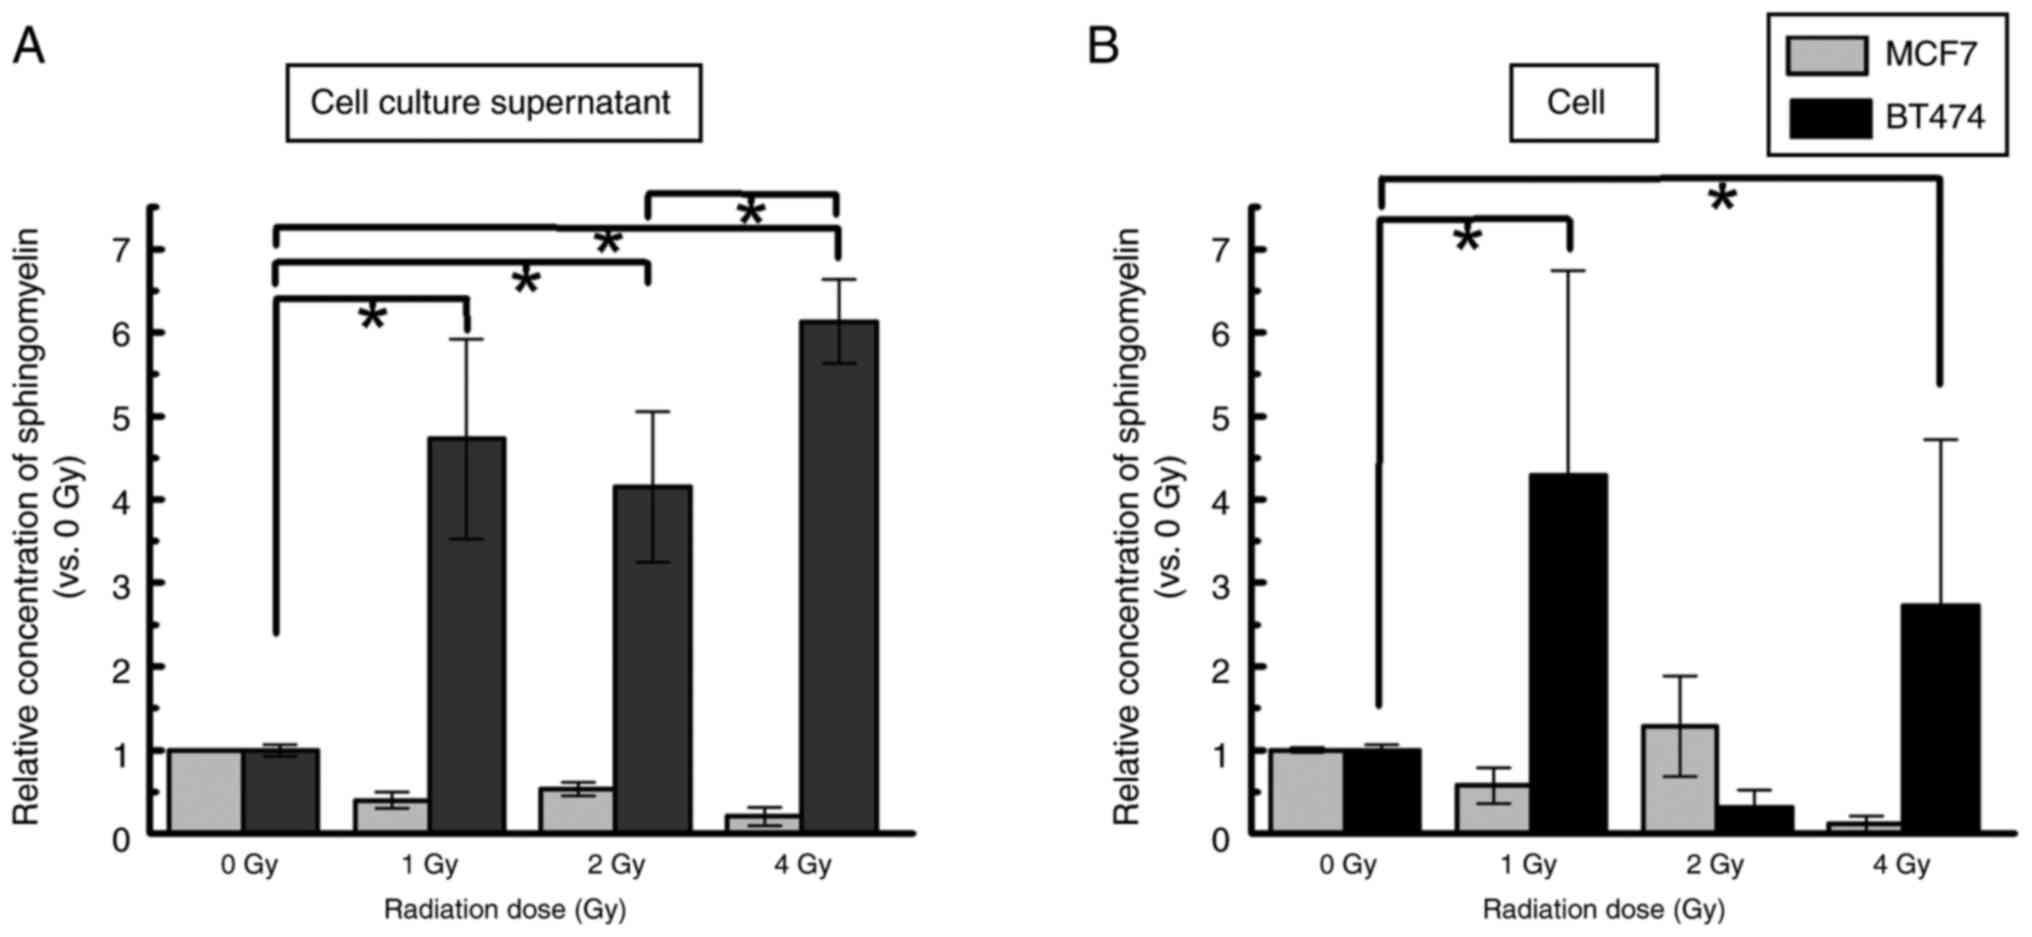
We analyzed the concentrations of cellular SM and
cell culture supernatant released from each cell 48 h after
exposure to IR. The concentration of phosphocholine, a marker for
SM, was 1–5 µM in the cell culture supernatant and 10–15 µM in the
nonirradiated control. In the cell culture supernatant and in
cells, a similar level of SM was found after 1–4 Gy exposure in
MCF7 cells. However, SM levels in BT474 cell culture supernatants
were significantly upregulated compared with those in the 0 Gy
control group (1 Gy, 4.7±1.2-fold, P<0.05; 2 Gy, 4.2±0.9-fold,
P<0.05; 4 Gy, 6.1±0.5-fold, P<0.05) (Fig. 3A). In addition, the SM concentration
in the cell culture supernatant of BT474 cells was increased in the
4 Gy group compared with the 2 Gy group (P<0.05). Upregulation
of intracellular SM levels was detected in BT474 cells exposed to 1
and 4 Gy compared with the 0 Gy control group (1 Gy, 4.3±2.5-fold,
P<0.05; 4 Gy, 2.7±2.0-fold, P<0.05) (Fig. 3B).
mRNA expression related to SM
synthesis
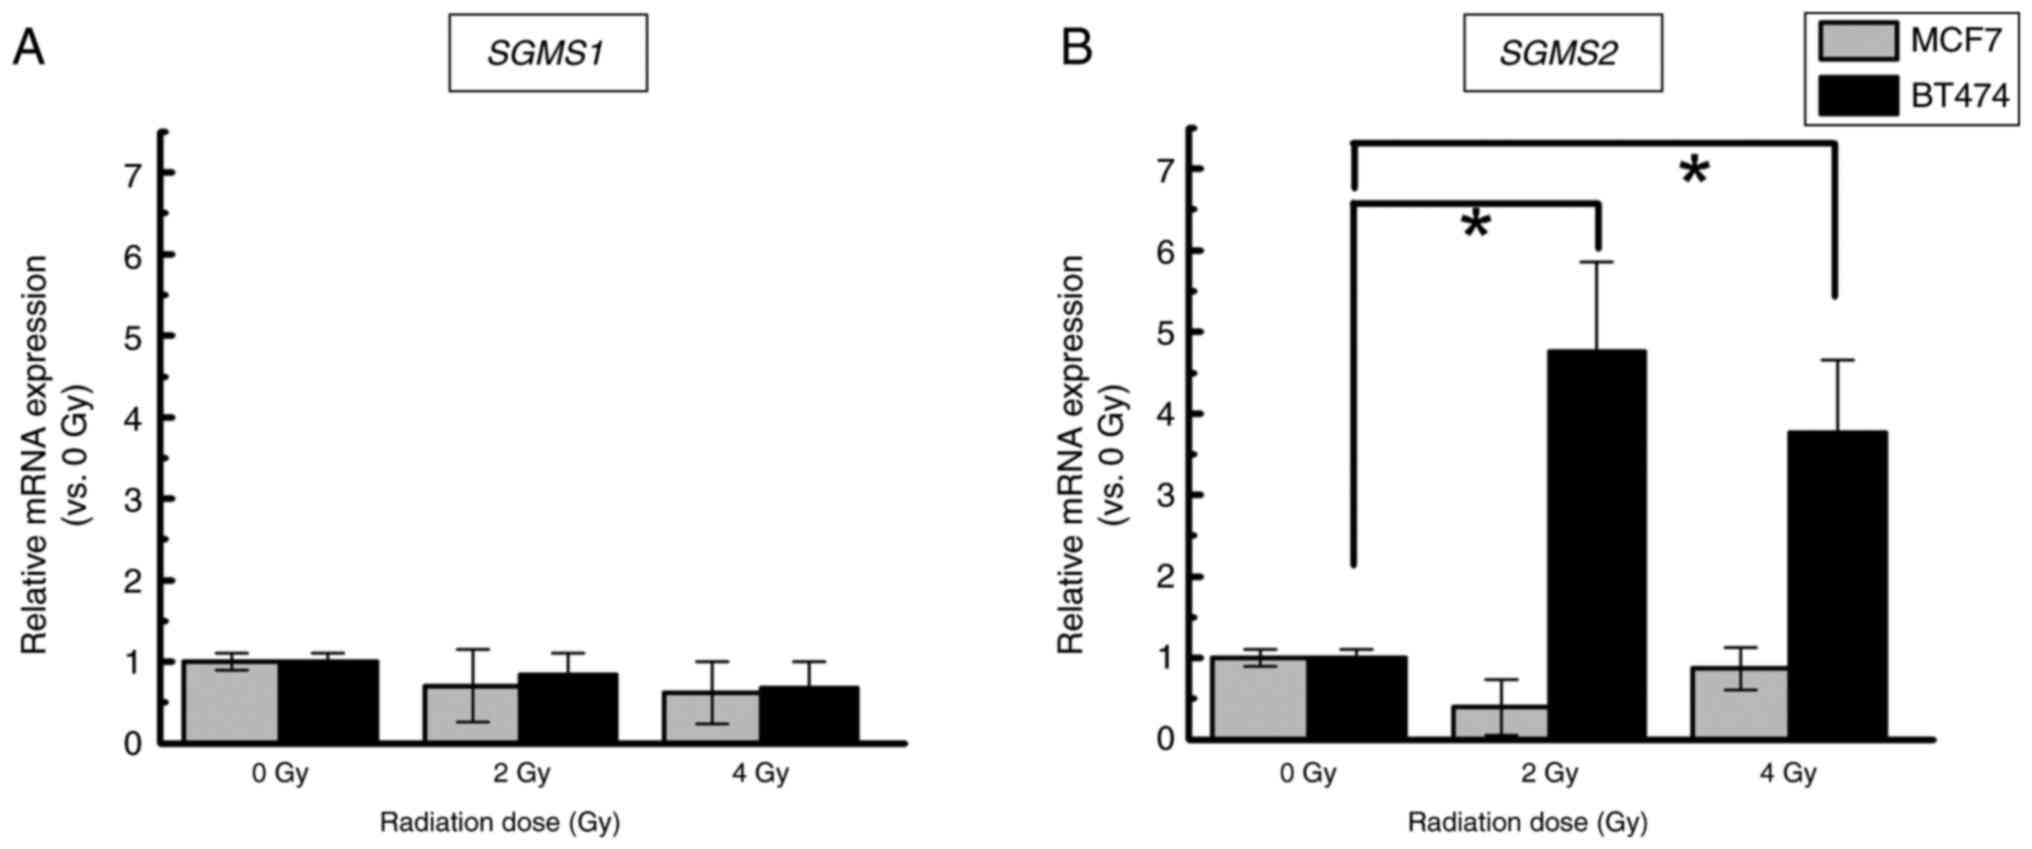
To see if radiation affects the expression of mRNAs
involved in SM synthesis, SGMS1 and SGMS2 mRNAs were
quantified. In both types of cells, the expression of SGMS1
exposed to IR was comparable to that in the nonirradiated control
(Fig. 4A). Conversely, a
significantly higher expression of SGMS2 in BT474 cells
exposed to IR was detected compared to nonirradiated cells (2 Gy,
4.8±1.1-fold, P<0.05; 4 Gy, 3.8±0.9-fold, P<0.05). In MCF7
cells, the SGMS2 mRNA levels did not differ significantly
among the 0, 2 and 4 Gy groups (Fig.
4B).
Discussion
In the current study, we focused on a breast cancer
cell model (MCF7 and BT474) with or without HER2 expression and
confirmed the release of SM when exposed to a higher dose of IR,
which is used in radiotherapy. It was demonstrated that
HER2+ cells (BT474) exposed to IR have a higher
proliferation potential than HER2− cells (MCF7).
Generally, exposure to high-dose rate IR causes apoptosis via DNA
cluster damage (15). The cell
cycle distribution can be assessed using flow cytometry, including
the sub-G1, G1, S, and G2/M
phases. Apoptotic cells are present in the sub-G1 phase
(16). An increase in the
G2/M phase in both cells exposed to IR could indicate
that the cell cycle checkpoint for DNA repair from IR damage, such
as strand breaks, is triggered by natural reactions. Our presented
cell cycle results revealed that the two cell lines were all
arrested in G2/M, and sub-G1 levels increased
significantly when exposed to IR. However, the BT474 was
radioresistant at the same radiation dose (4 and 8 Gy). These
findings suggest that BT474 (HER2+) retains a strong
proliferative potency even at high doses of IR, which may explain
its radioresistance. Concurrently, it is interesting that SM was
secreted outside of HER2+ BT474 cells after irradiation,
but not in MCF7 cells. Furthermore, it is interesting that IR
induced SGMS2 mRNA, which could provide an environment for
SM production. This is the first study to show that higher doses of
IR in the clinical radiation range induce mRNA expression of
SGMS2 and promote SM production in HER2+ breast
cancer cells. In our previous report (9), we identified that
chemo/radio-therapeutic-resistant cancer tissue connected to
reduced expression of nSMase in HER2-positive breast cancer are
strongly co-expressed with the sphingomyelin family which can be
detected at the peripheral blood serum level. The behavior of the
cell line models in this study appears to support this patient
data.
HER2 overexpression in breast cancer cells activates
signaling pathways that promote cell proliferation, tumor growth,
and lymph node metastasis (17).
Furthermore, several reports, including our previous case report,
show that most radioresistant cells express HER2 (18–20).
There are distinctive molecular mechanisms like ‘a shift from ER to
EGFR signaling pathways with increased MAPK and PI3K activity’
(21), ‘HER2 overexpression in
cells induces NF-kB expression’ (22,23),
as well as ‘HER2 knockdown in breast cancer cells is induced to
radiosensitivity’ (24). Therefore,
this information suggests that radioresistant breast cancer is
undoubtedly linked to HER2 expression.
SM is the most abundant sphingolipid in mammalian
cell membranes, with concentrations particularly high in the plasma
membrane, endocytic recycling compartment, and trans Golgi network.
SM regulates endocytosis, receptor-mediated ligand uptake, ion
channel and G-protein-coupled receptor function, and protein
sorting, and serves as a receptor for various bacterial and
nonbacterial pore-forming toxins (25). According to Bilal et al
(26), SM is produced through the
chemical reaction of SGMS1 and SGMS2 with ceramide
and phosphocholine. Although there have been no reports
demonstrating that SM promotes radioresistance in HER2+
breast cancer, it is critical to study the behavior of SGMS2
mRNA, which increases SM in a radioresistant environment.
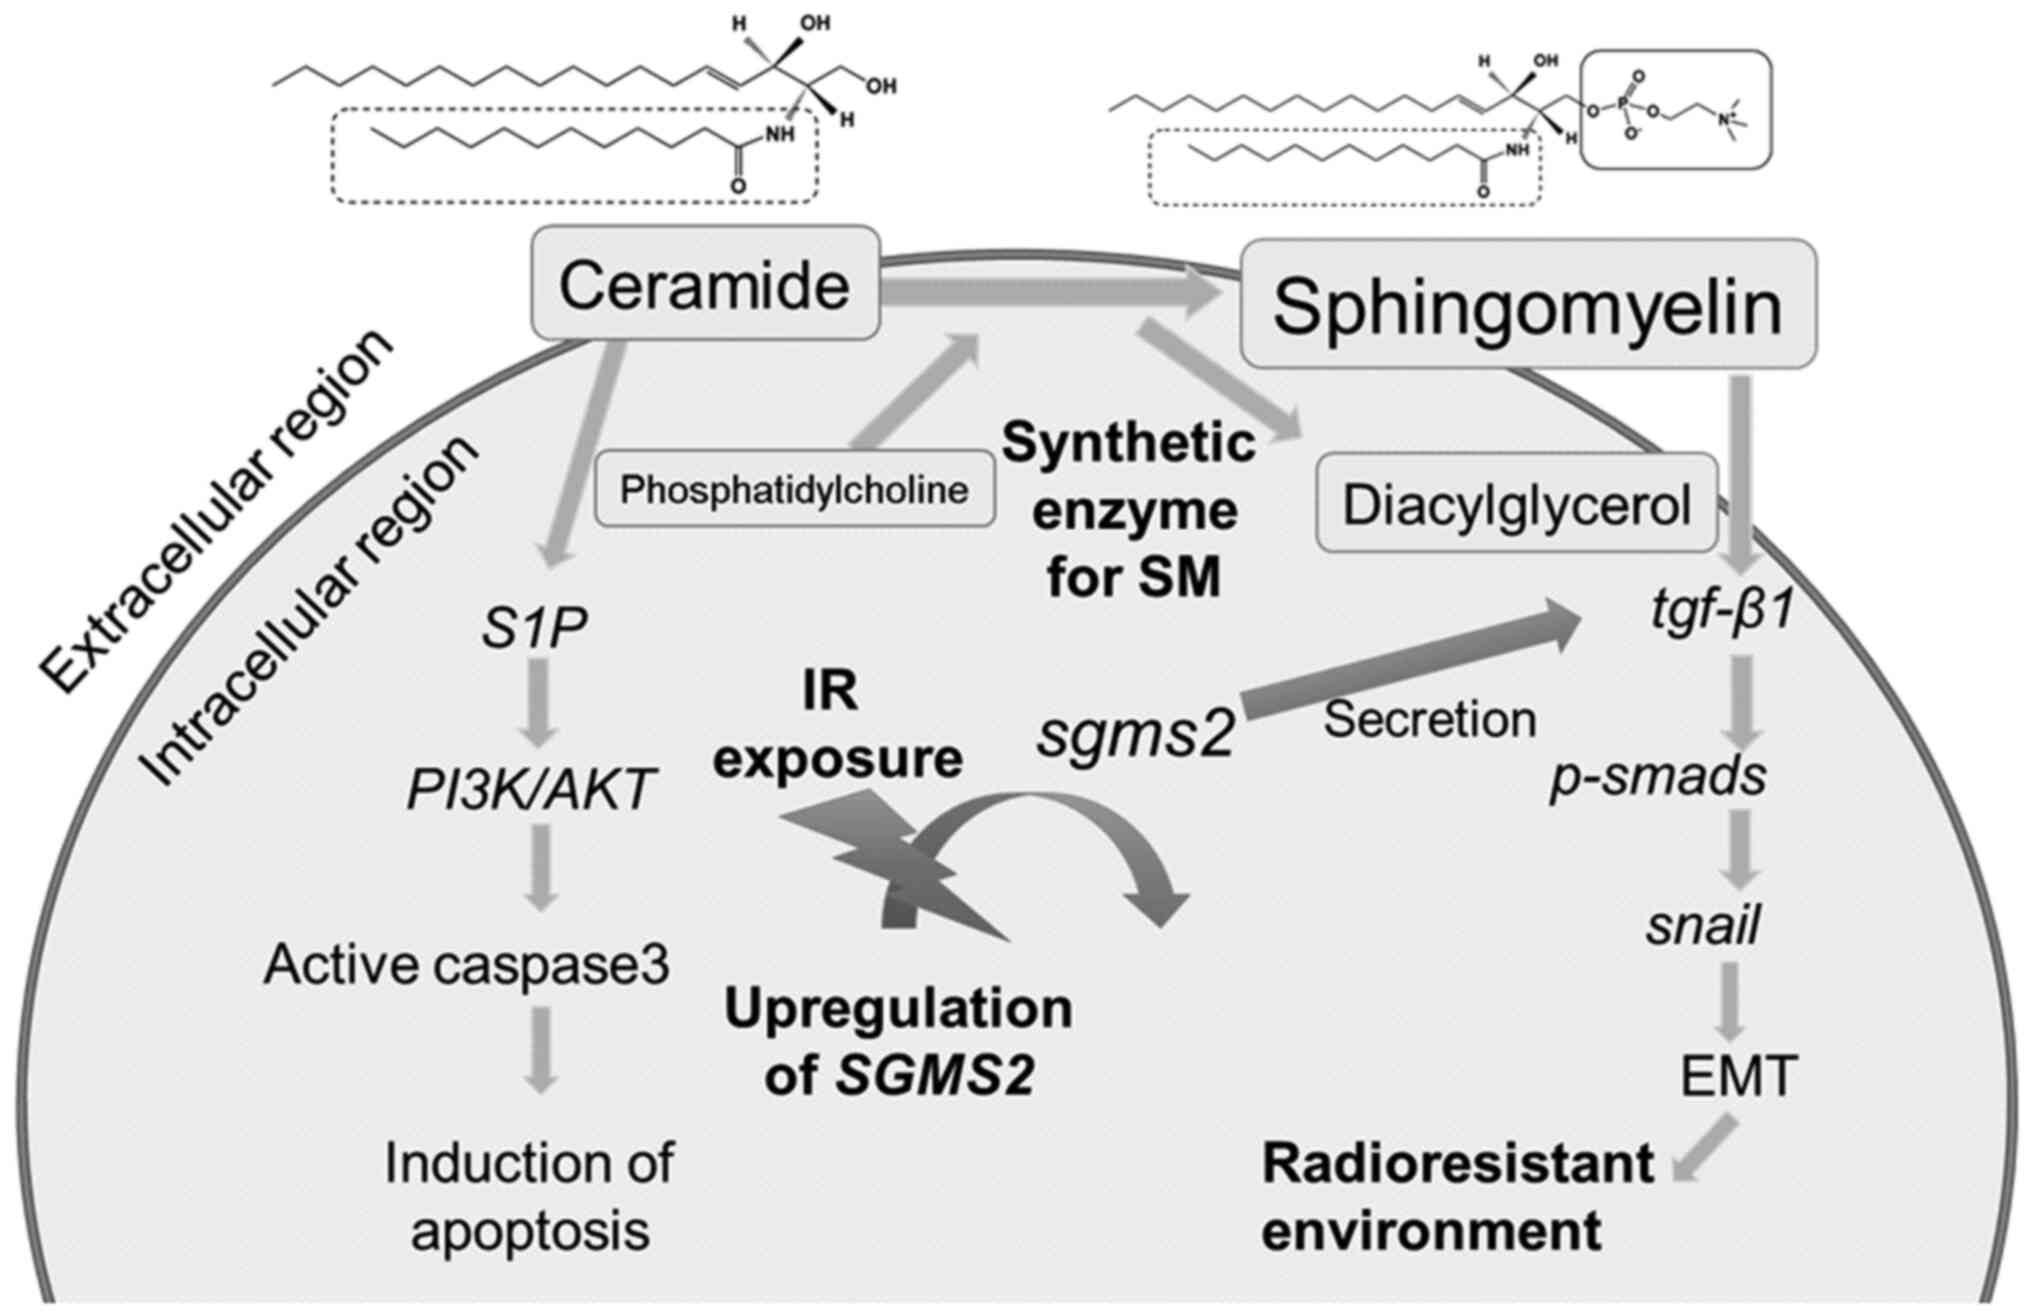
According to Zheng et al (27), SGMS2 is a critical regulator of
ceramide and SM homeostasis that promotes cancer cell proliferation
by suppressing apoptosis via a Cer-associated pathway. Also,
SGMS2 increases cancer cell invasiveness by promoting
epithelial-to-mesenchymal transition initiation via the TGF-β/Smad
signaling pathway. Furthermore, SGMS2 activates the
TGF-β/Smad signaling pathway mainly by increasing TGF-β1 secretion,
which is likely associated with abnormal SM expression. TGF-β1
plays a key role in radiation-induced fibrosis, which primarily
leads to radioresistance; therefore, a higher concentration of SM
is associated with increased radioresistance (28). In one study on colorectal cancer,
LARP6 protein binding to RNA inhibits SGMS2 expression and
slows cancer progression by causing ceramide and SM imbalance
(29). According to these findings,
because IR increases SM and promotes SGMS2 expression, an
intracellular signal transduction pathway exists between the
HER2+ environment and IR induced SGMS2 expression
(Fig. 5). It is critical to monitor
the radioresistance of HER2+/SGMS2+
breast cancer cells during radiotherapy, and SM may be used as a
biomarker for this. Kozar et al (30) attempted to use serum SM from
patients with epithelial ovarian cancer as a diagnostic marker, and
we hope to further understand its molecular mechanism. One
limitation of this study is the lack of a functional analysis of
SGMS2 expression in BT474, including the intracellular
signaling pathway, such as knock down of SGMS mRNA. In addition, we
could not validate whether SM regulates EMT of these cells under
exposure of IR and affects the cell cycle. Therefore, it is
requiring that additional analysis for this issue. Future studies
using this analysis may reveal the relationship between
SGMS2, HER2 and radiosensitivity.
In conclusion, these findings indicate that a higher
dose of IR causes secretion of SM and associated gene expression in
HER2+ breast cancer cells. This molecule may also
function as a marker of radioresistance in cells.
Acknowledgements
Not applicable.
Funding
The present study was supported by KAKENHI, Grants-in-Aid for
Scientific Research (B; grant no. 21H02861), Fund for the Promotion
of Joint International Research (Fostering Joint International
Research; grant no. 17KK0181), Grant-in-Aid for Challenging
Research (Exploratory; grant no. 19K22731) and Takeda Science
Foundation (grant no. 2022-Satoru Monzen).
Availability of data and materials
The data generated in the present study may be
requested from the corresponding author.
Authors' contributions
MK and SM designed the study, drafted the manuscript
and actively participated in its revision. MK, SM, MH, ST, YT, AW
and YM examined and analyzed the experimental data. MK, SM and MH
confirmed the authenticity of all the raw data. SM, AW and YM
oversaw the study, critically reviewed the manuscript, and gave
final approval of the version submitted and published. All authors
read and approved the final version of the manuscript.
Ethics approval and consent to
participate
Not applicable.
Patient consent for publication
Not applicable.
Competing interests
The authors declare that they have no competing
interests.
References
|
1
|
International Agency for Research on
Cancer, . Cancer Today- Age-Standardized Rate (World) per 100 000,
Incidence, Both sexes, in 2022. https://gco.iarc.fr/today/en/dataviz/bars?mode=cancer&group_populations=1July
27–2024
|
|
2
|
Sung H, Ferlay J, Siegel RL, Laversanne M,
Soerjomataram I, Jemal A and Bray F: Global cancer statistics 2020:
GLOBOCAN estimates of incidence and mortality worldwide for 36
cancers in 185 countries. CA Cancer J Clin. 71:209–249. 2021.
View Article : Google Scholar : PubMed/NCBI
|
|
3
|
Siegel RL, Miller KD, Wagle NS and Jemal
A: Cancer statistics, 2023. CA Cancer J Clin. 73:17–48. 2023.
View Article : Google Scholar : PubMed/NCBI
|
|
4
|
Cancer Registry and Statistics, . Cancer
Information Service, National Cancer Center, Japan. (Survival).
https://ganjoho.jp/en/professional/statistics/table_download.htmlJanuary
15–2024
|
|
5
|
Shaath H, Elango R and Alajez NM:
Molecular classification of breast cancer utilizing long non-coding
RNA (lncRNA) transcriptomes identifies novel diagnostic lncRNA
panel for triple-negative breast cancer. Cancers (Basel).
13:53502021. View Article : Google Scholar : PubMed/NCBI
|
|
6
|
Vaz-Luis I, Winer EP and Lin NU: Human
epidermal growth factor receptor-2-positive breast cancer: Does
estrogen receptor status define two distinct subtypes? Ann Oncol.
24:283–291. 2013. View Article : Google Scholar : PubMed/NCBI
|
|
7
|
Iqbal N and Iqbal N: Human epidermal
growth factor receptor 2 (HER2) in cancers: Overexpression and
therapeutic implications. Mol Biol Int. 2014:8527482014. View Article : Google Scholar : PubMed/NCBI
|
|
8
|
National Center for Biotechnology
Information, . ERBB2 erb-b2 receptor tyrosine kinase 2 [Homo
sapiens (human)] Gene ID: 2064. January 15–2023
|
|
9
|
Monzen S, Tatara Y, Mariya Y, Chiba M,
Wojcik A and Lundholm L: HER2-positive breast cancer that resists
therapeutic drugs and ionizing radiation releases
sphingomyelin-based molecules to circulating blood serum. Mol Clin
Oncol. 13:702020. View Article : Google Scholar : PubMed/NCBI
|
|
10
|
Bataller M, Sánchez-García A, Garcia-Mayea
Y, Mir C, Rodriguez I and Lleonart ME: The role of sphingolipids
metabolism in cancer drug resistance. Front Oncol. 11:8076362021.
View Article : Google Scholar : PubMed/NCBI
|
|
11
|
Yuan JS, Wang D and Stewart CN Jr:
Statistical methods for efficiency adjusted real-time PCR
quantification. Biotechnol J. 3:112–123. 2008. View Article : Google Scholar : PubMed/NCBI
|
|
12
|
Livak KJ and Schmittgen TD: Analysis of
relative gene expression data using real-time quantitative PCR and
the 2(−Delta Delta C(T)) method. Methods. 25:402–408. 2001.
View Article : Google Scholar : PubMed/NCBI
|
|
13
|
Untergasser A, Cutcutache I, Koressaar T,
Ye J, Faircloth BC, Remm M and Rozen SG: Primer3-new capabilities
and interfaces. Nucleic Acids Res. 40:e1152012. View Article : Google Scholar : PubMed/NCBI
|
|
14
|
Hall EJ: Radiobiology for the Radiologist.
5th edition. Lippincott Williams and Wilkins; Philadelphia, PA: pp.
136–143. 2000
|
|
15
|
Matt S and Hofmann TG: The DNA
damage-induced cell death response: A roadmap to kill cancer cells.
Cell Mol Life Sci. 73:2829–2850. 2016. View Article : Google Scholar : PubMed/NCBI
|
|
16
|
Maragheh BFA, Fatourachi P, Mohammadi SM,
Valipour B, Behtari M, Dehnad A and Charoudeh HN: Streptomyces
levis ABRIINW111 Inhibits SW480 cells growth by apoptosis
induction. Adv Pharm Bull. 8:675–682. 2018. View Article : Google Scholar : PubMed/NCBI
|
|
17
|
Holloway RW and Marignani PA: Targeting
mTOR and glycolysis in HER2-positive breast cancer. Cancers
(Basel). 13:29222021. View Article : Google Scholar : PubMed/NCBI
|
|
18
|
Duru N, Fan M, Candas D, Menaa C, Liu HC,
Nantajit D, Wen Y, Xiao K, Eldridge A, Chromy BA, et al:
HER2-associated radioresistance of breast cancer stem cells
isolated from HER2-negative breast cancer cells. Clin Cancer Res.
18:6634–6647. 2012. View Article : Google Scholar : PubMed/NCBI
|
|
19
|
Hou J, Zhou Z, Chen X, Zhao R, Yang Z, Wei
N, Ni Q, Feng Y, Yu X, Ma J and Guo X: HER2 reduces breast cancer
radiosensitivity by activating focal adhesion kinase in vitro and
in vivo. Oncotarget. 7:45186–45198. 2016. View Article : Google Scholar : PubMed/NCBI
|
|
20
|
Candas-Green D, Xie B, Huang J, Fan M,
Wang A, Menaa C, Zhang Y, Zhang L, Jing D, Azghadi S, et al: Dual
blockade of CD47 and HER2 eliminates radioresistant breast cancer
cells. Nat Commun. 11:45912020. View Article : Google Scholar : PubMed/NCBI
|
|
21
|
Gray M, Turnbull AK, Ward C, Meehan J,
Martínez-Pérez C, Bonello M, Pang LY, Langdon SP, Kunkler IH,
Murray A and Argyle D: Development and characterisation of acquired
radioresistant breast cancer cell lines. Radiat Oncol. 14:642019.
View Article : Google Scholar : PubMed/NCBI
|
|
22
|
Cao N, Li S, Wang Z, Ahmed KM, Degnan ME,
Fan M, Dynlacht JR and Li JJ: NF-kappaB-mediated HER2
overexpression in radiation-adaptive resistance. Radiat Res.
171:9–21. 2009. View
Article : Google Scholar : PubMed/NCBI
|
|
23
|
Duru N, Candas D, Jiang G and Li JJ:
Breast cancer adaptive resistance: HER2 and cancer stem cell
repopulation in a heterogeneous tumor society. J Cancer Res Clin
Oncol. 140:1–14. 2014. View Article : Google Scholar : PubMed/NCBI
|
|
24
|
No M, Choi EJ and Kim IA: Targeting HER2
signaling pathway for radiosensitization: Alternative strategy for
therapeutic resistance. Cancer Biol Ther. 8:2351–2361. 2009.
View Article : Google Scholar : PubMed/NCBI
|
|
25
|
Slotte JP: Biological functions of
sphingomyelins. Prog Lipid Res. 52:424–437. 2013. View Article : Google Scholar : PubMed/NCBI
|
|
26
|
Bilal F, Montfort A, Gilhodes J, Garcia V,
Riond J, Carpentier S, Filleron T, Colacios C, Levade T, Daher A,
et al: Sphingomyelin synthase 1 (SMS1) downregulation is associated
with sphingolipid reprogramming and a worse prognosis in melanoma.
Front Pharmacol. 10:4432019. View Article : Google Scholar : PubMed/NCBI
|
|
27
|
Zheng K, Chen Z, Feng H, Chen Y, Zhang C,
Yu J, Luo Y, Zhao L, Jiang X and Shi F: Sphingomyelin synthase 2
promotes an aggressive breast cancer phenotype by disrupting the
homoeostasis of ceramide and sphingomyelin. Cell Death Dis.
10:1572019. View Article : Google Scholar : PubMed/NCBI
|
|
28
|
Park J, Choi J, Cho I and Sheen YY:
Radiotherapy-induced oxidative stress and fibrosis in breast cancer
are suppressed by vactosertib, a novel, orally bioavailable
TGF-β/ALK5 inhibitor. Sci Rep. 12:161042022. View Article : Google Scholar : PubMed/NCBI
|
|
29
|
Long X, Liu X, Deng T, Chen J, Lan J,
Zhang S, Zhou M, Guo D and Zhou J: LARP6 suppresses colorectal
cancer progression through ZNF267/SGMS2-mediated imbalance of
sphingomyelin synthesis. J Exp Clin Cancer Res. 42:332023.
View Article : Google Scholar : PubMed/NCBI
|
|
30
|
Kozar N, Kruusmaa K, Bitenc M, Argamasilla
R, Adsuar A, Goswami N, Arko D and Takač I: Data on metabolomic
profiling of ovarian cancer patients' serum for potential
diagnostic biomarkers. Data Brief. 18:1825–1831. 2018. View Article : Google Scholar : PubMed/NCBI
|