Introduction
Prostate cancer (PCa) is one of the most common
malignant tumors in men (1). In
2021, ~248,530 new PCa cases were diagnosed and ~34,130 male
patients died from PCa in the United States, according to the
National Cancer Institute (2).
Surgical resection can only effectively treat PCa at the early
stages (3); however, in most cases,
patients are not suiTable for surgical treatment due to being
diagnosed at an advanced stage. The treatment options for the
middle and advanced stages of PCa include chemotherapy, endocrine
therapy and radiotherapy (4).
Despite these treatments being performed in the early stages,
numerous patients face the risk of resistance to treatment and
biochemical recurrence (BCR) (4).
BCR occurs in 15–45% of treated patients (5), and it affects both patient survival
and quality of life. Early identification of the patients at a high
risk of BCR serves an essential role in improving patient
prognosis.
Copper, an essential trace element with oxidative
and essential biological properties, is the third most abundant
transition metal ion (6). Copper is
a critical cofactor in a number of metalloproteins; hence, a
comprehensive biological system for balancing copper concentration
is essential. Copper deficiency or excess are known causes of
Wilson and Menkes diseases, respectively, and copper concentration
in cancer cells is higher than that in normal cells (7,8).
Cuproptosis, a unique mode of cell death resulting from copper
accumulation in cells, was recently introduced by the Harvard-MIT
Broad Institute (9). This form of
cell death differs from the currently known signaling cascades and
molecularly defined effector mechanisms of cell death, such as
necroptosis, pyroptosis and apoptosis (10). Copper binds to DLAT, resulting in
its oligomerization and reduced lipid acylation leading to reduced
Fe-S cluster proteins, glutathione depletion and decreased
mitochondrial respiration levels (9). In contrast to the Warburg effect,
cancerous prostate tissue increases mitochondrial energy metabolism
(11). Exploring copper-related
genes may provide a strategy for identifying novel biomarkers for
PCa prognosis and treatment.
Long non-coding RNA (lncRNA) is a non-coding RNA
molecule that consists of >200 nucleotides (12). In addition to transcriptional,
silencing, chromosome modification and intranuclear transport
functions, lncRNAs can reprogram the energy metabolism of cancer
cells (13). Previous studies have
suggested that lncRNAs may function as biomarkers for several
malignancies, including hepatocellular carcinoma, lung cancer and
PCa (14–16). lncRNAs serve a critical role in PCa
proliferation (17), docetaxel and
enzalutamide resistance (18,19),
bone metastasis (20) and energy
metabolism (21). Shang et
al (22) reported that the
lncRNA PCAT1 can activate the AKT and NF-κB signaling pathways in
castration-resistant PCa.
For PCa, BCR risk prediction is mainly based on
clinicopathological parameters, including prostate-specific antigen
(PSA), Gleason score, tumor pathology and T stage (23,24).
The classification of the BCR risk population based on the Gleason
score and PSA doubling time, as recommended by the European
Association of Urology guidelines, is not highly accurate for
predicting the clinical outcome of patients (25). Therefore, the existing strategies
for assessing the risk of BCR in patients with PCa based on
clinicopathological parameters need to be further optimized.
Inappropriate risk assessment may lead to overtreatment, a waste of
medical resources and can increase the economic burden of patients.
Due to the rapid development of sequencing technology, biomarker
identification based on DNA, RNA or protein is becoming
increasingly important in the diagnosis, treatment and prognosis of
diseases (26,27). Notably, cuproptosis is closely
related to cancer development, and an increasing number of studies
have shown that lncRNA can be used as an essential marker of
diagnosis, prognosis and treatment in tumors (15,28,29);
therefore, the construction of a signature based on
cuproptosis-related lncRNAs (CRLs) to predict the prognosis of
patients with PCa, especially BCR, was investigated. The aim of the
present study was to construct a CRL signature for predicting the
BCR of patients with PCa, and to explore the predictive accuracy of
this signature.
Materials and methods
Data collection
Using The Cancer Genome Atlas Prostate
Adenocarcinoma (TCGA-PRAD) dataset, the transcriptomic (Tpm) and
gene mutation data (originating from the ‘simple nucleotide
variation’ file), and the clinical information of 497 patients with
PCa were extracted (https://portal.gdc.cancer.gov). Next, those patients
with PCa who satisfied the following criteria were included in the
present study: i) Patients with clear BCR data, including the BCR
status and time; and ii) patients with complete and clear follow-up
data. To minimize information and statistical biases, the following
exclusion criteria were applied: i) Patient follow up time was
<30 days; and ii) patients without clear BCR and follow-up data.
Finally, 418 patients with PCa were included in the current study.
A total of 19 cuproptosis-related genes (CRGs) were obtained from
published research (30–35).
Construction of the CRL signature
lncRNAs associated with cuproptosis were identified
using Pearson's correlation coefficient, with cut-off criteria of
P<0.001 and |R|>0.3. A Sankey diagram was drawn through R
package ‘ggalluvial’ (http://corybrunson.github.io/ggalluvial/) and
‘ggplot2’ (https://ggplot2.tidyverse.org) to show the correlation
between lncRNA and CRGs. For the purpose of constructing and
validating a predictive signature correlated with the BCR-free
survival (BFS) of patients with PCa, a ratio of 7:3 was applied to
divide the 418 samples into training and testing sets [training set
(n=295) and testing set (n=123)]. All samples were identified as
the entire set. The clinicopathological data of the three sets
(training set, testing set and entire set) are described in
Table I. To identify the
association of CRLs with the BFS of patients with PCa, univariate
Cox regression analysis was used. Those lncRNAs with P<0.05 were
subjected to least absolute shrinkage and selection operator
(LASSO) regression analysis. Subsequently, the R package ‘glmnet’
(https://glmnet.stanford.edu) was used to
lower the risk of overfitting with LASSO regression. To select the
final candidates and construct the signature, a stepwise
multivariate Cox regression analysis was used. lncRNAs with
P<0.05 were identified as the final genes. The validation was
performed on both the testing and the entire sets. Using the
following formula, the risk of every patient with PCa was computed.
The formula was as follows: Risk
score=(LINC01515×1.4055761678005+AC090198.1×0.171855258101095+AC087276.2×-1.75799460466145+AC138207.5×0.130718896321139+CNNM3-DTx0.0800687027705137+METTL14-DTx3.13564874470709).
 | Table I.Clinicopathological characteristics
of selected patients with prostate cancer in the training set,
testing set and entire set. |
Table I.
Clinicopathological characteristics
of selected patients with prostate cancer in the training set,
testing set and entire set.
| Clinical
characteristic | Training set
(%) | Testing set
(%) | Entire set (%) | P-value |
|---|
| Age, years |
|
|
| 0.562 |
|
≤65 | 210 (71.19) | 91 (73.98) | 301 (72.01) |
|
|
>65 | 85 (28.81) | 32 (26.02) | 117 (27.99) |
|
| cT stage |
|
|
| 0.159 |
| T1 | 102 (34.58) | 48 (39.02) | 150 (35.89) |
|
| T2 | 105 (35.59) | 47 (38.21) | 152 (36.36) |
|
| T3 | 39 (13.22) | 8 (6.50) | 47 (11.24) |
|
| T4 | 0 (0.00) | 1 (0.81) | 1 (0.24) |
|
|
Unknown | 49 (16.61) | 19 (15.45) | 68 (16.27) |
|
| pN stage |
|
|
| 0.876 |
| N0 | 209 (70.85) | 89 (72.36) | 298 (71.29) |
|
| N1 | 47 (15.93) | 20 (16.26) | 67 (16.03) |
|
|
Unknown | 39 (13.22) | 14 (11.38) | 53 (12.68) |
|
| pT stage |
|
|
| 0.073 |
| T2 | 96 (32.54) | 55 (44.72) | 151 (36.12) |
|
| T3 | 191 (64.75) | 64 (52.03) | 255 (61.00) |
|
| T4 | 5 (1.69) | 2 (1.63) | 7 (1.67) |
|
|
Unknown | 3 (1.02) | 2 (1.63) | 5 (1.20) |
|
| Gleason score |
|
|
| 0.634 |
| 6 | 28 (9.49) | 9 (7.32) | 37 (8.85) |
|
| 7 | 139 (47.12) | 64 (52.03) | 203 (48.56) |
|
| 8 | 38 (12.88) | 19 (15.45) | 57 (13.64) |
|
| 9 | 87 (29.49) | 31 (25.2) | 118 (28.23) |
|
| 10 | 3 (1.02) | 0 (0) | 3 (0.72) |
|
Validation of the 6-CRL signature in
testing and entire sets
Depending on their median risk scores, the patients
were categorized into high- and low-risk groups. Kaplan-Meier (K-M)
survival curves were analyzed using the R package ‘survival’
(https://github.com/therneau/survival)
to estimate differences in BFS between the two groups. The R
packages ‘Rtsne’ (https://lvdmaaten.github.io/tsne/), ‘timeROC’
(https://CRAN.R-project.org/package=timeROC) and
‘survival’ were used to conduct principal component analysis and
time-dependent receiver operating characteristic (ROC) curve
analysis, to assess the stability and accuracy of the signature.
Additionally, the R packages ‘rms’ (https://hbiostat.org/R/rms/), and ‘pec’ (https://CRAN.R-project.org/package=pec)
were used to conduct conformance index (C-index) analysis.
Independent prognostic analysis
To identify the independent prognostic indicators
associated with the BFS of patients with PCa, univariate and
multivariate Cox regression analyses were carried out.
Subset group K-M survival analysis for
BFS
A stratified analysis was conducted to examine if
the signature maintained predictive capacity across subgroups (age,
and pathological and clinical T-stage) using the ‘survival’ R
package.
Construction and evaluation of a
nomogram
A nomogram was developed to predict 1-, 3- and
5-year BFS using the R software ‘regplot’ package (https://CRAN.R-project.org/package=regplot). The
prognostic accuracy was evaluated using the ROC and calibration
curve analyses.
Functional enrichment analysis and
immune analysis
The ‘limma’ R package (https://bioinf.wehi.edu.au/limma/) was used to conduct
a differential expression analysis between high- and low-risk
samples (criteria: |log2 fold change|>1 and P<0.05). The
‘Clusterfiler’ R package (https://yulab-smu.top/biomedical-knowledge-mining-book)
was used to perform Gene Ontology (GO) and Kyoto Encyclopedia of
Genes and Genomes (KEGG) enrichment analyses with the significance
threshold set at P<0.05. The R packages ‘GOplot’ (https://github.com/wencke/wencke.github.io) and
‘ggplot2’ (https://github.com/tidyverse/ggplot2) were used to
present the enrichment analysis results.
In order to evaluate the difference of immune cell
infiltration between high- and low-risk PCa samples, the CIBERSORT
algorithm was applied to analyze the infiltration of 22 types of
immune cells in PCa samples (36).
By reviewing the literature, it was revealed that researchers
analyzed these 22 types of immune cells; therefore, these 22 immune
cells were selected for the present study (37–39).
The ‘ggpubr’ package (https://rpkgs.datanovia.com/ggpubr/) was used to draw
boxplots. To evaluate the reactivity of immunotherapy in different
risk groups, the tumor immune dysfunction and exclusion (TIDE)
score files of PCa were obtained from the TIDE website (http://tide.dfci.harvard.edu/) (40), showing the difference in TIDE score
between high- and low-risk groups.
Tumor mutational burden (TMB)
analysis
The ‘maftools’ package (https://bioconductor.org/packages/release/bioc/vignettes/maftools/inst/doc/maftools.html)
was used to determine the mutation frequency within patients with
PCa in different risk groups. The differential analysis of TMB
between the high- and low-risk group was conducted to determine
whether TMB was related to risk scores. Based on the K-M method,
the BFS rates of patients were compared between the low- and
high-TMB groups.
Drug sensitivity analysis
To calculate the half maximal inhibitory
concentration (IC50) for different drugs, the R packages
‘pRophetic’ (http://genemed.uchicago.edu/~pgeeleher/pRRophetic/)
and ‘ggplot2’ were used. The Wilcoxon rank sum test was applied to
compare the IC50 values between the high- and low-risk
groups.
Cell culture and reverse
transcription-quantitative PCR (RT-qPCR)
The immortalized prostate primary epithelial cell
line RWPE1, and the PCa cell lines PC3 and DU145 were obtained from
the American Type Culture Collection. According to the
manufacturer's instructions, RWPE1 cells were grown in serum-free
keratinocyte medium (ScienCell Research Laboratories, Inc.), PC3
cells were cultured in F12K medium and DU145 cells were cultured in
the RPMI 1640 medium (Gibco; Thermo Fisher Scientific, Inc.). The
aforementioned media were supplemented with 1%
penicillin/streptomycin and 10% FBS (Shanghai ExCell Biology,
Inc.). Cells were cultured at 37°C and 5% CO2.
TRIzol® (Invitrogen; Thermo Fisher
Scientific, Inc.) was used for RNA extraction. In accordance with
the manufacturer's instructions, a RT kit (Tiangen Biotech Co.,
Ltd.) was used for RT, according to the manufacturer's protocol.
Subsequently, fluorescence qPCR was conducted according to the
manufacturer's instructions using StepOne Plus (Applied Biosystems;
Thermo Fisher Scientific, Inc.) and SYBR Green qPCR Mix (Thermo
Fisher Scientific, Inc.). The primers used for qPCR were obtained
from Sangon Biotech Co., Ltd., and the sequences are shown in
Table II. The thermocycling
conditions used for qPCR were: 30 sec at 95°C for 1 cycle; followed
by 40 cycles at 95°C for 15 sec and 60°C for 30 sec. ACTB was used
as an internal control for normalization, and the 2−ΔΔCq
method was used to calculate the relative mRNA expression (41).
| Table II.Primer sequences of signature long
noncoding RNAs and ACTB. |
Table II.
Primer sequences of signature long
noncoding RNAs and ACTB.
| Primer | Forward sequence,
5′-3′ | Reverse sequence,
5′-3′ |
|---|
| LINC01515 |
GTCCGAAGCAAGACATGTGAC |
GCTAAACTGCCCAGTGGCAT |
| CNNM3-DT |
TCAGCACACTCAATCGCACA |
TTCGTCCACACCTACAGGCT |
| METTL14-DT |
AATCATGGACGATGCTGCCA |
GGAAAGTGAGGTGCTCTCCA |
| AC090198.1 |
CAGCAGCCACAGTTGGAAATC |
TCTCTCGCAAGGGTAGAGGT |
| AC087276.2 |
ACCCTCCAATCTGTATCACTGG |
TCCTTGGCAAAGGTGGTAGC |
| AC138207.5 |
TGAGACAGGGTCTTTGTTGC |
AAATTTCAGGGCTGGACGTG |
| ACTB |
TCTCCCAAGTCCACACAGG |
GGCACGAAGGCTCATCA |
Statistical analysis
R software (version 4.2.0; http://www.r-project.org/) was used to conduct the
bioinformatics analysis. qPCR data were analyzed using GraphPad
Prism (version 9.5; Dotmatics) by one-way ANOVA and Dunnett's
multiple comparisons post hoc test. The χ2 test or
Fisher's exact test was used to statistically analyze the
clinicopathological characteristics between the training and
testing sets. Survival differences between high- and low-risk
groups were assessed using log-rank test. Statistical differences
in quantitative data between high- and low-risk groups were
determined by unpaired Student's t-test. Unless otherwise
indicated, P<0.05 was considered to indicate a statistically
significant difference.
Results
Identification of CRLs
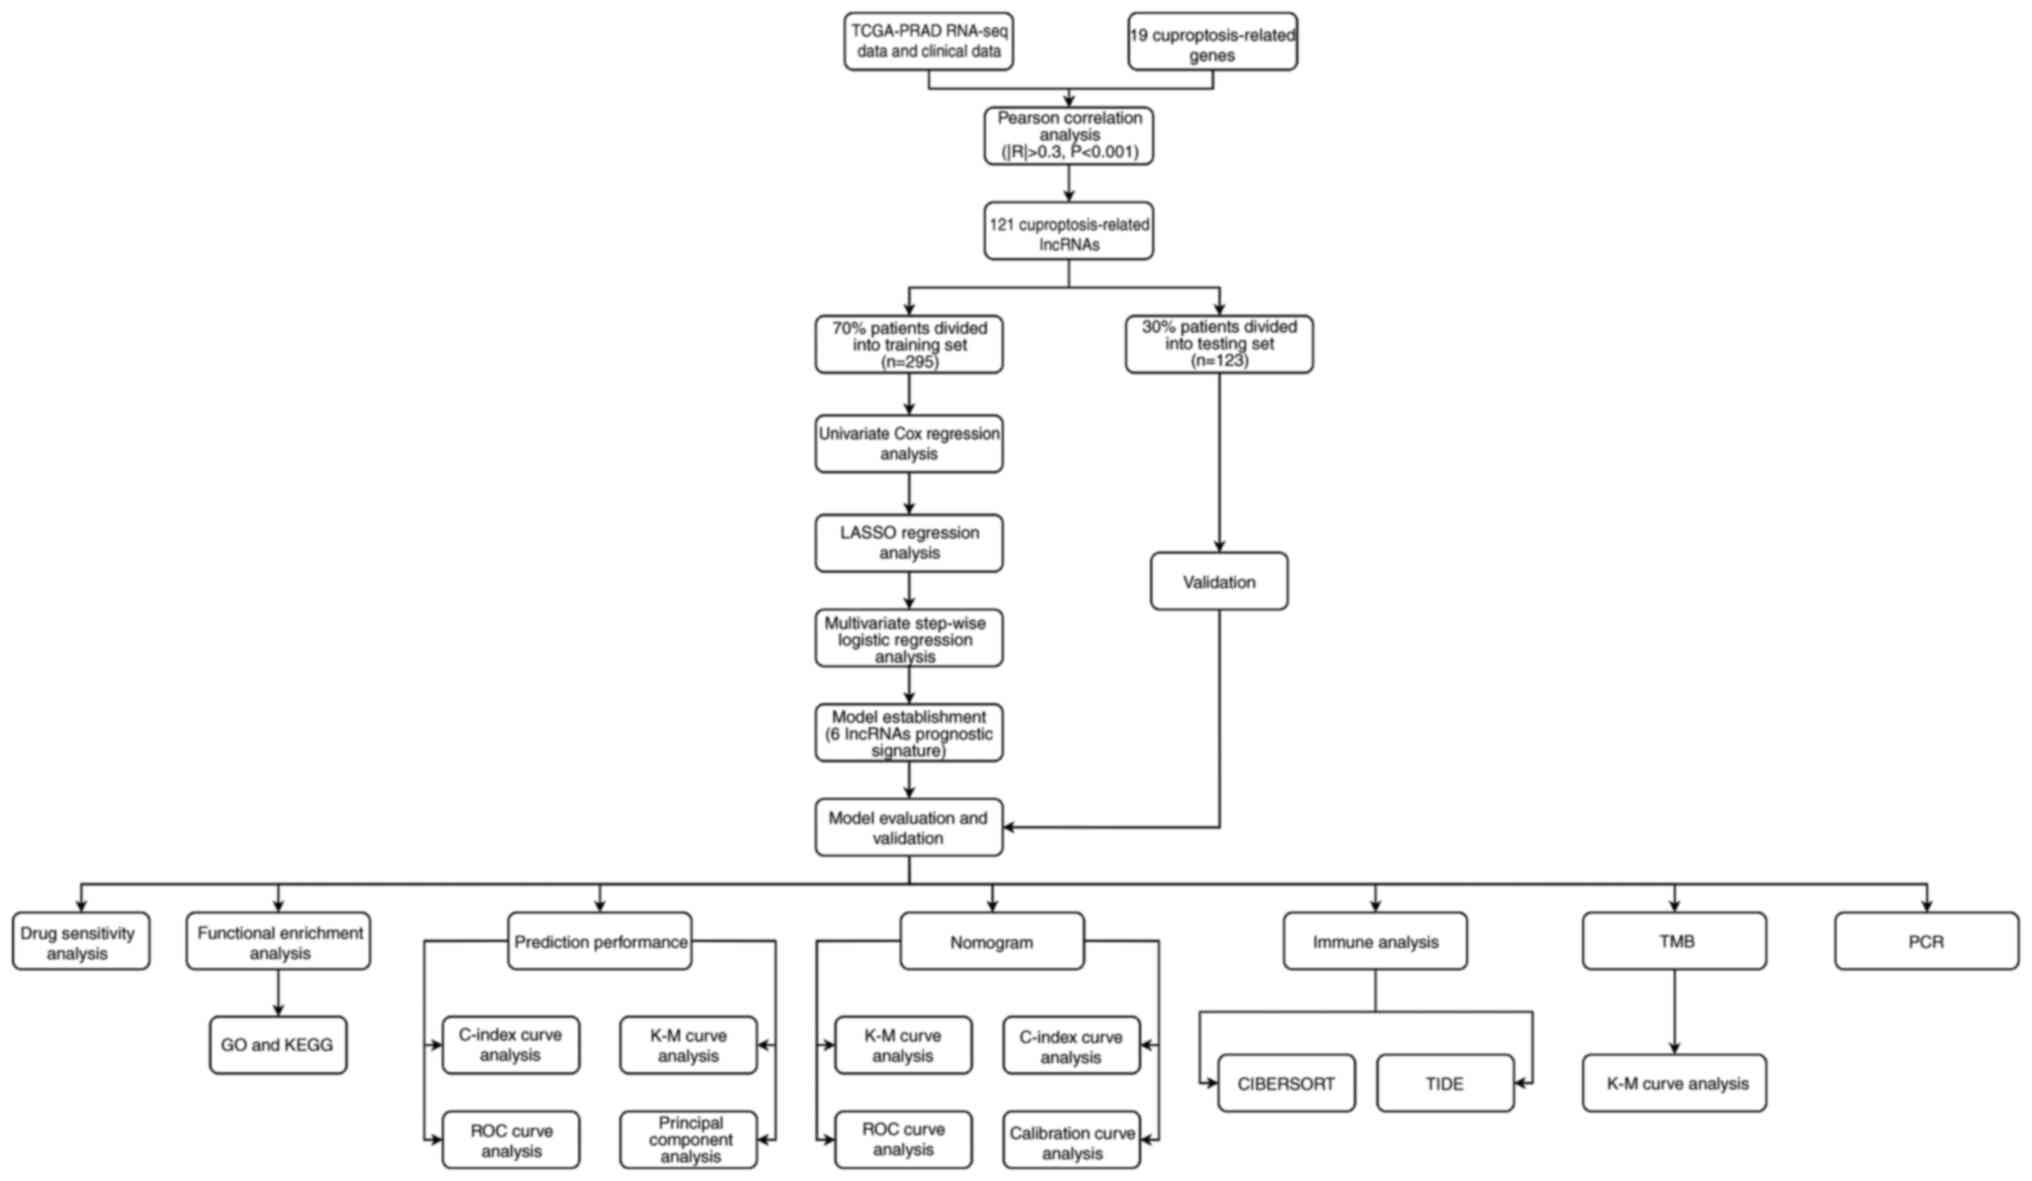
The overall flowchart of the present study is shown
in Fig. 1. Based on the exclusion
criteria, 418 PCa samples were obtained from TCGA database, along
with Tpm and clinical data. The clinical parameters of the selected
patients are given in detail in Table
I. The statistical analysis showed no significant difference
between the training and testing sets regarding clinicopathological
features, including age, clinical T stage, pathological N stage,
pathological T stage and Gleason score. A total of 19 CRGs were
obtained from previous studies (30–35),
and the related gene expression profile was extracted from
TCGA-PRAD dataset. A total of 121 lncRNAs were identified as CRLs
by investigating the association between lncRNAs and CRGs.
Moreover, the internal connections between CRLs and CRGs were
visualized using a Sankey diagram (Fig. S1).
Establishment of the CRL prognostic
signature
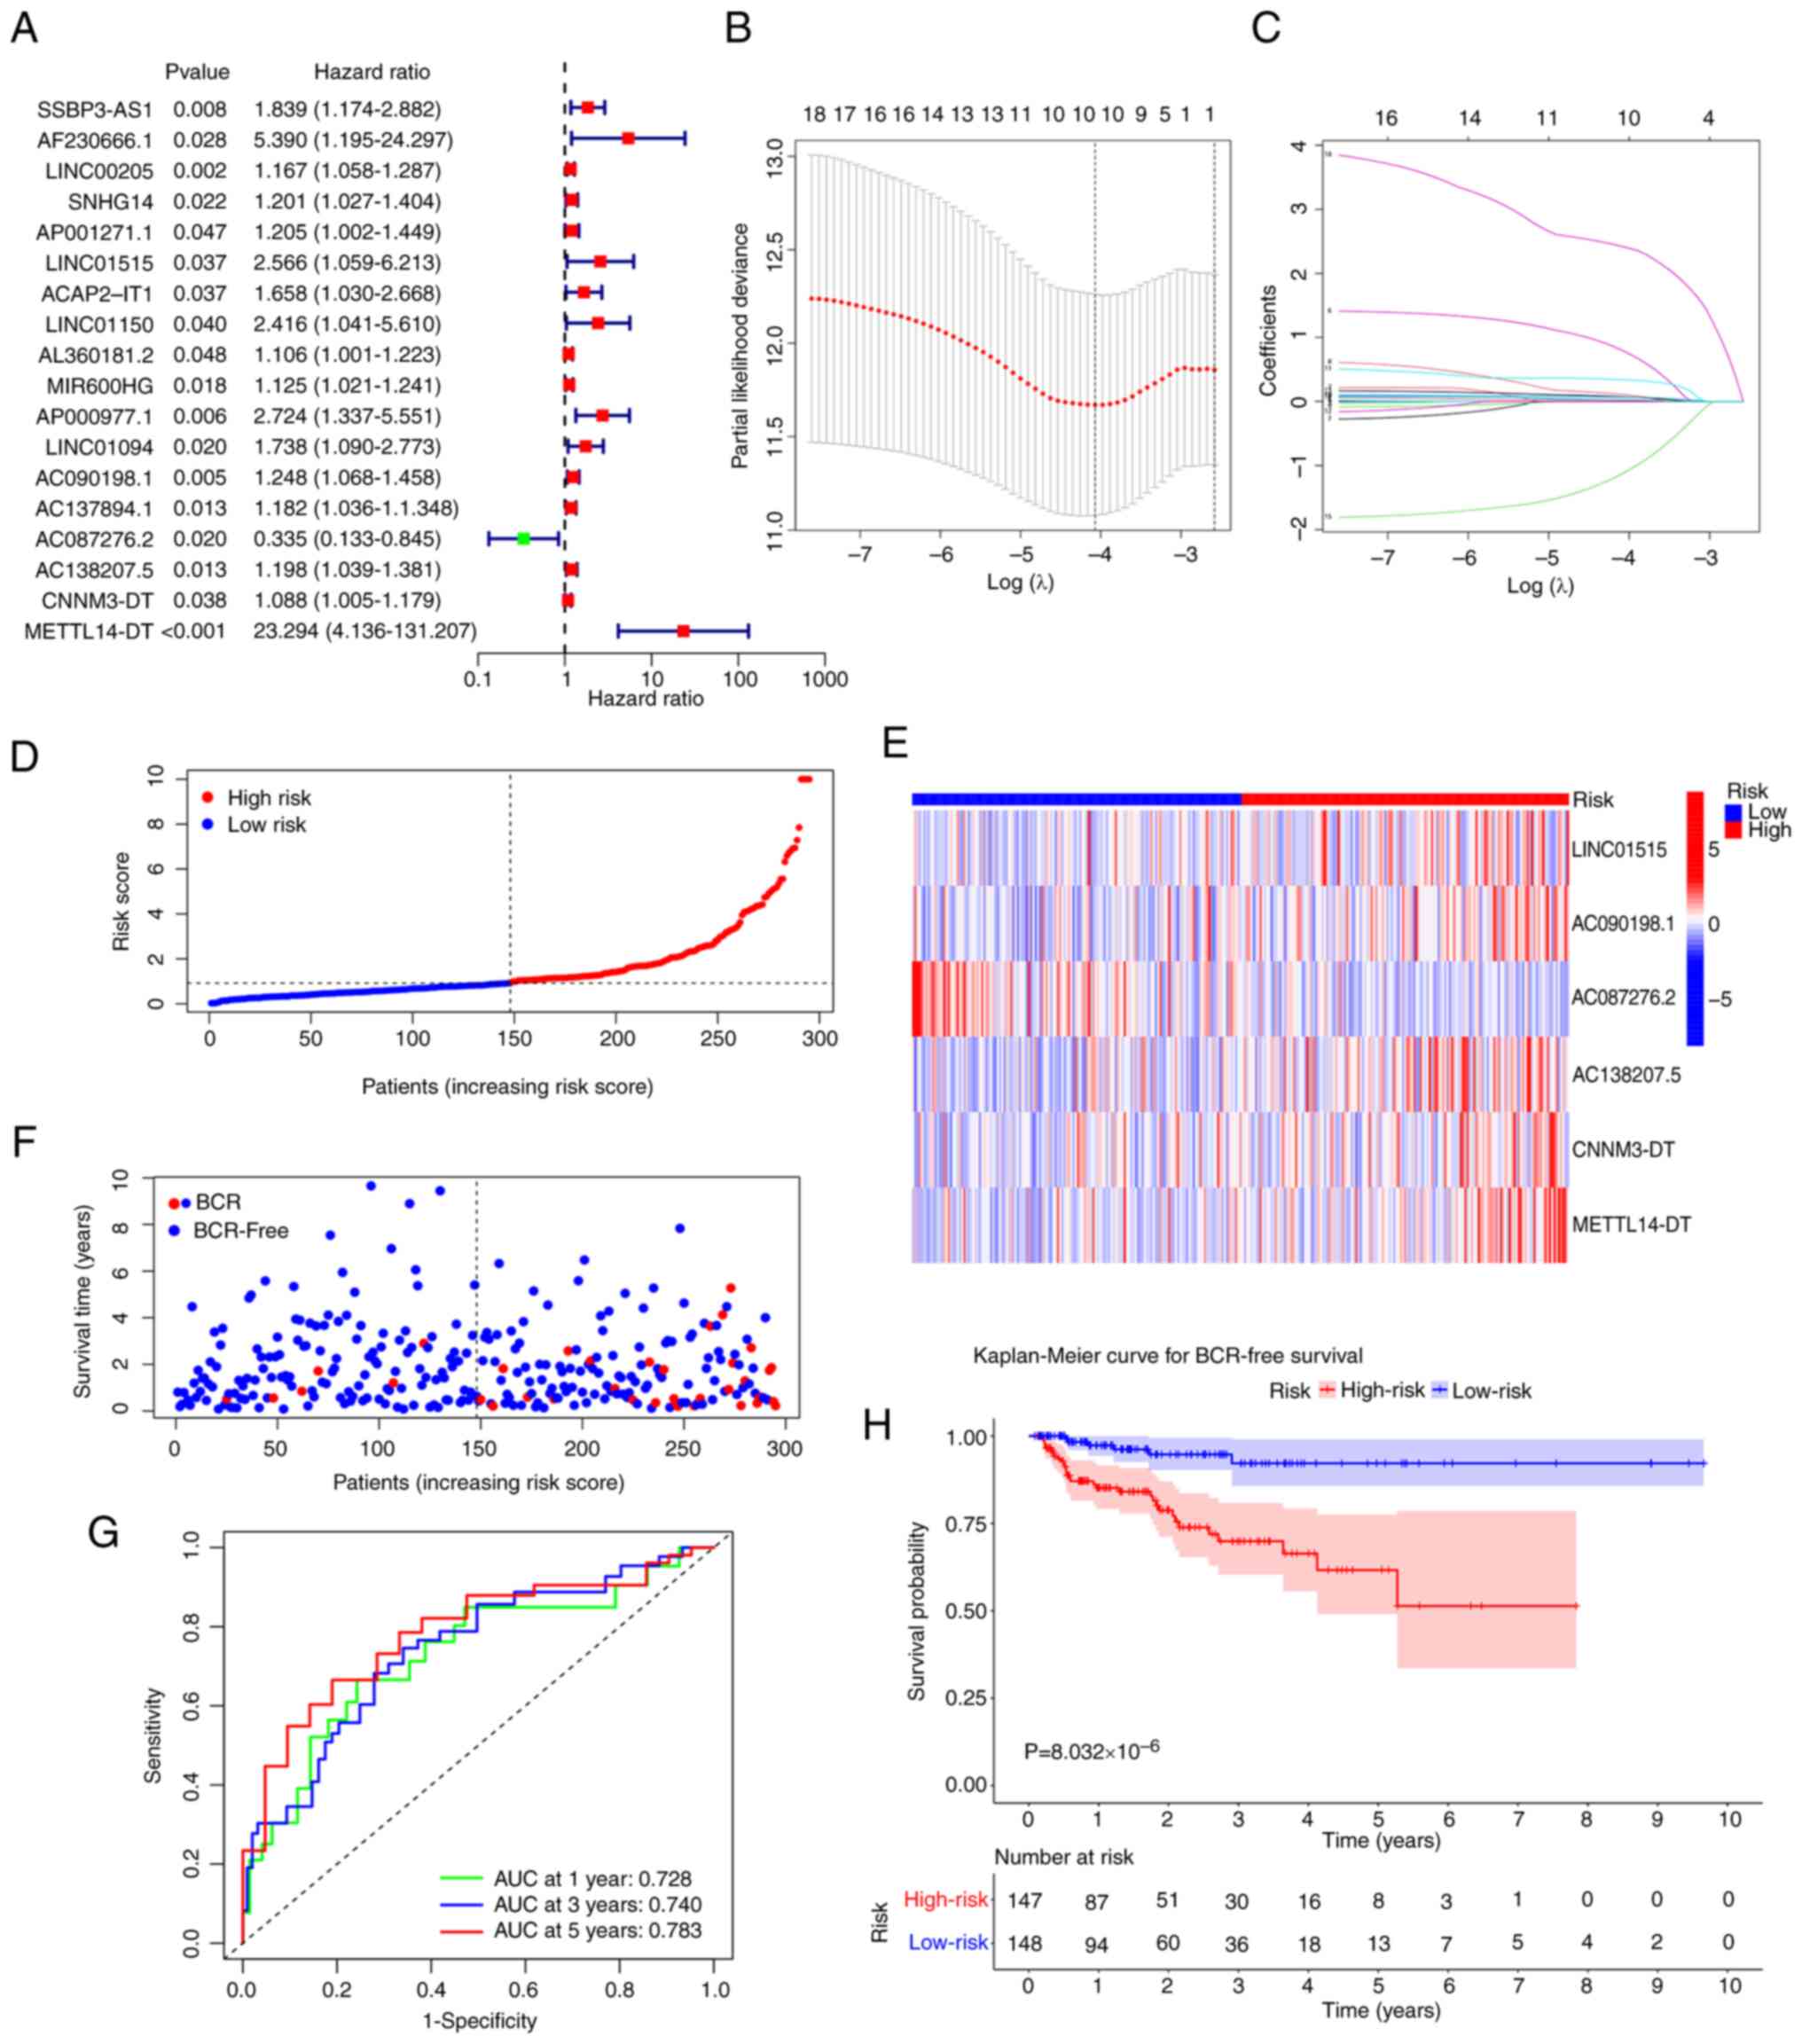
To determine the CRLs associated with the BFS of
patients with PCa, a univariate Cox regression analysis was
conducted, and 18 CRLs were obtained (Fig. 2A). Subsequently, these CRLs were
subjected to LASSO regression analysis (Fig. 2B and C). Finally, six CRLs were
identified and used to build a prognostic signature using step-wise
multivariate Cox regression (Table
III). In TCGA-PRAD dataset, all patients had calculated risk
scores according to the aforementioned signature.
| Table III.Multivariate Cox stepwise regression
analysis of 6 cuproptosis-related long noncoding RNAs associated
with biological recurrence-free survival in patients with prostate
cancer. |
Table III.
Multivariate Cox stepwise regression
analysis of 6 cuproptosis-related long noncoding RNAs associated
with biological recurrence-free survival in patients with prostate
cancer.
| ID | Coefficient | HR | HR.95L | HR.95H | P-value |
|---|
| LINC01515 | 1.405576 | 4.077876 | 1.725672 | 9.636284 | 0.001358 |
| AC090198.1 | 0.171855 | 1.187506 | 0.997997 | 1.413001 | 0.052701 |
| AC087276.2 | −1.75799 | 0.17239 | 0.062314 | 0.476914 | 0.000709 |
| AC138207.5 | 0.130719 | 1.139647 | 0.976757 | 1.329702 | 0.09669 |
| CNNM3-DT | 0.080069 | 1.083361 | 0.985118 | 1.191403 | 0.098774 |
| METTL14-DT | 3.135649 | 23.00355 | 3.594882 | 147.1991 | 0.000929 |
Depending on the median risk score, patients were
categorized into high- and low-risk groups. The distribution of
risk scores for patients with PCa is shown in Fig. 2D. Notably, as the risk score
increased, the BCR rate increased (Fig.
2F). A total of 5/6 signature lncRNAs (LINC01515, AC090198.1,
AC138207.5, CNNM3-DT and METTL14-DT) exhibited increased expression
in the high-risk group compared with in the low-risk group, whereas
AC087276.2 had lower expression (Fig.
2E). The K-M survival analysis revealed that patients at high
risk had a worse BFS rate (P=8.03×10⁻⁶; Fig. 2H). For the 1-, 3- and 5-year BFS of
the signature, the area under the ROC curve (AUC) values were
0.728, 0.740 and 0.783, respectively, which suggested that the
signature accurately predicted the BFS of patients with PCa
(Fig. 2G).
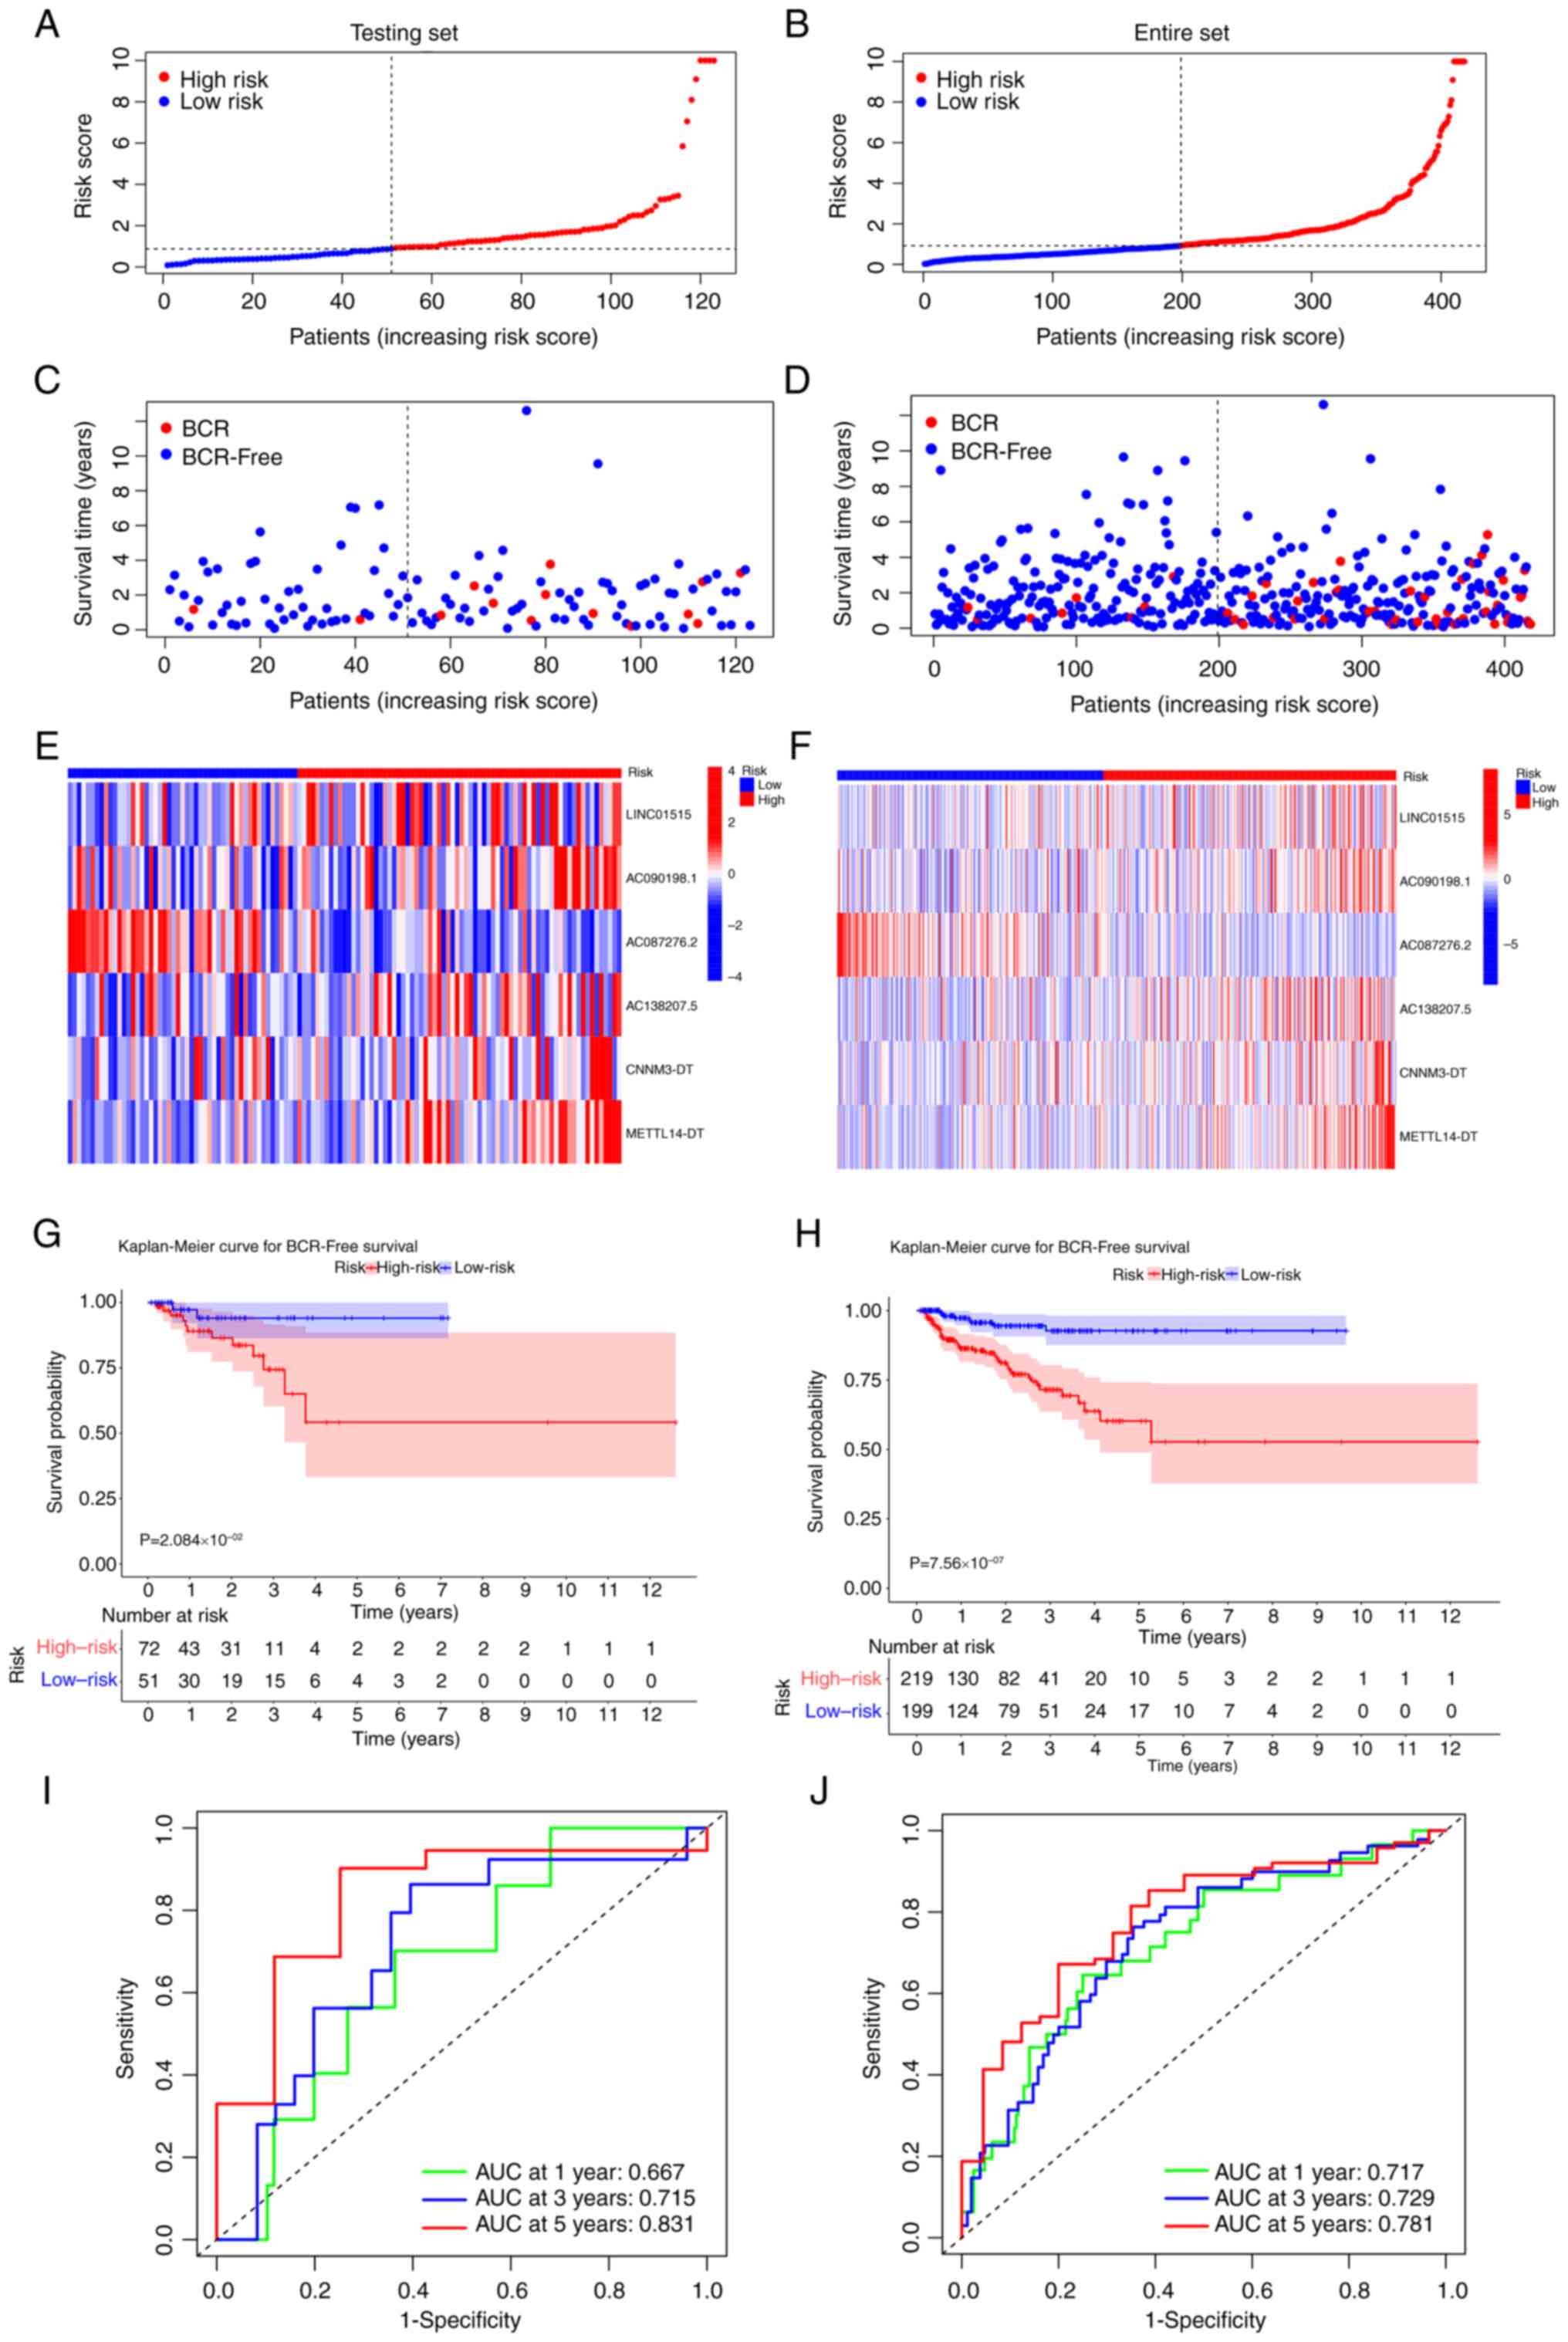
Validation of the CRL signature
The predictive ability of the risk signature was
confirmed in the testing and entire sets. In both sets, the risk
scores of patients with PCa were determined using the same formula,
and the same cut-off value was used to classify patients into high-
and low-risk groups. The risk score and BCR status distribution for
the two sets are shown in Fig.
3A-D. In addition, the expression of the 6-CRL signature genes
in different risk groups in the testing set (Fig. 3E) and entire set (Fig. 3F) was shown through heat maps.
Subsequently, the K-M survival analysis revealed a considerable
difference in the BFS rate between different risk groups (testing
set, P=2.08×10⁻² entire set, P=7.56×10⁻⁷;
Fig. 3G and H).
Moreover, AUCs for the 1-, 3- and 5-year BFS rates
for the testing set were 0.667, 0.715 and 0.831, respectively
(Fig. 3I), while the relevant
values for the entire set were 0.717, 0.729 and 0.781, respectively
(Fig. 3J). Principal component
analysis was conducted to assess if the 6-CRL signature could
identify patients with different risk. It was found that the
signature could clearly distinguish between patients with different
risks across all sets (Fig.
S2A-C). The 6-CRL signature provided excellent performance in
both the testing and entire sets. In addition, the relationship
between the 6-CRL signature lncRNAs and the 19 CRGs is displayed in
Fig. S2D. The results showed that
AC087276.2 was closely related with 15 CRGs, AC090198.1 with 17
CRGs, AC138207.5 with five CRGs, CNNM3-DT with seven CRGs,
LINC01515 with 13 CRGs, and METTL14-DT with 10 CRGs. The lncRNAs
most closely associated with CRGs were AC090198.1, AC087276.2, and
LINC0151515. In addition, the association between the 6-CRL
signature and progression-free survival (PFS) was investigated
using the K-M survival analysis. A lower PFS was found to be
associated with high-risk patients in all sets (Fig. S3A-C). The C-index analysis revealed
that the C-index values of the signature were 0.737, 0.624 and
0.712 in the training, testing and entire sets, respectively
(Table SI). This indicated that
the signature's accuracy was highest in the training set, followed
by the entire set and testing set.
Independent and subgroup analyses
Cox regression analysis was performed in every
dataset. The results showed that the clinical T stage and the 6-CRL
signature were the independent variables related to the BFS of
patients with PCa in the training set; in the testing set, the
clinical T stage and Gleason score were independent factors; in the
entire set, the clinical T stage, Gleason score and the 6-CRL
signature were independent prognostic factors (Table IV).
| Table IV.Cox analysis of the signature and
clinicopathological traits in each set. |
Table IV.
Cox analysis of the signature and
clinicopathological traits in each set.
| A, Training
set |
|---|
|
|---|
|
| Univariate
analysis | Multivariate
analysis |
|---|
|
|
|
|
|---|
| Variable | HR (95% CI) | P-value | HR (95% CI) | P-value |
|---|
| Age | 1.022
(0.972–1.075) | 0.388 | 1.005
(0.955–1.059) | 0.835 |
| Clinical |
|
|
|
|
| T stage | 2.147
(1.337–3.448) | 0.002 | 1.731
(1.009–2.970) | 0.046 |
| Pathological T
stage | 2.414
(1.134–5.139) | 0.022 | 1.400
(0.545–3.595) | 0.484 |
| Pathological |
|
|
|
|
| N stage | 2.005
(0.953–4.215) | 0.067 | 0.972
(0.415–2.277) | 0.949 |
| Gleason score | 1.547 (1.089–
2.198) | 0.014 | 1.243
(0.815–1.895) | 0.313 |
| Risk score | 1.112 (1.070–
1.155) |
4.349×10⁻⁸ | 1.106
(1.063–1.152) |
8.014×10⁻⁷ |
|
| B, Testing
set |
|
|
| Univariate
analysis | Multivariate
analysis |
|
|
|
|
|
Variable | HR (95%
CI) | P-value | HR (95%
CI) | P-value |
|
| Age | 0.993
(0.901–1.094) | 0.885 | 0.942
(0.843–1.053) | 0.296 |
| Clinical |
|
|
|
|
| T stage | 3.241
(1.329–7.905) | 0.010 | 10.017
(2.295–43.718) | 0.002 |
| Pathological T
stage | 4.871
(1.565–15.156) | 0.006 | 1.327
(0.172–10.256) | 0.786 |
| Pathological |
|
|
|
|
| N stage | 3.002
(0.875–10.297) | 0.080 | 0.672
(0.126–3.580) | 0.642 |
| Gleason score | 3.490
(1.587–7.673) | 0.002 | 6.274
(1.789–22.007) | 0.004 |
| Risk score | 1.090
(0.953–1.247) | 0.207 | 1.057
(0.875–1.276) | 0.566 |
|
| C, Entire
set |
|
|
| Univariate
analysis | Multivariate
analysis |
|
|
|
|
|
Variable | HR (95%
CI) | P-value | HR (95%
CI) | P-value |
|
| Age | 1.016
(0.972–1.062) | 0.478 | 0.995
(0.953–1.040) | 0.832 |
| Clinical |
|
|
|
|
| T stage | 2.361
(1.555–3.586) | 5.546e–05 | 1.836
(1.177–2.862) | 0.007 |
| Pathological T
stage | 2.931
(1.584–5.422) | 0.0006 | 1.594
(0.725–3.504) | 0.246 |
| Pathological |
|
|
|
|
| N stage | 2.219
(1.175–4.187) | 0.014 | 0.956
(0.469–1.947) | 0.901 |
| Gleason score | 1.844
(1.349–2.521) | 0.0001 | 1.480
(1.027–2.134) | 0.035 |
| Risk score | 1.111
(1.074–1.150) |
1.308×10⁻⁹ | 1.104
(1.064–1.146) |
1.381×10⁻⁷ |
Moreover, the applicability of the 6-CRL signature
was evaluated by performing a subgroup K-M survival analysis of
clinical characteristics, including pathological T stage, clinical
T stage and age. A worse BFS was observed for patients at high risk
in each subgroup, showing that the signature had good applicability
in all patients at early and advanced stages (Fig. S3D-I).
Construction and evaluation of a
nomogram
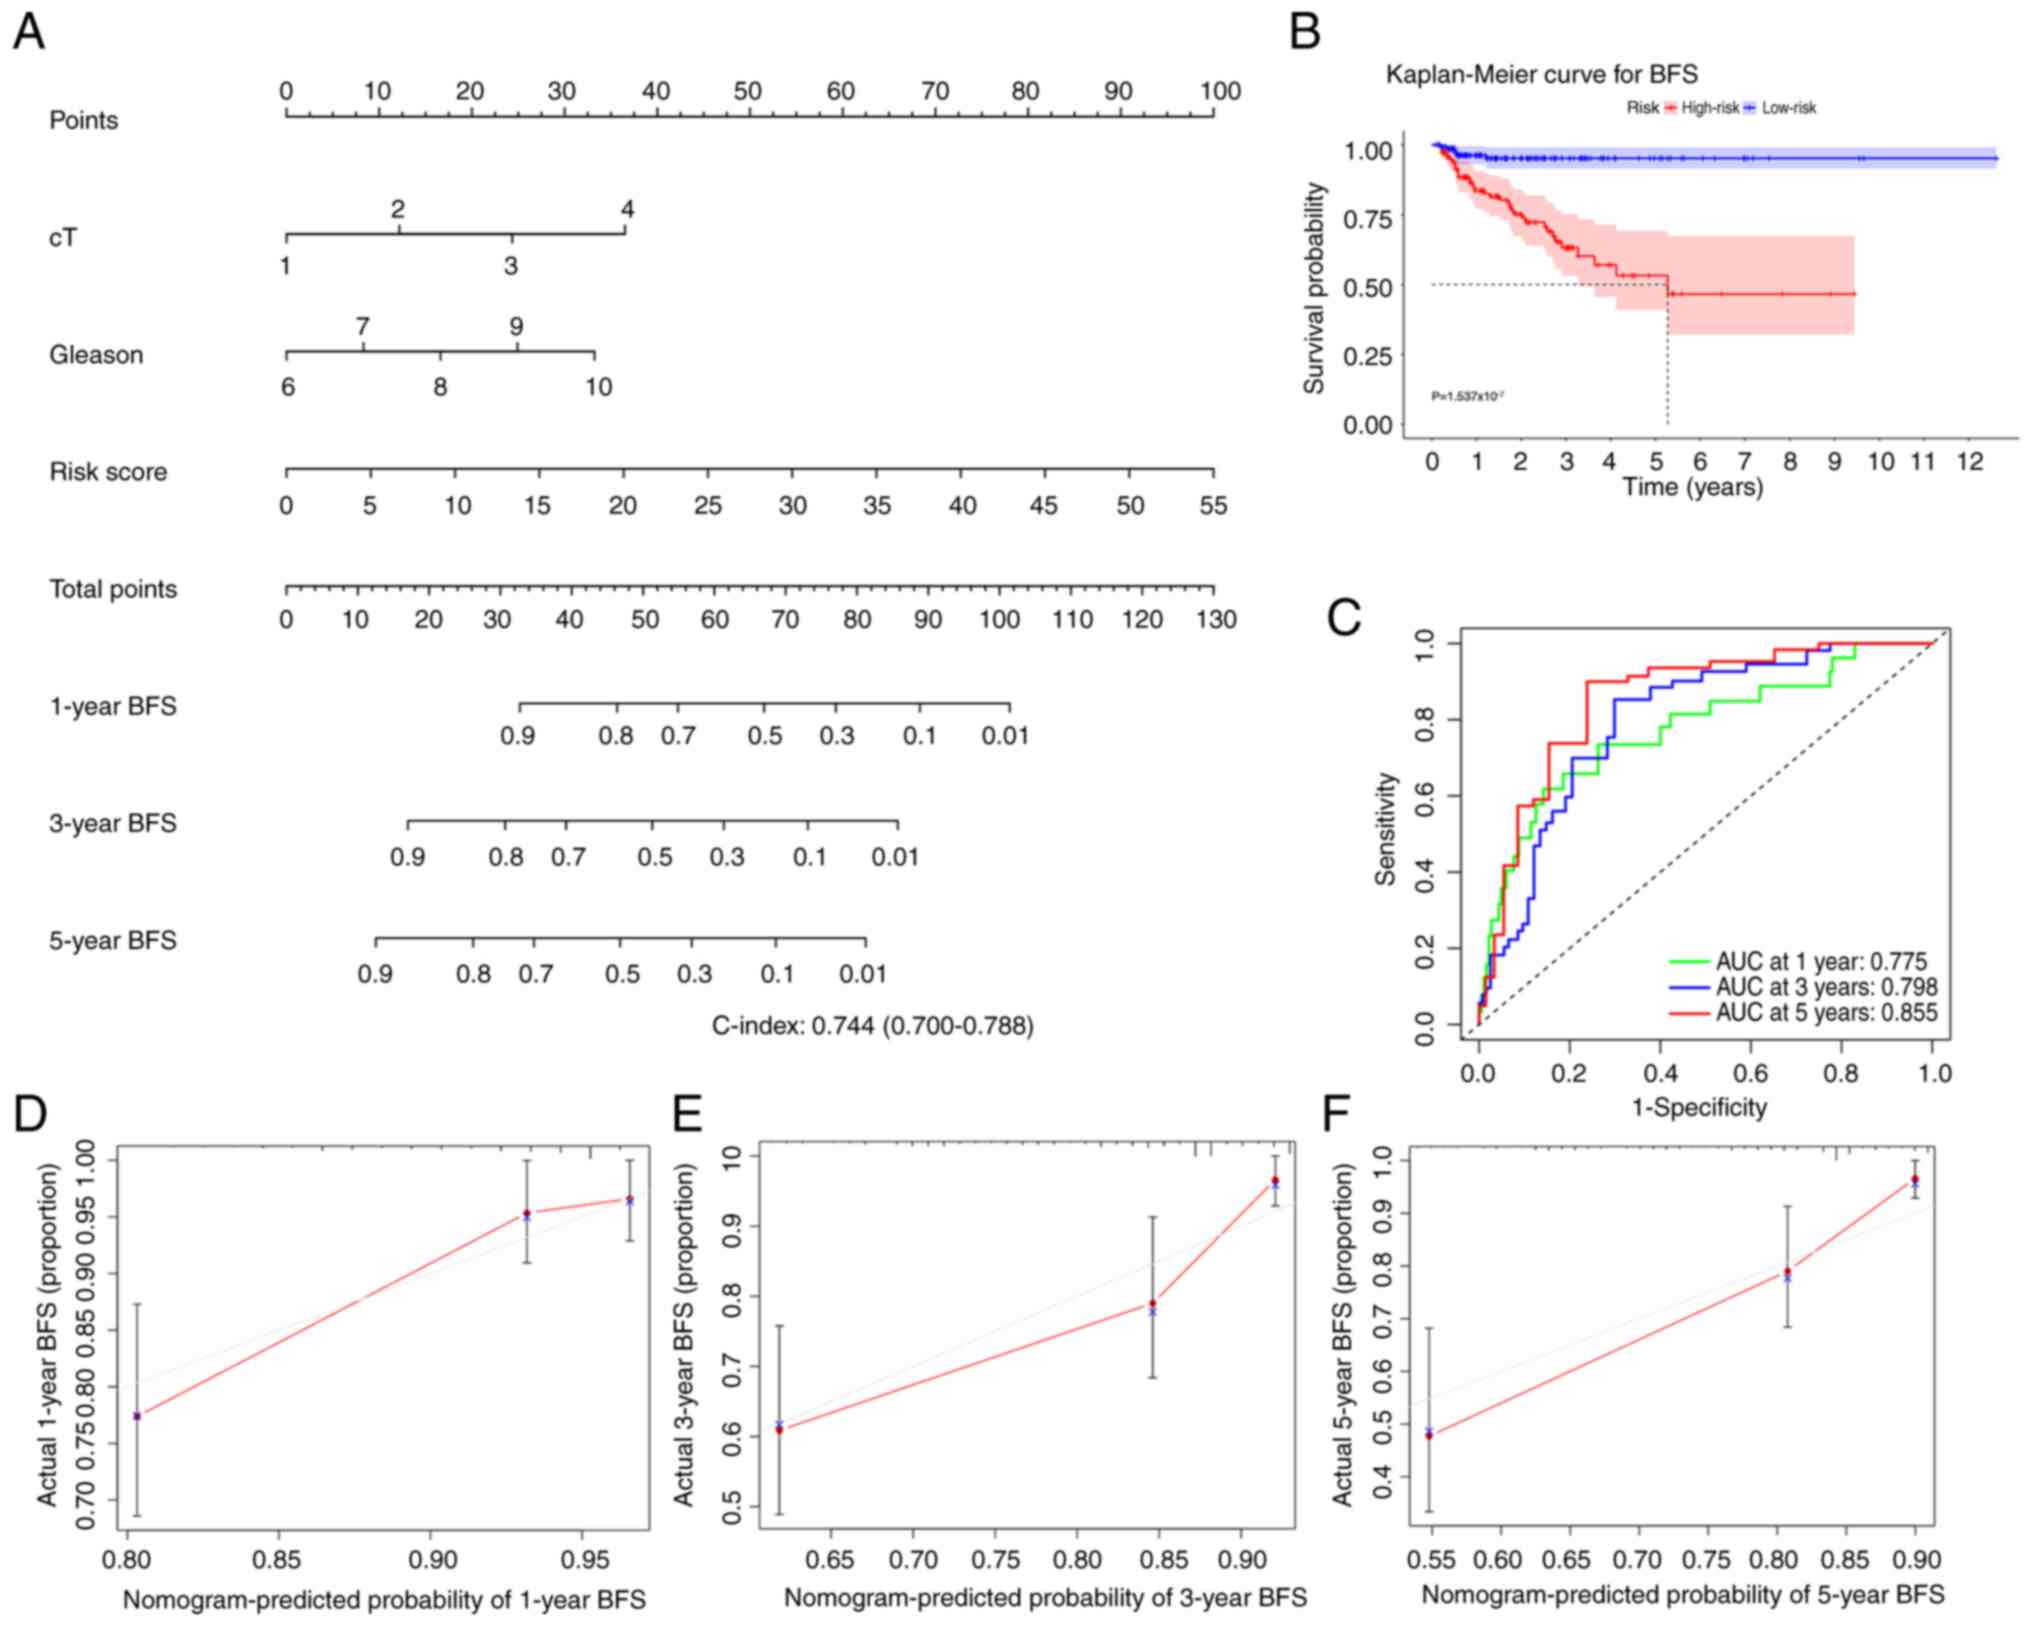
To predict the 1-, 3- and 5-year BFS rates for
patients with PCa, a nomogram containing risk and Gleason scores,
and clinical T stages was developed (Fig. 4A). The K-M analysis implicated that
patients with high risk evaluated by the nomogram had a poorer
prognosis than those with low risk (Fig. 4B). C-index and time-dependent ROC
curve analysis were applied to assess the prediction accuracy of
the nomogram. The findings demonstrated that the 1-, 3- and 5-year
AUC values were all >0.75 (Fig.
4C), and the C-index value was 0.744 (range, 0.700-0.788),
demonstrating that the predictive performance of the nomogram was
strong. Additionally, agreement between the actual and expected BFS
rates was found in the calibration plots (Fig. 4D-F), which further confirmed the
aforementioned conclusion.
Function and pathway analyses
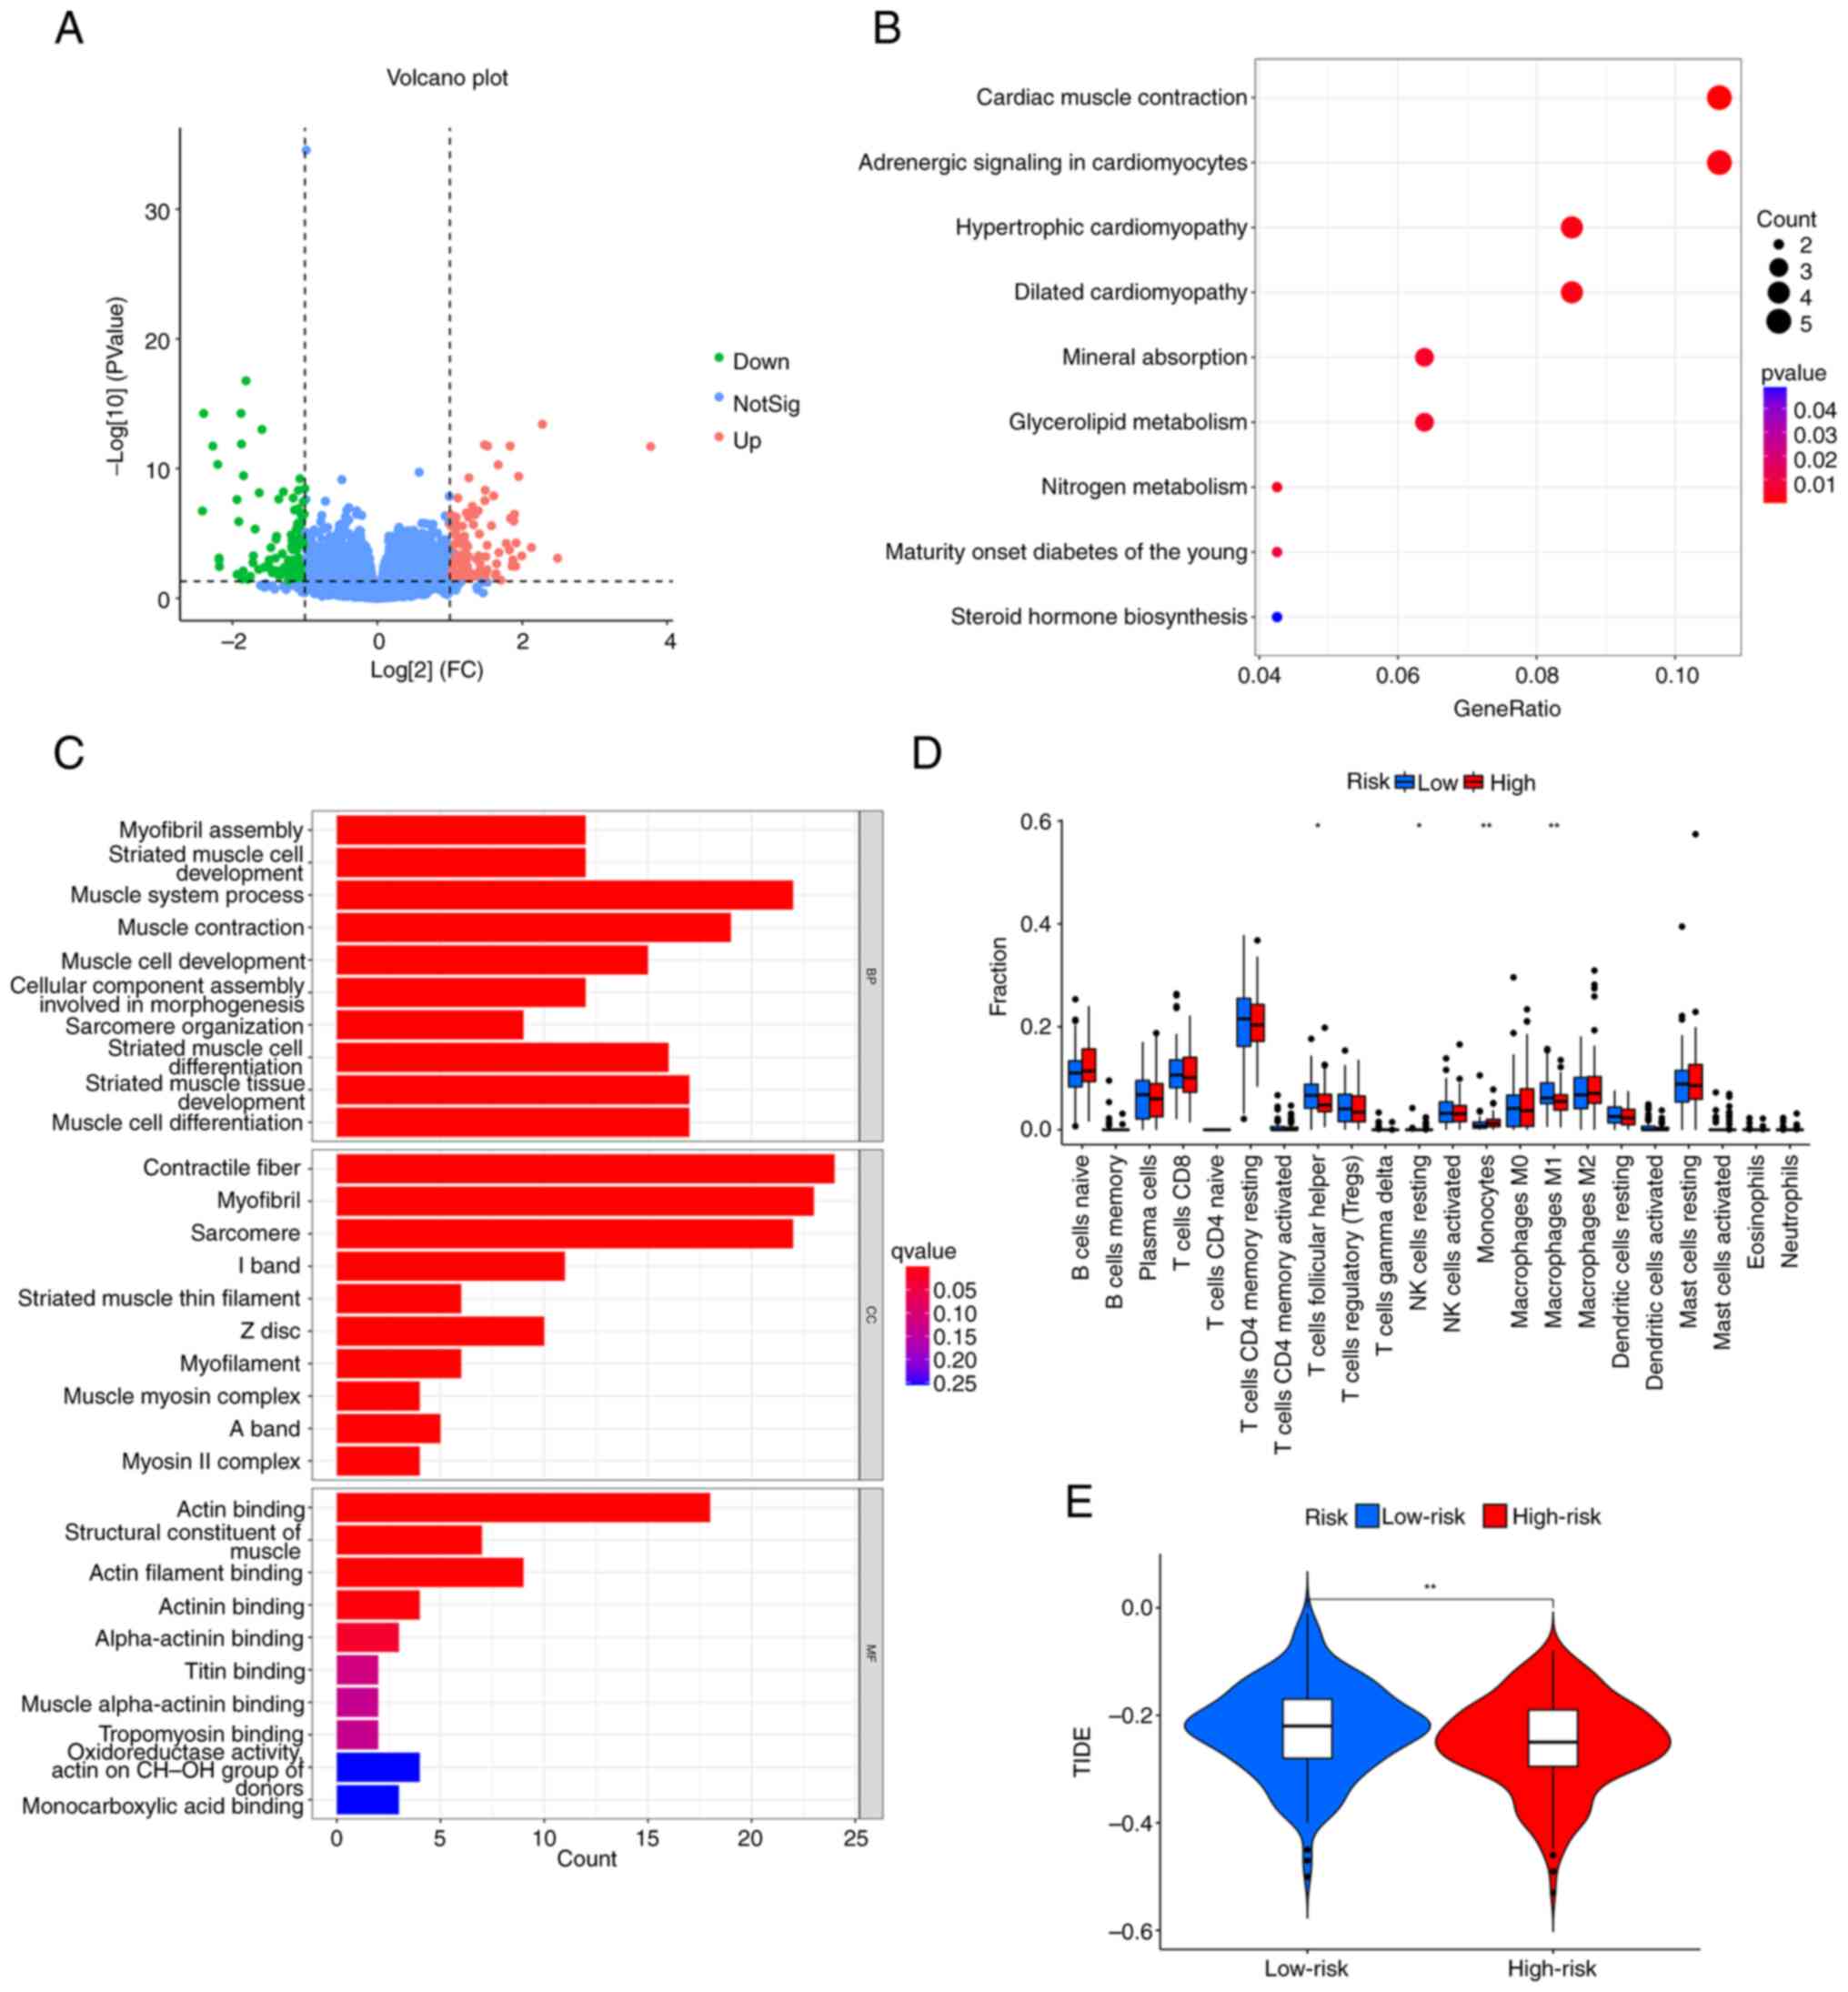
There were 214 differentially expressed genes (DEGs)
identified between the high- and low-risk groups, including 112
upregulated and 102 downregulated genes (Fig. 5A). The mechanism underlying the DEGs
was examined using GO and KEGG analyses. The KEGG analysis
demonstrated that DEGs were primarily abundant in metabolic
pathways and cardiovascular pathways; the metabolic pathways
included ‘Glycerolipid metabolism’ and ‘Nitrogen metabolism’, and
the cardiovascular pathways included ‘Cardiac muscle contraction’,
‘Adrenergic signaling in cardiomyocytes’, ‘Hypertrophic
cardiomyopathy’, and ‘Dilated cardiomyopathy’ (Fig. 5B). The GO enrichment analysis
indicated that ‘muscle system process’, ‘muscle contraction’, and
‘striated muscle tissue development’ were the main enriched
biological process terms. The main enriched cellular component
terms were ‘contractile fiber’, ‘myofibril’ and ‘sarcomere’. The
top three enriched molecular function terms were ‘structural
constituent of muscle’, ‘actin filament binding’ and ‘actin
binding’ (Fig. 5C).
Immune analysis of the 6-CRL
signature
The immune cell infiltration in the high- and
low-risk groups is presented in Fig.
5D; there was statistically significant difference between the
groups regarding immune cells, including M1 macrophages, resting
natural killer cells, follicular T helper cells and monocytes.
Subsequently, the potential difference in the expression of immune
checkpoint genes between the risk groups was investigated. Only
IDO1 was downregulated in the high-risk group (Fig. S4A). Immunotherapy response was
predicted using the TIDE score. The TIDE score was lower for the
high-risk group compared with that of the low-risk group (Fig. 5E), indicating that immunotherapy was
more likely to be effective for those at a higher risk. In
addition, the present study investigated the difference between
dysfunction and exclusion ratings across the risk categories. The
results illustrated that the low-risk group had a higher
dysfunction score and a lower exclusion score than the high-risk
group (Fig. S4B and C).
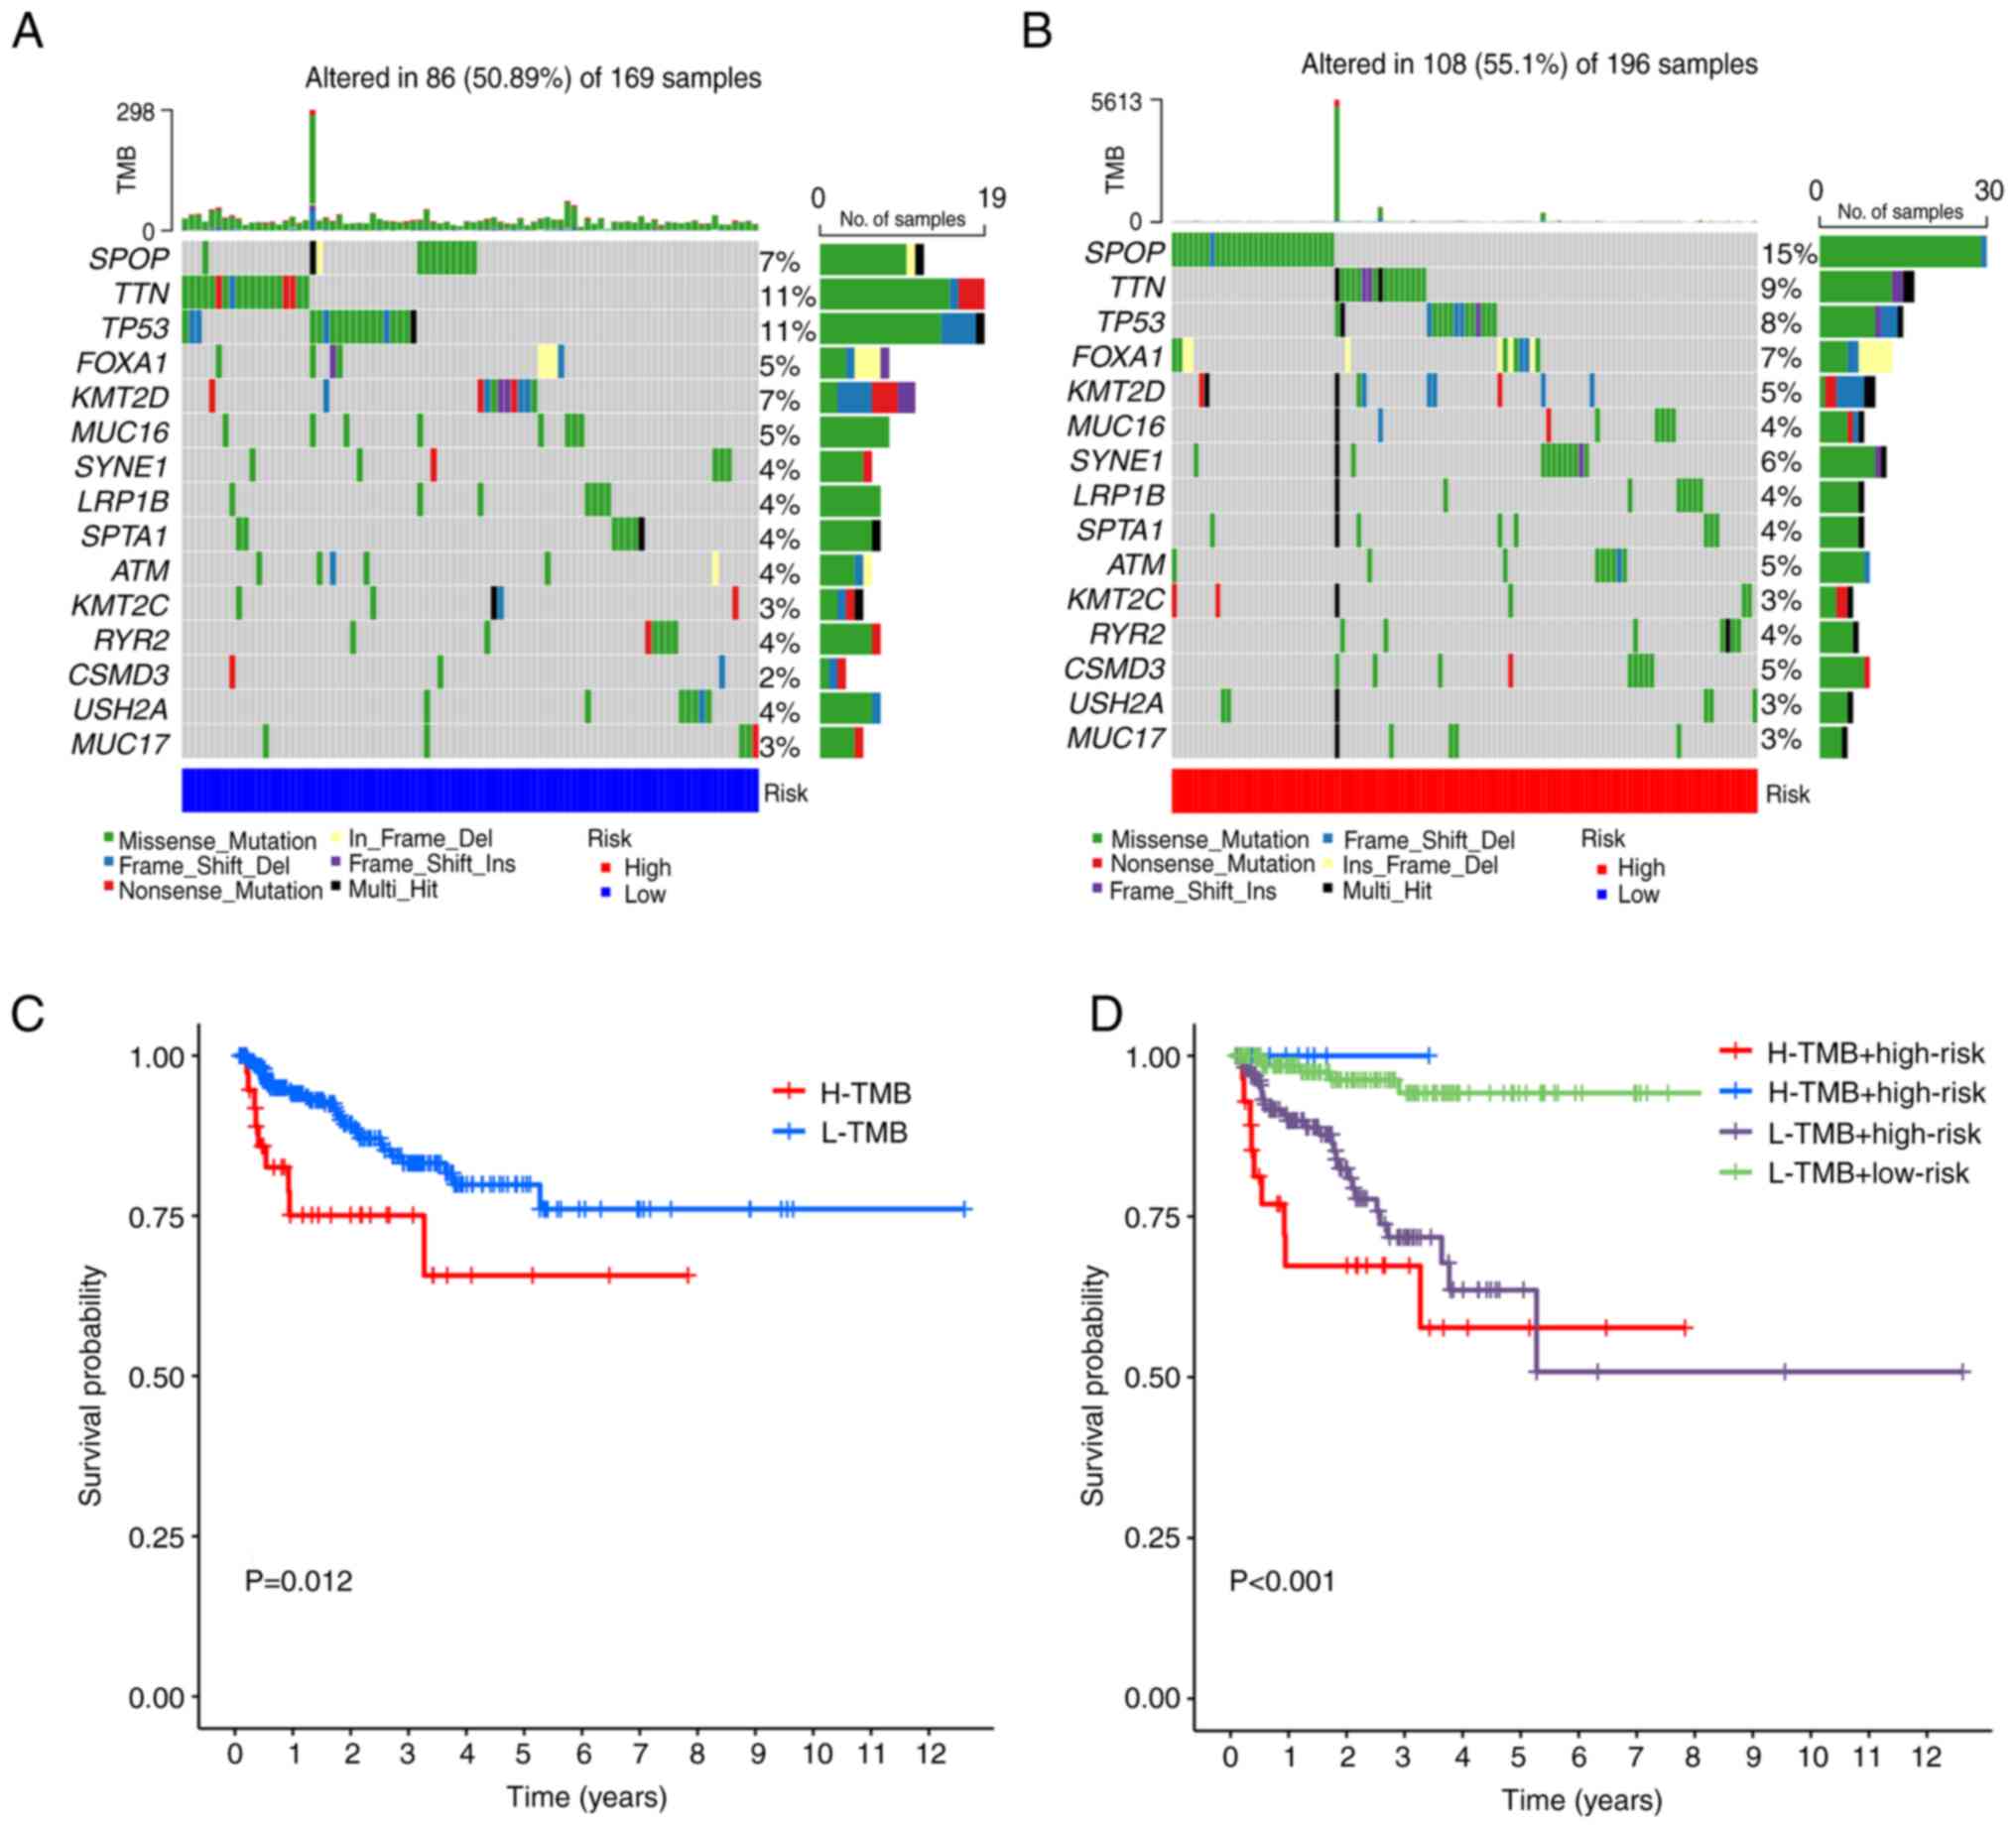
TMB and drug sensitivity analyses
The characteristics of somatic mutations for the
different risk groups are displayed in waterfall plots (Fig. 6A and B). It was revealed that SPOP
(15%), TTN (9%) and TP53 (8%) were the three most commonly mutated
genes in the high-risk group, meanwhile, the most commonly mutated
genes in the low-risk group were TP53 (11%), SPOP (7%) and TTN
(11%). However, there were no significant differences in TMB
between the low- and high-risk groups (Fig. S4D). As shown in Fig. 6C, the K-M survival curves revealed
that patients with a higher TMB had a greater likelihood of having
a poor BFS. Patients with high TMB but low-risk scores had the
greatest BFS rate, whereas those with high TMB and high-risk scores
had the lowest BFS rate (Fig. 6D).
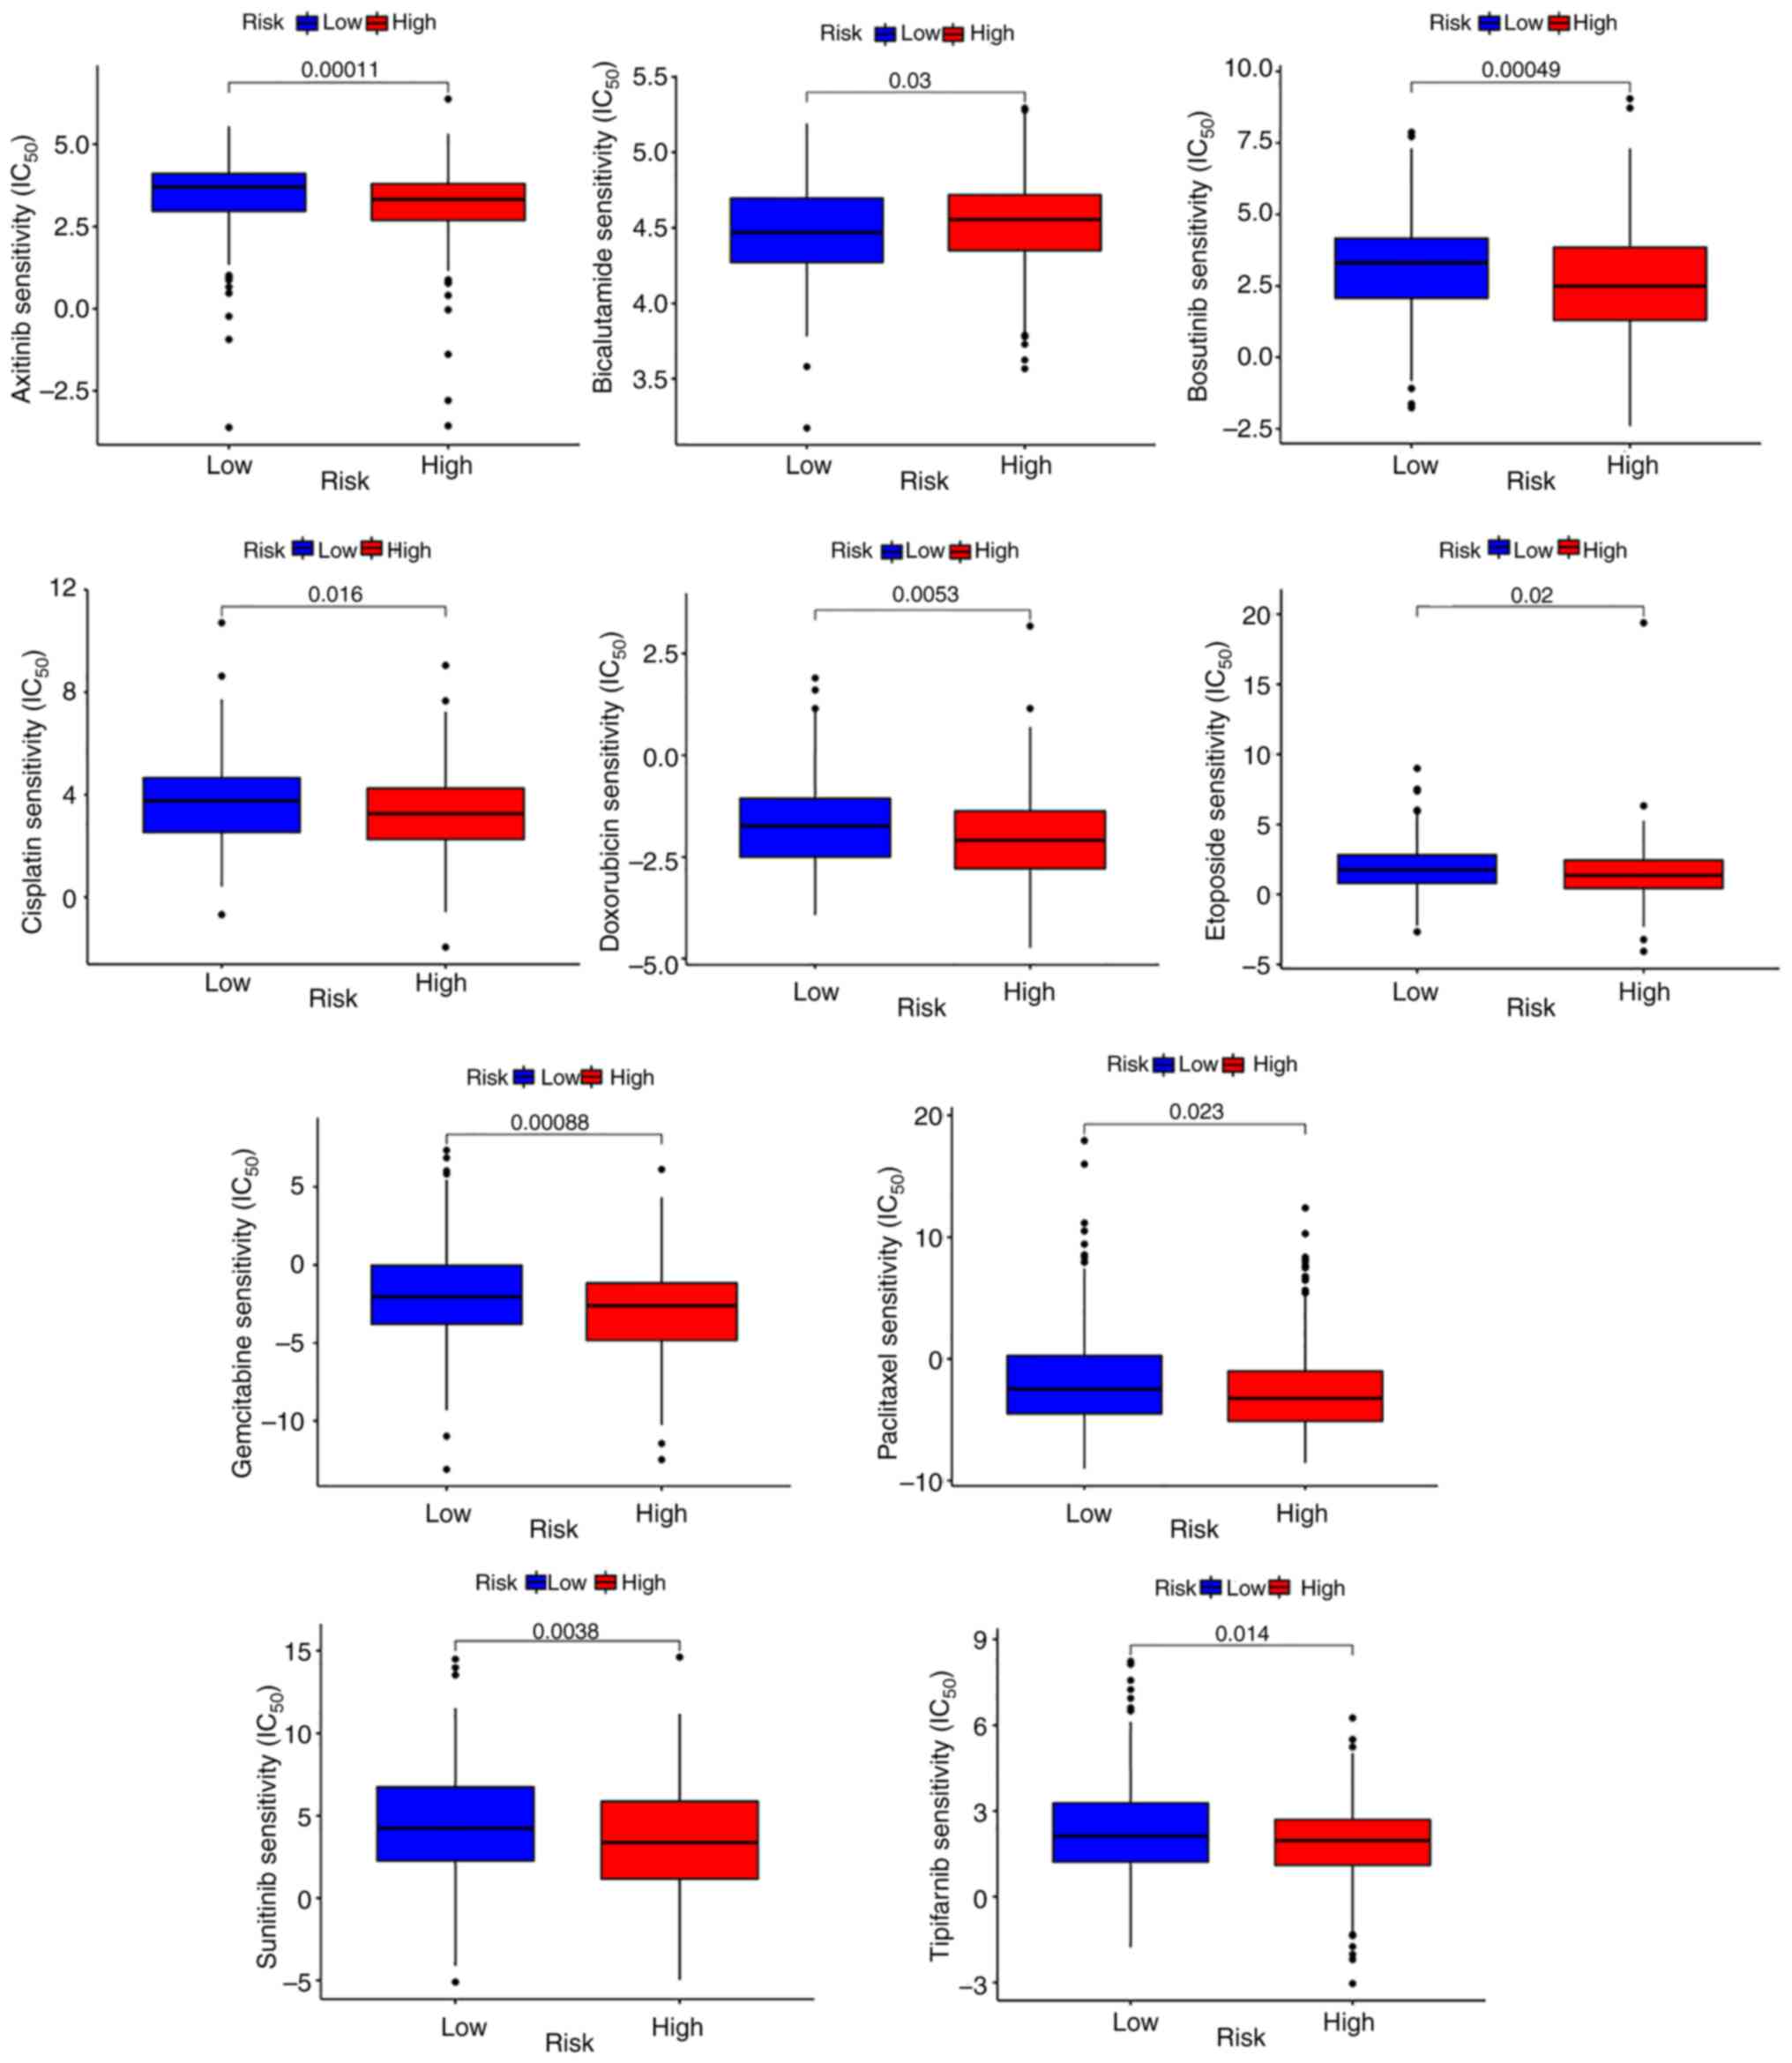
The present study further examined the variations in drug
sensitivity between different risk groups by estimating and
comparing the IC50 values of the following 10 drugs:
Axitinib, bosutinib, bicalutamide, cisplatin, doxorubicin,
etoposide, tipifarnib, paclitaxel, sunitinib and gemcitabine.
Except for bicalutamide, the IC50 values of all
medications were lower in the high-risk group (Fig. 7), which indicated that these drugs
may be potential anticancer compounds for high-risk patients.
Low-risk patients may exhibit a better response to
bicalutamide.
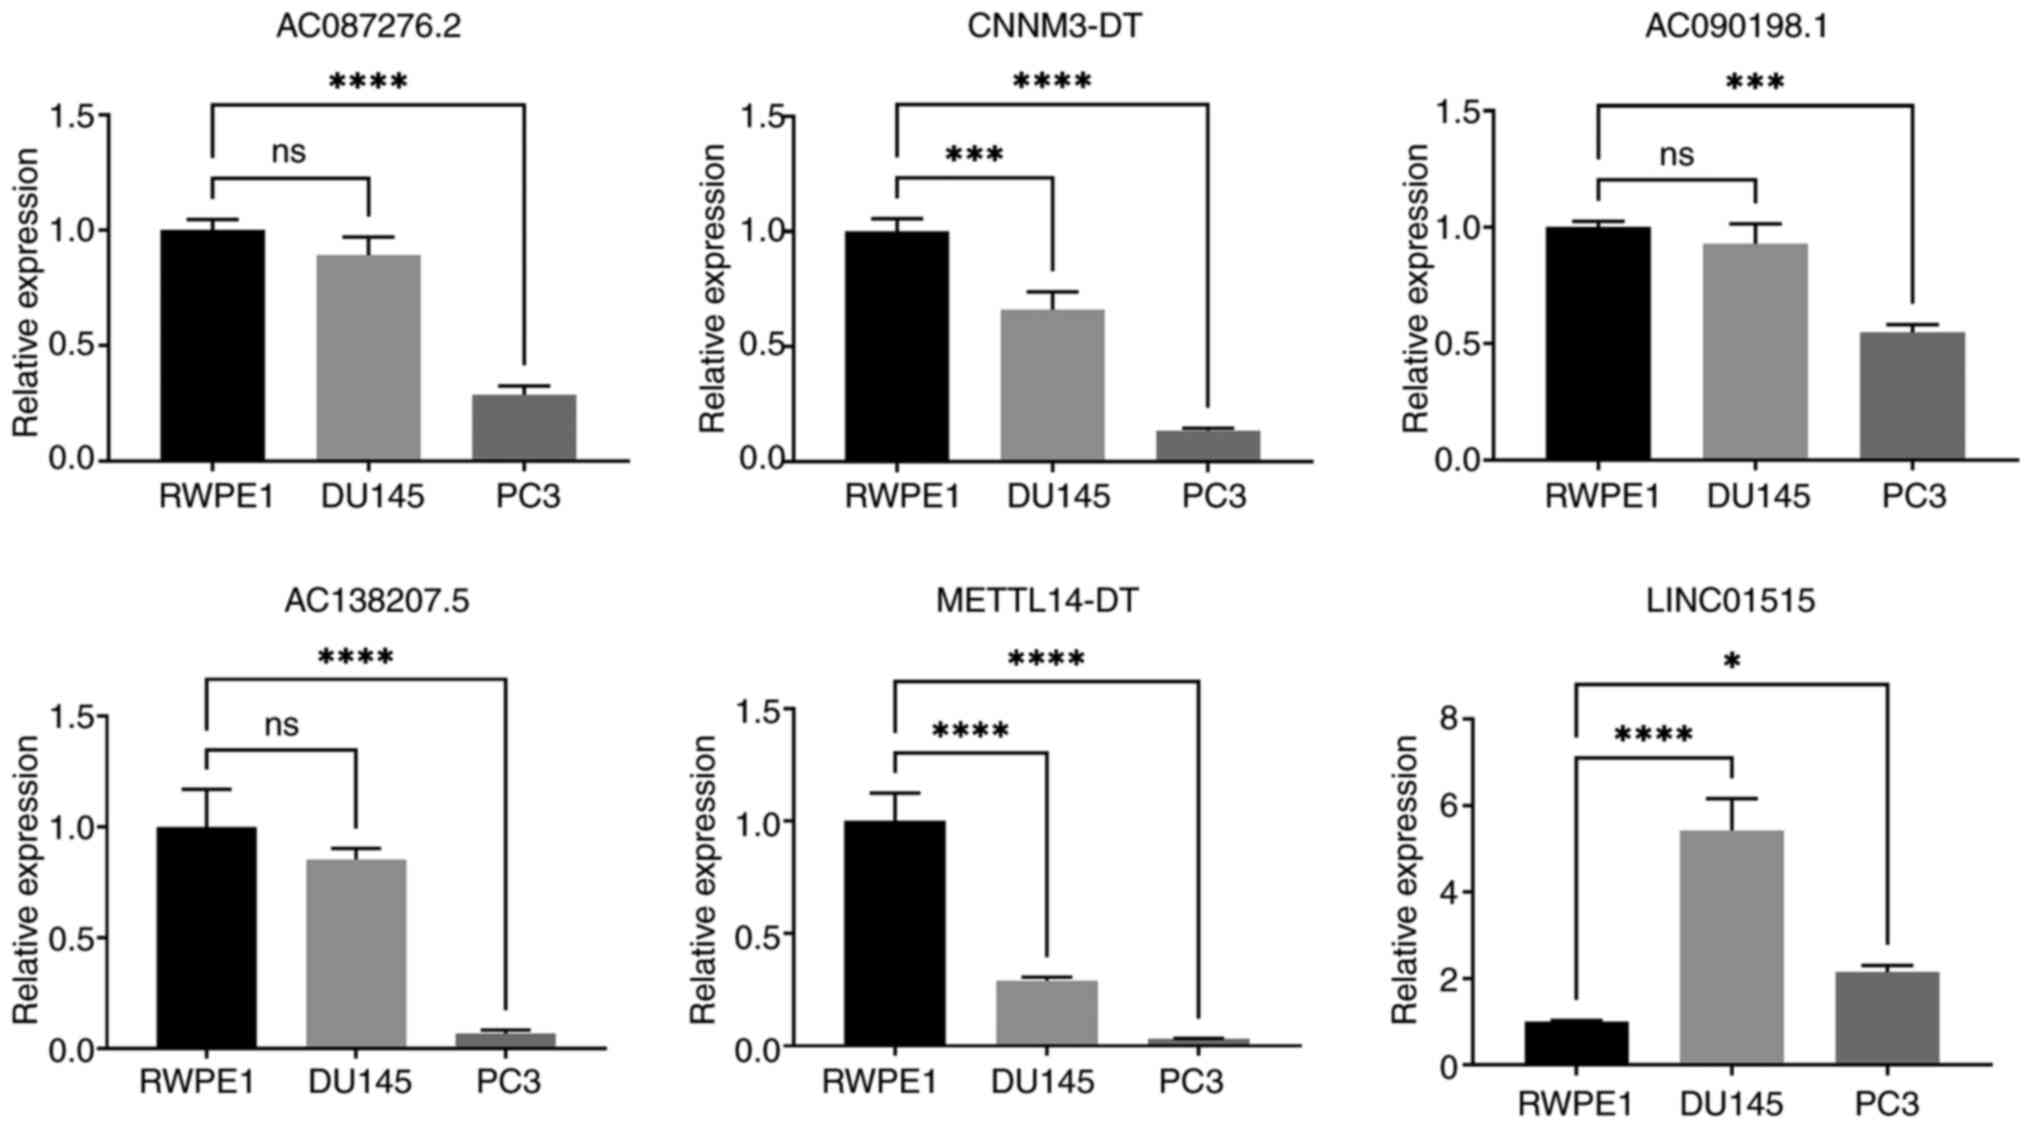
Validation of the expression of the
signature lncRNAs
Compared with in normal prostate cells, AC087276.2,
CNNM3-DT, AC090198.1, AC138207.5 and METTL14-DT were downregulated,
whereas LINC01515 was upregulated in PCa cell lines (Fig. 8). Despite the fact that the
expression of AC090198.1, AC087276.2 and AC138207.5 was not
significantly altered between the RWPE1 cells and DU145 cells, the
expression trend was downregulated in the PC3 cells.
Discussion
Patients with PCa and BCR are commonly treated with
radiotherapy, chemotherapy and androgen deprivation therapy,
increasing the economic burden on patients and reducing their
quality of life. In order to improve prognosis, it is crucial to
establish biological markers that adequately detect the risk of BCR
for patients with PCa. To the best of our knowledge, there is
currently no reliable indicator that may predict the risk of BCR
for patients with PCa.
Copper homeostasis is crucial for tumor cell growth
and proliferation (42,43). Denoyer et al (44) reported that the functional supply of
copper is essential for the development of PCa in mice. When the
copper intake of PCa cells is reduced, the proliferative ability of
cells is significantly inhibited (45). Previous studies have shown that the
copper signaling pathway may be a promising therapeutic target for
PCa (46,47). However, limited research has been
carried out on cuproptosis in PCa, and the significance of CRGs in
the occurrence and progression of PCa, as well as their prognostic
value, remains unclear. In multiple tumors, including
hepatocellular carcinoma, glioma and clear cell renal cell
carcinoma, the predictive significance of CRLs has been
demonstrated (48–50). Despite this, to the best of our
knowledge, the prognostic significance of CRLs in PCa has not yet
been explored. In addition to establishing a 6-CRL signature for
predicting the BFS of patients with PCa, the function of
cuproptosis in the immunological microenvironment of PCa was
investigated.
In the present study, patients were randomly divided
into a training set and a testing set. Statistical analysis between
the two datasets showed no statistical difference in age,
pathological T stage, clinical T stage, pathological N stage and
Gleason score between the two datasets. This indicates that the two
datasets are independent, and the partitioning of datasets is
reasonable. The 6-CRL signature effectively categorized patients
with PCa into high- and low-risk groups, and the principal
component analysis also validated the distinguishing ability of the
signature in all three sets. The BFS rate of the high-risk group
was significantly lower compared with that in the low-risk group.
The predictive accuracy of the signature was estimated and
validated through the time-dependent ROC curves in training,
testing and entire sets. Notably, the highest AUC value of the
signature was in year 5, followed by years 3 and 1. The ROC curves
indicated that the signature had a stronger predictive power for
BCR of patients with PCa in the long term. In addition, through
C-index analysis, it was shown that the C-index value of the
signature in the training and entire sets was >0.7, while the
relevant value for the testing set was only >0.6. The signature
in the testing set was less accurate than that in the training and
the entire set; the reason for this difference may be that the
sample size of the testing set was small (n=123). The same reason
applies to independent prognostic analysis. In the Cox regression
analysis, the signature was identified as an independent prognosis
factor in both the training set and the entire set, but not in the
testing set. The reason for this difference may also be due to the
large sample size difference.
By evaluating the accuracy of the six CRLs in each
dataset, it was shown that the signature may be a good indicator
for predicting BFS in PCa, which was suiTable for both the early
and advanced stages. It was also revealed that the signature was
related to the PFS of PCa, emphasizing its significance in
predicting PCa survival. High-risk patients expressed lower levels
of IDO1 than low-risk patients, and these patients had a worse
prognosis. Ferreira et al (51) reported that patients with PCa who
expressed lower levels of IDO1 had a shorter BFS, which is
consistent with the findings of the present study that revealed a
negative association between IDO1 expression and BCR risk.
In the GO analysis, it was shown that the DEGs
between the high- and low-risk groups were mainly enriched in terms
associated with the muscle system. In the KEGG analysis, it was
demonstrated that the DEGs were involved in steroid hormone
biosynthesis. Androgens are steroid hormones that serve an
important role in the occurrence and development of PCa. It may be
hypothesized that differences in the ability to synthesize
androgens contributes to the difference in BCR risk between the two
groups. Moreover, the low-risk group had higher TIDE scores.
Notably, it has been reported that higher TIDE scores indicate
decreased sensitivity to both anti-PD-1 and anti-CTLA-4 treatments
(52). The TIDE analysis
hypothesized that high-risk patients with PCa may respond better to
immunotherapy, and the low-risk population may not be sensitive to
immunotherapy. Based on the TIDE score difference, unnecessary
immunotherapy may be avoided. The TMB analysis revealed that
patients with higher TMB levels had a poor BFS, which was
consistent with the findings of a previous study by Luo et
al (53). In the K-M survival
analysis of integrated TMB score and 6-CRL signature, the BFS rate
was the lowest for the high-risk group with high-TMB, whereas the
highest BFS rate was detected in the low-risk group with high-TMB.
Finally, the risk score, Gleason score and pathological T stage
were incorporated into a predictive nomogram to predict the 1-, 3-
and 5-year BFS rates in patients with PCa. ROC curves, calibration
curves and C-index analysis assessed the predictive capability of
the nomogram, which has the potential to become a practical tool in
clinical decision-making.
In the potential clinical application, this
signature could be used to distinguish between BCR high- and
low-risk patient with PCa. For high-risk patients, active measures,
such as shortening the review time and changing the original
treatment regimen, may be taken to reduce the risk of BCR in this
population. In addition, through the nomogram, the probability of
BCR in the next 5 years can be calculated, the high-risk population
can be identified, and early intervention or enhanced follow-up can
be carried out to improve the prognosis of patients. Since this
signature only requires the expression of six lncRNAs to calculate
the risk score, and does not increase the economic burden on
patients, it may have potential clinical application. Furthermore,
since only other patient clinicopathological parameters have to be
integrated to calculate the probability of BCR through the
nomogram, this indicates the simplicity of this signature.
Although Ren et al (54) also built a CRL signature to predict
the BCR of PCa, the present study differs from this previous study.
In the previous study, the CRLs extracted by the author were based
on 10 CRGs, whereas the present study was based on 19 CRGs. The
number of CRGs included was more extensive and relatively more
comprehensive. In addition, only ROC curve analysis was used in the
previous study to evaluate the model prediction efficiency. By
contrast, principal component analysis was also performed in the
present study, providing a more comprehensive evaluation of the
model. Moreover, in the previous study, only an overall ROC curve
analysis was performed and ROC curve analyses at multiple time
points was not carried out, whereas the present study evaluated the
prediction efficiency at 1, 3 and 5 years in a more detailed
manner. The AUC values in their models were 0.766, 0.613 and 0.693,
respectively. The 1-, 3- and 5-year AUC values of the model
generated in the present study for the training set were 0.728,
0.740 and 0.783, respectively; those for the testing set were
0.667, 0.715 and 0.831 respectively; and those for the entire set
were 0.717, 0.729 and 0.781, respectively. Therefore, the model
generated in the present study is probably more accurate than that
generated in the previous study. Although the model in the present
study was also built based on six lncRNAs, the lncRNAs in the two
models were completely different. The RT-qPCR results of the cell
lines used in the present study showed that, except for LINC01515,
the expression levels of the other five lncRNAs in PCa cells were
lower than those in RWPE1 cells. In particular, the expression
levels of CNNM3-DT and METTL14-DT in the PC3 and DU145 advanced PCa
cells were lower than those in RWPE1 cells. These results suggested
that CNNM3-DT and METTL14-DT may play an important role in the
progression of advanced PCa.
Notably, the signature assessed in the present study
also has certain limitations with regard to its clinical
application. First, the construction of this signature was based on
patient tumor samples from TCGA, and most of the patients in TCGA
dataset are from North America. The applicability of this signature
to Asian countries requires further clinical verification. Second,
the evaluation of the accuracy of this model was based on
retrospective data, and further prospective multicenter clinical
studies are required to support its accuracy. In addition, this
model was only applicable to patients undergoing radical
prostatectomy, but not radical radiotherapy.
The present study also has several limitations. Data
from other databases are required for external validation, since
just TCGA database was used for internal validation. In addition,
although PCa cell lines were used to validate the expression of the
signature lncRNAs, the regulatory effect and underlying mechanisms
of CRLs in PCa require further biological research.
In the current study, a new signature for predicting
BCR based on six lncRNAs was established. Notably, the generated
prognostic nomogram containing the 6-CRL signature and other
patient clinicopathological characteristics may serve as a clinical
tool for decision-making.
Supplementary Material
Supporting Data
Supporting Data
Acknowledgements
Not applicable.
Funding
This work was supported by the National Natural Science
Foundation of China (grant no. 82260598), the Jiangxi Provincial
Academic and Technical Leaders Program (grant no. 20225BCJ22009)
and the Research Topic of Traditional Chinese Medicine in Jiangxi
Province (grant no. 2018A132).
Availability of data and materials
The transcriptome and clinical data of patients may
be found in TCGA (TCGA-PRAD) at the following URL: https://portal.gdc.cancer.gov/. The other data
generated in the present study may be requested from the
corresponding author.
Authors' contributions
ZJY and TZ designed the study and contributed to the
acquisition of TCGA data. ZJY constructed and validated the
predictive model, and performed immune analysis. HCC performed TMB
analysis and drug sensitivity analysis. ZJY and HHD conducted cell
culture and RT-qPCR. HCC and HHD confirm the authenticity of all
the raw data. ZJY and HHD drafted the manuscript and drew all
figures. ZJY and ZS analyzed and interpreted the data. HCC reviewed
and revised the manuscript. HCC reviewed all the figures. TZ
contributed to the supervision and administration of the study. All
authors read and approved the final version of the manuscript.
Ethics approval and consent to
participate
Not applicable.
Patient consent for publication
Not applicable.
Competing interests
The authors declare that they have no competing
interests.
Glossary
Abbreviations
Abbreviations:
|
AUC
|
area under the ROC
|
|
C-index
|
conformance index
|
|
CRGs
|
cuproptosis-related genes
|
|
CRLs
|
cuproptosis-related lncRNAs
|
|
GO
|
Gene Ontology
|
|
IC50
|
half maximal inhibitory
concentration
|
|
KEGG
|
Kyoto Encyclopedia of Genes and
Genomes
|
|
K-M
|
Kaplan-Meier
|
|
LASSO
|
least absolute shrinkage and selection
operator
|
|
lncRNA
|
long noncoding RNA
|
|
PCa
|
prostate cancer
|
|
PFS
|
progression-free survival
|
|
ROC
|
receiver operating curve
|
|
TIDE
|
tumor immune dysfunction and
exclusion
|
|
TMB
|
tumor mutation burden
|
References
|
1
|
Cronin KA, Scott S, Firth AU, Sung H,
Henley SJ, Sherman RL, Siegel RL, Anderson RN, Kohler BA, Benard
VB, et al: Annual report to the nation on the status of cancer,
part 1: National cancer statistics. Cancer. 128:4251–4284. 2022.
View Article : Google Scholar : PubMed/NCBI
|
|
2
|
Siegel RL, Miller KD, Fuchs HE and Jemal
A: Cancer statistics, 2021. CA Cancer J Clin. 71:7–33. 2021.
View Article : Google Scholar : PubMed/NCBI
|
|
3
|
Mottet N, van den Bergh RCN, Briers E, Van
den Broeck T, Cumberbatch MG, De Santis M, Fanti S, Fossati N,
Gandaglia G, Gillessen S, et al: EAU-EANM-ESTRO-ESUR-SIOG
guidelines on prostate cancer-2020 update. Part 1: Screening,
diagnosis, and local treatment with curative intent. Eur Urol.
79:243–262. 2021. View Article : Google Scholar : PubMed/NCBI
|
|
4
|
Cornford P, van den Bergh RCN, Briers E,
Van den Broeck T, Cumberbatch MG, De Santis M, Fanti S, Fossati N,
Gandaglia G, Gillessen S, et al: EAU-EANM-ESTRO-ESUR-SIOG
guidelines on prostate cancer. Part II-2020 update: Treatment of
relapsing and metastatic prostate cancer. Eur Urol. 79:263–282.
2021. View Article : Google Scholar : PubMed/NCBI
|
|
5
|
Liesenfeld L, Kron M, Gschwend JE and
Herkommer K: Prognostic factors for biochemical recurrence more
than 10 years after radical prostatectomy. J Urol. 197:143–148.
2017. View Article : Google Scholar : PubMed/NCBI
|
|
6
|
Szerdahelyi P and Kása P: Histochemical
demonstration of copper in normal rat brain and spinal cord.
Evidence of localization in glial cells. Histochemistry.
85:341–347. 1986. View Article : Google Scholar : PubMed/NCBI
|
|
7
|
Blockhuys S, Celauro E, Hildesjö C, Feizi
A, Stål O, Fierro-González JC and Wittung-Stafshede P: Defining the
human copper proteome and analysis of its expression variation in
cancers. Metallomics. 9:112–123. 2017. View Article : Google Scholar : PubMed/NCBI
|
|
8
|
Ge EJ, Bush AI, Casini A, Cobine PA, Cross
JR, DeNicola GM, Dou QP, Franz KJ, Gohil VM, Gupta S, et al:
Connecting copper and cancer: From transition metal signalling to
metalloplasia. Nat Rev Cancer. 22:102–113. 2022. View Article : Google Scholar : PubMed/NCBI
|
|
9
|
Tsvetkov P, Coy S, Petrova B, Dreishpoon
M, Verma A, Abdusamad M, Rossen J, Joesch-Cohen L, Humeidi R,
Spangler RD, et al: Copper induces cell death by targeting
lipoylated TCA cycle proteins. Science. 375:1254–1261. 2022.
View Article : Google Scholar : PubMed/NCBI
|
|
10
|
Wang Y, Liu K, Shen K, Xiao J, Zhou X,
Cheng Q, Hu L, Fan H, Ni P, Xu Z, et al: A novel risk model
construction and immune landscape analysis of gastric cancer based
on cuproptosis-related long noncoding RNAs. Front Oncol.
12:10152352022. View Article : Google Scholar : PubMed/NCBI
|
|
11
|
Park A, Lee J, Mun S, Kim DJ, Cha BH, Moon
KT, Yoo TK and Kang HG: Identification of transcription factor YY1
as a regulator of a prostate cancer-specific pathway using
proteomic analysis. J Cancer. 8:2303–2311. 2017. View Article : Google Scholar : PubMed/NCBI
|
|
12
|
Ulitsky I: Evolution to the rescue: Using
comparative genomics to understand long non-coding RNAs. Nat Rev
Genet. 17:601–614. 2016. View Article : Google Scholar : PubMed/NCBI
|
|
13
|
Tan YT, Lin JF, Li T, Li JJ, Xu RH and Ju
HQ: LncRNA-mediated posttranslational modifications and
reprogramming of energy metabolism in cancer. Cancer Commun (Lond).
41:109–120. 2021. View Article : Google Scholar : PubMed/NCBI
|
|
14
|
Li C, Hu J, Hu X, Zhao C, Mo M, Zu X and
Li Y: LncRNA SNHG9 is a prognostic biomarker and correlated with
immune infiltrates in prostate cancer. Transl Androl Urol.
10:215–226. 2021. View Article : Google Scholar : PubMed/NCBI
|
|
15
|
Jiang N, Meng X, Mi H, Chi Y, Li S, Jin Z,
Tian H, He J, Shen W, Tian H, et al: Circulating lncRNA XLOC_009167
serves as a diagnostic biomarker to predict lung cancer. Clin Chim
Acta. 486:26–33. 2018. View Article : Google Scholar : PubMed/NCBI
|
|
16
|
Chao Y and Zhou D: lncRNA-D16366 is a
potential biomarker for diagnosis and prognosis of hepatocellular
carcinoma. Med Sci Monit. 25:6581–6586. 2019. View Article : Google Scholar : PubMed/NCBI
|
|
17
|
Wang Y, Chen W, Lian J, Zhang H, Yu B,
Zhang M, Wei F, Wu J, Jiang J, Jia Y, et al: The lncRNA PVT1
regulates nasopharyngeal carcinoma cell proliferation via
activating the KAT2A acetyltransferase and stabilizing HIF-1α. Cell
Death Differ. 27:695–710. 2020. View Article : Google Scholar : PubMed/NCBI
|
|
18
|
Ghildiyal R, Sawant M, Renganathan A,
Mahajan K, Kim EH, Luo J, Dang HX, Maher CA, Feng FY and Mahajan
NP: Loss of long noncoding RNA NXTAR in prostate cancer
augments androgen receptor expression and enzalutamide resistance.
Cancer Res. 82:155–168. 2022. View Article : Google Scholar : PubMed/NCBI
|
|
19
|
Jiang X, Guo S, Xu M, Ma B, Liu R, Xu Y
and Zhang Y: TFAP2C-mediated lncRNA PCAT1 inhibits ferroptosis in
docetaxel-resistant prostate cancer through c-Myc/miR-25-3p/SLC7A11
signaling. Front Oncol. 12:8620152022. View Article : Google Scholar : PubMed/NCBI
|
|
20
|
Wen S, Wei Y, Zen C, Xiong W, Niu Y and
Zhao Y: Long non-coding RNA NEAT1 promotes bone metastasis of
prostate cancer through N6-methyladenosine. Mol Cancer. 19:1712020.
View Article : Google Scholar : PubMed/NCBI
|
|
21
|
Hung CL, Wang LY, Yu YL, Chen HW,
Srivastava S, Petrovics G and Kung HJ: A long noncoding RNA
connects c-Myc to tumor metabolism. Proc Natl Acad Sci USA.
111:18697–18702. 2014. View Article : Google Scholar : PubMed/NCBI
|
|
22
|
Shang Z, Yu J, Sun L, Tian J, Zhu S, Zhang
B, Dong Q, Jiang N, Flores-Morales A, Chang C and Niu Y: LncRNA
PCAT1 activates AKT and NF-κB signaling in castration-resistant
prostate cancer by regulating the PHLPP/FKBP51/IKKα complex.
Nucleic Acids Res. 47:4211–4225. 2019. View Article : Google Scholar : PubMed/NCBI
|
|
23
|
Chade DC, Shariat SF, Cronin AM, Savage
CJ, Karnes RJ, Blute ML, Briganti A, Montorsi F, van der Poel HG,
Van Poppel H, et al: Salvage radical prostatectomy for
radiation-recurrent prostate cancer: A multi-institutional
collaboration. Eur Urol. 60:205–210. 2011. View Article : Google Scholar : PubMed/NCBI
|
|
24
|
Molina-Barrera ÁM, Ramos-Ulloa JG,
Becerra-Méndez LM, García-Valencia J, Varela-Ramírez R and
Silva-Chacón D: Predictors of biochemical recurrence after radical
prostatectomy at an oncology reference center in Colombia. Arch Esp
Urol. 74:656–663. 2021.(In Spanish). PubMed/NCBI
|
|
25
|
Tilki D, Preisser F, Graefen M, Huland H
and Pompe RS: External validation of the European association of
urology biochemical recurrence risk groups to predict metastasis
and mortality after radical prostatectomy in a European cohort. Eur
Urol. 75:896–900. 2019. View Article : Google Scholar : PubMed/NCBI
|
|
26
|
Mengual L: Molecular technology to
optimize the use of biomarkers in the clinic. Arch Esp Urol.
75:103–112. 2022.(In Spanish). PubMed/NCBI
|
|
27
|
Hristova VA and Chan DW: Cancer biomarker
discovery and translation: Proteomics and beyond. Expert Rev
Proteomics. 16:93–103. 2019. View Article : Google Scholar : PubMed/NCBI
|
|
28
|
Xie J, Yang Y, Gao Y and He J:
Cuproptosis: Mechanisms and links with cancers. Mol Cancer.
22:462023. View Article : Google Scholar : PubMed/NCBI
|
|
29
|
Goyal B, Yadav SRM, Awasthee N, Gupta S,
Kunnumakkara AB and Gupta SC: Diagnostic, prognostic, and
therapeutic significance of long non-coding RNA MALAT1 in cancer.
Biochim Biophys Acta Rev Cancer. 1875:1885022021. View Article : Google Scholar : PubMed/NCBI
|
|
30
|
Zhang Z, Ma Y, Guo X, Du Y, Zhu Q, Wang X
and Duan C: FDX1 can impact the prognosis and mediate the
metabolism of lung adenocarcinoma. Front Pharmacol. 12:7491342021.
View Article : Google Scholar : PubMed/NCBI
|
|
31
|
Tsvetkov P, Detappe A, Cai K, Keys HR,
Brune Z, Ying W, Thiru P, Reidy M, Kugener G, Rossen J, et al:
Mitochondrial metabolism promotes adaptation to proteotoxic stress.
Nat Chem Biol. 15:681–689. 2019. View Article : Google Scholar : PubMed/NCBI
|
|
32
|
Solmonson A, Faubert B, Gu W, Rao A,
Cowdin MA, Menendez-Montes I, Kelekar S, Rogers TJ, Pan C, Guevara
G, et al: Compartmentalized metabolism supports midgestation
mammalian development. Nature. 604:349–353. 2022. View Article : Google Scholar : PubMed/NCBI
|
|
33
|
Ji L, Zhao G, Zhang P, Huo W, Dong P,
Watari H, Jia L, Pfeffer LM, Yue J and Zheng J: Knockout of MTF1
inhibits the epithelial to mesenchymal transition in ovarian cancer
cells. J Cancer. 9:4578–4585. 2018. View Article : Google Scholar : PubMed/NCBI
|
|
34
|
Masisi BK, El Ansari R, Alfarsi L, Rakha
EA, Green AR and Craze ML: The role of glutaminase in cancer.
Histopathology. 76:498–508. 2020. View Article : Google Scholar : PubMed/NCBI
|
|
35
|
Luo JP, Wang J and Huang JH: CDKN2A is a
prognostic biomarker and correlated with immune infiltrates in
hepatocellular carcinoma. Biosci Rep. 41:BSR202111032021.
View Article : Google Scholar : PubMed/NCBI
|
|
36
|
Newman AM, Liu CL, Green MR, Gentles AJ,
Feng W, Xu Y, Hoang CD, Diehn M and Alizadeh AA: Robust enumeration
of cell subsets from tissue expression profiles. Nat Methods.
12:453–457. 2015. View Article : Google Scholar : PubMed/NCBI
|
|
37
|
Zhang H, Cui B, Zhou Y, Wang X, Wu W, Wang
Z, Dai Z, Cheng Q and Yang K: B2M overexpression correlates with
malignancy and immune signatures in human gliomas. Sci Rep.
11:50452021. View Article : Google Scholar : PubMed/NCBI
|
|
38
|
Chen Z, Chen J, Ren D, Zhang J, Yang Y,
Zhang H, Mao B and Ma H: EPHA5 mutations predict survival after
immunotherapy in lung adenocarcinoma. Aging (Albany NY).
13:598–618. 2020. View Article : Google Scholar : PubMed/NCBI
|
|
39
|
Wang G, Xu D, Zhang Z, Li X, Shi J, Sun J,
Liu HZ, Li X, Zhou M and Zheng T: The pan-cancer landscape of
crosstalk between epithelial-mesenchymal transition and immune
evasion relevant to prognosis and immunotherapy response. NPJ
Precis Oncol. 5:562021. View Article : Google Scholar : PubMed/NCBI
|
|
40
|
Jiang P, Gu S, Pan D, Fu J, Sahu A, Hu X,
Li Z, Traugh N, Bu X, Li B, et al: Signatures of T cell dysfunction
and exclusion predict cancer immunotherapy response. Nat Med.
24:1550–1558. 2018. View Article : Google Scholar : PubMed/NCBI
|
|
41
|
Livak KJ and Schmittgen TD: Analysis of
relative gene expression data using real-time quantitative PCR and
the 2(−Delta Delta C(T)) method. Methods. 25:402–408. 2001.
View Article : Google Scholar : PubMed/NCBI
|
|
42
|
Tsang T, Posimo JM, Gudiel AA, Cicchini M,
Feldser DM and Brady DC: Copper is an essential regulator of the
autophagic kinases ULK1/2 to drive lung adenocarcinoma. Nat Cell
Biol. 22:412–424. 2020. View Article : Google Scholar : PubMed/NCBI
|
|
43
|
Shanbhag VC, Gudekar N, Jasmer K,
Papageorgiou C, Singh K and Petris MJ: Copper metabolism as a
unique vulnerability in cancer. Biochim Biophys Acta Mol Cell Res.
1868:1188932021. View Article : Google Scholar : PubMed/NCBI
|
|
44
|
Denoyer D, Pearson HB, Clatworthy SA,
Smith ZM, Francis PS, Llanos RM, Volitakis I, Phillips WA, Meggyesy
PM, Masaldan S and Cater MA: Copper as a target for prostate cancer
therapeutics: Copper-ionophore pharmacology and altering systemic
copper distribution. Oncotarget. 7:37064–37080. 2016. View Article : Google Scholar : PubMed/NCBI
|
|
45
|
Xie F and Peng F: Reduction in copper
uptake and inhibition of prostate cancer cell proliferation by
novel steroid-based compounds. Anticancer Res. 41:5953–5958. 2021.
View Article : Google Scholar : PubMed/NCBI
|
|
46
|
Safi R, Nelson ER, Chitneni SK, Franz KJ,
George DJ, Zalutsky MR and McDonnell DP: Copper signaling axis as a
target for prostate cancer therapeutics. Cancer Res. 74:5819–5831.
2014. View Article : Google Scholar : PubMed/NCBI
|
|
47
|
Huynh TT, van Dam EM, Sreekumar S, Mpoy C,
Blyth BJ, Muntz F, Harris MJ and Rogers BE: Copper-67-labeled
bombesin peptide for targeted radionuclide therapy of prostate
cancer. Pharmaceuticals (Basel). 15:7282022. View Article : Google Scholar : PubMed/NCBI
|
|
48
|
Bao JH, Lu WC, Duan H, Ye YQ, Li JB, Liao
WT, Li YC and Sun YP: Identification of a novel cuproptosis-related
gene signature and integrative analyses in patients with
lower-grade gliomas. Front Immunol. 13:9339732022. View Article : Google Scholar : PubMed/NCBI
|
|
49
|
Zhang G, Sun J and Zhang X: A novel
cuproptosis-related LncRNA signature to predict prognosis in
hepatocellular carcinoma. Sci Rep. 12:113252022. View Article : Google Scholar : PubMed/NCBI
|
|
50
|
Bian Z, Fan R and Xie L: A novel
cuproptosis-related prognostic gene signature and validation of
differential expression in clear cell renal cell carcinoma. Genes
(Basel). 13:8512022. View Article : Google Scholar : PubMed/NCBI
|
|
51
|
Ferreira JM, Dellê H, Camacho CP, Almeida
RJ, Reis ST, Matos YST, Lima AMR, Leite KRM, Pontes-Júnior J and
Srougi M: Indoleamine 2,3-dioxygenase expression in the prognosis
of the localized prostate cancer. Int Urol Nephrol. 52:1477–1482.
2020. View Article : Google Scholar : PubMed/NCBI
|
|
52
|
Woo SR, Corrales L and Gajewski TF: The
STING pathway and the T cell-inflamed tumor microenvironment.
Trends Immunol. 36:250–256. 2015. View Article : Google Scholar : PubMed/NCBI
|
|
53
|
Luo C, Chen J and Chen L: Exploration of
gene expression profiles and immune microenvironment between high
and low tumor mutation burden groups in prostate cancer. Int
Immunopharmacol. 86:1067092020. View Article : Google Scholar : PubMed/NCBI
|
|
54
|
Ren L, Yang X, Wang W, Lin H, Huang G, Liu
Z, Pan J and Mao X: A cuproptosis-related LncRNA signature:
Integrated analysis associated with biochemical recurrence and
immune landscape in prostate cancer. Front Genet. 14:10967832023.
View Article : Google Scholar : PubMed/NCBI
|