Introduction
Cervical cancer is a significant public health
challenge, ranking as the fourth most common type of cancer and the
fourth most prevalent cause of mortality among women globally
(1). The prognosis for recurrent or
metastatic cervical cancer remains poor owing to limited treatment
options (2–4). Despite the notable success of immune
checkpoint blockade therapy in the treatment of various tumors, its
clinical efficacy in recurrent or metastatic cervical cancer is
suboptimal, and the factors contributing to this limited efficacy
include the necessity of programmed death-ligand 1 expression, the
emergence of drug resistance, and low remission rates (5,6).
Macrophage migration inhibitory factor (MIF) has
been found to be highly expressed in various types of solid tumors,
and to function as a multifunctional pro-inflammatory cytokine that
modulates immune responses, exacerbates inflammation, and promotes
cancer progression and metastasis (7). MIF regulates inflammatory pathways by
directly or indirectly modulating the secretion of various
cytokines, including tumor necrosis factor-α, interferon-γ,
interleukin (IL)-1β and IL-18 (7).
By recruiting immune cells to form an immunosuppressive tumor
microenvironment, MIF provides a favorable microenvironment for
cancer progression (8,9).
Inflammasomes have emerged as a key focus of
research, which has advanced the understanding of tumor-associated
inflammation. Inflammasomes are multiprotein complexes that detect
dangerous external stimuli and initiate inflammatory responses
(10). At present, the most
extensively studied inflammasome is NLR family pyrin domain
containing 3 (NLRP3); it assembles into an inflammasome through
self-oligomerization, activates caspase-1, and facilitates the
maturation and release of IL-1β and IL-18, which recruit
immunosuppressive cells (11). MIF
has been indicated to influence the activation and/or assembly of
the NLRP3 inflammasome through intracellular and extracellular
pathways (12,13). However, the role of MIF in relation
to the inflammasome in cervical cancer remains unexplored.
Initial screening via the gene chip sequencing of
cervical squamous cell carcinoma (CSCC) tissues revealed the
significant upregulation of MIF expression in patients with lymph
node metastases (14). Therefore,
the present study aimed to explore the role of MIF in the
recurrence and metastasis of CSCC, which may have important
clinical implications for the treatment and prevention of cervical
cancer progression.
Materials and methods
Human tissue specimens
A total of 12 fresh tissue samples from patients
with CSCC, with or without lymph node metastases, were collected
during gynecological treatments at the Third Hospital of Shanxi
Medical University (Taiyuan, China) during the period from June
2024 to August 2024. All selected patients did not have any other
systemic malignant tumors, had not undergone surgery for any
reason, and had no other comorbidities. In addition, they had not
received any preoperative radiation or chemotherapy for CSCC, and
their clinical, imaging and pathological data, and follow-up
information were complete. Each sample underwent independent
assessment and diagnosis by three senior clinical pathologists.
After surgical removal, the fresh tissue specimens were promptly
frozen and preserved in the biological specimen repository at the
hospital. Written informed consent was obtained from patients and
their families for the use of their samples and data, and the study
protocol was approved by the Ethics Committee of the Third Hospital
of Shanxi Medical University (approval no. YXLL-2024-117).
Cell culture
The human CSCC cell lines SiHa (cat. no. TCHu113;
http://www.cellbank.org.cn/search-detail.php?id=187)
and CaSki (cat. no. TCHu137; http://www.cellbank.org.cn/search-detail.php?id=210),
both of which are human papillomavirus 16 positive, were obtained
from The Cell Bank of Type Culture Collection of The Chinese
Academy of Sciences. The H8 human normal cervical epithelial cell
line (cat. no. TCH-C616; http://www.cas9×.com/bdxb/106381.html) was obtained
from the Haixing Biosciences. The THP-1 human monocytic leukemia
cell line (cat. no. CL-0233) was sourced from Wuhan Pricella
Biotechnology Co., Ltd. The SiHa and CaSki cell lines are
immortalized cell lines derived from cervical cancer tissues. The
SiHa and CaSki cell lines were utilized at the 5th passage after
purchase. SiHa and H8 cells were cultured in DMEM (cat. no.
PYG0073; Boster Biological Technology) supplemented with 10% FBS
(cat. no. PYG0109-500; Boster Biological Technology) and 1%
antibiotics (penicillin-streptomycin). CaSki and THP-1 cell lines
were cultured in RPMI-1640 medium (cat. no. PYG0006; Boster
Biological Technology) supplemented with 10% FBS and 1%
antibiotics. All cell lines were maintained in a cell culture
incubator at 37°C with 95% air and 5% CO2. Cells were
cultured in a 6-well plate, ensuring that the cell count reached
~1×10⁶ and the confluence reached 70–80% before using
the cells for subsequent experiments. THP-1 cells were used as they
are widely used in scientific research as a model for studying
macrophage function and differentiation. THP-1 cells are a cell
line derived from human acute monocytic leukemia, and they have the
potential to differentiate into macrophage-like cells, making them
an important tool for studying the biological characteristics,
functions and drug effects on macrophages. Due to their easy
cultivation, rapid proliferation and the ability to be induced to
differentiate under specific stimulation conditions, THP-1 cells
have become a commonly used cell model for studying
macrophage-related diseases (15).
Collection of cell culture
supernatant
The culture flask was gently shaken to mix the cell
culture supernatant uniformly. An appropriate amount of cell
culture supernatant was carefully aspirated into a new centrifuge
tube, and an appropriate amount of fresh medium added to the
culture flask. The aspirated culture supernatant was centrifuged at
4°C and 1,000 × g for 10 min, and then the supernatant was
re-aspirated into a new spare centrifuge tube, discarding the
remaining cell debris and impurities in the tube. The re-collected
cell culture supernatant was filtered through a virus filter (0.22
µm). The filtered cell culture supernatant samples were stored at
−20°C or −80°C to avoid repeated freeze-thaw cycles. Before use,
the samples were thawed and the required medium was prepared for
the experiment according to the following ratio: Conditioned
medium:fresh medium=1:1.
Co-culture experiment
THP-1 cells with good growth status and a density of
80–90% were selected. After digestion and counting, the cells were
added to RPMI-1640 complete medium to achieve a concentration of
5×10⁵ cells/Ml. next, 100 ng/ml PMA was added, and the
mixture was thoroughly mixed by pipetting. The cells were plated
into a six-well plate and incubated in a cell incubator with 5%
CO2 at 37°C for 24 h. After 24 h, the supernatant was
discarded, and the cells were washed three times with PBS.
RPMI-1640 complete medium was added to allow the cells to recover
for another 24 h. Subsequently, the supernatant was removed again,
and the cells were washed three times with PBS. The previously
collected Cell Culture Supernatant was then used as the co-culture
conditioned medium, added to the six-well plate and supplemented
with RPMI-1640 complete medium to a total volume of 2 ml per well.
The cells were co-cultured for 24 h and prepared for subsequent
experiments.
Reverse-transcription quantitative PCR
(RT-qPCR)
Cells were cultured in a 6-well plate, until the
cell count reached ~1×10⁶, with a cell density of
70–80%. At this point, the cells were ready for analysis. Total RNA
was extracted from cells and tissue samples using Total RNA
Extraction Kit (cat. no. R1200; Beijing Solarbio Science &
Technology Co., Ltd.). For mRNA quantification, the RNA was reverse
transcribed into cDNA using a Reverse Transcription kit (cat. no.
R223-01; Vazyme Biotech Co., Ltd.) according to the manufacturer's
protocol. Subsequently, qPCR was performed using a Real-Time PCR
kit (cat. no. Q711-02; Vazyme Biotech Co., Ltd.) according to the
manufacturer's protocol. The thermocycling conditions were: Initial
denaturation at 95°C for 30 sec; 40 cycles of 95°C for 3 sec and
60°C for 10 sec; and a final melting curve stage at 95°C for 15
sec, 60°C for 30 sec and 95°C for 15 sec. The relative mRNA
expression levels were normalized to those of GAPDH using the
2−ΔΔCq method (16). The
sequences of the primers used for amplification were: GAPDH
forward, 5′-TGACTTCAACAGCGACACCCA-3′ and reverse,
5′-CACCCTGTTGCTGTAGCCAAA-3′; MIF forward, 5′-ACCAGCTCATGGCCTTCGG-3′
and reverse, 5′-TTGGCCGCGTTCATGTCG-3′; NLRP3 forward,
5′-TGAACAGCCACCTCACTT-3′ and reverse, 5′-CAACCACAATCTCCGAAT-3′;
apoptosis-associated speck-like protein containing a CARD (ASC)
forward, 5′-TGGACGCCTTGGACCTCA-3′ and reverse,
5′-TTGGCTGCCGACTGAGGA-3′; caspase-1 forward,
5′-ATTACAGACAAGGGTGCT-3′ and reverse, 5′-GAATAACGGAGTCAATCAAA-3′;
prostate stem cell antigen (PSCA) forward, 5′-AGCCCAGGTGAGCAACGA-3′
and reverse, 5′-TCATCCACGCAGTTCAAGC-3′; laminin subunit β 1 (LAMB1)
forward, 5′-TACACCTCCTCTGATAGCG-3′ and reverse,
5′-ATCTCCTGAACCTCCCAC −3′; solute carrier 39 member 10 (SLC39A10)
forward, 5′-TGCCTCATTTGTTTGCTG-3′ and reverse,
5′-TTCCACGATGCTGTCTGT-3′; solute carrier 35 member F2 (SLC35F2)
forward, 5′-TGGACTCTTTCTGTTTGGCTAT-3′ and reverse,
5′-GGAGGCACGCTGCTTTCA-3′; solute carrier family 1 member 4 (SLC1A4)
forward, 5′-CCATTGGGCTGCCTACTC-3′ and reverse,
5′-CCTTTCTTTGTTGCCTTCTG-3′; ArfGAP with coiled-coil, ankyrin repeat
and PH domain-containing protein 3 (ACAP3) forward,
5′-AGGGCGACACCGTCATCT-3′ and reverse, 5′-TTCCGCACATCCTCTTTGA-3′;
oxysterol binding protein like 6 (OSBPL6) forward,
5′-TCACTGTCTCAGGCACTC-3′ and reverse, 5′-TCTCATTGGCTACTTGCT-3′;
TSCC22 domain family protein 3 (TSC22D3) forward,
5′-CACCCTGTTGAAGACCCT-3′ and reverse, 5′-TTACACCGCAGAACCACC-3′;
asparagine synthetase (ASNS) forward, 5′-AACAGTTCGTGCTTCAGT-3′ and
reverse, 5′-ATGTAACCCTGCGTAAGT-3′; coagulation factor III (F3)
forward, 5′-CCGACGAGATTGTGAAGG-3′ and reverse,
5′-TGGCTGTCCGAGGTTTGT-3′; tribbles pseudokinase 3 (TRIB3), forward
5′-GCGGTTGGAGTTGGATGA-3′ and reverse, 5′-GCCACAGCAGTTGCACGA-3′;
inducible nitric oxide synthase (iNOS) forward,
5′-ACATGGCTCAACAGCCTGAA-3′ and reverse, 5′-CCAAACACCAAGGTCATGCG-3′;
arginase 1 (Arg1) forward, 5′-AATCCTGGCACATCGGGAATC-3′ and reverse,
5′-TCCTGGTACATCTGGGAACTTTC-3′; CD86 forward,
5′-ATTTGGAACCAAGCAAGAGCA-3′ and reverse,
5′-TACTCAGTCCCATAGTGCTGTCAC-3′; CD206 forward,
5′-ACCTCACAAGTATCCACACCATC-3′ and reverse,
5′-CTTTCATCACCACACAATCCTC-3′. Each experimental condition was
replicated in three separate assays.
Western blotting
The tissue was removed from liquid nitrogen, and a
piece about the size of a soybean was quickly cut and placed in an
Eppendorf tube. This was rinsed 2–3 times with pre-cooled sterile
PBS. An appropriate volume of RIPA buffer (cat. no. AR0105; Boster
Biological Technology), phosphatase inhibitor and protease
inhibitor (cat. no. P1045-1; Beyotime Biotechnology) was added in a
ratio of 100:1:1. The mixture was ground thoroughly on ice and then
placed on a shaker to allow for complete lysis for 30 min for use
(with ice added). Cells were cultured in a 6-well plate until the
cell count reached ~1×10⁶, with a cell density of
70–80%. Total protein was then extracted from the cells using RIPA
buffer and quantified using a BCA Protein Assay kit (cat. no.
AR118; Boster Biological Technology). SDS gels were prepared using
a PAGE Gel Fast Preparation Kit (cat. no. AR0138; Boster Biological
Technology). Following SDS-PAGE (typically using a gel with a
concentration of 10% and loading 25 µg of sample per lane), the
resolved proteins were transferred to PVDF membranes (cat. no.
AR0136-04; Boster Biological Technology) and blocked using a
protein-free rapid blocking solution (cat. no. AR0041; Boster
Biological Technology) for 10 min at 25°C. The membranes were
subsequently incubated with a primary antibody overnight at 4°C.
The following primary antibodies were used: Anti-MIF (1:1,000
dilution; cat. no. DF6404; Affinity Biosciences), anti-GAPDH
(1:3,000; cat. no. AP0063; Bioworld Technology, Inc.), anti-NLRP3
(1:1,000; cat. no. ab263899; Abcam), anti-ASC (1:1,000; cat. no.
ab283684; Abcam), anti-caspase-1 (1:1,000; cat. no. ab207802;
Abcam) and anti-TSC22D3 (1:2,000; cat. no. DF10077; Affinity
Biosciences). After washing, the membranes were incubated with
horseradish peroxidase-labeled goat anti-rabbit secondary antibody
(1:3,000; cat. no. S0001; Affinity Biosciences) for 1 h at 25°C.
Antibody antigen complexes were detected using Ultra-sensitive ECL
Substrate (cat. no. AR1191; Boster Biological Technology). For the
densitometric quantification of the blots, ImageJ software (version
1.8; National Institutes of Health) was used. Each experimental
condition was replicated in three separate assays.
Cell viability assay
A Cell-Counting Kit-8 (CCK-8) assay (cat. no.
AR1160; Boster Biological Technology) was used to assess cell
viability. Cells were seeded in a 96-well plate at a density of
5,000-10,000 cells/well in 100 µl media and incubated at 37°C for
24 h. After incubation, 10 µl CCK-8 solution was added to each well
and the plate was incubated for 1 h. The absorbance at 450 nm was
measured using a microplate reader after 24, 48, 72, 96 and 120 h.
Three replicate wells were used for each time point, and the mean
absorbance value was calculated to plot cell growth curves.
Colony formation assay
To evaluate colony formation, 500–1,000 cells were
seeded into 6-well plates and cultured for 2 weeks. Subsequently,
the cells were fixed using 4% paraformaldehyde at room temperature
for 15–30 min and stained using 0.5% crystal violet at room
temperature for 10–20 min. Colonies consisting of >50 cells were
considered viable and counted using a light microscope. Each
experimental condition was replicated in three separate assays.
Transwell invasion and migration
assay
Transwell invasion assays were performed using
24-well Transwell plates with 8-µm pores (Corning Inc.), pre-coated
with Matrigel (cat. no. Falcon 354480; BD Biosciences), which were
incubated in a 37°C incubator for 30 min to 1 h until the Matrigel
was completely solidified to form a uniform gel layer. A suspension
containing 1×10⁵ cells in 500 µl DMEM with 1% FBS was
added to the upper chamber, while 750 µl DMEM supplemented with 10%
FBS was added to the lower chamber. After 48 h of incubation, the
Matrigel and cells remaining in the upper chamber were removed
using cotton swabs. The cells on the lower surface of the membrane
were fixed in 4% paraformaldehyde at room temperature for 20–30 min
and then stained with 0.5% crystal violet at room temperature for
15–30 min. Subsequently, cells in five microscopic fields (×200
magnification) were counted and images captured. All experiments
were conducted in triplicate. For the migration assay, Transwell
plates that were not coated with Matrigel were utilized. The
remaining steps were similar to those of the invasion assay, with
the exception of omitting the Matrigel coating and solidification
processes.
Enzyme-linked immunosorbent assay
(ELISA)
Cells were cultured in a 6-well plate, until the
cell count reached ~1×10⁶, with a cell density of
70–80%. At this point, the culture medium was collected and
centrifuged at 1,000 × g for 20 min at 2–8°C to remove impurities
and cell debris, and the supernatant was separated for analysis.
The levels of IL-1β and IL-18 in the supernatant were determined
using Human IL-1β ELISA Kit (cat. no. SEKH-0002, Beijing Solarbio
Science & Technology Co., Ltd.) and Human IL-18 ELISA Kit (cat.
no. SEKH-0028), according to the manufacturer's protocol. A linear
fit method was used to generate a standard curve. Each experimental
condition was replicated in three separate assays.
Flow cytometry
Cells were cultured in a 6-well plate, until a cell
count of ~1×10⁶ and a cell density of 70–80% were
achieved. The cells were then collected, processed into a
single-cell suspension, and centrifuged at 300 × g for 5 min at
25°C. Subsequently, the cells were washed twice with 4 ml flow
buffer, centrifuged at 300 × g for 5 min at 4°C, and then
resuspended in 0.5 ml flow buffer. After adding 5 µl Annexin V/FITC
and mixing well, the mixture was incubated at room temperature in
the dark for 5 min. Next, 5 µl propidium iodide (PI) solution and
400 µl PBS were added, and flow cytometry detection was performed.
Cell apoptosis was determined using an Annexin V-FITC Apoptosis
Detection Kit (cat. no. CA1020; Beijing Solarbio Science &
Technology Co., Ltd.). A total of 100 µl cell suspension containing
1×10⁶ cells was taken and 20 µl Fc receptor blocker was
added before incubation at room temperature for 5–10 min. Next,
0.625 µl CD86 antibody (cat. no. 12-0862-82; Thermo Fisher
Scientific, Inc.) was added to stain the cells, which were
incubated on ice in the dark for 30–60 min. Subsequently, 1 ml flow
cytometry staining buffer was added to wash the cells, which were
then centrifuged at 400–600 × g for 5 min at room temperature. This
washing step was repeated before detection. Flow cytometry analysis
was performed using a BD FACSCelesta™ flow cytometer (BD
Biosciences), and the data were analyzed using FlowJo version
10.8.1 (FlowJo LLC). Each experimental condition was replicated in
three separate assays.
Transcriptomics and proteomics
sequencing
SiHa cells in which the expression of MIF had been
knocked down and the corresponding negative control cells (vide
infra) were collected during the logarithmic growth. As
previously mentioned, total RNA and protein was extracted from the
cells. Cells with a transfection efficiency >80% were selected
for transcriptomics and proteomics sequencing.
The transcriptome data were generated using the
Illumina sequencing platform and the raw data were processed to
obtain high-quality clean reads. Total RNA was extracted from cells
using Total RNA Extraction Kit (cat. no. R1200; Beijing Solarbio
Science & Technology Co., Ltd.). To verify the quality and
integrity of the samples, the Agilent 2100 bioanalyzer was used to
analyze the RNA Integrity Number for assessing the completeness and
purity of the RNA. The sequencing kit used was the
NEBNext® Ultra™ RNA Library Prep Kit for
Illumina® (NEB #E7530S/L; New England Biolabs). After
preparing the sequencing library, its concentration was measured to
ensure that the optimal concentration of the library was loaded
onto the sequencer. The final loading concentration of the library
was 10 nM. The Illumina NovaSeq 6000 (Illumina, Inc.) sequencing
instrument was used, employing paired-end sequencing with a
nucleotide length of 150 bp. The DESeq2 software package (version
1.20.0; http://bioconductor.org/packages/release/bioc/html/DESeq2.html)
was used for inter-sample differential gene analysis. The
expression ratios between the two groups of samples were expressed
as fold change (FC) values, with screening criteria of P<0.05
and |log2FC|>1 for differentially expressed genes
(DEGs). Statistical analysis was performed with corrections for
multiple comparisons using the false discovery rate method.
A 0.2-mg protein sample was used for Tandem Mass Tag
analysis, using TMT® Mass Tagging Kits and Reagents
according to the manufacturer's protocol (Thermo Fisher Scientific,
Inc.). A high-resolution mass spectrometer (Q Exactive™ plus;
Thermo Fisher Scientific, Inc.) was used to perform the
quantitative proteomics analysis. The mass spectrometer employed a
data-dependent acquisition mode, with a full scan range of
350–1,500 m/z. The resulting spectra from each run were searched
separately against 1327172-1327172-Homo_sapiens using the Fasta
(109,914 sequences) database with the Proteome Discoverer 2.4
search engine (Thermo Fisher Scientific, Inc.). Proteins with
significant differences between the two groups of cells (P<0.05
and |log2FC|>1), were considered differentially
expressed proteins. Each experimental condition was replicated in
three separate assays.
MIF knockdown
To generate retroviral vectors containing short
hairpin RNAs (shRNAs) targeting MIF and a shRNA control
(shCtrl) the following oligodeoxyribonucleotide sequences were
annealed and subcloned between the AgeI and EcoRI
restriction sites of a BR-V108 vector (Shanghai GeneChem Co.,
Ltd.): shCtrl: Pbr17579-a,
CCGGGGGCCTCTTTCTGCTCTATAACTCGAGTTATAGAGCAGAAAGAGGCCCTTTTTG and
Pbr17579-b,
AATTCAAAAAGGGCCTCTTTCTGCTCTATAACTCGAGTTATAGAGCAGAAAGAGGCCC;
shMIF-1: Pbr17580-a,
CCGGGGGTCTACATCAACTATTACTCGAGTAATAGTTGATGTAGACCCTTTTTG and
Pbr17580-b, AATTCAAAAAGGGTCTACATCAACTATTACTCGAGTAATAGTTGATGTAGACCC;
shMIF-2: Pbr17581-a,
CCGGTGCCAGTACGTGCAAGGTGTTCTCGAGAACACCTTGCACGTACTGGCATTTTTG and
Pbr17581-b,
AATTCAAAAATGCCAGTACGTGCAAGGTGTTCTCGAGAACACCTTGCACGTACTGGCA.
Retroviral particles were generated through the
transfection of TOP10 E. coli Competent cells (cat. no.
CB104-03, Tiangen Biotech, Co., Ltd.) with the BR-V108 constructs
and the necessary packaging plasmids, using
Lipofectamine® 2000 (Thermo Fisher Scientific, Inc.). A
second-generation lentiviral packaging system was employed,
utilizing 20 µg GV vector plasmid, 15 µg pHelper 1.0 vector plasmid
and 10 µg pHelper 2.0 vector plasmid for transfection. The
transfection was incubated in a 37°C incubator for 72–96 h.
Regarding the multiplicity of infection, a value of 10 was used to
infect the target cells. SiHa and CaSki cells were cultured in
6-well plates until they reached 50–60% confluence. Subsequently,
the cells were transduced with either shRNA or the empty BR-V108
vector (negative control) in a 37°C incubator for 72–96 h and
selected in a medium containing 10 µg/ml Puromycin for 3–4 days to
allow for the selection of stably transfected cells. The efficiency
of MIF knockdown was assessed at various time points.
MIF and TSC22D3 overexpression
The pcDNA3 expression plasmids were acquired from
Invitrogen (Thermo Fisher Scientific, Inc.). The empty plasmid was
employed as a control, with a transfection concentration of 1.5
µg/ml. Plasmid transfection was carried out using Lipofectamine
2000 according to the manufacturer's guidelines. In brief, cells
were plated in 6-well plates at a concentration of 2×10⁵
cells/well and permitted to adhere overnight. Subsequently, the
plasmid was diluted in Opti-MEM medium (Life Technologies; Thermo
Fisher Scientific, Inc.) and combined with Lipofectamine 2000. This
combination was then introduced to the cells and incubated for 4–6
h at 37°C in an atmosphere containing 5% CO2. The medium
was then exchanged with fresh DMEM supplemented with 10% FBS, and
the cells were further incubated for 24 h in an environment of 95%
air and 5% CO2 prior to use in subsequent experiments.
The empty plasmid served as the control (Ctrl) for MIF-OE and
TSC22D3-OE.
To prepare cells with shMIF/TSC22D3-OE
co-transfections, the SiHa cells with MIF knockdown were
combined with the TSC22D3-OE plasmid and Lipofectamine 2000, and
subjected to the aforementioned transfection protocol. The
efficiency of overexpression or knockdown was assessed at various
time points.
Induction and differentiation of THP-1
cells
Following the adjustment of THP-1 cell density to
5×10⁵ cells/ml, 2 ml cell suspension was added to each
well of a 6-well plate, and supplemented with phorbol 12-myristate
13-acetate (100 ng/ml). The plate was then incubated in a constant
temperature incubator at 37°C with 5% CO2 for 48 h. When
85% of the suspended THP-1 monocytes had adhered to the plate, the
supernatant was aspirated and discarded, and replenishment with
fresh complete medium was performed. Differentiation was induced by
adding LPS (100 ng/ml) and IFN-γ (20 ng/ml) for M1 polarization,
and IL-4 (20 ng/ml) for M2 polarization. The cells were further
incubated in under the same incubator conditions for an additional
48 h. Under high-power microscopy, the cells exhibited larger cell
bodies and elongated protrusions, indicating differentiation into
M1 and M2 macrophages, respectively. Each experimental condition
was replicated in three separate assays.
Bioinformatics
Publicly available databases were used for
expression, survival and prognostic analyses. For analysis using
the Gene Expression Profiling Interactive Analysis (GEPIA) database
(http://gepia.cancer-pku.cn/), the
expression of MIF was compared between normal and CSCC tissues, and
among different cancer stages. In addition, in the ‘Survival
Analysis’ module, the gene symbol MIF was input, the specific tumor
type was selected, and overall survival (OS) was analyzed. It was
not possible to restrict the time range in GEPIA to remove the
late-stage crossover of the survival curves. Similarly, the UALCAN
database (http://ualcan.path.uab.edu/) was used to compare the
expression of MIF between normal and primary CSCC tissues, and
among different cancer stages. Kaplan-Meier Plotter (http://kmplot.com/analysis/) was used to generate the
Kaplan-Meier survival curve.
Statistical analysis
Statistical analysis was performed using SPSS
version 22.0 (IBM Corp.). Graphs were created and analyzed using
GraphPad Prism version 9.5 (Dotmatics) and Adobe Illustrator
Creative Cloud 2017 (Adobe Systems Europe, Ltd.). For quantitative
data, normality and homogeneity of variance were assessed. Data
with a normal distribution were expressed as the mean ± standard
deviation, while non-normally distributed data were presented as
the median (interquartile range). When comparing data between two
groups, an independent samples t-test was used if the data were
normally distributed and a Mann-Whitney U test was used for
non-normally distributed data. Comparisons between multiple groups
were performed using a one-way ANOVA followed by least significant
difference or Tukey's post hoc tests. P<0.05 was considered to
indicate a statistically significant difference.
Results
MIF is significantly upregulated in
CSCC and associated with a poor prognosis
Initial analysis of MIF expression in cervical
cancer using the GEPIA database revealed that MIF levels in
cervical cancer tissues were significantly elevated compared with
those in normal cervical tissues (Fig.
1A). Further analysis using the UALCAN database confirmed that
MIF expression in cervical cancer was higher than that in normal
tissue (Fig. 1C). Additionally, MIF
expression levels increased as the stage of cervical cancer
increased, as evidenced by analyses from both databases (Fig. 1B and D). In fresh CSCC tissues, MIF
expression levels were significantly higher in the tissues of
patients with lymph node metastasis than in those without (Fig. 1E-G). Furthermore, MIF expression
levels were significantly elevated in the SiHa and CaSki CSCC cell
lines compared with those in the H8 normal cervical epithelial cell
line (Fig. 1H), highlighting the
potential role of MIF in cervical cancer progression. Analysis of
OS data from 292 patients with cervical cancer using GEPIA
indicated that high MIF expression was associated with
significantly poorer OS compared with that of patients with low MIF
expression (Fig. 1I). This was
corroborated by data obtained using Kaplan-Meier Plotter,
confirming the association between high MIF expression and reduced
OS in patients with cervical cancer (Fig. 1J). These results underscore the
potential significance of MIF in cervical cancer progression and
prognosis.
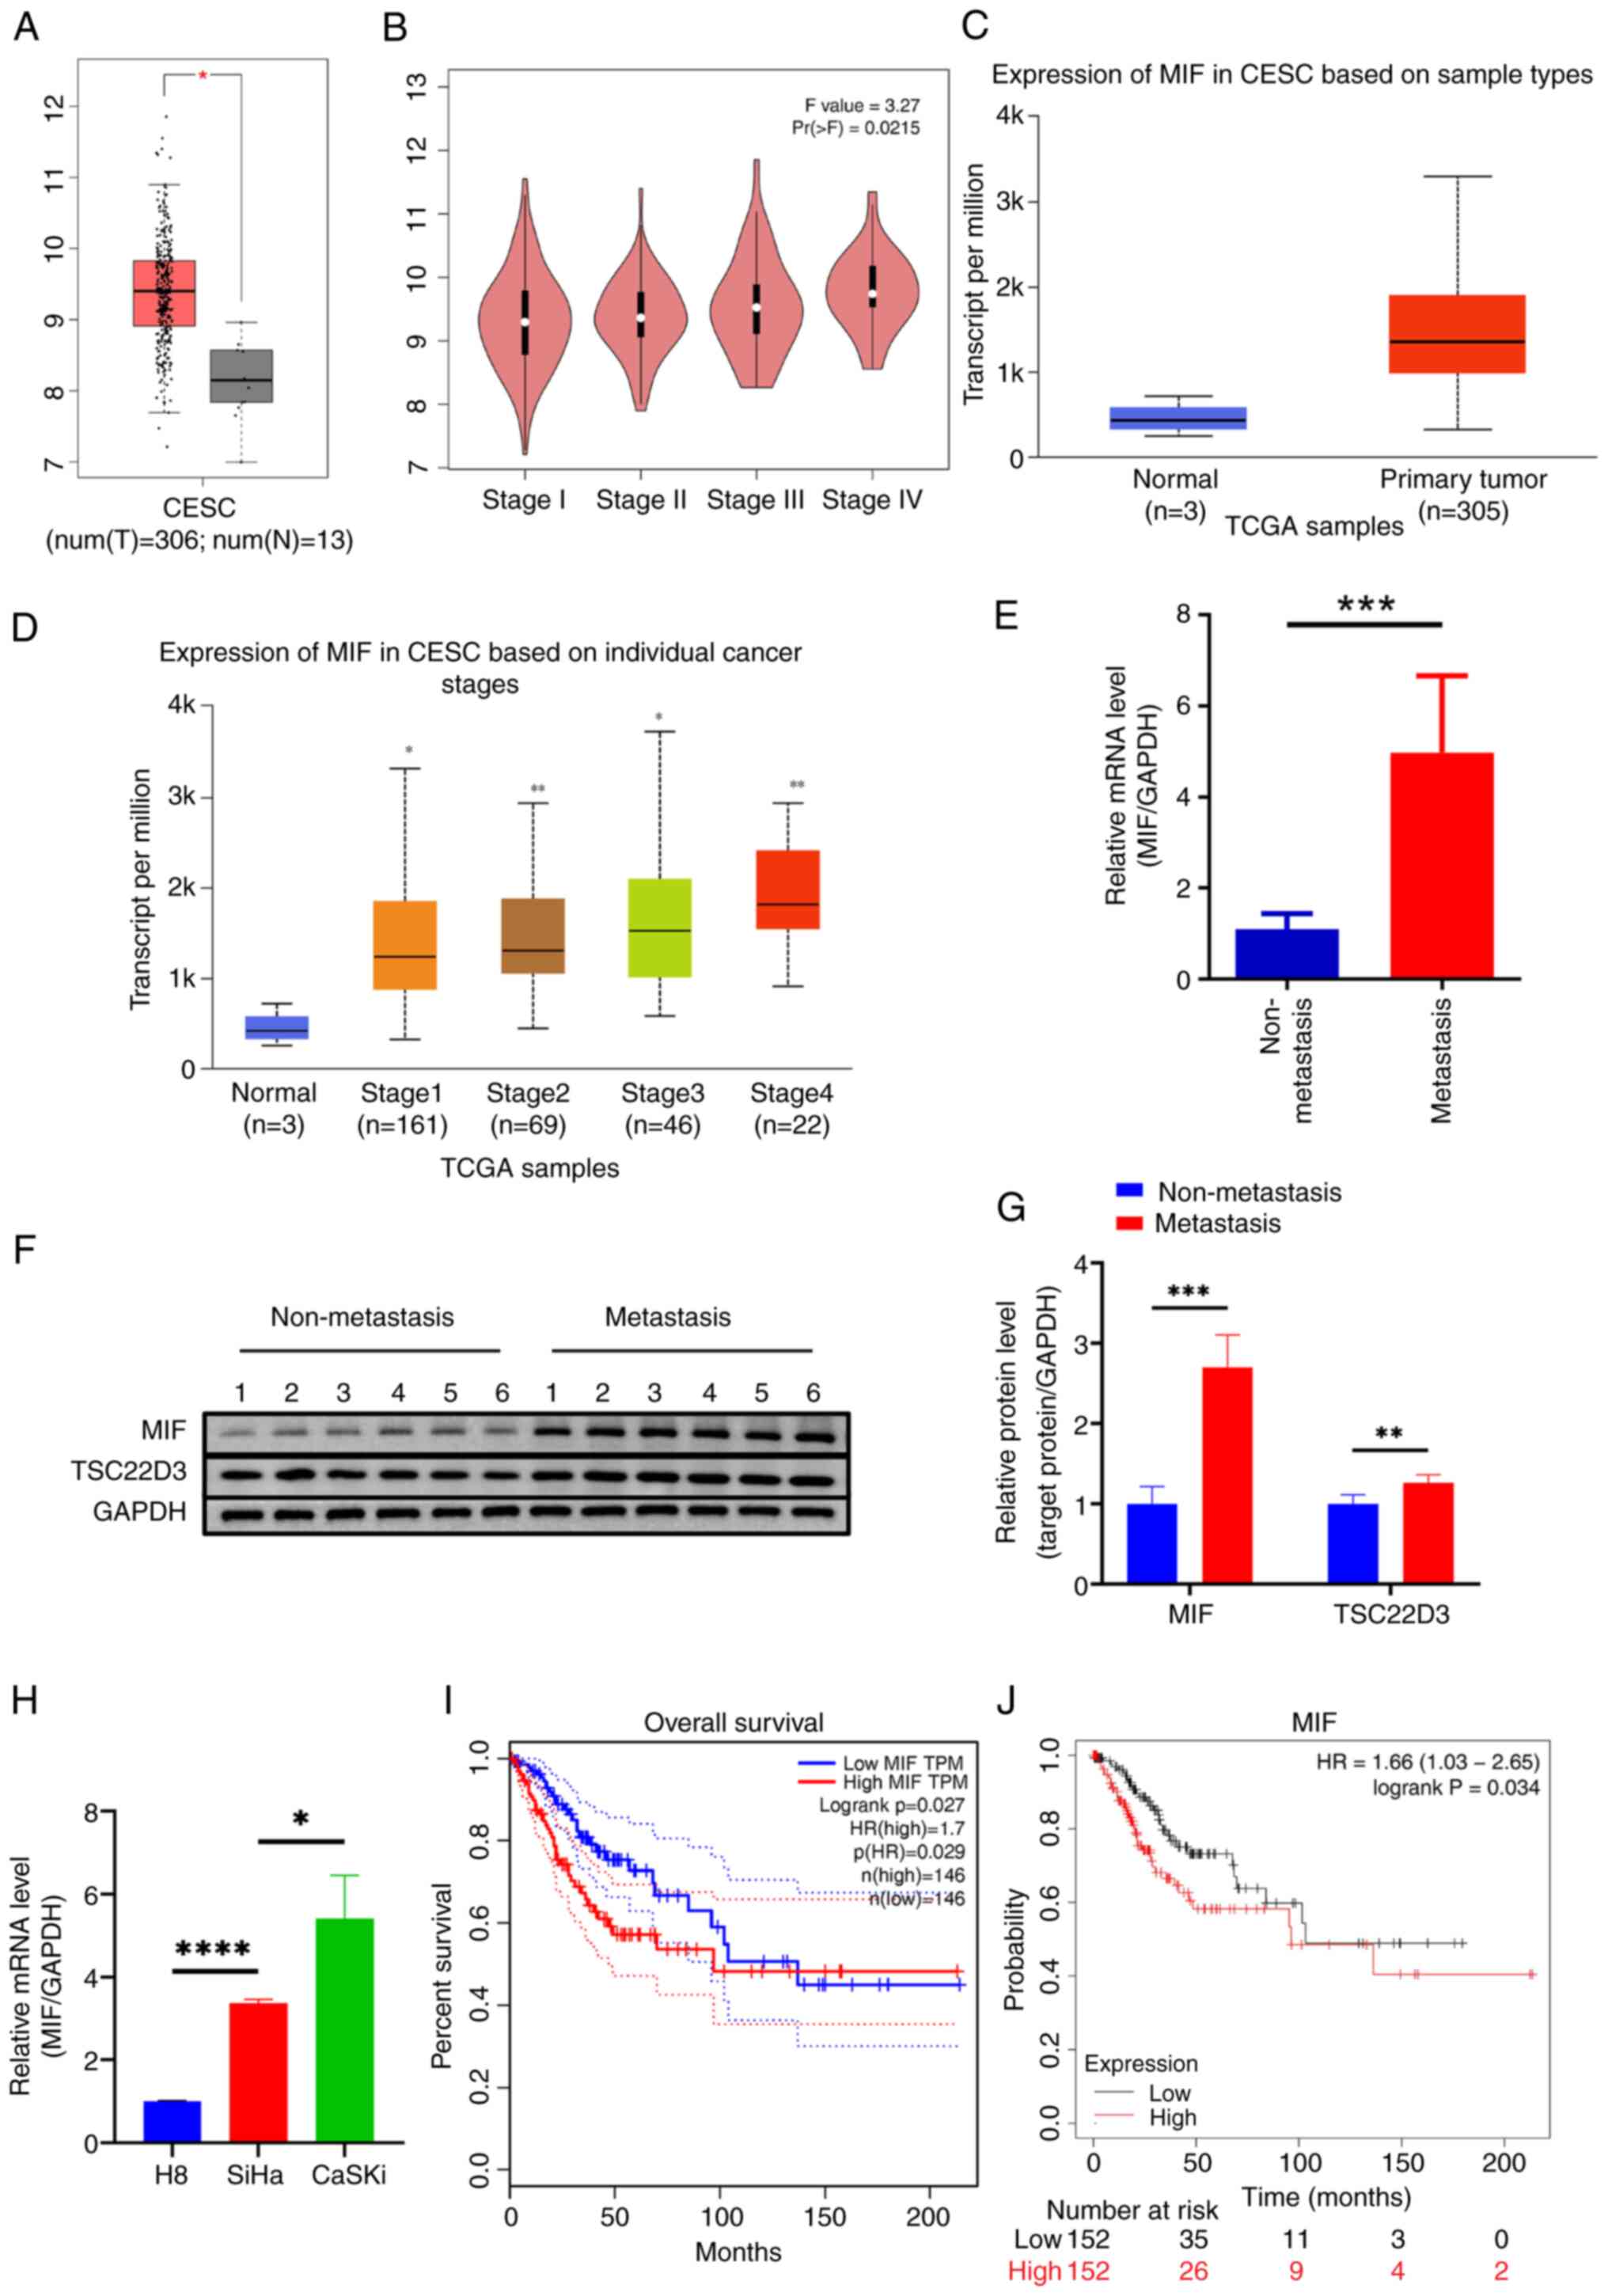 | Figure 1.MIF is significantly upregulated in
CSCC. MIF is highly expressed in CSCC tissue based on data obtained
from the (A) GEPIA and (B) UALCAN databases. MIF expression was
positively correlated with CSCC stage according to (C) GEPIA and
(D) UALCAN data. (E) RT-qPCR and (F and G) western blotting were
used to determine the mRNA and protein expression of MIF in CSCC
tissues, respectively. (H) RT-qPCR analysis of the mRNA expression
of MIF in CSCC and normal cervical cell lines. Data from (I)
GEPIA and (J) Kaplan-Meier Plotter showed that the overall survival
of patients with highly MIF expressing cervical cancer was poor.
*P<0.05, **P<0.01, ***P<0.001, ****P<0.0001. MIF,
macrophage migration inhibitory factor; CSCC/CESC, cervical
squamous cell carcinoma; T, tumor tissue; N, normal tissue; TPM,
transcripts per million; Pr(>F), P-value of the F statistic;
TCGA, The Cancer Genome Atlas; RT-qPCR, reverse
transcription-quantitative polymerase chain reaction; TSC22D3,
TSC22 domain family protein 3; HR, hazard ratio. |
MIF promotes CSCC progression and is
associated with inflammasome activation
To investigate the impact of MIF on the malignant
behavior of CSCC, MIF-knockdown plasmids were designed and
packaged into lentiviral particles for transfection into SiHa and
CaSki CSCC cells. Fluorescence microscopy revealed markedly higher
fluorescence intensity in the SiHa cells than in the CaSki cells
(Fig. 2A), indicating superior
infection efficiency in the SiHa cells. Therefore, SiHa cells were
selected for use in subsequent experiments. The efficiency of
MIF knockdown and overexpression in the SiHa cells was then
evaluated (Fig. 2B-G).
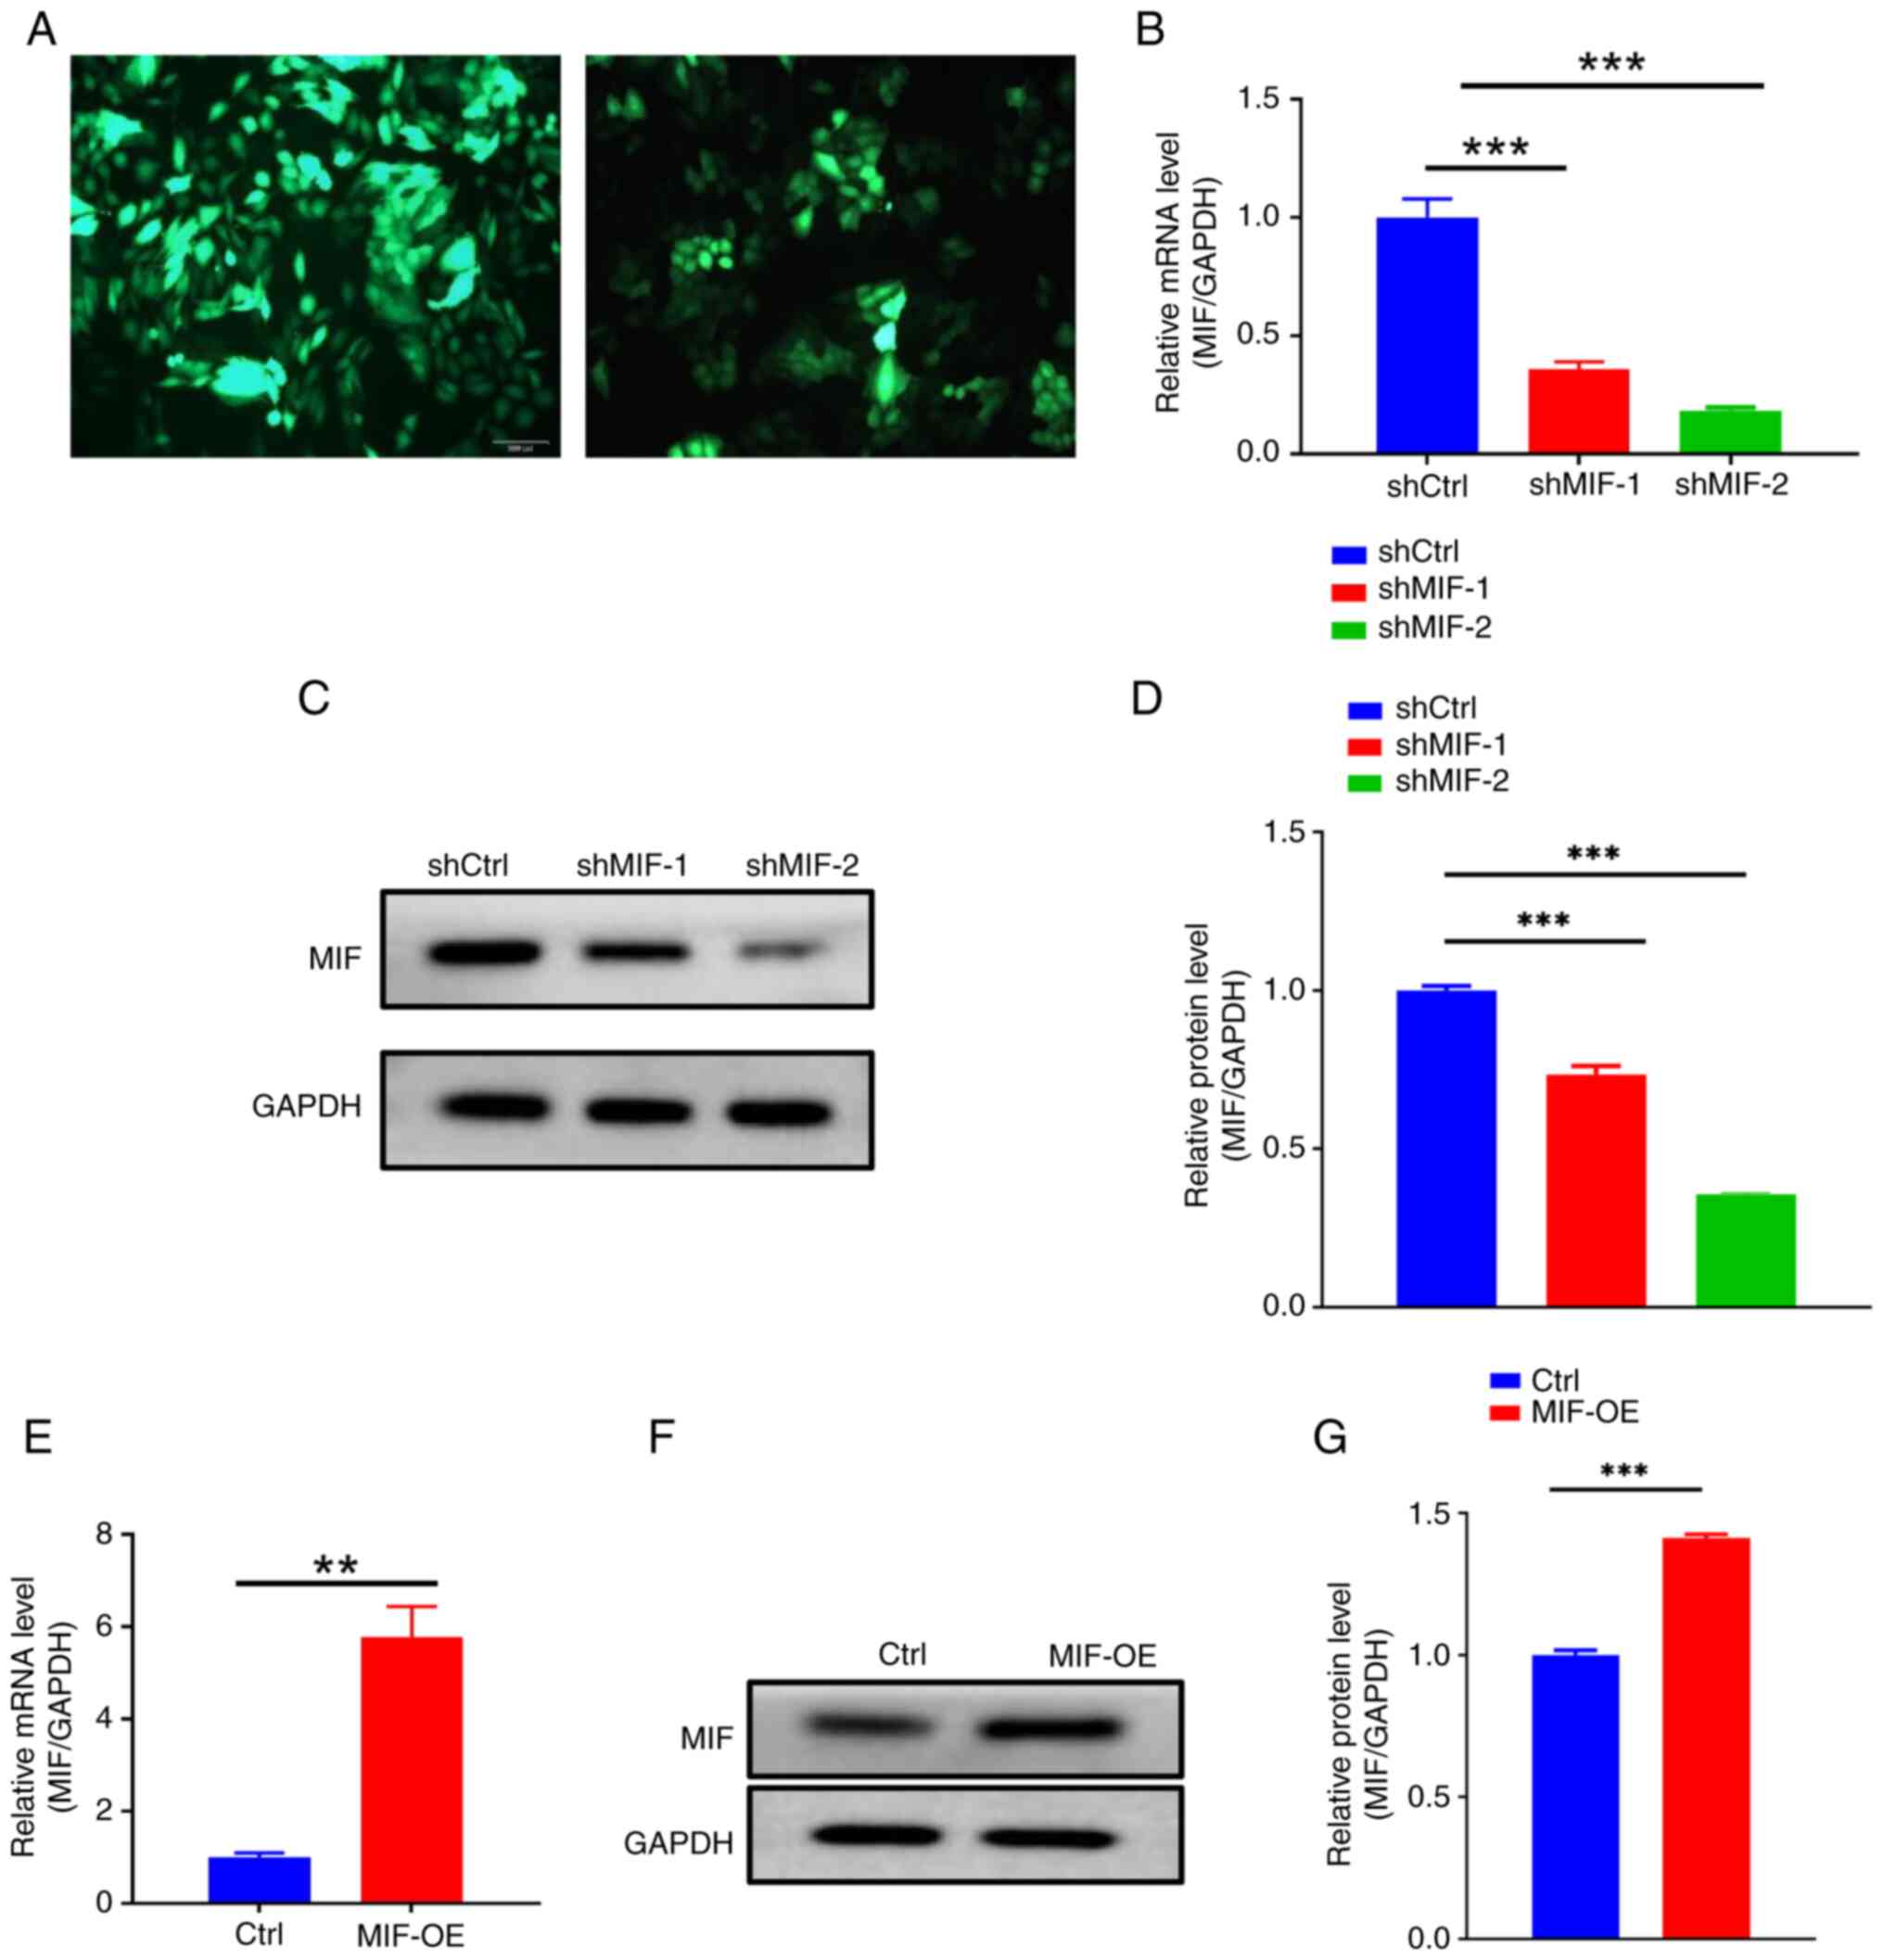 | Figure 2.Verification of MIF knockdown
and overexpression. (A) Fluorescence efficiency in MIF
knockdown lentivirus-infected SiHa and CaSki cells; left panel,
SiHa; right panel, CaSki. Magnification, ×200. (B) RT-qPCR was used
to determine the efficiency of MIF knockdown. (C and D)
Western blotting was used to confirm that the protein expression of
MIF was also reduced. (E) RT-qPCR was used to verify MIF
overexpression in the transfected cells. (F and G) western blotting
confirmed MIF overexpression at the protein level. **P<0.01,
***P<0.001. MIF, macrophage migration inhibitory factor;
RT-qPCR, reverse transcription-quantitative polymerase chain
reaction; shMIF, short-hairpin RNA targeting MIF; shCtrl,
short-hairpin RNA control; OE, overexpression; Ctrl, empty vector
control. |
To investigate the effects of MIF knockdown
on CSCC progression, a CCK-8 assay was performed, which revealed a
significant reduction in the proliferative ability of SiHa cells in
the shMIF groups compared with that of cells in the control group
(Fig. 3A). Additionally, flow
cytometry indicated a notable increase in the total percentage of
apoptotic SiHa cells in the shMIF groups compared with that in the
control group, with significantly higher percentages of both early
and late apoptotic cells (Fig. 3D).
The colony formation assay demonstrated a substantial reduction in
the colony formation capacity of SiHa cells in the shMIF groups, as
evidenced by a significant reduction in the number of colonies
compared with those in the control group, as well as a clear
reduction in the area of the colonies (Fig. 3E). Furthermore, the Transwell assay
revealed a significant reduction in the invasive capacity of SiHa
cells in the shMIF groups compared with that of the control group
(Fig. 3F).
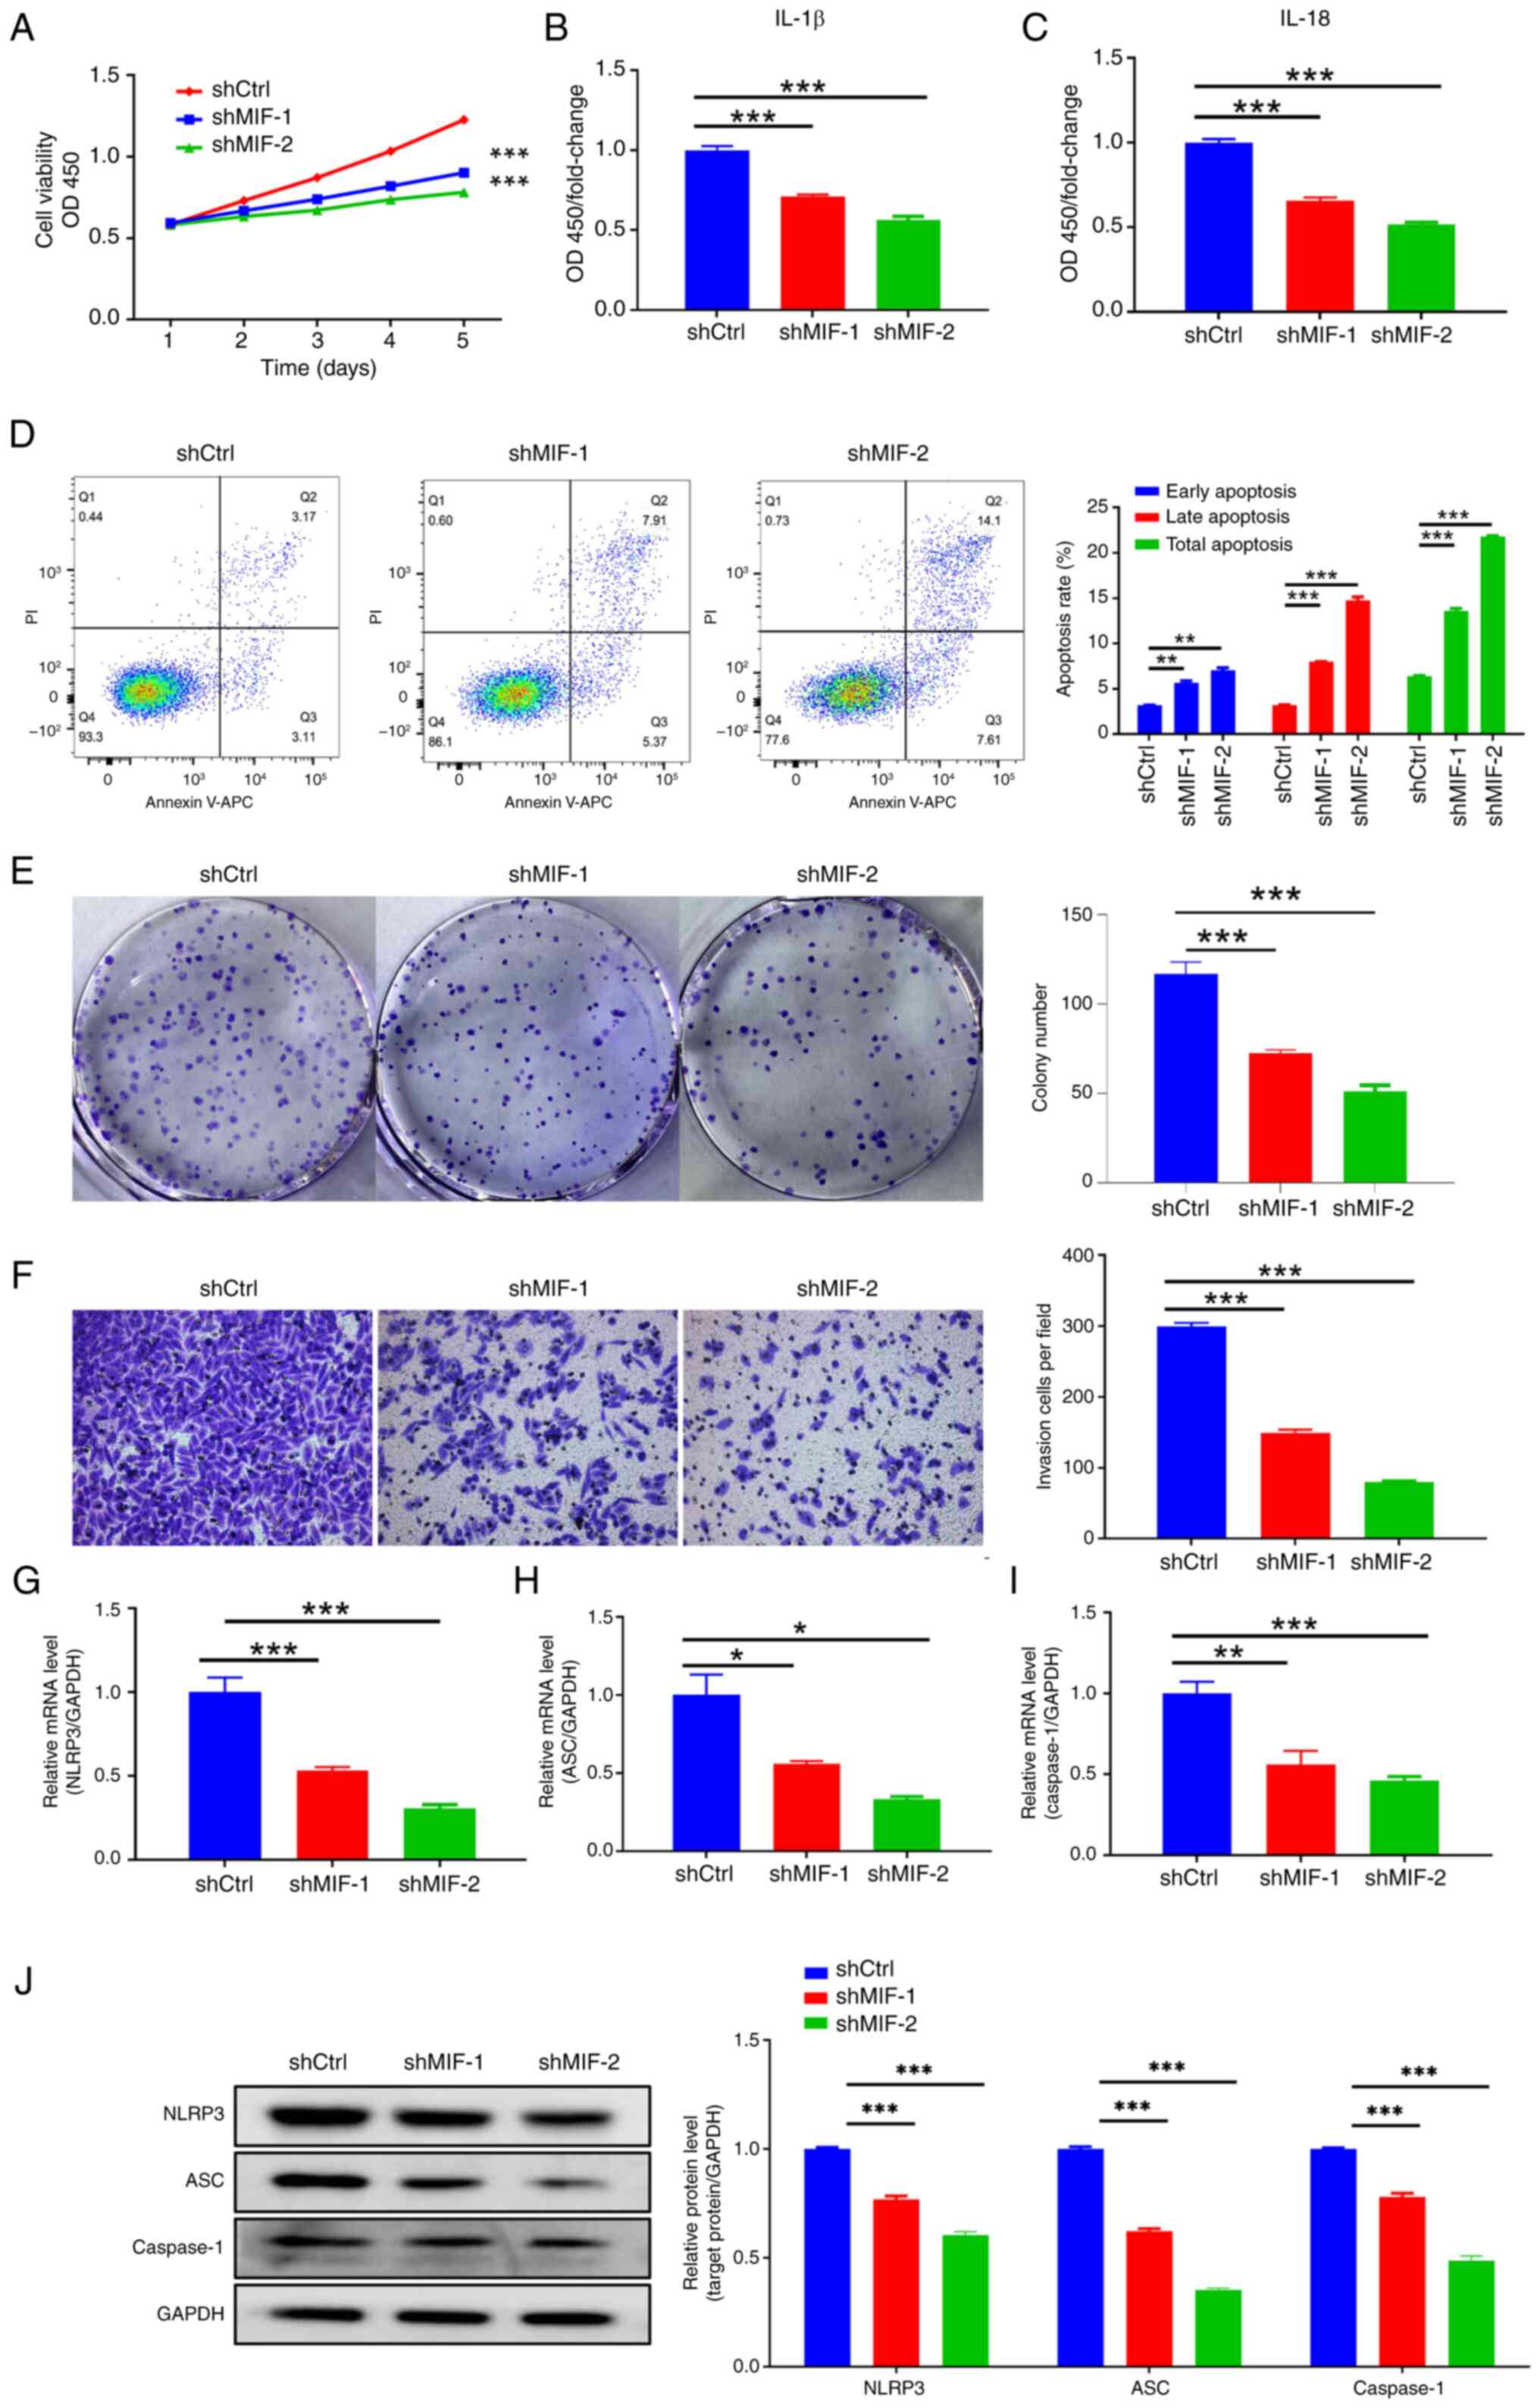 | Figure 3.MIF knockdown inhibits
cervical squamous cell carcinoma progression. (A) Cell Counting
Kit-8 showing the proliferation of SiHa cells following MIF
knockdown. Enzyme-linked immunosorbent assays showing the
expression of the inflammasome-associated proteins (B) IL-1β and
(C) IL-18 following MIF knockdown. (D) Flow cytometry, (E) colony
formation and (F) Transwell invasion assays (magnification, ×200)
showing the apoptosis and invasion of SiHa cells following MIF
knockdown. (G-I) Reverse transcription-quantitative polymerase
chain reaction and (J) western blotting assays were used to
determine the expression of the inflammasome-associated mRNA and
proteins NLRP3, ASC and caspase-1 following MIF knockdown.
*P<0.05, **P<0.01, ***P<0.001 vs. shCtrl. MIF, macrophage
migration inhibitory factor; OD, optical density; OD450, OD at 450
nm; shCtrl, short-hairpin RNA control; shMIF, short-hairpin RNA
targeting MIF; NLRP3, NLR family pyrin domain containing 3; ASC,
apoptosis-associated speck-like protein containing a CARD. |
Further investigation of changes in the inflammasome
following MIF knockdown included assessment of the
expression of the inflammasome-related proteins NLRP3, ASC and
caspase-1 and their respective mRNAs. The results revealed
significant reductions in the mRNA and protein expression levels of
NLRP3, ASC and caspase-1 in the shMIF groups compared with those in
the control group (Fig. 3G-J).
Additionally, the ELISA analysis of inflammasome-related factors
IL-1β and IL-18 in the supernatant of SiHa cells revealed that
secretion of these factors was reduced following MIF
knockdown compared with that in the control group (Fig. 3B and C).
By comparison, the proliferative ability of cells in
the MIF-OE group was significantly higher than that of cells in the
control group (Fig. 4A). In
addition, flow cytometry revealed a significant reduction in the
apoptotic rate of the MIF-OE group compared with that of the
control (Fig. 4D). Additionally,
the colony formation assay showed a significant increase in the
colony formation capacity of the cells due to MIF
overexpression (Fig. 4E). The
results of the Transwell assays indicated a significant increase in
the invasive ability of cells following MIF overexpression
(Fig. 4F). The expression of
inflammasome-related proteins and their respective mRNAs was
assessed, and significant increases for all proteins and mRNAs were
observed in the MIF-OE group compared with those in the control
group (Fig. 4G and H). Furthermore,
ELISA analysis revealed that MIF overexpression
significantly increased the levels of IL-1β and IL-18 in the
supernatant of SiHa cells (Fig. 4B and
C). These results suggest that MIF may promote CSCC progression
and is associated with inflammasome activation.
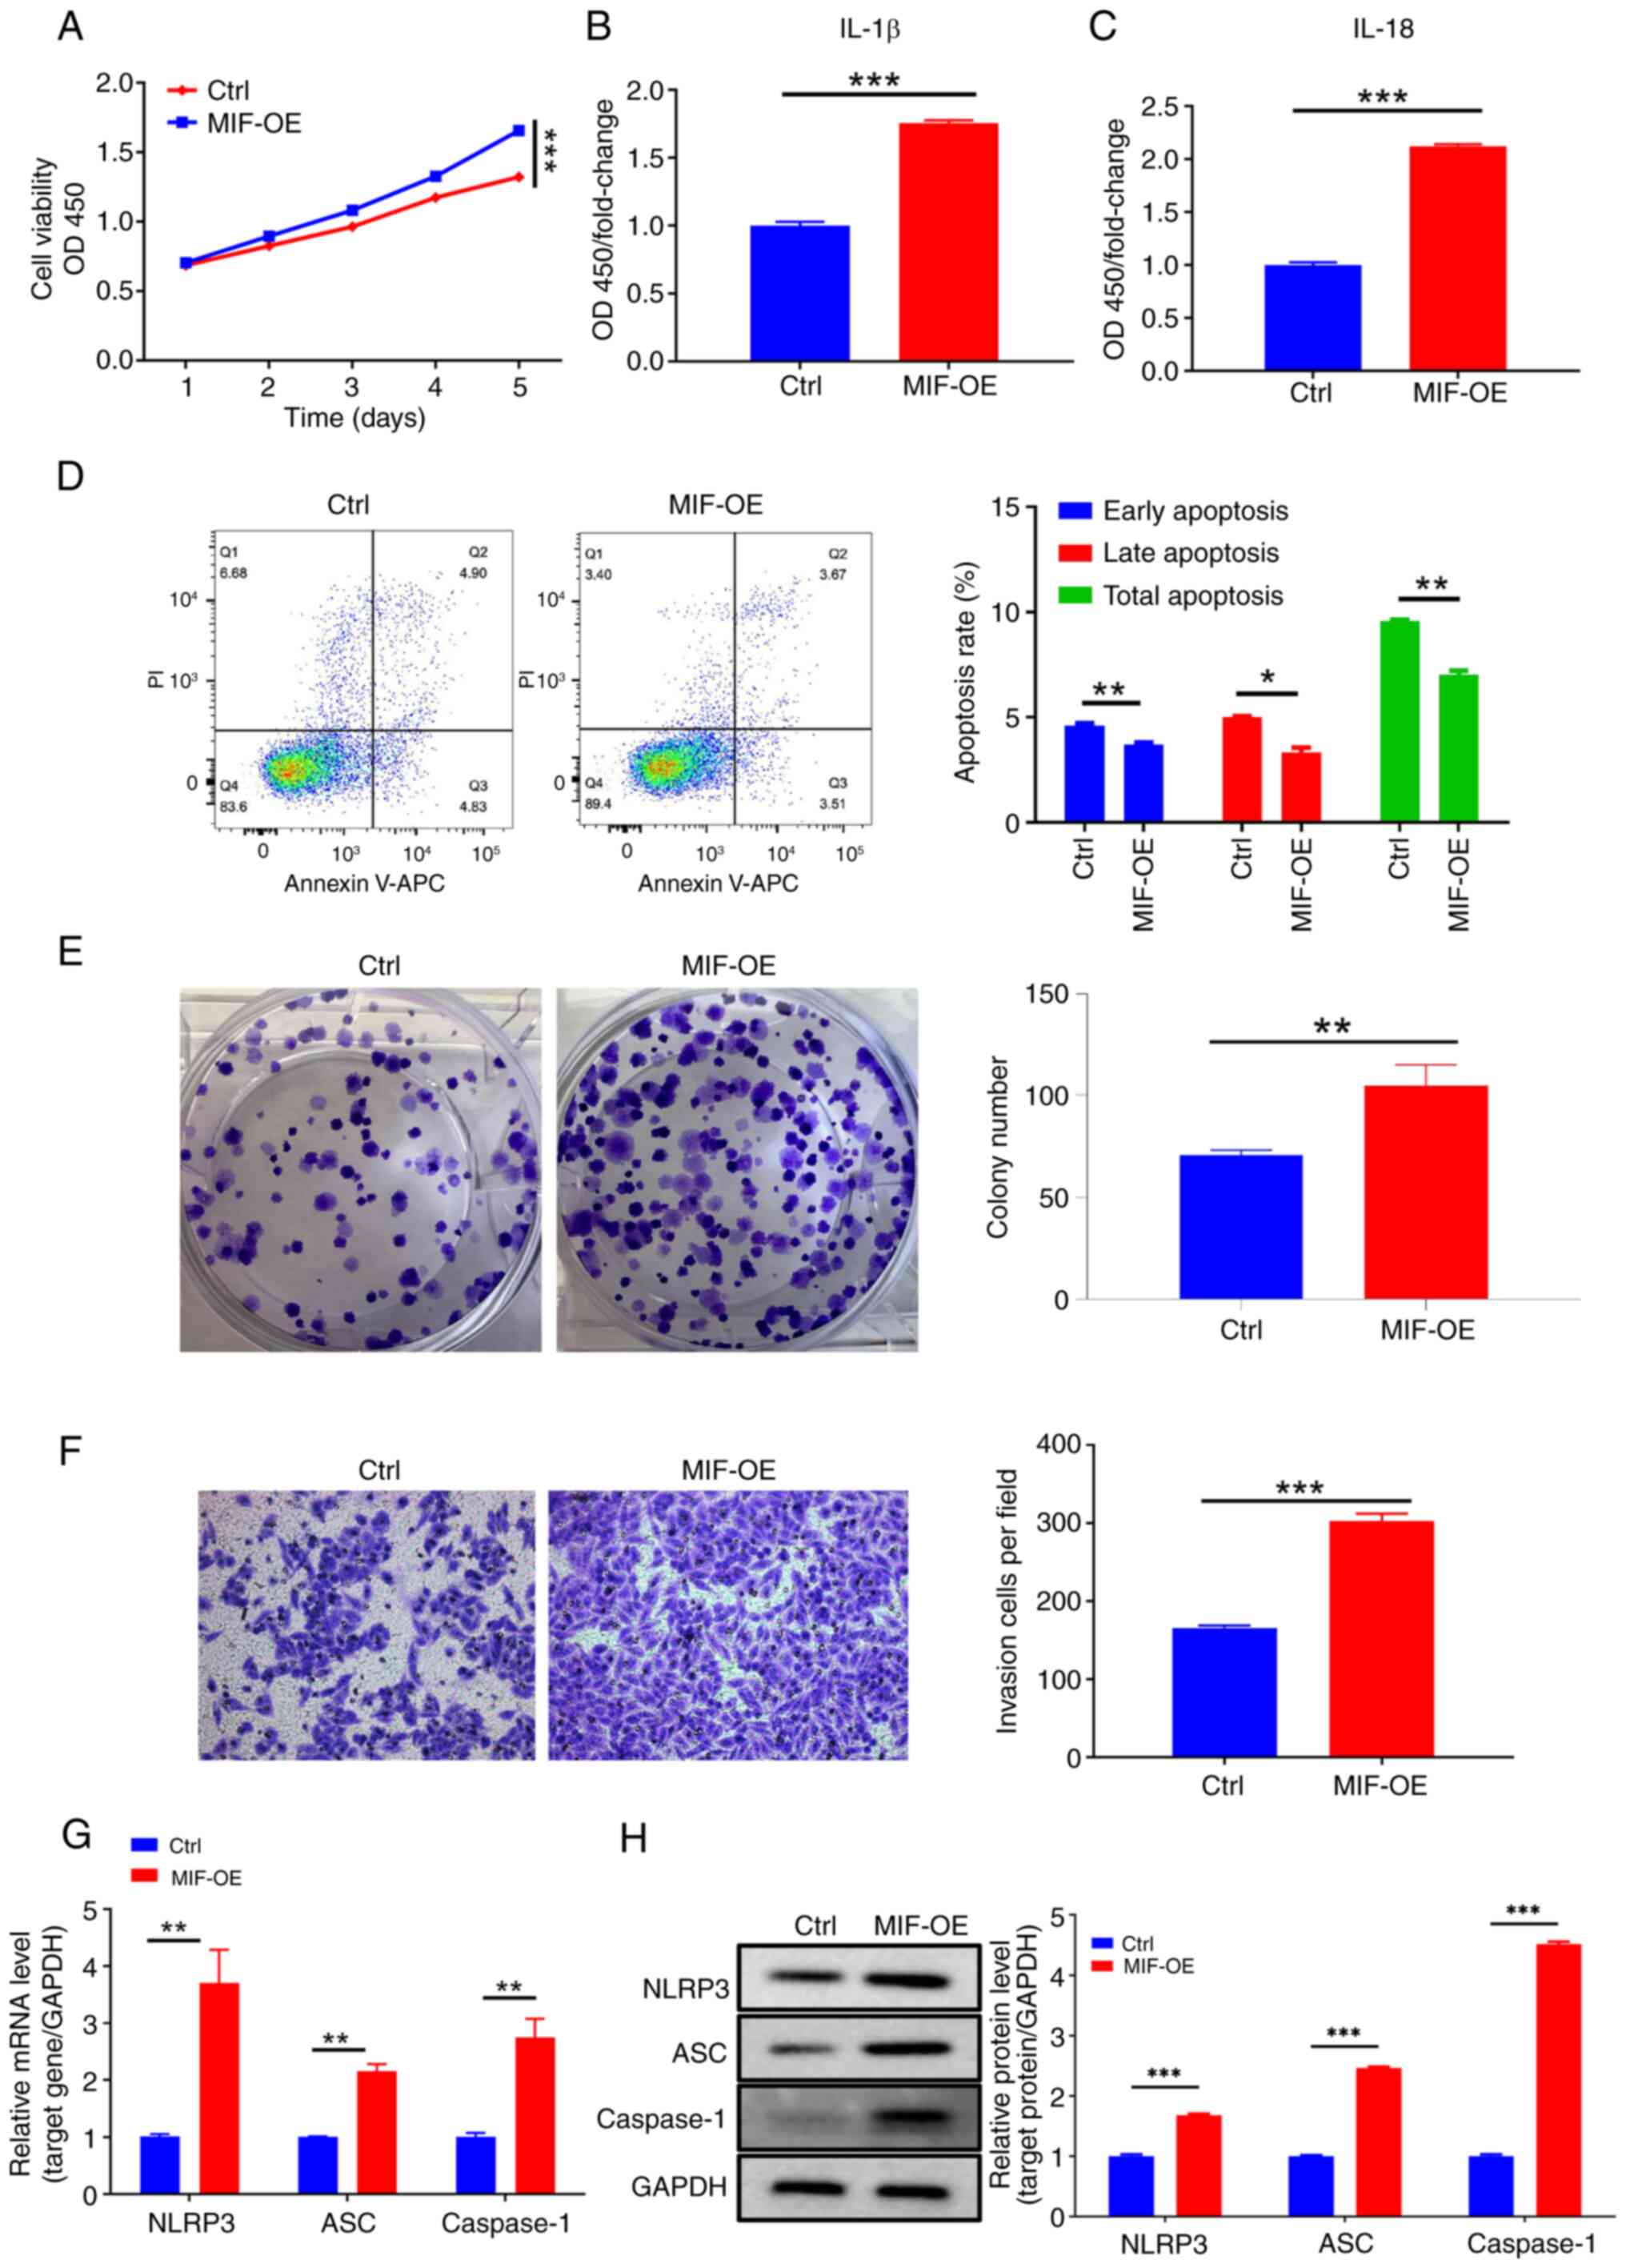 | Figure 4.MIF overexpression promotes
cervical squamous cell carcinoma cell growth and invasive behavior.
(A) Cell Counting Kit-8 analysis of SiHa cells following MIF
overexpression. (B and C) Enzyme-linked immunosorbent assays
showing the expression of inflammasome proteins IL-1β and IL-18
following MIF overexpression. (D) Flow cytometry, (E) colony
formation and (F) Transwell invasion assays (magnification, ×200)
of SiHa cells following MIF overexpression. (G) Reverse
transcription-quantitative polymerase chain reaction and (H)
western blot analyses of the mRNA and protein expression levels of
the inflammasome-related mRNAs and proteins NLRP3, ASC and
caspase-1 following MIF overexpression. *P<0.05, **P<0.01,
***P<0.001. MIF, macrophage migration inhibitory factor; OD450,
optical density at 450 nm; OE, overexpression vector; Ctrl, empty
vector control; IL, interleukin. |
TSC22D3 is a key MIF-interacting gene
based on multi-omics screening
To investigate downstream molecules potentially
regulated by MIF in the development of CSCC, SiHa cells with the
knockdown of MIF expression were used for transcriptomic and
proteomic sequencing to identify changes in the expression of the
downstream genes, both upregulated and downregulated. Based on the
observation that shMIF-2 exhibits higher knockdown efficiency than
shMIF-1, shMIF-2 was selected for use in subsequent experiments.
DEGs were screened based on criteria of P<0.05 and
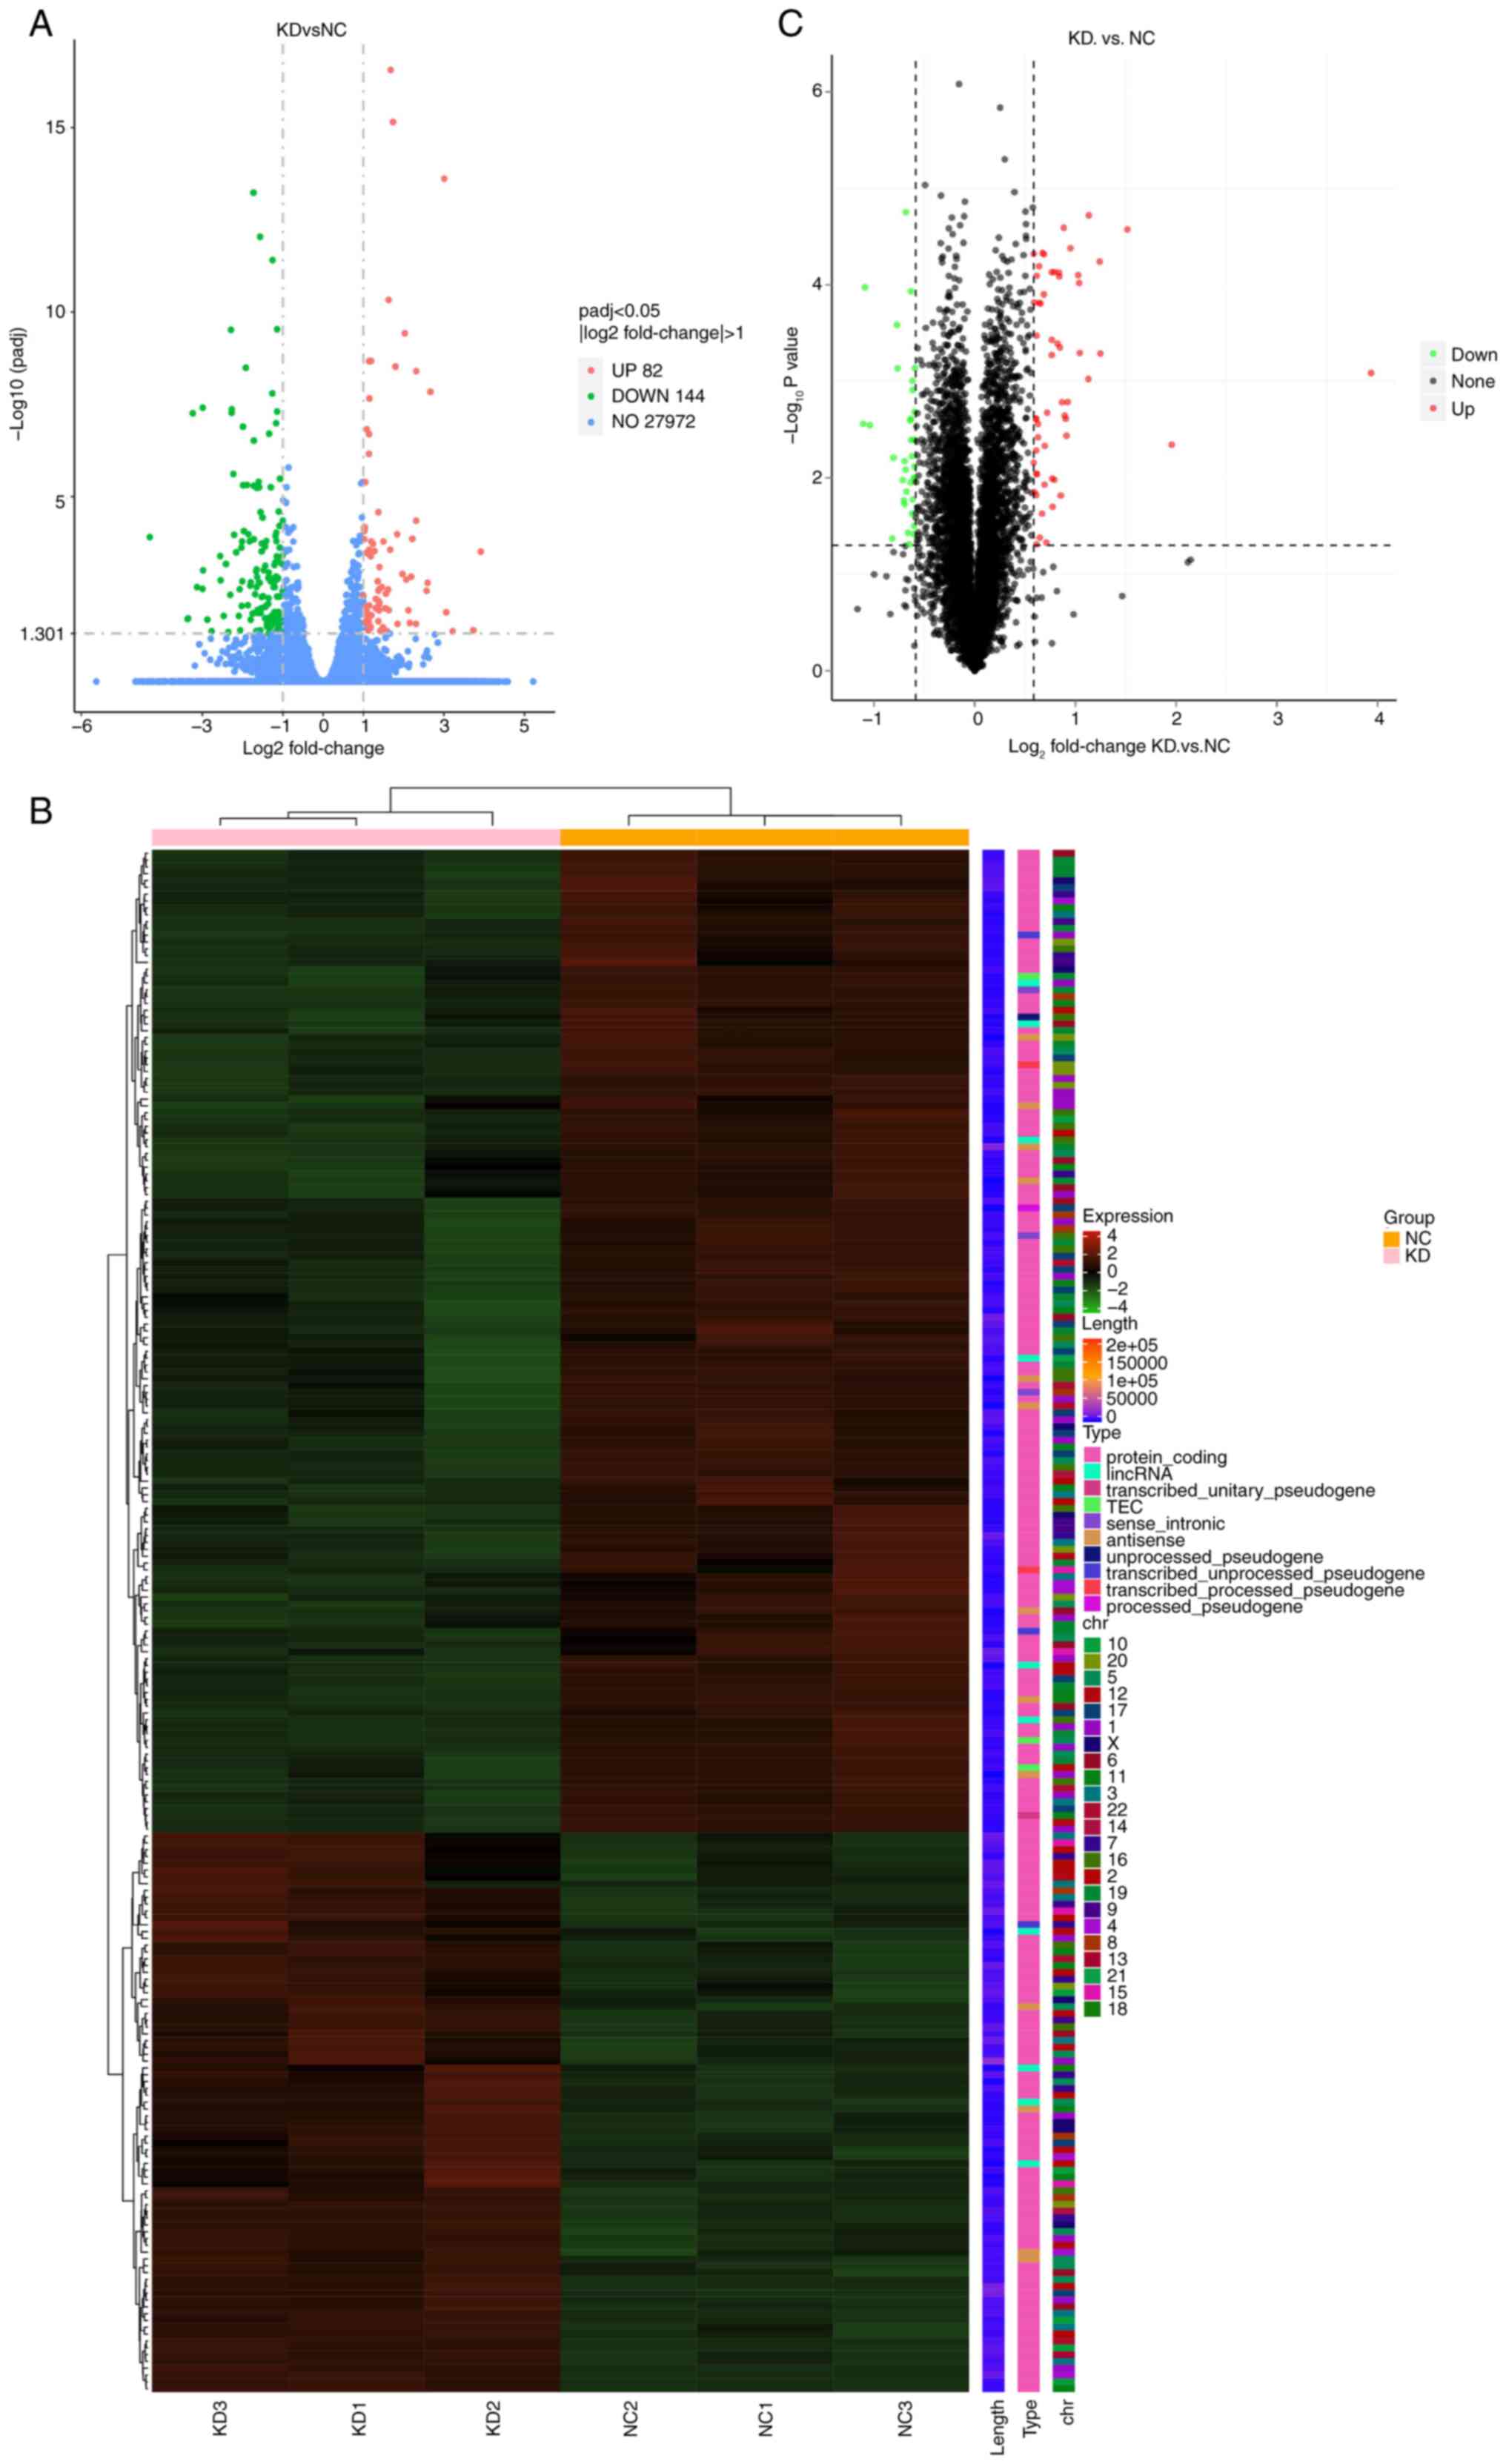
|log2FC|>1. Heat maps and volcano plots were
generated following the multi-omics screening of downstream genes
(Figs. 5, 6A and B). Correlation analysis of the
multi-omics sequencing results revealed 10 common DEGs in both the
transcriptome and proteome sequencing data (P<0.005 and
|log2FC|>0.5; Fig. 6C),
consisting of three upregulated genes (PSCA and
LAMB1) and eight downregulated genes (SLC35F2, SLC1A4,
ACAP3, OSBPL6, TSC22D3, ASNS, F3 and TRIB3). Validation
performed by the RT-qPCR analysis of MIF-knockdown SiHa
cells confirmed the significant upregulation of PSCA and
LAMB1 (P<0.01) and significant downregulation of
SLC35F2, SLC14A, ACAP3, OSBPL6, TSC22D3, ASNS, F3 and
TRIB3 (P<0.05; Fig. 6D).
The experimental validation of MIF expression aligned with the
results of sequencing, confirming the reliability of these results.
The downregulated gene TSC22D3 was selected for further
investigation given the limited reports on its role in cervical
cancer. Notably, its known roles in inflammation and immune
regulation suggest a significant role in the regulation of tumor
growth (17–20); therefore, it is hypothesized that
TSC22D3 may significantly influence CSCC progression.
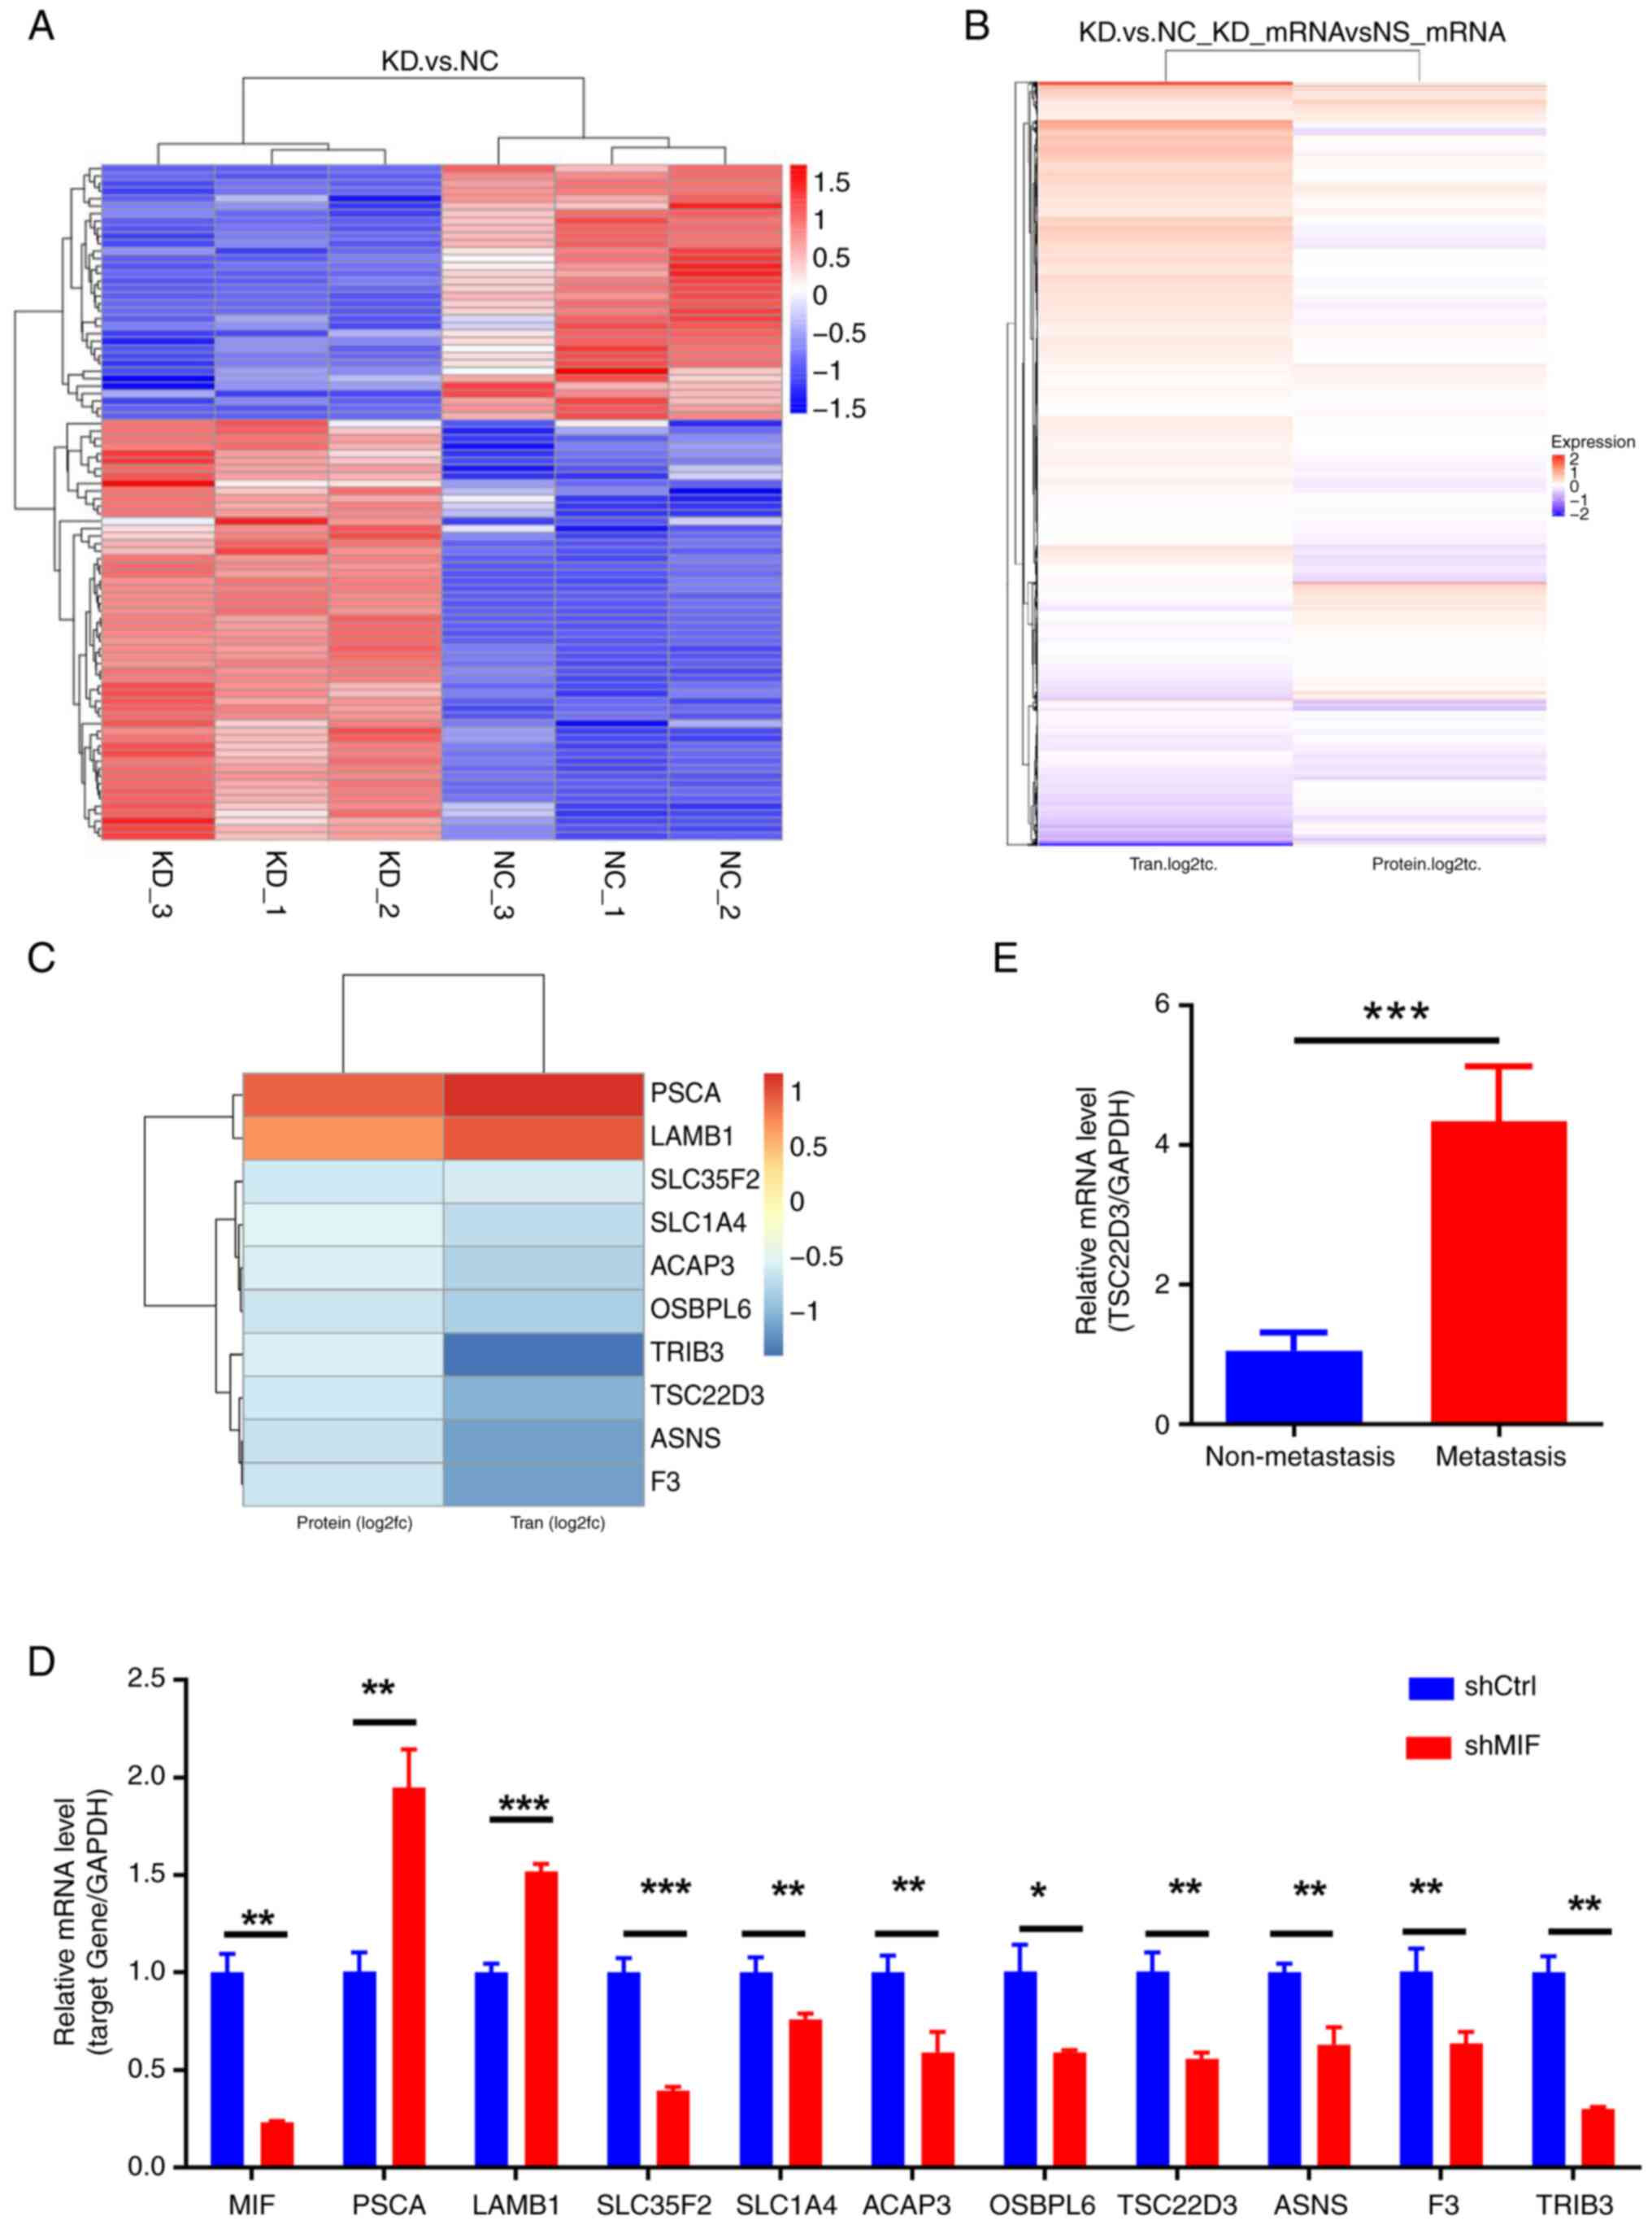 | Figure 6.Multi-omics screening of downstream
genes potentially regulated by MIF and TSC22D3. (A) Heatmap of
clustered differentially expressed proteins in the proteome
following MIF knockdown. (B) Heatmap of the correlation
between transcriptome and proteome expression levels. (C) Heatmap
of clustered genes common to both the transcriptome and proteome.
(D) RT-qPCR validation of candidate genes identified through
multi-omics screening. (E) RT-qPCR detection of TSC22D3 in
cervical squamous cell carcinoma tissues. *P<0.05, **P<0.01,
***P<0.001. MIF, macrophage migration inhibitory factor;
TSC22D3, TSC22 domain family protein 3; RT-qPCR, reverse
transcription-quantitative polymerase chain reaction; KD, knockdown
of MIF; NC, negative control; Tran, transcript; PSCA, prostate stem
cell antigen; LAMB1, laminin subunit b 1; SLC39A10, solute carrier
39 member 10; SLC35F2, solute carrier 35 member F2; SLC1A4, solute
carrier family 1 member 4; ACAP3, ArfGAP with coiled-coil, ankyrin
repeat and PH domain-containing protein 3; OSBPL6, oxysterol
binding protein like 6; ASNS, asparagine synthetase; F3,
coagulation factor III; TRIB3, tribbles pseudokinase 3; shCtrl,
short-hairpin RNA control; shMIF, short-hairpin RNA targeting
MIF. |
Subsequently, the expression of TSC22D3 in
CSCC tissues was investigated. The findings revealed that the mRNA
and protein expression levels of TSC22D3 in the tissues of patients
with lymph node metastasis were significantly higher compared with
those in the tissues of patients without lymph node metastasis
(Figs. 1F and G, and 6E). These results suggest that
TSC22D3 may be a pivotal gene with similar pro-tumor
inflammatory properties to MIF, and their combined interaction may
promote CSCC progression.
Interaction between MIF and TSC22D3
regulates inflammasome activation in CSCC progression
Rescue experiments were performed to explore the
functional interaction between MIF and TSC22D3. Separate MIF
knockdown and TSC22D3 overexpression plasmids were
constructed and packaged into lentiviruses, which were co-infected
into SiHa cells. The transfection efficiency of the plasmids was
subsequently confirmed (Fig. 7A-B,
D-E).
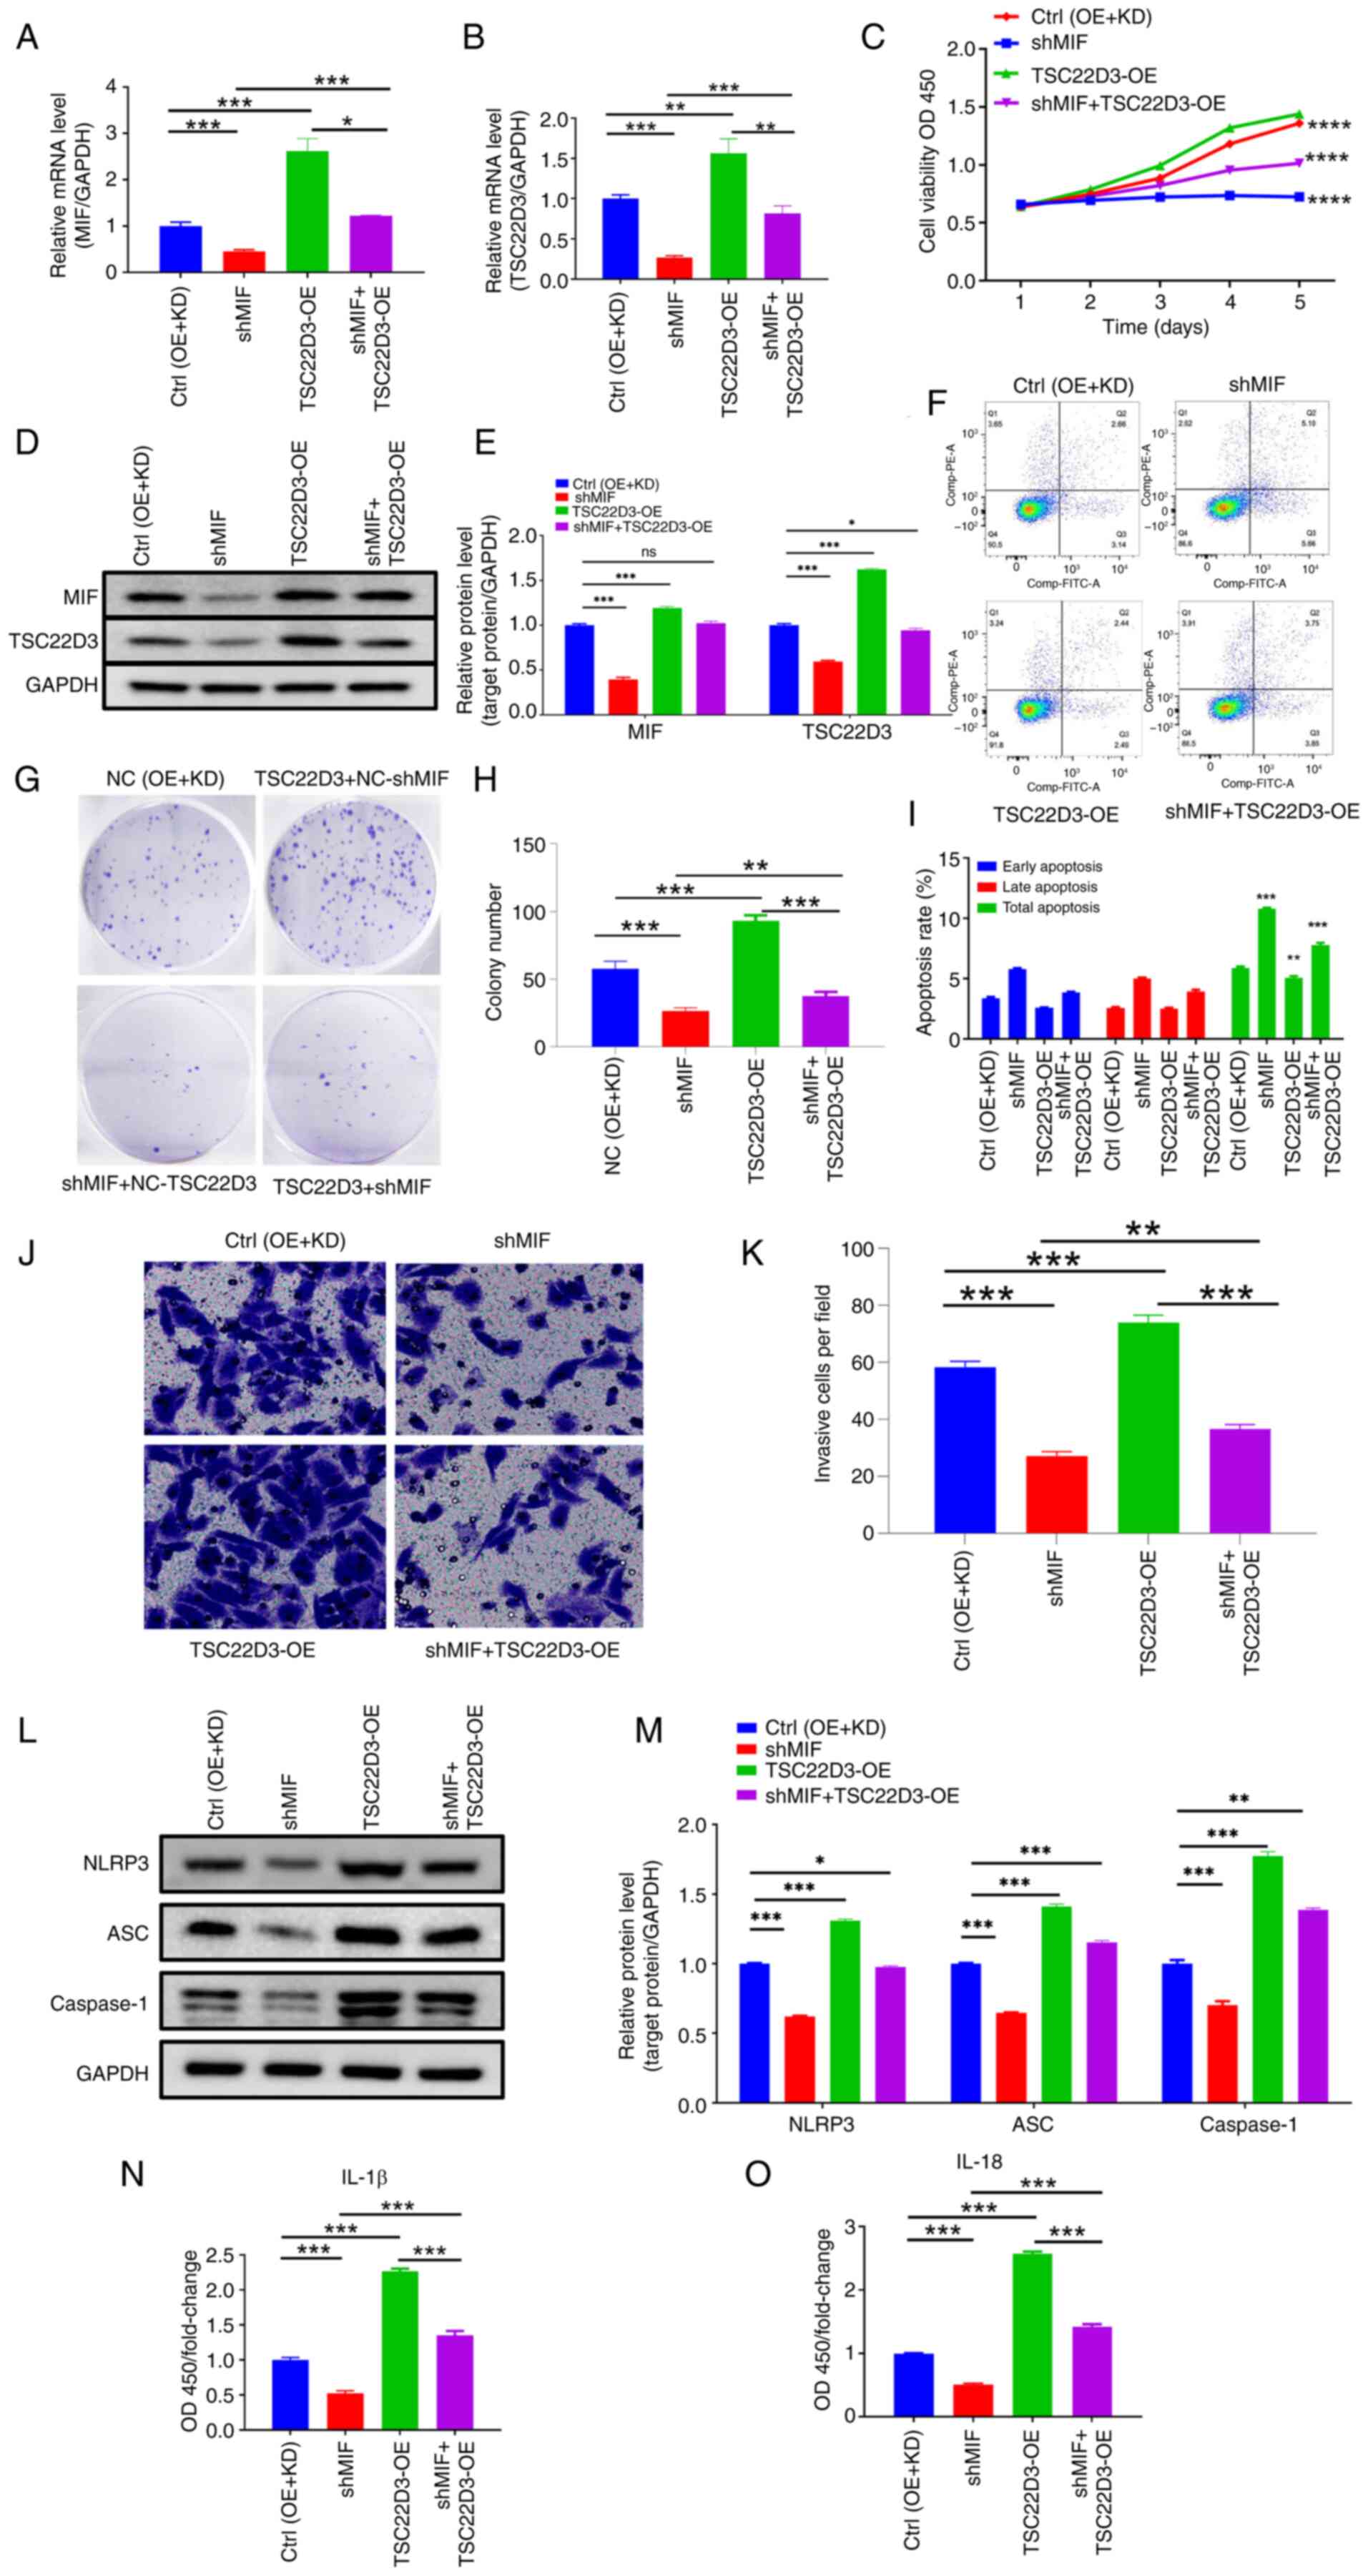 | Figure 7.Functional interaction between MIF
and TSC22D3 regulates inflammasome activation and cervical squamous
cell carcinoma progression. Levels of (A) MIF and (B) TSC22D3 mRNA
determined by reverse transcription-quantitative polymerase chain
reaction following MIF knockdown and TSC22D3 overexpression. (C)
Cell Counting Kit-8 analysis of SiHa cells following MIF knockdown
and TSC22D3 overexpression. (D and E) Western blot analysis of MIF
and TSC22D3 proteins following MIF knockdown and TSC22D3
overexpression. (F) Flow cytometry and (G) colony formation of SiHa
cells following MIF knockdown and TSC22D3 overexpression.
Statistical graphs of (H) colony formation and (I) flow cytometry
of SiHa cells following MIF knockdown and TSC22D3 overexpression.
(J and K) Transwell assays (magnification, ×200) of SiHa cells
following MIF knockdown and TSC22D3 overexpression. (L-O)
Expression of inflammasome-related proteins in SiHa cells following
MIF knockdown and TSC22D3 overexpression. (L) Representative
western blots and (M) western blot quantification; enzyme-linked
immunosorbent assay results for (N) IL-1 and (O) IL-18. *P<0.05,
**P<0.01, ***P<0.001, ****P<0.0001. MIF, macrophage
migration inhibitory factor; TSC22D3, TSC22 domain family protein
3; Ctrl, empty vector control; OE, overexpression; KD, knockdown;
NC, negative control; shMIF, short-hairpin RNA targeting MIF; OD,
optical density; OD450, OD at 450 nm; IL, interleukin; ns, not
significant. |
Experiments were then performed to investigate the
biological behaviors of the transfected SiHa cells. The results of
the CCK-8 assays indicate a significant reduction in the
proliferative capacity of SiHa cells in the shMIF group compared
with the control group (Fig. 7C).
Moreover, following TSC22D3 overexpression, the
proliferative ability of SiHa cells in the shMIF + OE-TSC22D3 group
was higher than that in the shMIF group, yet lower than that in the
OE-TSC22D3 group, although this latter variation has not yet shown
statistical differences. These findings suggest that TSC22D3
overexpression may partially reversed the reduction in
proliferation of SiHa cells induced by MIF knockdown.
Moreover, the analysis of apoptosis using flow cytometry indicated
that TSC22D3 overexpression partially attenuated the
increase in apoptosis of SiHa cells following MIF knockdown
(Fig. 7F and I). In addition,
colony formation assays demonstrated that TSC22D3
overexpression partially reversed the reduction in the colony
formation capacity of SiHa cells following MIF knockdown
(Fig. 7G and H). The results of the
Transwell invasion assays are presented in Fig. 7J and K, and indicate that the number
of invasive SiHa cells in the shMIF group was significantly reduced
compared with that in the control group. This suggests that the
knockdown of MIF had an inhibitory effect on the invasive capacity
of SiHa cells. Furthermore, the overexpression of TSC22D3 in the
shMIF + OE-TSC22D3 group resulted in a partial restoration of the
invasive ability of SiHa cells, as evidenced by an increase in the
number of invasive cells compared with that in the shMIF group.
However, the invasive capacity of the shMIF + OE-TSC22D3 group
remained lower than that of the OE-TSC22D3 group, indicating that
the overexpression of TSC22D3 can partially reverse these
effects.
To investigate the roles of MIF and TSC22D3 in
inflammasome formation in CSCC, the expression of
inflammasome-related proteins was assessed. The results of western
blot analysis revealed that the expression levels of NLRP3, ASC and
caspase-1 were significantly reduced in the shMIF group compared
with those in the control group. However, upon TSC22D3
overexpression, the protein expression levels of these
inflammasome-related molecules in the shMIF + OE-TSC22D3 group were
increased compared with those in the shMIF group, yet were lower
than those in the OE-TSC22D3 group (Fig. 7L and M), although this latter
variation has not yet shown statistical differences. Furthermore,
the results of ELISA analysis indicated that the levels of IL-18
and IL-1β in the supernatant of SiHa cells were significantly
decreased in the shMIF group compared with those in the control
group. Following TSC22D3 overexpression, the expression of
IL-18 and IL-1β in the supernatant was significantly higher in the
shMIF + OE-TSC22D3 group compared with that in the shMIF group, yet
significantly lower than that in the OE-TSC22D3 group (Fig. 7N and O). These results indicate that
TSC22D3 overexpression partially reversed the impaired
ability of SiHa cells to form inflammasomes following MIF
knockdown.
Interaction between MIF and TSC22D3
promotes macrophage recruitment and polarization in CSCC
The tumor microenvironment significantly influences
cancer initiation and progression, with immune cell infiltration
being a crucial target in cancer immunotherapeutic strategies
(21–23). Tumor cells release cytokines and
other mediators that recruit macrophages and other inflammatory
cells, which promote tumor growth and metastasis (24–26).
Therefore, the role of MIF, an inflammatory factor, in macrophage
recruitment in CSCC was investigated. Supernatants from cultured
SiHa cells with established MIF-OE transfection and control cells
were collected, and elevated mRNA and protein levels of MIF in the
supernatants were confirmed by RT-qPCR and western blotting
(Fig. 8A-C). These cell
supernatants were then co-cultured with THP-1 cells. Results from
the CCK-8 assay demonstrated a significant increase in THP-1 cell
proliferation in the MIF-OE group compared with that in the control
group (Fig. 8D). Furthermore,
co-culture with the MIF-OE-transfected cell supernatant was
revealed to induce a significant increase in the number of THP-1
cells migrating across the Transwell membrane compared with that of
the control, which is indicative of increased migratory ability
post-MIF overexpression (Fig.
8E). These findings suggest that the overexpression of
MIF in CSCC cells may promote macrophage recruitment.
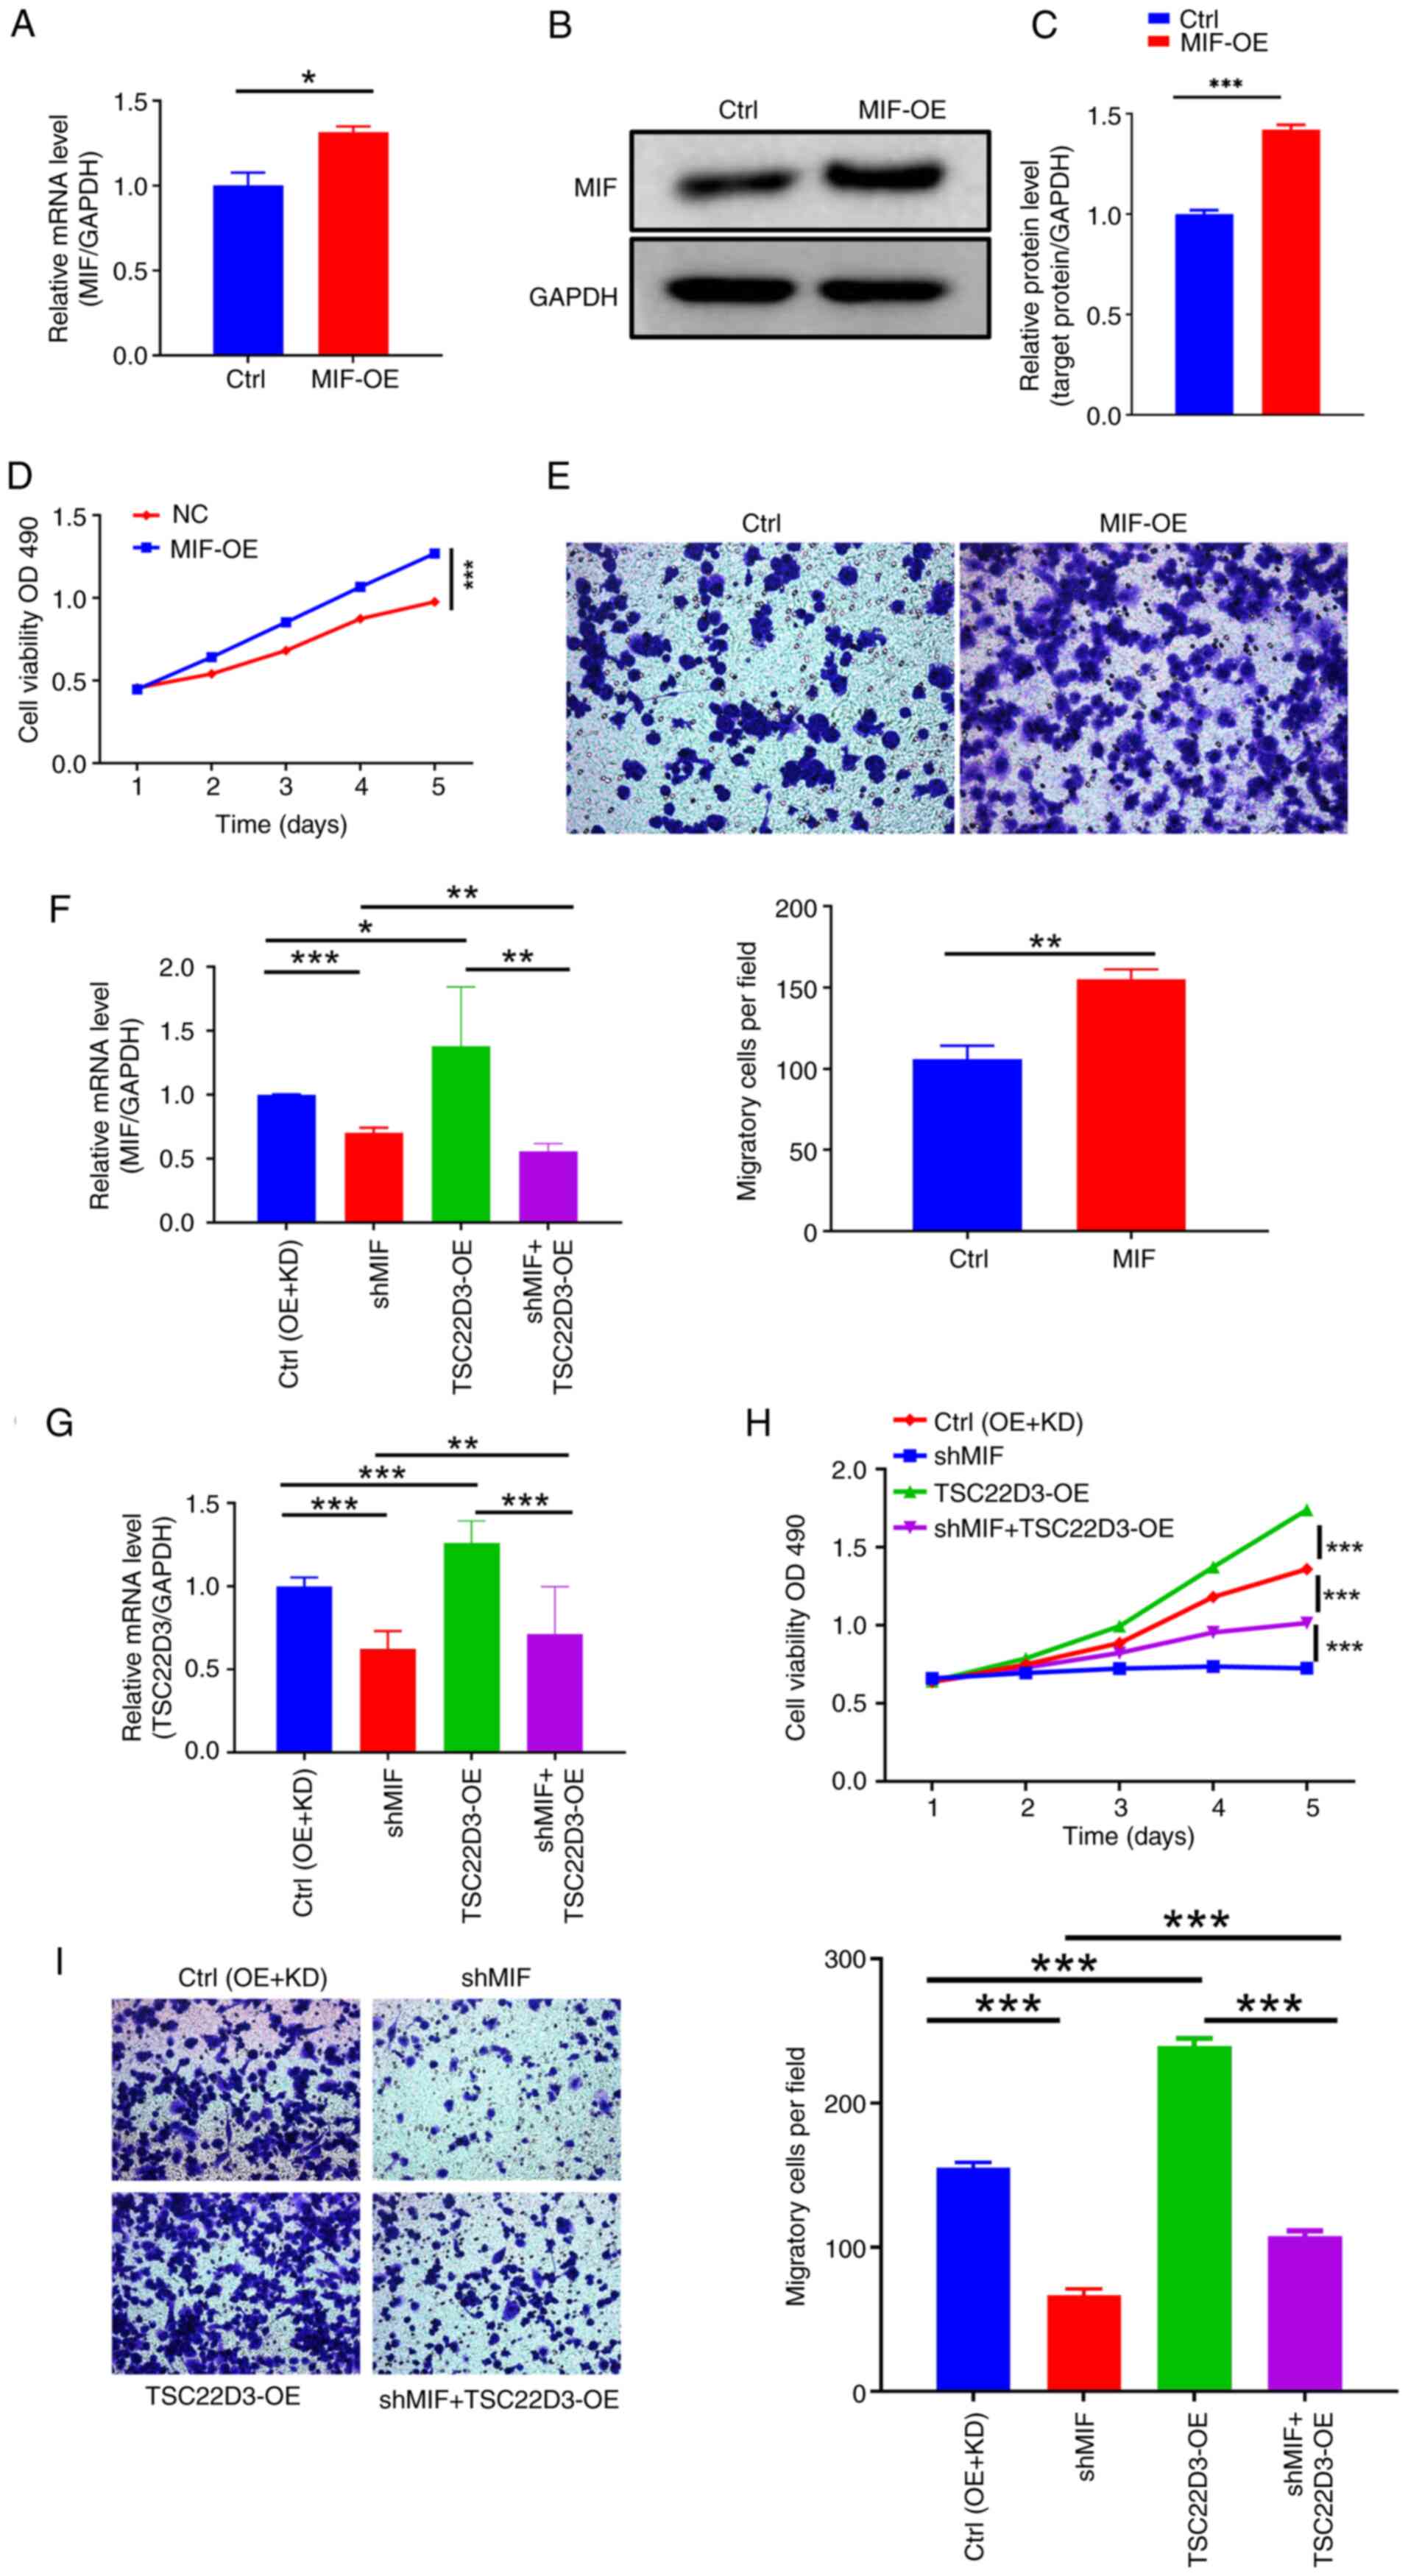 | Figure 8.MIF and TSC22D3 interaction in
cervical squamous cell carcinoma cells promotes macrophage
recruitment. (A-C) Detection of the upregulation of MIF levels in
the supernatant of SiHa cells following transfection with
MIF overexpression vector. MIF levels were assessed by (A)
RT-qPCR and (B and C) western blotting. (D) CCK-8 and (E) Transwell
assays (magnification, ×200) of THP-1 cells following culture with
the SiHa cell supernatants. RT-qPCR analysis of the levels of (F)
MIF and (G) TSC22D3 in the cell supernatant following
MIF knockdown and TSC22D3 overexpression in SiHa
cells. (H) CCK-8 and (I) Transwell assays (magnification, ×200) of
THP-1 cells following culture with the SiHa cell supernatants.
*P<0.05, **P<0.01, ***P<0.001. MIF, macrophage migration
inhibitory factor; TSC22D3, TSC22 domain family protein 3; RT-qPCR,
reverse transcription-quantitative polymerase chain reaction;
CCK-8, Cell Counting Kit-8; Ctrl, empty vector control; OE,
overexpression; OD, optical density; KD, knockdown; shMIF,
short-hairpin RNA targeting MIF. |
To explore whether MIF regulates macrophage
recruitment through its interaction with TSC22D3, MIF
expression was knocked down and TSC22D3 expression was
overexpressed simultaneously in SiHa cells (Fig. 8F and G). Co-culture of THP-1 cells
with the cell culture supernatant caused a significant reduction in
the proliferative ability of the cells in the shMIF group compared
with that in the control group. Upon TSC22D3 overexpression,
the proliferative ability of THP-1 cells in the shMIF + OE-TSC22D3
group was increased compared with that in the shMIF group, but
lower than that in the OE-TSC22D3 group (Fig. 8H), and both comparisons showed
statistically significant differences.. This result indicates that
TSC22D3 overexpression partially reversed the reduction in
THP-1 cell proliferation caused by MIF knockdown. Similarly,
Transwell experiments demonstrated that the overexpression of
TSC22D3 significantly attenuated the reduction in the
migratory ability of the THP-1 cells following MIF knockdown
(Fig. 8I).
Macrophages play a pivotal role in the infiltration
of inflammatory cells at tumor sites, exhibiting significant
functional plasticity and the ability to rapidly polarize between
M1 and M2 activation states (27–29).
To investigate the role of MIF in the induction of macrophage
polarization, MIF expression in CSCC SiHa cells was
manipulated and the supernatant was cultured with THP-1 cells,
which had been induced to undergo polarization towards M1 and M2
macrophage phenotypes. Prior to MIF manipulation, RT-qPCR
analysis confirmed the successful establishment of the in
vitro macrophage polarization model by demonstrating the
significant upregulation of M1-related genes (iNOS and
CD86) in the M1 control group and M2-related genes
(ARG1 and CD206) in the M2 control group (Fig. 9A-D). The subsequent manipulation of
MIF expression levels in SiHa cells revealed that its
overexpression significantly increased the expression levels of the
M2 surface markers ARG1 and CD206 and decreased the
expression levels of the M1 surface markers iNOS and
CD86 in the respective macrophage models compared with those
in the control group when cultured with the SiHa cell supernatant,
whereas MIF knockdown yielded the opposite effects (Fig. 9E-L). Flow cytometry corroborated
these findings, indicating that MIF overexpression
significantly increased the expression of the M2 surface marker
CD206 and decreased that of the M1 surface marker CD86 compared
with that in the control group, whereas MIF knockdown
induced the opposite effects, with all differences being
statistically significant (Fig.
9M-O). These results indicate that MIF overexpression
promotes macrophage polarization toward the M2 phenotype while
inhibiting polarization toward the M1 phenotype.
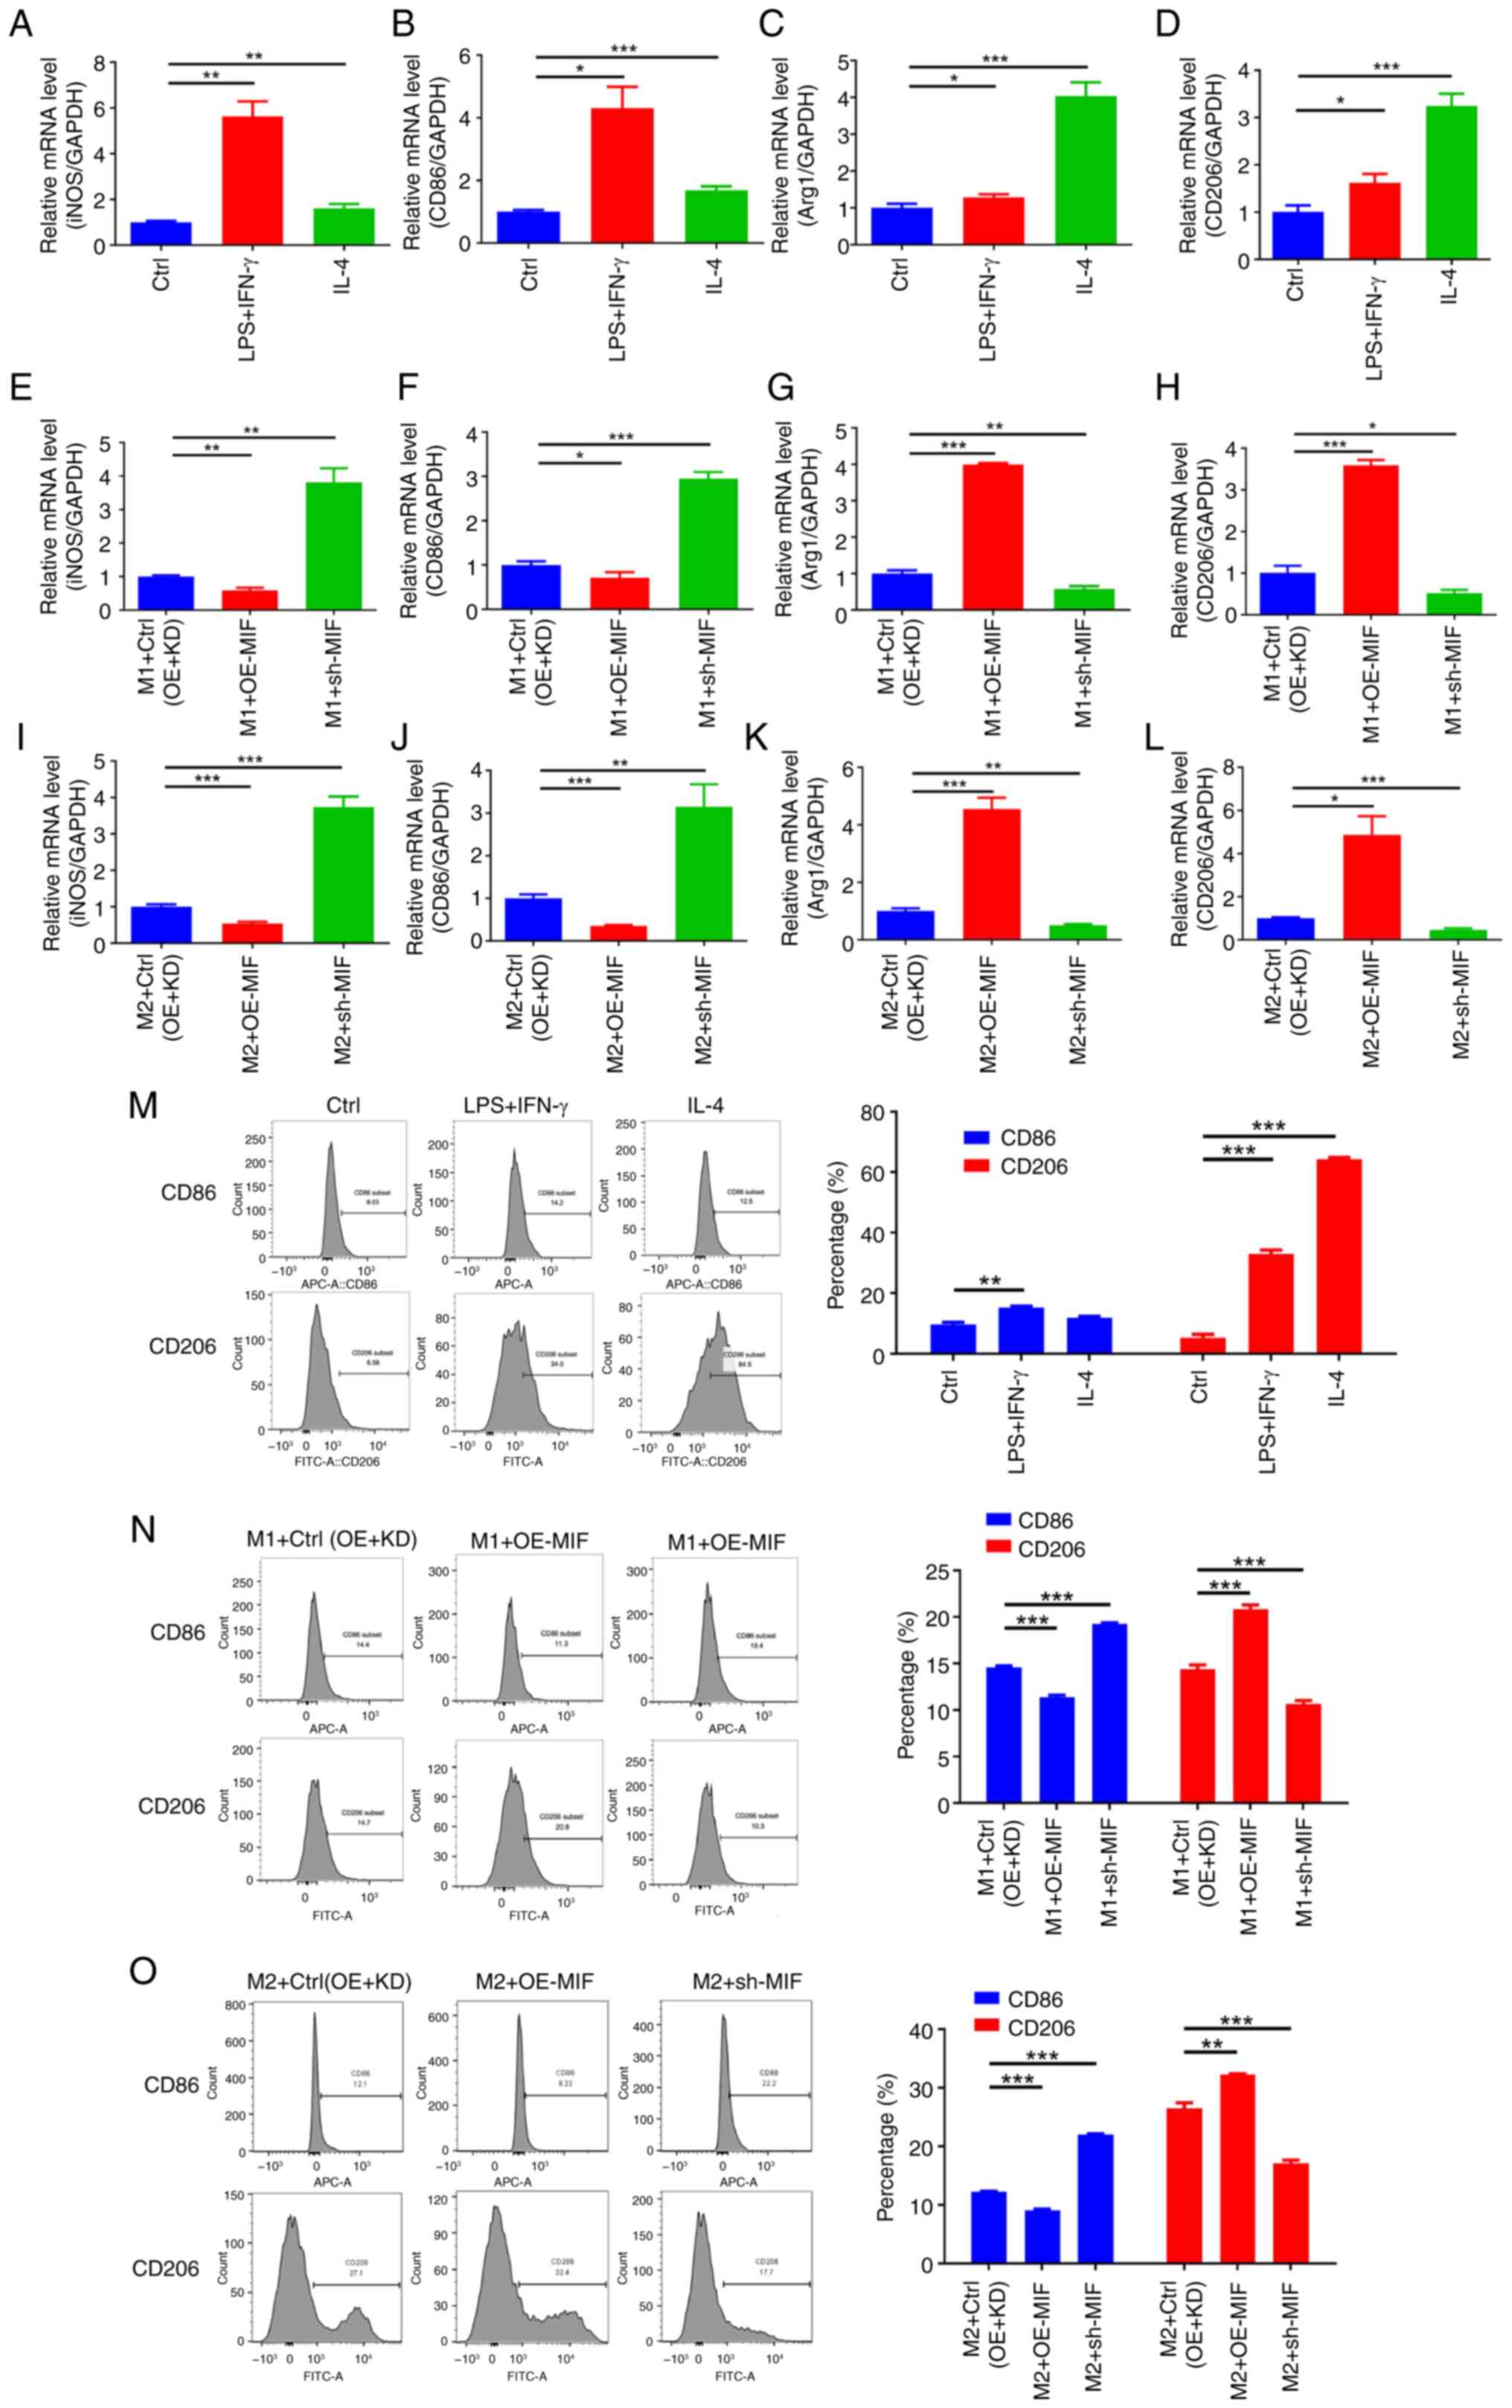 | Figure 9.MIF in cervical squamous cell
carcinoma cells promotes M2 macrophage polarization. (A-D) RT-qPCR
detection of M1 and M2 biomarker expression in THP-1 cells cultured
with the supernatant of untransfected SiHa cells. The M1 biomarkers
are (A) iNOS and (B) CD86, and M2 biomarkers are (C) Arg1 and (D)
CD206. (E-L) RT-qPCR detection of the expression of M1 and M2
biomarkers in THP-1 cells cultured with the supernatants of SiHa
cells with manipulated MIF levels. (E) iNOS, (F)
CD86, (G) Arg1 and (H) CD206 expression in
M1-polarized THP-1 cells and (I) iNOS, (J) CD86, (K)
Arg1 and (L) CD206 in M2-polarized THP-1 cells. (M) Flow cytometry
analysis of M1/M2 markers in THP-1 cells cultured with
untransfected SiHa cell supernatant. Detection of M1/M2 biomarkers
in (N) M1- and (O) M2-polarized THP-1 cells following culture with
the supernatants of SiHa cells with manipulated MIF levels
by flow cytometry. *P<0.05, **P<0.01, ***P<0.001. MIF,
macrophage migration inhibitory factor; RT-qPCR, reverse
transcription-quantitative polymerase chain reaction; iNOS,
inducible nitric oxide synthase; Arg1, arginase 1; Ctrl, control;
LPS, lipopolysaccharide; IFN, interferon; IL, interleukin; OE,
overexpression; KD, knockdown; sh-MIF, short-hairpin RNA targeting
MIF. |
Discussion
MIF plays a direct role in the regulation of tumor
cell biology and indirectly contributes to tumor progression by
influencing inflammation, immune responses and remodeling of the
tumor microenvironment (30–34).
Consequently, MIF is increasingly recognized as a promising target
for antitumor drug development. Therefore, it is crucial to
comprehensively understand the expression patterns of MIF in tumors
and elucidate its regulatory mechanisms in inflammation-related
tumor progression. The results of the present study align with
those of a previous study (34),
with the upregulated expression of MIF in CSCC exhibiting a
positive association with cancer progression. Given the pivotal
role of tumor-related inflammation in cancer, clarifying the
tumorigenic function of MIF in the inflammatory process may offer
valuable insights for the development of strategies to inhibit
cervical cancer progression. MIF has been reported to be a secreted
protein, and can be detected in the supernatant of SiHa cells
(32). It is hypothesized that
manipulation of the expression of MIF may affect the expression,
secretion or activity of other proteins, such as TSC22D3. This may
then influence the secretion or activity of additional proteins,
such as the inflammatory factors IL-18 and IL-1β, which could lead
to functional changes in neighboring or distant cells, such as
macrophages.
The activation of inflammasomes and the resulting
cytokine imbalance triggered by pathogen- or damage-associated
molecular patterns is a crucial feature in the accelerated
progression of inflammation-related tumors (11,35,36).
The abnormal activation of NLRP3 sustains chronic inflammation and
thus plays a pivotal role in the secretion of pro-inflammatory
cytokines during tumor development (37,38).
Consequently, the positive association found between MIF expression
and the inflammasome-associated molecules NLRP3, ASC, caspase-1,
IL-18 and IL-1β in the present study suggest that MIF potentially
contributes to CSCC progression via the activation of inflammasome
formation, in agreement with a previous study (39).
Transcriptomic and proteomic sequencing were
performed in the present study, which identified TSC22D3 as a
crucial downstream factor closely associated with the inflammatory
tumorigenic function of MIF. Although there is currently limited
research on TSC22D3 in CSCC, rescue experiments conducted in this
study provided insights suggesting that TSC22D3, in conjunction
with MIF, may play a role in certain biological processes related
to the development of CSCC and promote the activation of
inflammasomes.
The tumor microenvironment plays a crucial role in
cancer progression and treatment outcomes. M2 macrophages secrete
various growth factors and cytokines, such as vascular endothelial
growth factor, platelet-derived growth factor and insulin-like
growth factor, which promote tumor cell proliferation, survival and
angiogenesis (39). In addition, M2
macrophages inhibit the function of other immune cells, such as T
cells and NK cells, thus participating in immunosuppressive
responses (40). As MIF is a
secreted protein, it can be found in the supernatant of cells that
express it. Therefore, it was hypothesized that changes in the
expression levels of MIF and TSC22D3 may affect the secretion or
activity of other proteins, including inflammatory factors such as
IL-18 and IL-1β in the supernatant, which in turn may affect the
behavior of neighboring or distant macrophages. Within this
context, it was found that MIF and its interacting protein TSC22D3
promoted macrophage migration, and that MIF promoted the
transformation of macrophages from an M1 to M2 phenotype. This
indicates that MIF could potentially promote cervical cancer
progression. It has previously been shown that MIF, via CD74
signaling, exhibits immunosuppressive properties in genitourinary
cancer (34). In addition, a study
of malignant melanoma demonstrated that CD74-MIF interactions are
disrupted by the binding of C36L1 peptide fragment to CD74, which
enables macrophages to transform from the M2 to the M1 phenotype,
ultimately reactivating cytotoxic T cells (41). However, future efforts are required
to substantiate and confirm this mechanism.
The present study has certain limitations. In-depth
mechanistic studies using animal models are necessary to understand
how MIF and TSC22D3 affect immune cell function and differentiation
within the tumor microenvironment. Clinical studies including a
larger cohort of patients with CSCC are also required to validate
the prognostic value of MIF expression. In addition, investigating
the efficacy of targeting MIF in preclinical models and clinical
trials could provide valuable insights into its potential as a
therapeutic strategy. Further studies should aim to elucidate the
specific molecular pathways by which MIF and TSC22D3 influence
inflammasome activation and macrophage polarization in the tumor
microenvironment. Exploring the crosstalk between MIF-driven
inflammation and other signaling pathways implicated in cervical
cancer progression may uncover novel therapeutic opportunities.
Moreover, investigating the impact of MIF on broader immune
responses is essential for gaining a deeper understanding of its
overall role in tumor immunity.
In conclusion, the results of the present study
provide evidence to suggest that MIF and TSC22D3 have the potential
to induce macrophage infiltration in cervical cancer lesions and
influence the CSCC tumor microenvironment by polarizing macrophages
towards an M2 phenotype, thereby promoting CSCC progression. The
present study elucidated the previously unexplored role of MIF in
the progression of CSCC in vitro, particularly in the
context of activation of the inflammasome and modulation of the
tumor microenvironment. These findings highlight the potential of
targeting the MIF-TSC22D3 axis as a novel therapeutic strategy,
offering a promising avenue for improving the efficacy of
immunotherapy in the treatment of recurrent or metastatic cervical
cancer.
Acknowledgements
The Medical Experimental Center of Shanxi Bethune
Hospital provided the equipment for this study.
Funding
This study was supported by funding from the Beijing Science and
Technology Innovation Medical Development Foundation (grant no.
KC2023-JX-0186-RM075).
Availability of data and materials
The data generated in the present study may be
requested from the corresponding author. The mass spectrometry
proteomics data generated in the present study may be found in the
ProteomeXchange Consortium and the PRIDE (42) partner repository under accession
number PXD057462 or by using the URL: https://www.ebi.ac.uk/pride/archive/projects/PXD057462.
The transcriptome data generated in the present study may be found
in the Gene Expression Omnibus under accession number GSE280733 or
by using the URL: https://www.ncbi.nlm.nih.gov/geo/query/acc.cgi?acc=GSE280733.
Authors' contributions
QZ designed the study, performed experiments,
analyzed the data and wrote the manuscript. MW designed the study
and performed experiments. SW conceived the study and wrote the
manuscript. All authors read and approved the final version of the
manuscript. QZ, MW and SW confirm the authenticity of all the raw
data.
Ethics approval and consent to
participate
The study protocol was approved by the Ethics
Committee of the Third Hospital of Shanxi Medical University
(approval no. YXLL-2024-117). All participants provided written
informed consent.
Patient consent for publication
Not applicable.
Competing interests
The authors declare that they have no competing
interests.
Glossary
Abbreviations
Abbreviations:
|
CSCC
|
cervical squamous cell carcinoma
|
|
IL
|
interleukin
|
|
MIF
|
macrophage migration inhibitory
factor
|
|
RT-qPCR
|
reverse transcription-quantitative
polymerase chain reaction
|
|
TSC22D3
|
TSC22 domain family protein 3
|
References
|
1
|
Sung H, Ferlay J, Siegel RL, Laversanne M,
Soerjomataram I, Jemal A and Bray F: Global cancer statistics 2020:
GLOBOCAN estimates of incidence and mortality worldwide for 36
cancers in 185 countries. CA A Cancer J Clin. 71:209–249. 2021.
View Article : Google Scholar : PubMed/NCBI
|
|
2
|
Chen W, Zheng R, Baade PD, Zhang S, Zeng
H, Bray F, Jemal A, Yu XQ and He J: Cancer statistics in China,
2015. CA Cancer J Clin. 66:115–132. 2016. View Article : Google Scholar : PubMed/NCBI
|
|
3
|
Siegel RL, Giaquinto AN and Jemal A:
Cancer statistics, 2024. CA Cancer J Clin. 74:12–49. 2024.
View Article : Google Scholar : PubMed/NCBI
|
|
4
|
Xia C, Dong X, Li H, Cao M, Sun D, He S,
Yang F, Yan X, Zhang S, Li N and Chen W: Cancer statistics in China
and United States, 2022: Profiles, trends, and determinants. Chin
Med J (Engl). 135:584–590. 2022. View Article : Google Scholar : PubMed/NCBI
|
|
5
|
Monk BJ, Colombo N, Tewari KS, Dubot C,
Caceres MV, Hasegawa K, Shapira-Frommer R, Salman P, Yañez E, Gümüş
M, et al: First-line pembrolizumab + chemotherapy versus placebo +
chemotherapy for persistent, recurrent, or metastatic cervical
cancer: Final overall survival results of KEYNOTE-826. J Clin
Oncol. 41:5505–5511. 2023. View Article : Google Scholar : PubMed/NCBI
|
|
6
|
Monk BJ, Tewari KS, Dubot C, Caceres MV,
Hasegawa K, Shapira-Frommer R, Salman P, Yañez E, Gümüş M, Hurtado
de Mendoza MO, et al: Health-related quality of life with
pembrolizumab or placebo plus chemotherapy with or without
bevacizumab for persistent, recurrent, or metastatic cervical
cancer (KEYNOTE-826): A randomised, double-blind,
placebo-controlled, phase 3 trial. Lancet Oncol. 24:392–402. 2023.
View Article : Google Scholar : PubMed/NCBI
|
|
7
|
Kang I and Bucala R: The immunobiology of
MIF: Function, genetics and prospects for precision medicine. Nat
Rev Rheumatol. 15:427–437. 2019. View Article : Google Scholar : PubMed/NCBI
|
|
8
|
Zhao H, Wu L, Yan G, Chen Y, Zhou M, Wu Y
and Li Y: Inflammation and tumor progression: Signaling pathways
and targeted intervention. Signal Transduct Target Ther. 6:2632021.
View Article : Google Scholar : PubMed/NCBI
|
|
9
|
Greten FR and Grivennikov SI: Inflammation
and cancer: Triggers, mechanisms, and consequences. Immunity.
51:27–41. 2019. View Article : Google Scholar : PubMed/NCBI
|
|
10
|
Ravichandran KA and Heneka MT:
Inflammasomes in neurological disorders-mechanisms and therapeutic
potential. Nat Rev Neurol. 20:67–83. 2024. View Article : Google Scholar : PubMed/NCBI
|
|
11
|
Fu J, Schroder K and Wu H: Mechanistic
insights from inflammasome structures. Nat Rev Immunol. 24:518–535.
2024. View Article : Google Scholar : PubMed/NCBI
|
|
12
|
Harris J, VanPatten S, Deen NS, Al-Abed Y
and Morand EF: Rediscovering MIF: New tricks for an old cytokine.
Trends Immunol. 40:447–462. 2019. View Article : Google Scholar : PubMed/NCBI
|
|
13
|
Liu Y, Liu Y, Wang Q, Song Y, Chen S,
Cheng B, Zhang Y, Cui Z, Wu Z and Zhu C: MIF inhibitor ISO-1
alleviates severe acute pancreatitis-associated acute kidney injury
by suppressing the NLRP3 inflammasome signaling pathway. Int
Immunopharmacol. 96:1075552021. View Article : Google Scholar : PubMed/NCBI
|
|
14
|
Wu S, Lian J, Tao H, Shang H and Zhang L:
Correlation of macrophage migration inhibitory factor gene
polymorphism with the risk of early-stage cervical cancer and
lymphatic metastasis. Oncol Lett. 2:1261–1267. 2011. View Article : Google Scholar : PubMed/NCBI
|
|
15
|
Tsuchiya S, Yamabe M, Yamaguchi Y,
Kobayashi Y, Konno T and Tada K: Establishment and characterization
of a human acute monocytic leukemia cell line (THP-1). Int J
Cancer. 26:171–176. 1980. View Article : Google Scholar : PubMed/NCBI
|
|
16
|
Livak KJ and Schmittgen TD: Analysis of
relative gene expression data using real-time quantitative PCR and
the 2(−Delta Delta C(T)) method. Methods. 25:402–408. 2001.
View Article : Google Scholar : PubMed/NCBI
|
|
17
|
Yang H, Xia L, Chen J, Zhang S, Martin V,
Li Q, Lin S, Chen J, Calmette J, Lu M, et al:
Stress-glucocorticoid-TSC22D3 axis compromises therapy-induced
antitumor immunity. Nat Med. 25:1428–1441. 2019. View Article : Google Scholar : PubMed/NCBI
|
|
18
|
Nataraja C, Flynn J, Dankers W, Northcott
M, Zhu W, Sherlock R, Bennett TJ, Russ BE, Miceli I, Pervin M, et
al: GILZ regulates type I interferon release and sequesters STAT1.
J Autoimmun. 131:1028582022. View Article : Google Scholar : PubMed/NCBI
|
|
19
|
Flamini S, Sergeev P, Viana de Barros Z,
Mello T, Biagioli M, Paglialunga M, Fiorucci C, Prikazchikova T,
Pagano S, Gagliardi A, et al: Glucocorticoid-induced leucine zipper
regulates liver fibrosis by suppressing CCL2-mediated leukocyte
recruitment. Cell Death Dis. 12:4212021. View Article : Google Scholar : PubMed/NCBI
|
|
20
|
Ma Y, Yang H and Kroemer G: Endogenous and
exogenous glucocorticoids abolish the efficacy of immune-dependent
cancer therapies. Oncoimmunology. 9:16736352020. View Article : Google Scholar : PubMed/NCBI
|
|
21
|
de Visser KE and Joyce JA: The evolving
tumor microenvironment: From cancer initiation to metastatic
outgrowth. Cancer Cell. 41:374–403. 2023. View Article : Google Scholar : PubMed/NCBI
|
|
22
|
Mellman I, Chen DS, Powles T and Turley
SJ: The cancer-immunity cycle: Indication, genotype, and
immunotype. Immunity. 56:2188–2205. 2023. View Article : Google Scholar : PubMed/NCBI
|
|
23
|
Ochando J, Mulder WJM, Madsen JC, Netea MG
and Duivenvoorden R: Trained immunity-basic concepts and
contributions to immunopathology. Nat Rev Nephrol. 19:23–37. 2023.
View Article : Google Scholar : PubMed/NCBI
|
|
24
|
Kloosterman DJ and Akkari L: Macrophages
at the interface of the co-evolving cancer ecosystem. Cell.
186:1627–1651. 2023. View Article : Google Scholar : PubMed/NCBI
|
|
25
|
Pittet MJ, Michielin O and Migliorini D:
Clinical relevance of tumour-associated macrophages. Nat Rev Clin
Oncol. 19:402–421. 2022. View Article : Google Scholar : PubMed/NCBI
|
|
26
|
Locati M, Curtale G and Mantovani A:
Diversity, mechanisms, and significance of macrophage plasticity.
Annu Rev Pathol. 15:123–147. 2020. View Article : Google Scholar : PubMed/NCBI
|
|
27
|
Wang H, Yung MMH, Ngan HYS, Chan KKL and
Chan DW: The impact of the tumor microenvironment on macrophage
polarization in cancer metastatic progression. Int J Mol Sci.
22:65602021. View Article : Google Scholar : PubMed/NCBI
|
|
28
|
Anderson NR, Minutolo NG, Gill S and
Klichinsky M: Macrophage-based approaches for cancer immunotherapy.
Cancer Res. 81:1201–1208. 2021. View Article : Google Scholar : PubMed/NCBI
|
|
29
|
Bian Z, Gong Y, Huang T, Lee CZW, Bian L,
Bai Z, Shi H, Zeng Y, Liu C, He J, et al: Deciphering human
macrophage development at single-cell resolution. Nature.
582:571–576. 2020. View Article : Google Scholar : PubMed/NCBI
|
|
30
|
Woolbright BL, Rajendran G, Abbott E,
Martin A, Amalraj S, Dennis K, Li X, Warrick J and Taylor JA III:
Role of MIF1/MIF2/CD74 interactions in bladder cancer. J Pathol.
259:46–55. 2022. View Article : Google Scholar : PubMed/NCBI
|
|
31
|
Huang G, Ma L, Shen L, Lei Y, Guo L, Deng
Y and Ding Y: MIF/SCL3A2 depletion inhibits the proliferation and
metastasis of colorectal cancer cells via the AKT/GSK-3β pathway
and cell iron death. J Cell Mol Med. 26:3410–3422. 2022. View Article : Google Scholar : PubMed/NCBI
|
|
32
|
Jia X, Xi J, Tian B, Zhang Y, Wang Z, Wang
F, Li Z, Long J, Wang J, Fan GH and Li Q: The tautomerase activity
of tumor exosomal MIF promotes pancreatic cancer progression by
modulating MDSC differentiation. Cancer Immunol Res. 12:72–90.
2024. View Article : Google Scholar : PubMed/NCBI
|
|
33
|
Penticuff JC, Woolbright BL, Sielecki TM,
Weir SJ and Taylor JA: MIF family proteins in genitourinary cancer:
Tumorigenic roles and therapeutic potential. Nat Rev Urol.
16:318–328. 2019. View Article : Google Scholar : PubMed/NCBI
|
|
34
|
Wang Q, Wei Y and Zhang J: Combined
knockdown of D-dopachrome tautomerase and migration inhibitory
factor inhibits the proliferation, migration, and invasion in human
cervical cancer. Int J Gynecol Cancer. 27:634–642. 2017. View Article : Google Scholar : PubMed/NCBI
|
|
35
|
Cao X and Xu J: Insights into inflammasome
and its research advances in cancer. Tumori. 105:456–464. 2019.
View Article : Google Scholar : PubMed/NCBI
|
|
36
|
Barnett KC, Li S, Liang K and Ting JPY: A
360° view of the inflammasome: Mechanisms of activation, cell
death, and diseases. Cell. 186:2288–2312. 2023. View Article : Google Scholar : PubMed/NCBI
|
|
37
|
Ershaid N, Sharon Y, Doron H, Raz Y, Shani
O, Cohen N, Monteran L, Leider-Trejo L, Ben-Shmuel A, Yassin M, et
al: NLRP3 inflammasome in fibroblasts links tissue damage with
inflammation in breast cancer progression and metastasis. Nat
Commun. 10:43752019. View Article : Google Scholar : PubMed/NCBI
|
|
38
|
Kopalli SR, Kang TB, Lee KH and Koppula S:
NLRP3 Inflammasome activation inhibitors in inflammation-associated
cancer immunotherapy: An update on the recent patents. Recent Pat
Anticancer Drug Discov. 13:106–117. 2018. View Article : Google Scholar : PubMed/NCBI
|
|
39
|
Wang L, Wang C, Tao Z, Zhu W, Su Y and
Choi WS: Tumor-associated macrophages facilitate oral squamous cell
carcinomas migration and invasion by MIF/NLRP3/IL-1β circuit: A
crosstalk interrupted by melatonin. Biochim Biophys Acta Mol Basis
Dis. 1869:1666952023. View Article : Google Scholar : PubMed/NCBI
|
|
40
|
Basak U, Sarkar T, Mukherjee S,
Chakraborty S, Dutta A, Dutta S, Nayak D, Kaushik S, Das T and Sa
G: Tumor-associated macrophages: An effective player of the tumor
microenvironment. Front Immunol. 14:12952572023. View Article : Google Scholar : PubMed/NCBI
|
|
41
|
Figueiredo CR, Azevedo RA, Mousdell S,
Resende-Lara PT, Ireland L, Santos A, Girola N, Cunha RLOR, Schmid
MC, Polonelli L, et al: Blockade of MIF-CD74 signalling on
macrophages and dendritic cells restores the antitumour immune
response against metastatic melanoma. Front Immunol. 9:11322018.
View Article : Google Scholar : PubMed/NCBI
|
|
42
|
Perez-Riverol Y, Bai J, Bandla C,
García-Seisdedos D, Hewapathirana S, Kamatchinathan S, Kundu DJ,
Prakash A, Frericks-Zipper A, Eisenacher M, et al: The PRIDE
database resources in 2022: A hub for mass spectrometry-based
proteomics evidences. Nucleic Acids Res. 50:D543–D552. 2022.
View Article : Google Scholar : PubMed/NCBI
|