Introduction
Liver cancer is one of the most frequently diagnosed
types of cancer worldwide and a leading cause of cancer-associated
mortality (1–6). It is estimated that, by 2025, the
number of cases of liver cancer worldwide will be >1 million
(7). Presently, this category of
malignant disease imposes an escalating burden on individuals,
families and societies; notably, it incurs substantial economic
costs and introduces elements of instability. Therefore, it is
particularly important to elucidate the pathogenic mechanism
underlying liver cancer as this should facilitate the development
of effective strategies for the prevention and control of this
disease.
In order to maintain their rapid proliferation,
cancer cells rely on a continuous supply of energy and materials.
Therefore, compared with normal healthy cells, cancer cells exhibit
alterations in the metabolism of matter and energy, including
changes in glucose, lipid and protein metabolism. Proliferation is
a core behavior of all cancer cells; this encompasses the pivotal
involvement of fatty acids in the synthesis of biomembranes, as
well as the engagement of signaling molecules, thereby underscoring
the association of the reprogramming of lipid metabolism with the
pathogenesis and progression of cancer (8–11). The
liver is the core organ that maintains fat metabolism and
homeostasis. The reprogramming of liver lipid metabolism during the
development of liver cancer is a topic of interest to researchers.
It has been shown that in the transformation of non-alcoholic
steatohepatitis into liver cancer, the activation of a variety of
oncogenic signals and fatty acid metabolism signals occurs, and
targeted inhibition of the lipoprotein lipase/fatty acid-binding
protein 4/carnitine palmitoyltransferase 1 fatty acid metabolism
signaling axis can prevent this transformation; this indicates that
the activation of signaling pathways associated with fatty acid
metabolism may be involved in the initiation and maintenance of
hepatocellular carcinogenesis (12). Mitochondria are important sites for
lipolysis and anabolism. Mitochondrial fission facilitates the
shift in glucose metabolism from glycolysis to oxidative
phosphorylation, thereby alleviating the energy stress associated
with tumor survival (13). In
addition, mitochondrial fission promotes fatty acid synthesis in
liver cancer cells, inhibits fatty acid oxidation and regulates the
reprogramming of lipid metabolism to promote liver cancer cell
proliferation, metastasis and tumor growth in vivo (13). The upregulation of fatty acid and
cholesterol synthesis, and changes in fatty acid oxidation are key
features of fatty acid metabolism reprogramming in cancer cells
(14,15). Signaling molecules that regulate
fatty acid and cholesterol metabolism are undergoing evaluation as
new therapeutic targets for liver cancer (16). Although it has been shown that lipid
metabolism reprogramming plays an important role in the occurrence
and development of liver cancer, the specific molecular mechanisms
are not yet fully understood.
The mitogen-activated protein kinase
(MAPK)/extracellular signal-regulated kinase (ERK) signaling
pathway is a key pathway that regulates a variety of cellular
processes, including cell proliferation, differentiation, migration
and aging (17). The MAPK/ERK
signaling pathway is activated through signal transduction via cell
surface receptors (18).
Dysregulation of this pathway can lead to cell abnormalities, which
are manifested as an excessive increase in cell growth and
proliferation, dedifferentiation and enhanced survival ability;
these abnormalities jointly promote the occurrence of cancer
(18). There are a number of
specific receptor tyrosine kinases that can trigger this pathway,
including platelet-derived growth factor receptor, epidermal growth
factor receptor (EGFR), fibroblast growth factor receptor and
vascular endothelial growth factor receptor (19). However, the mechanism by which the
regulation of lipid metabolism affects the MAPK/ERK signaling
pathway has not yet been clearly interpreted.
Fatty acid hydroxylase domain containing 2 (FAXDC2),
also known as C5orf4, is a member of the fatty acid hydroxylase
superfamily. It has been reported that the expression of FAXDC2 is
downregulated in prostate cancer and neuroblastoma, and that the
low expression of FAXDC2 is an unfavorable factor for the prognosis
of these diseases (20,21). In addition, it has been shown that
FAXDC2 regulates megakaryocyte differentiation through mechanisms
associated with the regulation of ERK signaling (22). Our previous study (23) demonstrated that the expression of
FAXDC2 is downregulated in various types of cancer, including liver
cancer, and its low expression is significantly associated with a
poor prognosis. In addition, it revealed that the overexpression of
FAXDC2 inhibited the proliferation and invasion of HepG2 cells.
Given that the liver is important for lipid metabolism and FAXDC2
is a hydroxylase involved in cholesterol and sphingomyelin
synthesis, the overexpression of which can inhibit ERK
phosphorylation, it was hypothesized that FAXDC2 may mediate its
tumor-suppressive effects via the inhibition of ERK
phosphorylation.
Despite interest in the association between
metabolism and cancer, studies directly assessing the relationship
between metabolic small molecules and tumor metabolism remain
limited. The present study employed high-throughput metabolomics
analysis to investigate the mechanisms by which FAXDC2 modulates
the proliferation and invasion of liver cancer cells through
cellular metabolism. Since this identified a significant increase
in guanosine diphosphate (GDP) levels in HepG2 cells following
FAXDC2 overexpression, the present study also examined the
comprehensive expression profiles of liver cancer cells following
FAXDC2 overexpression and concomitant GDP elevation and delineated
their inhibitory effects on the proliferation and invasion of liver
cancer cells.
Materials and methods
Cell culture, FAXDC2 overexpression
and GDP treatment
HepG2 cells (cat. no. HB-8065; American Type Culture
Collection) were cultured in Dulbecco's modified Eagle's medium
(Gibco; Thermo Fisher Scientific, Inc.) containing 10% fetal calf
serum [Serana (WA) Pty, Ltd.], 100 U/ml penicillin and 100 µg/ml
streptomycin (cat. no. C0222; Beyotime Institute of Biotechnology).
Transfection of HepG2 cells was performed using
Lipofectamine® 2000 (Invitrogen; Thermo Fisher
Scientific, Inc.) according to the manufacturer's protocol. Cells
were transfected at ~80% confluence, with 5 µg plasmid/dish, The
plasmid was incubated with Lipofectamine for 10 min, then the
DNA-lipid complex was added to the cells and incubated for 48 h at
37°C. FAXDC2 overexpression was achieved by inserting the coding
sequence of human FAXDC2 (Accession no. NM_032385) into the pCMV-HA
vector (Agilent Technologies, Inc.) to generate pCMV-HA-FAXDC2.
Empty pCMV-HA vector was used as a negative control for
overexpression. GDP was diluted with medium before being used to
treat the cells for 48 h. The GDP concentrations were 20, 40, 80,
160 and 200 µM. The cells were treated and cultured at 37°C and 5%
CO2.
Reverse transcription-quantitative PCR
(RT-qPCR)
Total RNA was extracted from cells utilizing the
FastPure Complex Tissue/Cell Total RNA Isolation Kit (cat. no.
RC113-01; Vazyme Biotech Co., Ltd.), according to the
manufacturer's protocol. Subsequently, cDNA synthesis was achieved
by employing the HiScript II 1st Strand cDNA Synthesis Kit (+gDNA
wiper) (cat. no. R212-01; Vazyme Biotech Co., Ltd.), again
according to the manufacturer's guidelines. qPCR was performed
using SYBR Premix Ex Taq II (Takara Bio, Inc.), according to the
manufacturer's protocol. The qPCR cycling conditions were as
follows: Initial denaturation at 50°C for 2 min; followed by a
second denaturation at 95°C for 5 min; and then 40 cycles of
amplification, each consisting of denaturation at 95°C for 15 sec
and annealing/extension at 60°C for 40 sec. The primers employed in
the PCR analysis were sourced from TsingKe Biological Technology.
For quantification purposes, the expression levels of GAPDH served
as an internal reference, and the relative expression levels of
FAXDC2 were determined using the 2−ΔΔCq method (24). The primer sequences were as follows:
FAXDC2 forward, 5′-GGCTGCTGACTACATTTGAAGG-3′ and reverse,
5′-TCAACCACCAATAGAAGCCCA-3′; GAPDH forward,
5′-TGCACCACCAACTGCTTAGC-3′ and reverse 5′-GGCATGGACTGTGGTCATGAG-3′.
Each RT-qPCR analysis was repeated three times.
Untargeted metabolomics analysis
The culture medium was removed from the HepG2 cells
transfected with FAXDC2 overexpression vector or empty vector, and
the plate was washed 2 or 3 times with pre-cooled PBS.
Subsequently, the supernatant was discarded, trypsin was added for
digestion and the cells were washed a further 2 or 3 times with
PBS. The cells were then transferred to a centrifuge tube at 4°C
and were centrifuged at 4°C, 1,200 × g for 2 min, after which the
supernatant was discarded, and the cells were collected and placed
into a 1.5-ml microcentrifuge tube. The cells were frozen in liquid
nitrogen for 15 min and then prepared for analysis by liquid
chromatography-mass spectrometry (LC-MS). The LC-MS detection and
subsequent steps were all performed by Novogene Co. Ltd.
Bioinformatics
Raw data from the LC-MS analysis underwent
preprocessing with the Compound Discoverer 3.3 data processing
software (https://www.thermofisher.cn/order/catalog/product/OPTON-31056),
followed by metabolite identification through alignment with
high-resolution tandem mass spectrometry databases including
mzCloud (beta.mzcloud.org), mzVault and the MassList primary
database (both Thermo Fisher Scientific, Inc.). Using the relative
quantitative values of the metabolites, Pearson correlation
coefficients were computed among quality control samples (25). Partial least squares discrimination
analysis was then applied, utilizing partial least squares
regression (26) to model the
relationships between metabolite expression levels and sample
categories, enabling the classification and prediction of sample
types. Principal component analysis was performed with the
logarithmic transformation and standardization of data using MetaX
(version: 1.4.17) (27).
Furthermore, Kyoto Encyclopedia of Genes and Genomes (KEGG) pathway
analysis was conducted using the KEGG database (https://www.genome.jp/kegg/pathway.html), with
categorization of the biological metabolic pathways into the seven
primary KEGG groups: Metabolism, Genetic Information Processing,
Environmental Information Processing, Cellular Processes,
Organismal Systems, Human Diseases and Drug Development. The Human
Metabolome Database (HMDB; http://hmdb.ca/metabolites) was employed to elucidate
the biological roles, disease associations, chemical reactions,
metabolic pathways and other pertinent details of human
metabolites.
AlphaFold3
The AlphaFold3 server (28) (https://www.alphafoldserver.com) was used to predict
if there is likely to be any interaction between GDP and
FAXDC2.
ELISA for the detection of
intracellular GDP
The human GDP content detection ELISA kit was
purchased from Tianjin Ruichuang Biotechnology Co., Ltd. (cat. no.
RC-E110643A). The culture medium was removed from cultured cells,
and the cells were washed with PBS and then treated with cell lysis
solution. After centrifugation at 4°C, 16,260 × g for 5 min, ELISA
of the supernatant was performed. Briefly, standard and sample
wells were set up, then horseradish peroxidase (HRP)-labeled
detection antibodies were added to the wells and incubated in a
water bath at 37°C for 60 min. The liquid was then discarded and
the wells were washed five times with washing solution. After
allowing to stand for 1 min, Substrates A and B were added, the
wells were incubated at 37°C in the dark for 15 min, and then stop
solution was added. The optical density (OD) of each well was
measured using a microplate reader, and the GDP content of the
sample was calculated from a standard curve.
Cell Counting Kit-8 (CCK-8) assay
Cell viability was assessed using the CCK-8 assay
(Beyotime Institute of Biotechnology). At 24, 48 and 72 h after GDP
treatment, 20 µl CCK-8 reagent was added to each well, and the
cells were incubated in a humidified CO2 incubator at
37°C for 1 h. The OD of the culture medium was then measured as the
absorbance at a wavelength of 450 nm using a microplate reader
(Bio-Rad Laboratories, Inc.).
Transwell assay
Cell invasion assays were performed in 24-well
plates with a 8-µm chamber insert in each well (Corning, Inc.). To
evaluate invasion, Matrigel was defrosted at 4°C and layered on an
insertion membrane to form a matrix barrier. The membrane was then
placed in a 37°C incubator for 30 min to solidify, and
1×10⁵ cells were seeded in the upper chamber after
suspension in serum-free medium. Then, 800 µl medium containing 10%
FBS was added to the lower chamber and the chamber was carefully
placed into a 24-well plate and cultured in an incubator at 37°C
for 48 h. Cells that adhered to the underlying membrane were fixed
and stained using a mixture of 0.1% crystal violet and 20% methanol
for 30 min at room temperature. Images of the cells were then
captured and the cells were counted under an inverted microscope
(Nikon Eclipse; Nikon Corporation). Each experimental group
consisted of three biological replicates.
Western blotting
Total cellular proteins were extracted from cells
with RIPA lysis buffer (Wuhan Elabscience Biotechnology Co., Ltd.),
and protein concentrations were quantified using the BCA assay.
Proteins (20 µg protein/lane) were then loaded onto 10%
polyacrylamide gels and electrophoresis was performed at a constant
voltage of 100 V to separate the protein bands. Protein transfer
was performed at a constant current of 300 mA; transfer was to a
PVDF membrane that had been activated with methanol for 30 sec
before use. Subsequently, the PVDF membrane was blocked by soaking
in 5% skimmed milk in Tris-buffered saline-0.05% Tween 20 (TBST)
for 1.5 h at room temperature and the excess milk was washed away
with TBST. The PVDF membrane was then incubated with primary
antibodies (1:1,000 dilution) for 90 min at room temperature and
washed three times with TBST (5 min/wash). Subsequently, the PVDF
membrane was incubated at room temperature for 90 min with the
secondary antibody (1:5,000 dilution) and then washed three times
with TBST (5 min/wash). Super-sensitive ECL chemoluminescent
substrate (cat. no. BL520A; Biosharp Life Sciences) was used for
film imaging. Semi-quantitative analysis was performed using ImageJ
1.52a software (http://imagej.org; National
Institutes of Health). Anti-phosphorylated-p44/42 MAPK (ERK1/2)
(cat. no. 4370), anti-p44/42 MAPK (ERK1/2) (cat. no. 4695) and
anti-cyclin-dependent kinase 4 (CDK4; 12790) were purchased from
Cell Signaling Technology, Inc.; anti-c-Myc protein (cat. no.
TA0358), anti-EGFR (cat. no. T55112), anti-cyclin D1 protein (cat.
no. TC52046) and anti-tubulin protein (cat. no. M30109) antibodies
were purchased from Abmart (Shanghai) Co., Ltd. HRP-conjugated goat
anti-mouse IgG and anti-rabbit IgG secondary antibodies were
purchased from CoWin Biosciences (1:5,000; cat. nos. CW0102 and
CW0103).
Statistical analysis
Statistical analysis was performed using GraphPad
Prism 8.0 software (GraphPad; Dotmatics). Data are presented as the
mean ± standard deviation. The data of the GDP experiment were
verified to conform to a normal distribution. Differences between
two groups were evaluated using unpaired Student's t-test. CCK-8
assay data were analyzed by one-way ANOVA followed by Dunnett's
post hoc tests. P<0.05 was considered to indicate a
statistically significant difference.
Results
Enrichment classification of
differential metabolites detected using untargeted metabolomics
analysis
Our previous study showed that FAXDC2 inhibits the
proliferation and invasion of HepG2 cells (23). To elucidate the regulatory
mechanisms of FAXDC2 in lipid metabolism and substance synthesis,
given its classification as a member of the fatty acid hydroxylase
superfamily, it was hypothesized that perturbations in the
expression of FAXDC2 could potentially modulate the metabolic
landscape of HepG2 cells, a widely used cell line in hepatic
metabolism research. Consequently, a comprehensive, non-targeted
metabolomics analysis was performed, in which the metabolic
profiles of HepG2 cells subjected to overexpression of FAXDC2 were
compared with those of HepG2 cells transfected with an empty vector
control. This approach aimed to identify specific metabolic
alterations that may be attributed to the modulation of FAXDC2
expression levels. To validate the experimental paradigm, RT-qPCR
analysis was initially conducted on HepG2 cells subjected to
overexpression of FAXDC2 in comparison with those subjected to
transfection with empty vector control. The analysis confirmed the
successful overexpression of FAXDC2 (Fig. 1A). In addition, a principal
component analysis was performed, which identified a statistically
significant disparity in the vector direction of the principal
components between the experimental and control groups (Fig. 1B), indicative of distinct metabolic
profiles between the two cohorts. Through the enrichment and
annotation of differential metabolites in the HMDB, it was revealed
that ‘lipids and lipid-like molecules’ were most enriched after the
overexpression of FAXDC2 (Fig. 1C),
which is consistent with the biological characteristics of FAXDC2.
Through KEGG pathway enrichment analysis, it was observed that the
differential metabolites detected after the overexpression of
FAXDC2 were mainly enriched in pathways associated with metabolism
(Fig. 1D), which indicated that the
differential expression of FAXDC2 induces changes in
metabolism-related pathways in HepG2 cells. Subsequently, a primary
HMDB classification of the differential metabolites in HepG2 cells
following the overexpression of FAXDC2 was performed. This revealed
that the most prevalent category of these metabolites was ‘lipids
and lipid-like molecules’ (Fig.
1E). This aligns well with the established biological function
of FAXDC2 in lipid metabolism and biosynthesis.
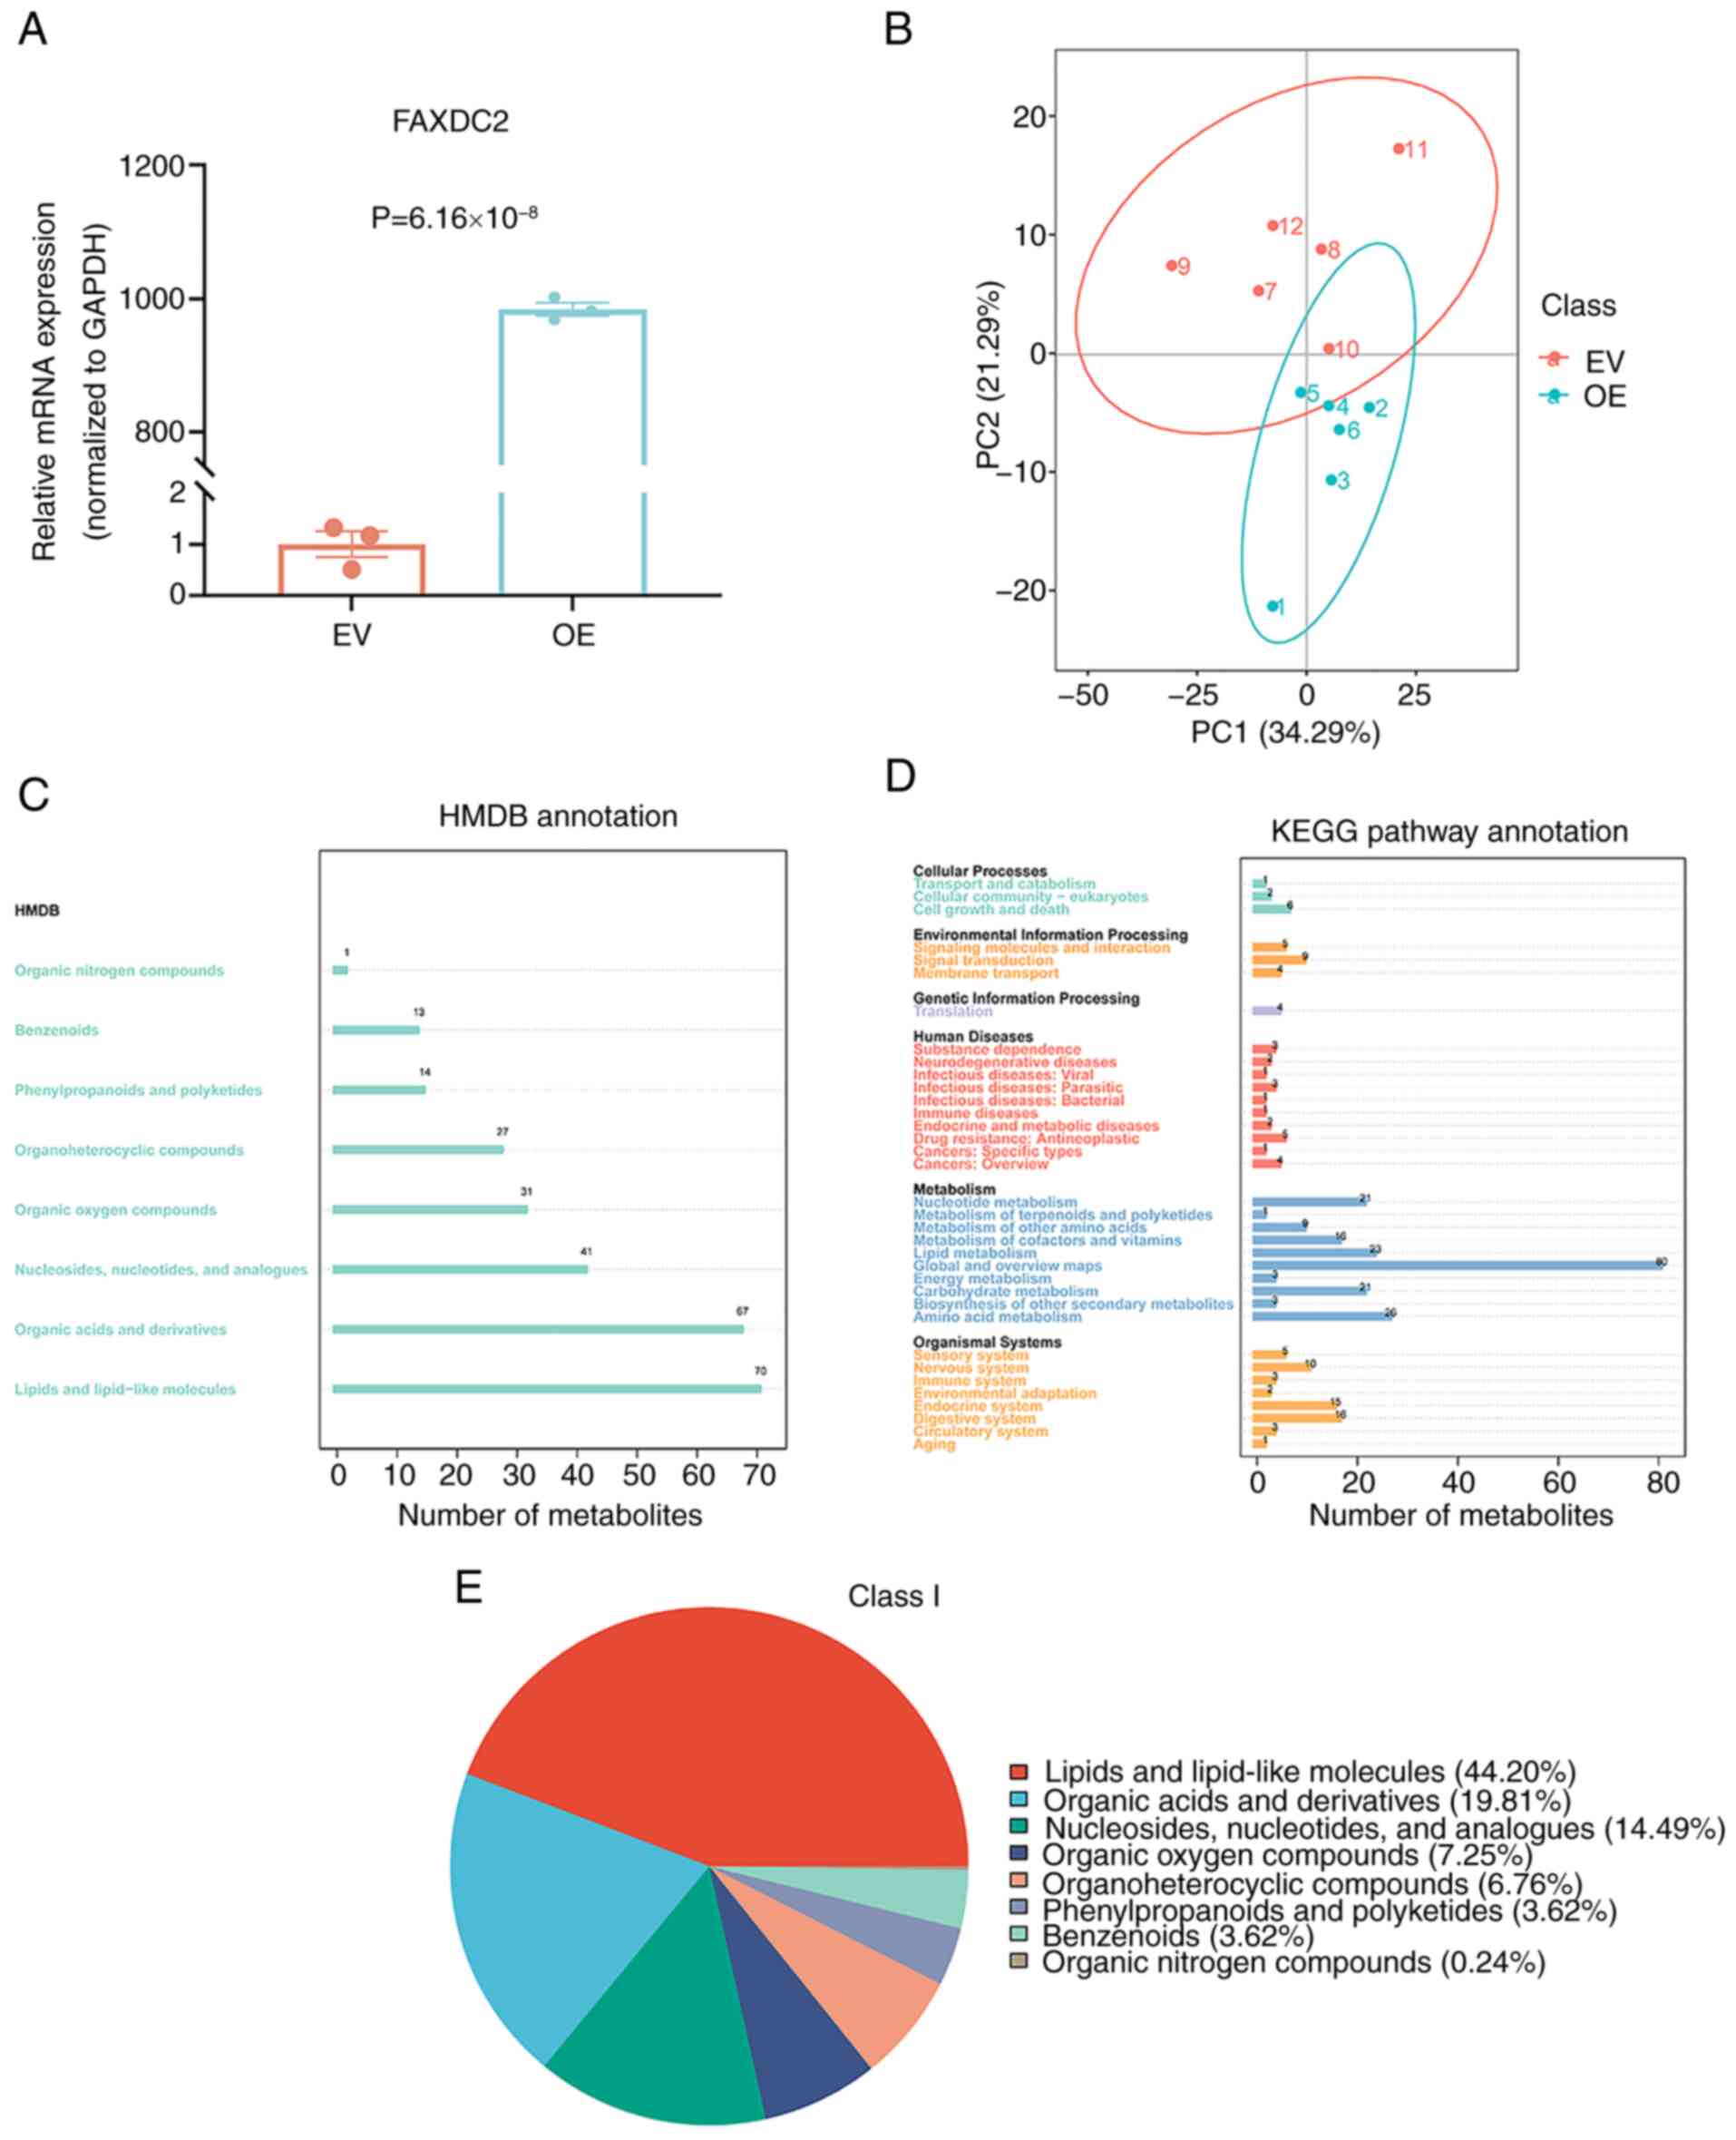 | Figure 1.Differential metabolite
classification in HepG2 cells after the overexpression of FAXDC2
assessed based on untargeted metabolomics. (A) Overexpression of
FAXDC2 was confirmed by reverse transcription-quantitative PCR.
Each set of experiments had three biological replicates. (B)
Two-dimensional scatter plot of principal component analysis
between the FAXDC2 overexpression and control groups. The abscissa
represents the PC1 score, the ordinate represents the PC2 score,
and the magnitude of the score determines its position along the
PC1 or PC2 axis. (C) HMDB enrichment and annotation of differential
metabolites. (D) KEGG pathway enrichment set analysis; the labels
on the left are specific pathway names, and the numbers in the
graph represent the differential metabolites enriched in the
pathway. (E) First-level classification pie chart of differential
metabolites, showing the proportions of different types of
metabolites. FAXDC2, fatty acid hydroxylase domain containing 2;
EV, empty vector; OE, overexpression; PC1/2, principal component
1/2; HMDB, Human Metabolome Database; KEGG, Kyoto Encyclopedia of
Genes and Genomes. |
Detection of differential metabolites
based on untargeted metabolomics analysis
The correlations among differential metabolites in
the FAXDC2-overexpressing cells and their interactions within the
metabolic network were investigated. The top 20 ranked differential
metabolites are displayed from smallest to largest significance
level (P-value) in Fig. 2A. It was
observed that GDP was positively correlated with malic acid,
uridine diphosphate (UDP) and uridine 5′-diphosphoglucuronic acid
(UDPGA), and negatively correlated with other differential
metabolites. The relationships between these metabolites are
visually represented by a chord diagram (Fig. 2B). The commonalities or similar
properties of the three positively correlated metabolites primarily
lies in their roles in cellular metabolism. They serve as crucial
metabolic intermediates participating in various biochemical
pathways, particularly those associated with energy production,
synthesis and conversion processes (29,30).
Subsequently, a z-score plot was constructed, which revealed that
thymidine 5′-diphosphate, malic acid, daidzein, D-glucarate, UDP
and its derivative UDPGA exhibited significantly increased levels
in the FAXDC2-overexpressing cells compared with those in the
control group transfected with empty vector (Fig. 3A).
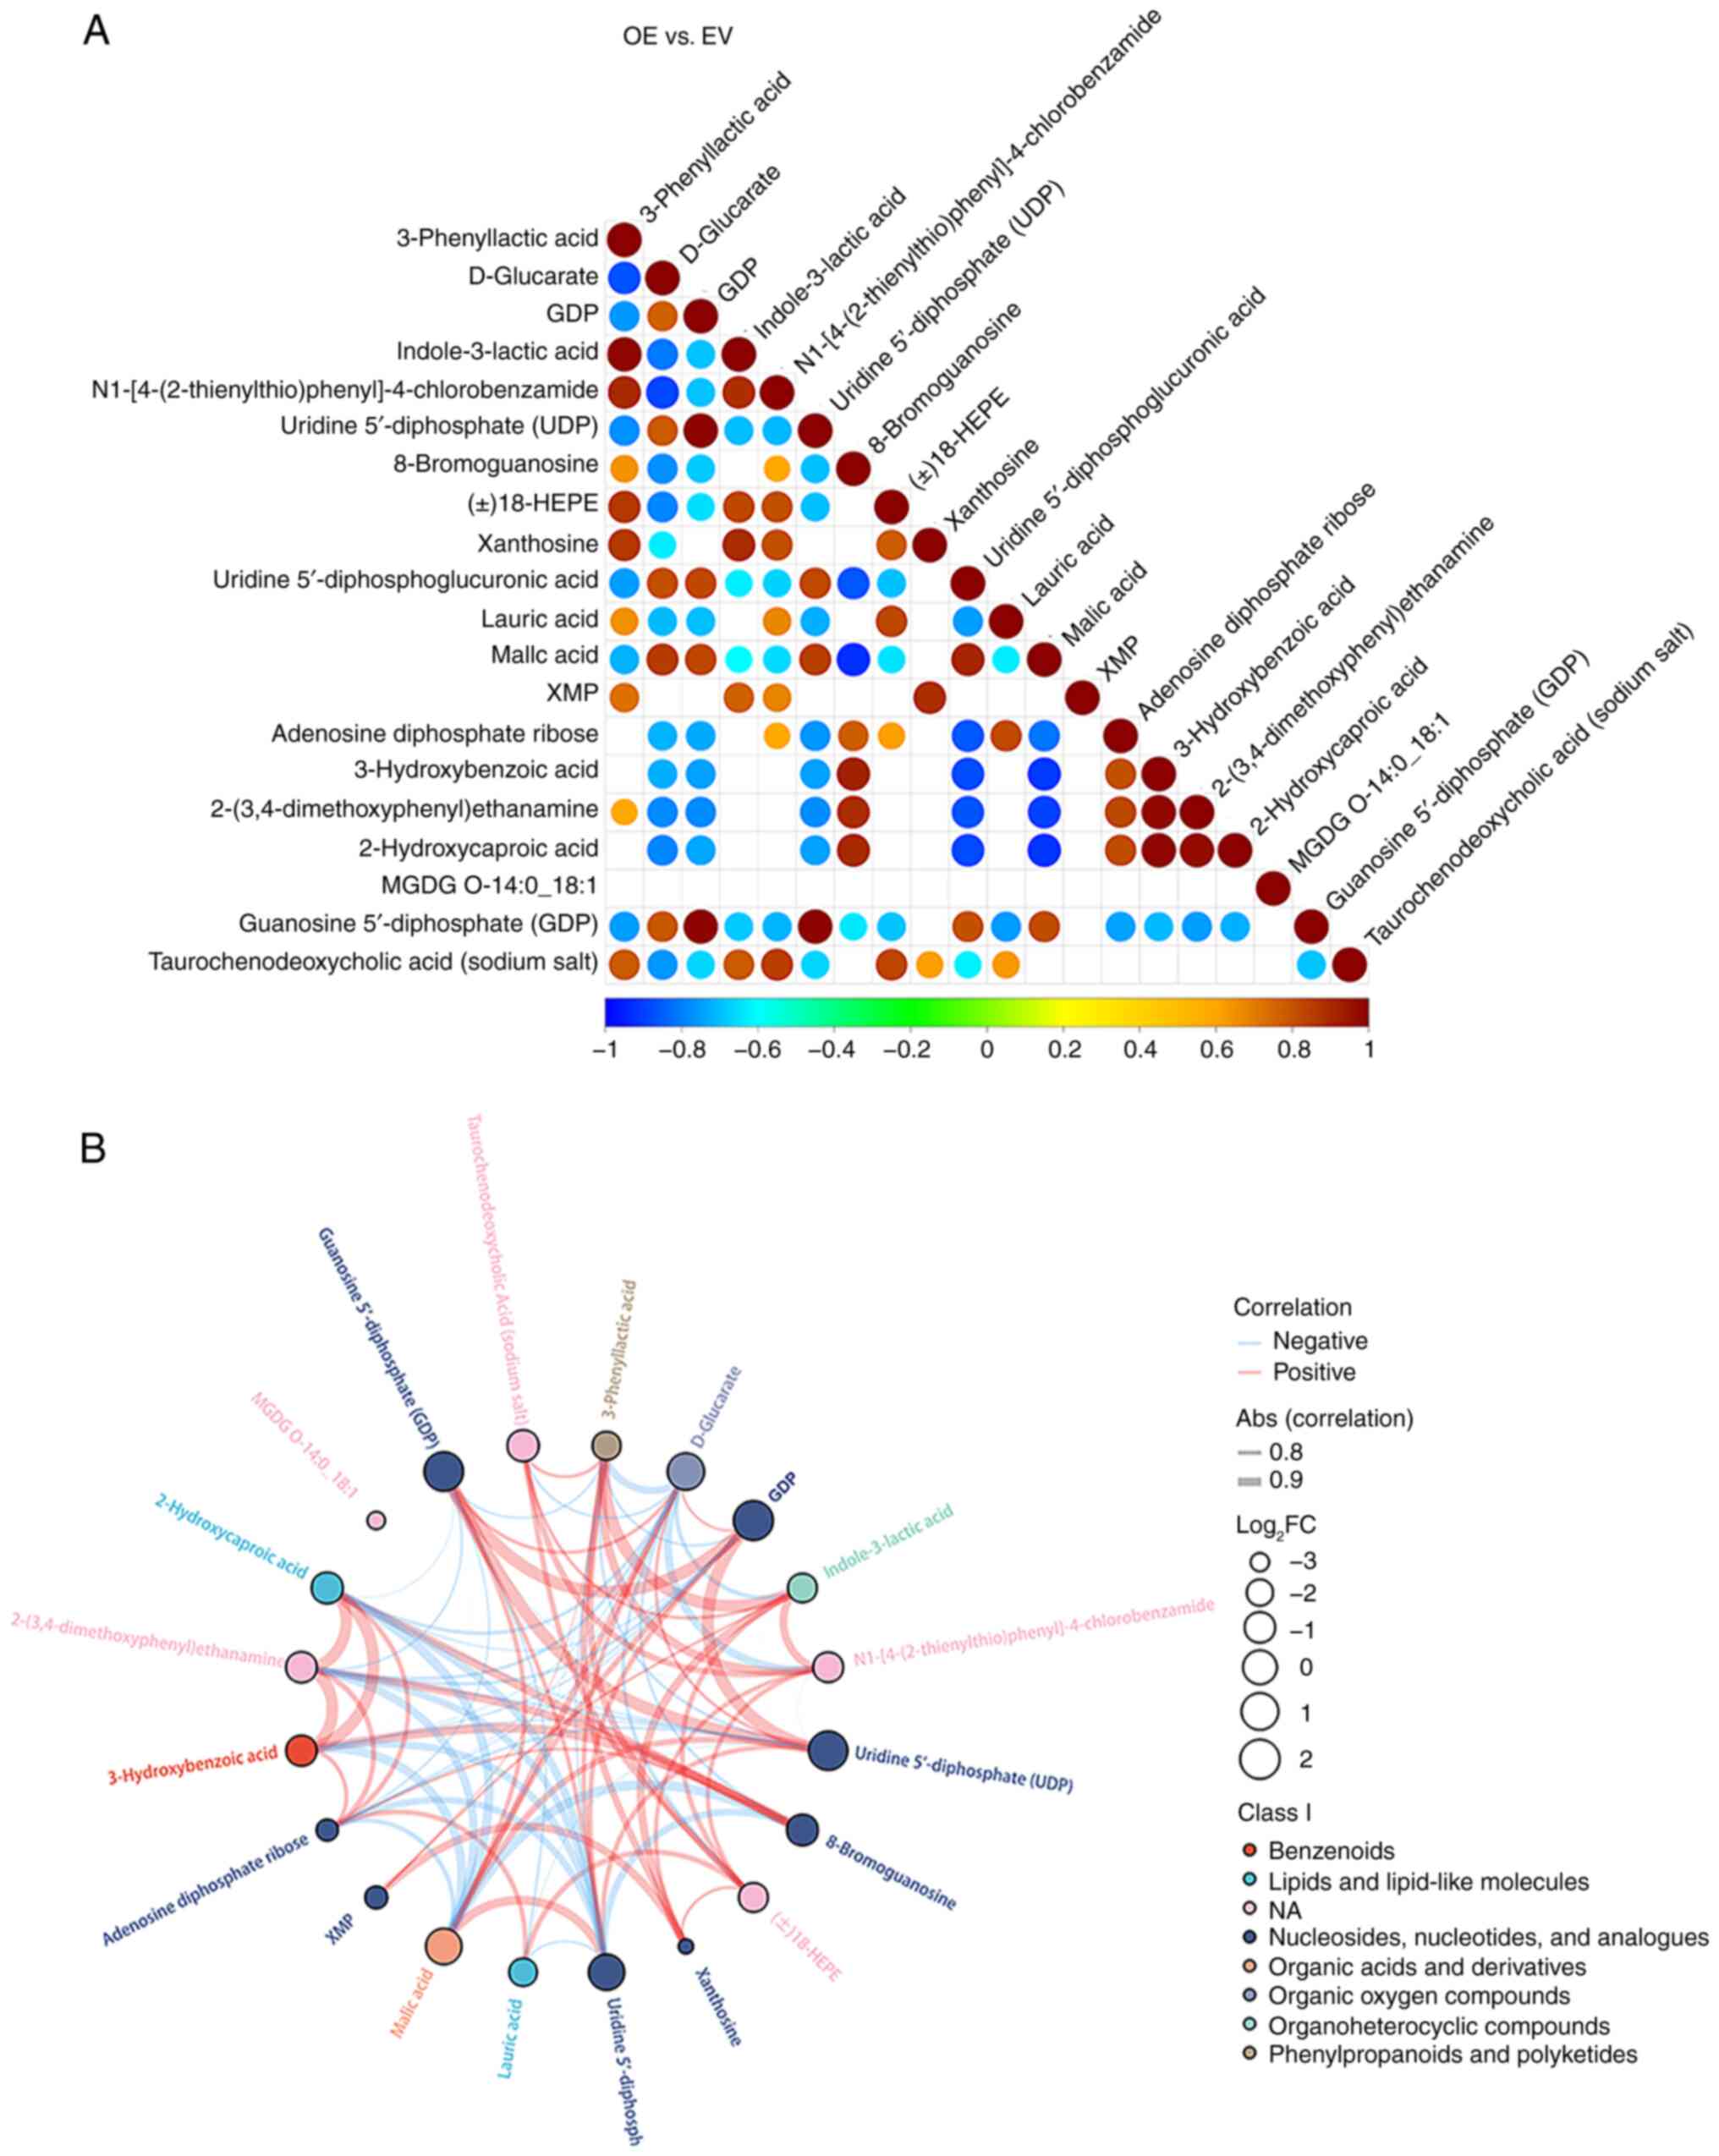 | Figure 2.Correlation analysis of the
differential metabolites of HepG2 cells after FAXDC2 overexpression
detected by non-targeted metabolomics. (A) Correlation analysis
plot of differential metabolites for the experimental group with
overexpression of FAXDC2 compared with the control group. The top
20 differential metabolites from smallest to largest P-value are
presented. The plot displays the Pearson correlation coefficients
between each pair of differential metabolites. (B) Chord diagram of
the top 20 differential metabolites providing a visual
representation of the correlations among these metabolites. Blue
represents a negative correlation, red represents a positive
correlation, and blank represents no significant correlation.
FAXDC2, fatty acid hydroxylase domain containing 2; OE,
overexpression; EV, empty vector; GDP, guanosine diphosphate;
18-HEPE, 18-hydroxyeicosapentaenoic acid; XMP, xanthosine
monophosphate; MGDG, monogalactosyldiacyl glycerol; Abs
(correlation), absolute value of the correlation coefficient;
log2FC, log2 fold change; NA, not
available. |
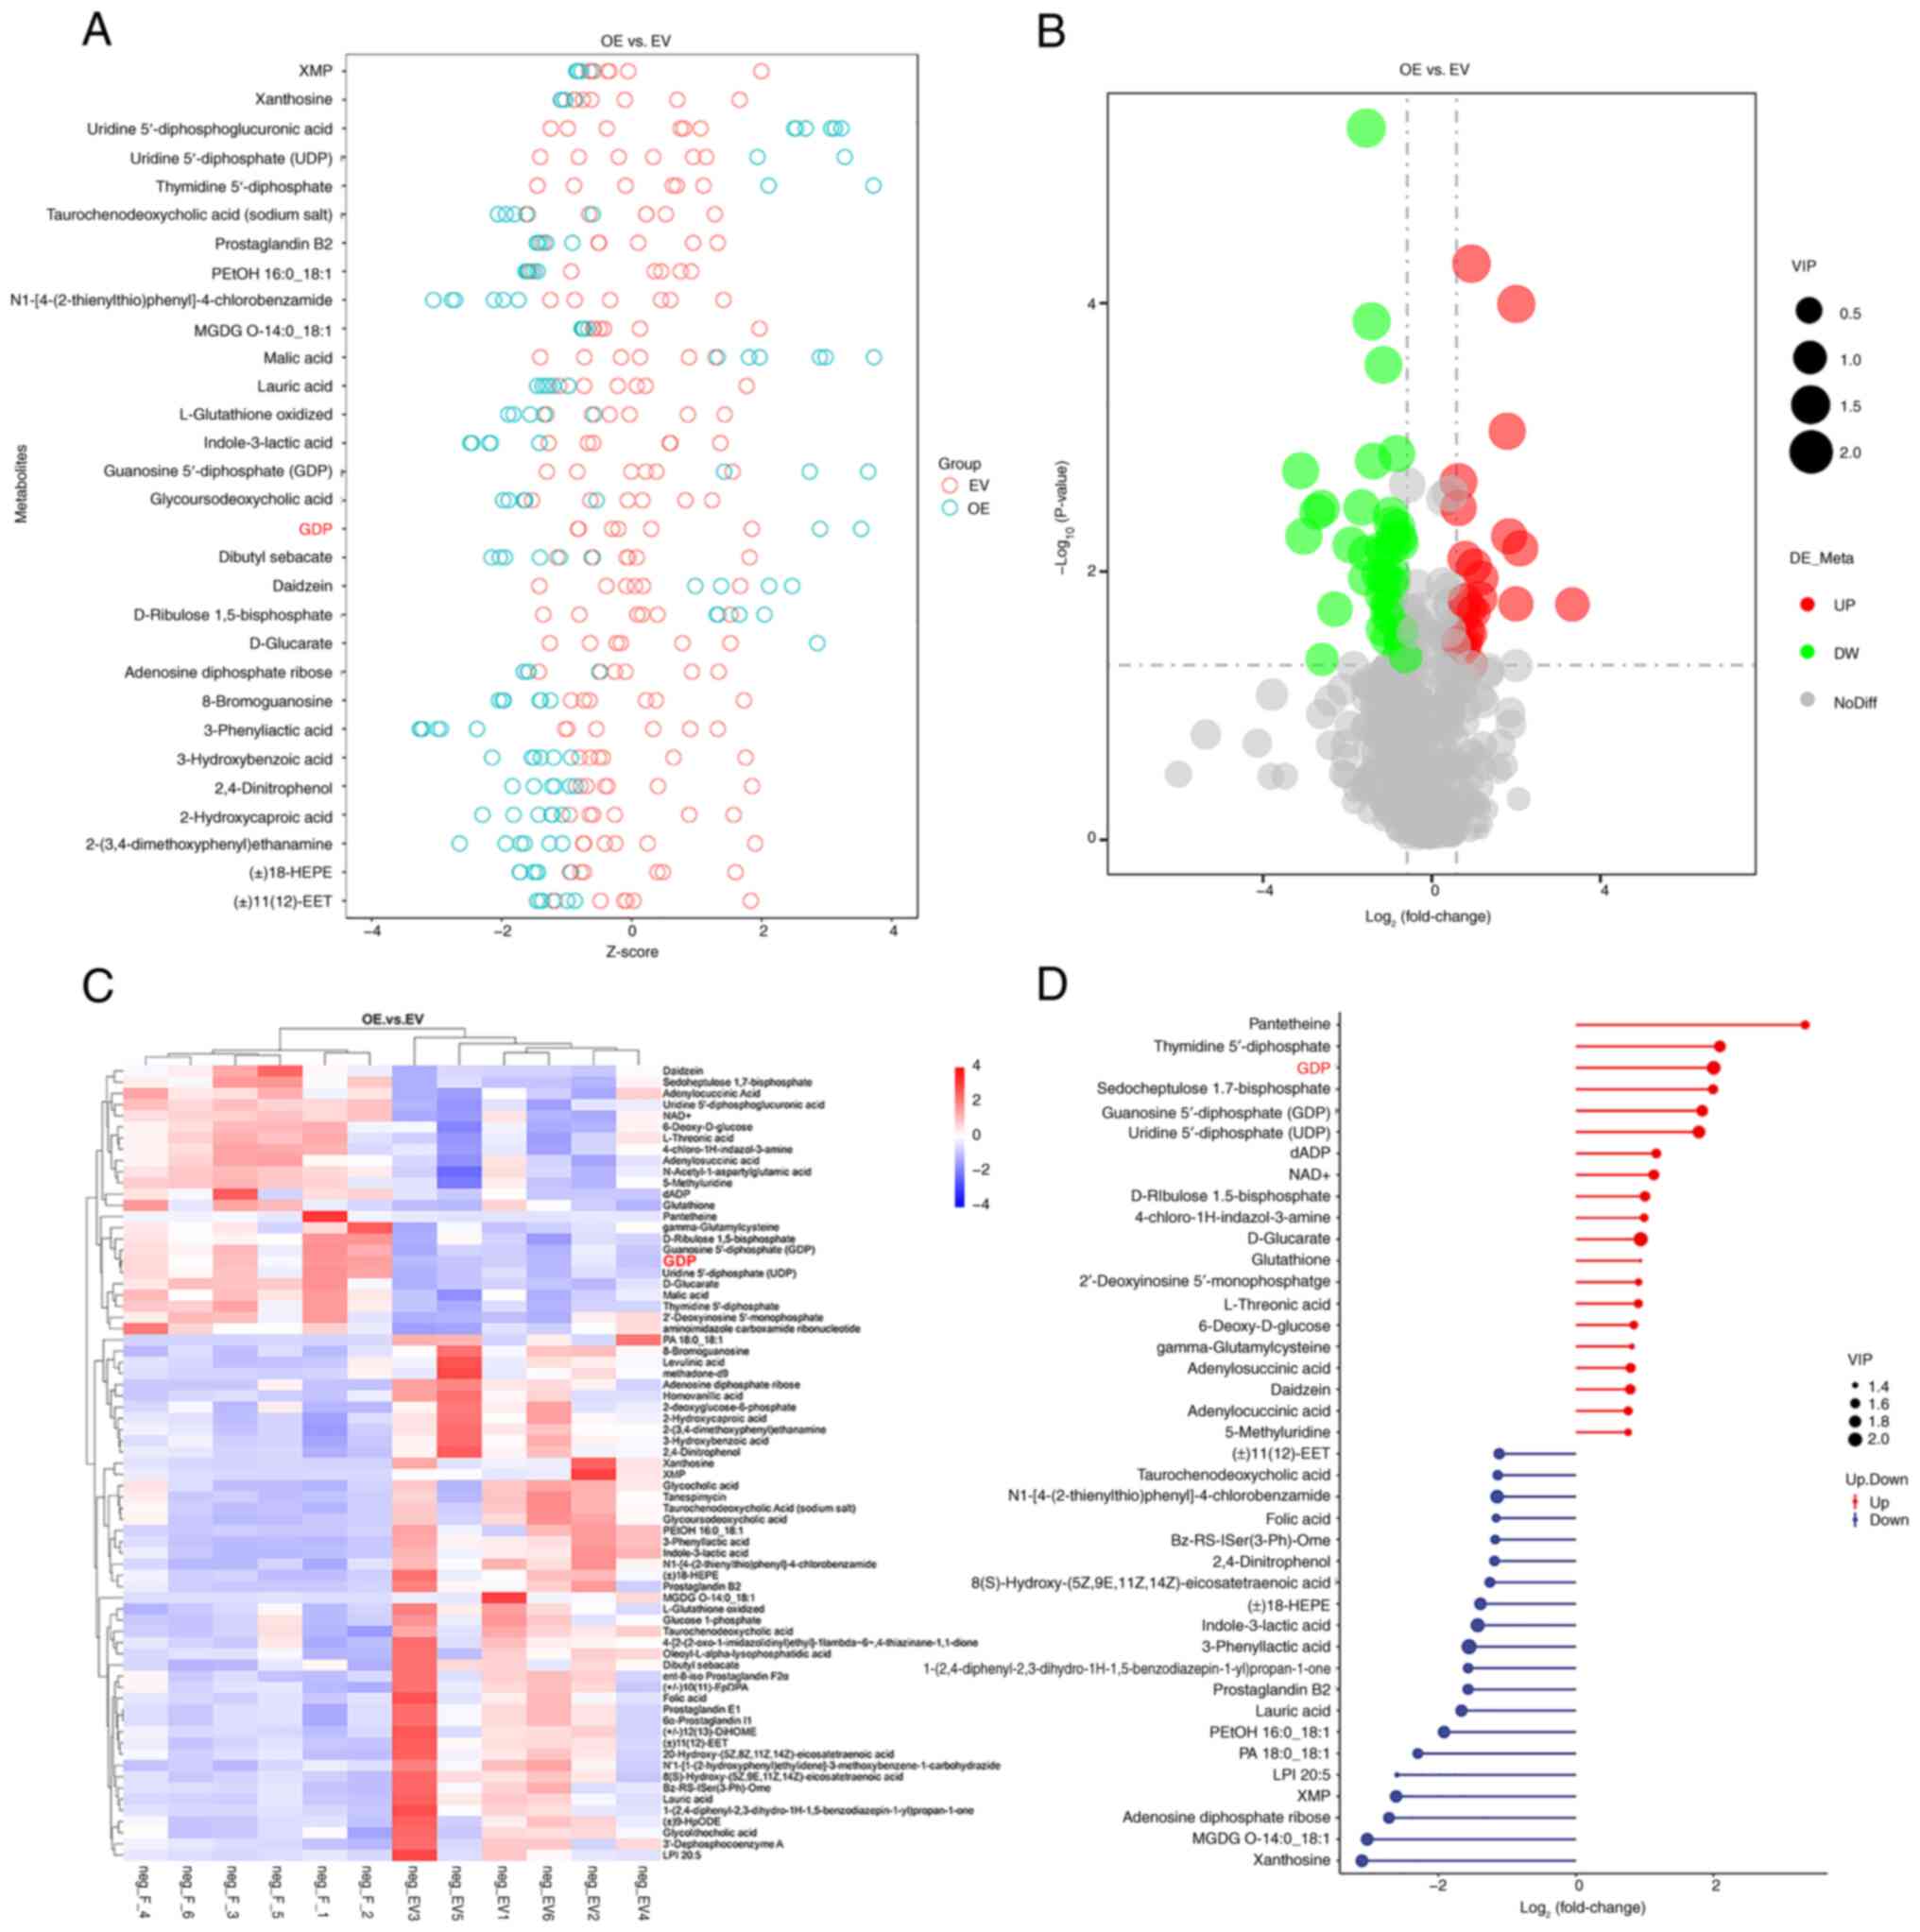 | Figure 3.Differential metabolite differential
analysis of HepG2 cells after the overexpression of FAXDC2 detected
by non-targeted metabolomics. (A) Z-score plot representing the
relative abundance of differential metabolites. Each circle
represents a specific sample. The z-scores of the top 30
metabolites sorted by P-value from smallest to largest are
displayed; samples with z-scores >4 or <-4 are not shown. (B)
Volcano plot of differential metabolites. Green represents
decreased abundance, red represents increased abundance, and gray
represents no significant difference. (C) Heatmap of differential
metabolites obtained by hierarchical clustering analysis performed
on differential metabolites to reveal differences in metabolic
expression patterns between and within groups. Upregulated
differential metabolites are shown in red, while downregulated ones
are shown in blue. (D) Matchstick plot of differential metabolites.
The VIP values indicate the contribution of different differential
metabolites to the difference between the FAXDC2 overexpression and
empty vector control groups, where a higher value signifies greater
contribution and importance. The circle size represents the VIP
values, and the matchstick length represents the magnitude of the
difference. Red represents increased abundance, while blue
represents decreased abundance. FAXDC2, fatty acid hydroxylase
domain containing 2; OE, overexpression; EV, empty vector; VIP,
variable importance in projection; GDP, guanosine diphosphate;
DE_Meta, differential expression meta-analysis; DW, down; NoDiff,
no difference. |
Further analysis was conducted on the differential
metabolites after FAXDC2 overexpression based on their changes in
abundance, as depicted in a volcano plot (Fig. 3B). The metabolomics analysis
revealed that 527 differential metabolites were collectively
enriched, among which 71 exhibited significantly increased or
decreased abundance. The 71 differential metabolites are
illustrated in a heatmap (Fig.
3C).
A volcano plot of differential metabolites was
generated by comparing the contribution values of differential
metabolites between the FAXDC2 overexpression group and the empty
vector control group. Variable importance in projection (VIP)
values were calculated, which estimate the contribution or
importance of metabolites in the model (Fig. 3D). The top three differential
metabolites with increased abundance were pantetheine, thymidine
5′-diphosphate and GDP, with GDP having the highest VIP value.
These findings indicate that the differential metabolite GDP may
provide the greatest contribution to the differences between the
FAXDC2 overexpression group and the empty vector control group.
Overexpression of FAXDC2 leads to
increased GDP content in HepG2 cells
Several differential metabolites identified in the
untargeted metabolomics analysis were screened. These included GDP,
daidzein and 2-deoxyglucose-6-phosphate, with a focus on changes in
GDP levels. GDP plays an important role in cellular energy
metabolism and signal transduction. GTP is a key energy transfer
molecule, similar to ATP, which provides energy for various
biochemical reactions, including fatty acid synthesis and
degradation. In certain critical enzyme-catalyzed reactions, GDP is
converted to guanosine triphosphate (GTP), a process often
accompanied by the release or absorption of energy (31).
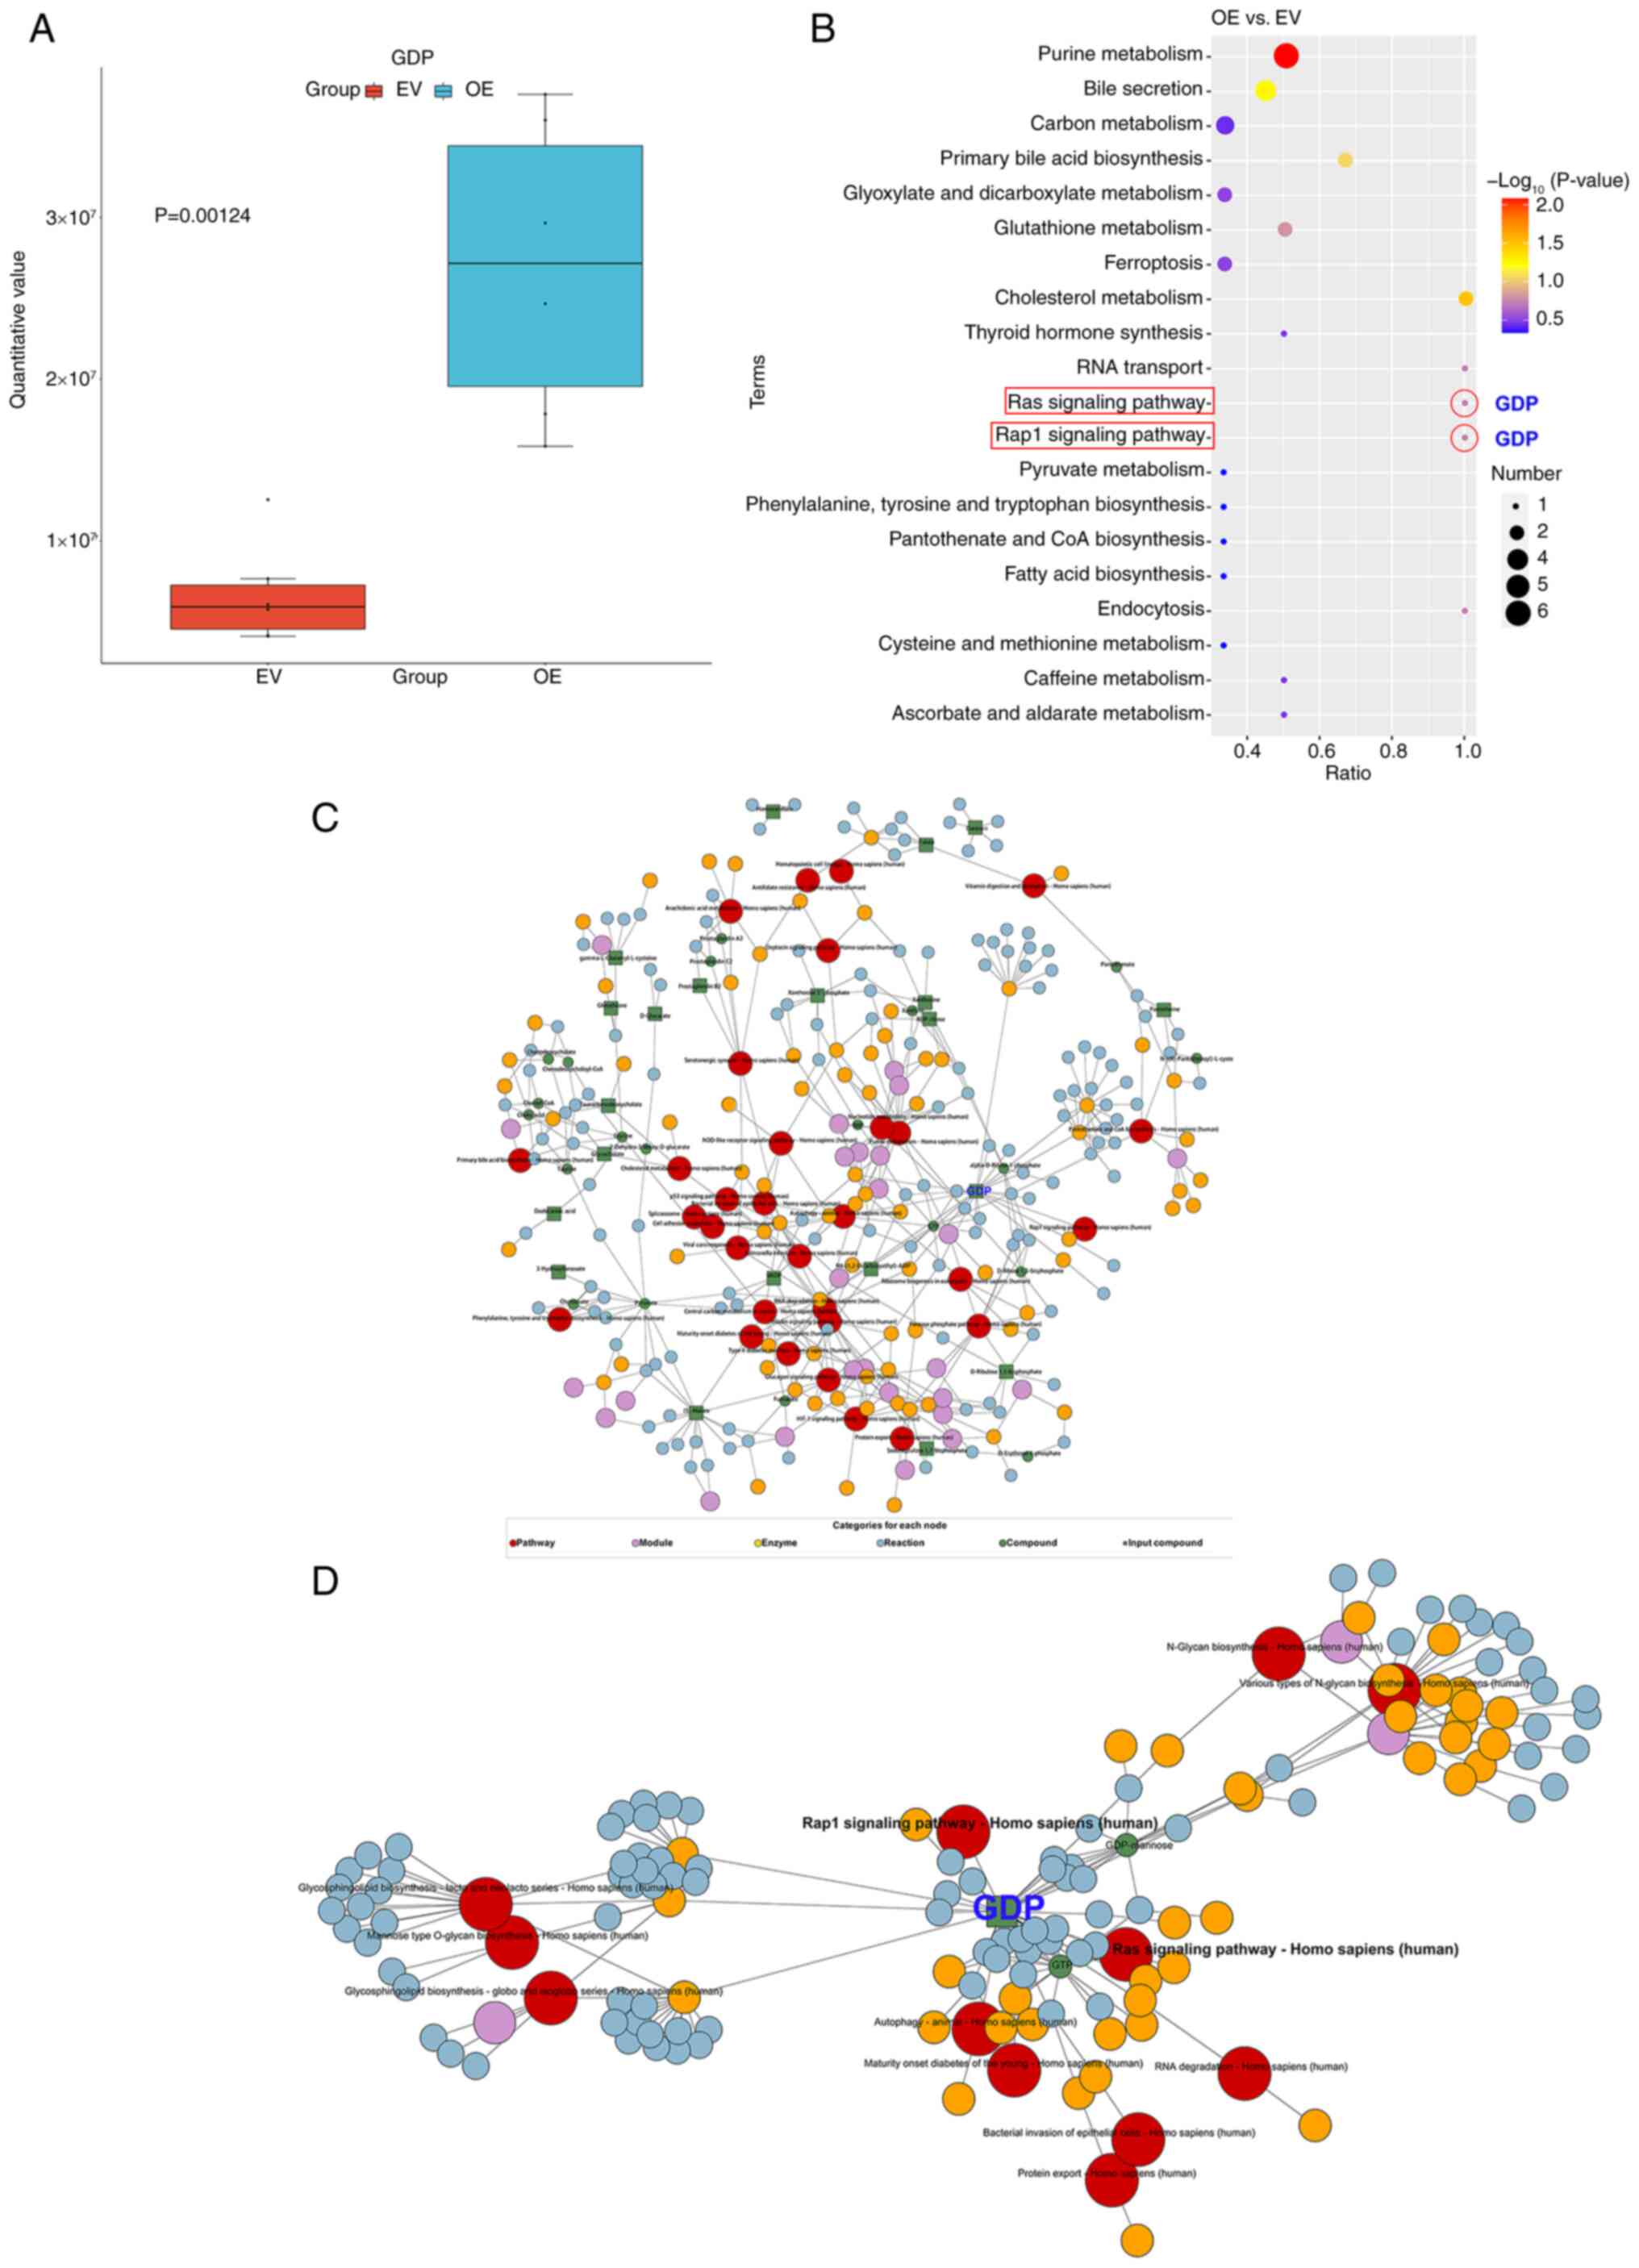
In HepG2 cells overexpressing FAXDC2, the GDP levels
were found to be higher than those in cells transfected with empty
vector (Fig. 4A). Additionally,
KEGG pathway enrichment analysis revealed that the differential
metabolites were most enriched in the ‘purine metabolism’ pathway.
It was also noted that GDP was the only differential metabolite
enriched in ‘Ras signaling pathway’ and ‘Rap1 signaling pathway’
(Fig. 4B).
A KEGG regulatory network diagram of the
differential metabolites was then generated (Fig. 4C), which indicated a particular
focus on GDP. Therefore, a KEGG regulatory network diagram specific
for GDP was generated (Fig. 4D). It
can be observed that GDP, as an input or known compound, may
regulate the Ras signaling pathway. Since Ras is a crucial
component of the MAPK/ERK signaling transduction pathway, changes
in Ras may impact this pathway. This demonstrates the regulatory
effect of FAXDC2 on the MAPK/ERK signaling transduction pathway,
consistent with our previous study (23).
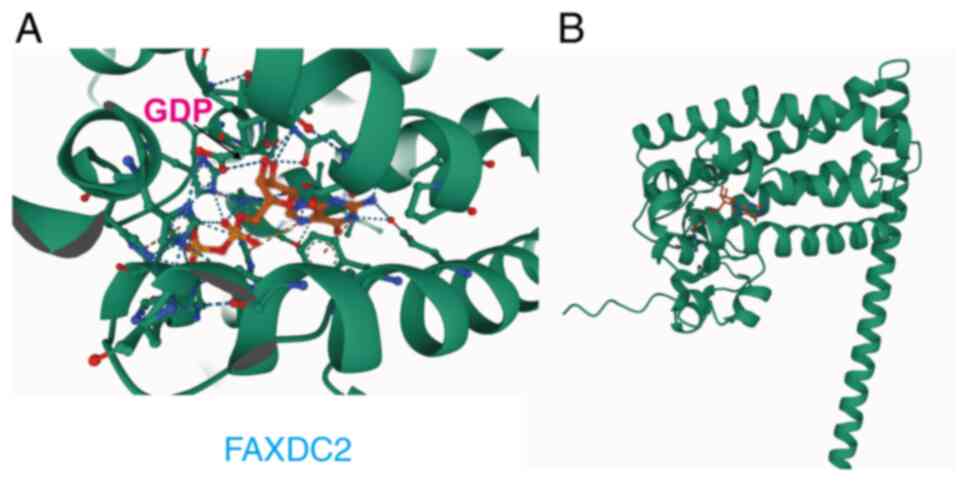
FAXDC2 interacts with GDP
Given the observation that the overexpression of
FAXDC2 elicits alterations in the GDP content of HepG2 cells at the
metabolic level, the advanced protein structure prediction tool,
AlphaFold3 (28), was employed to
model the three-dimensional structures of FAXDC2 and GDP (Fig. 5). This predicted a direct
interaction between FAXDC2 and GDP, thereby suggesting a potential
mechanistic link. Consequently, it was hypothesized that GDP may
mediate the inhibitory effect of FAXDC2 on HepG2 cells, which may
serve as a basis for understanding the molecular mechanisms
underlying this process.
GDP inhibits HepG2 cell
proliferation
Based on the findings of the metabolomics analysis
and the absence of direct reports on the inhibitory effects of GDP
on tumors in previous studies, the present study aimed to directly
validate the effects of GDP on the HepG2 cell line. The GDP
concentrations used were selected with reference to those used in
the study by Traut (32).
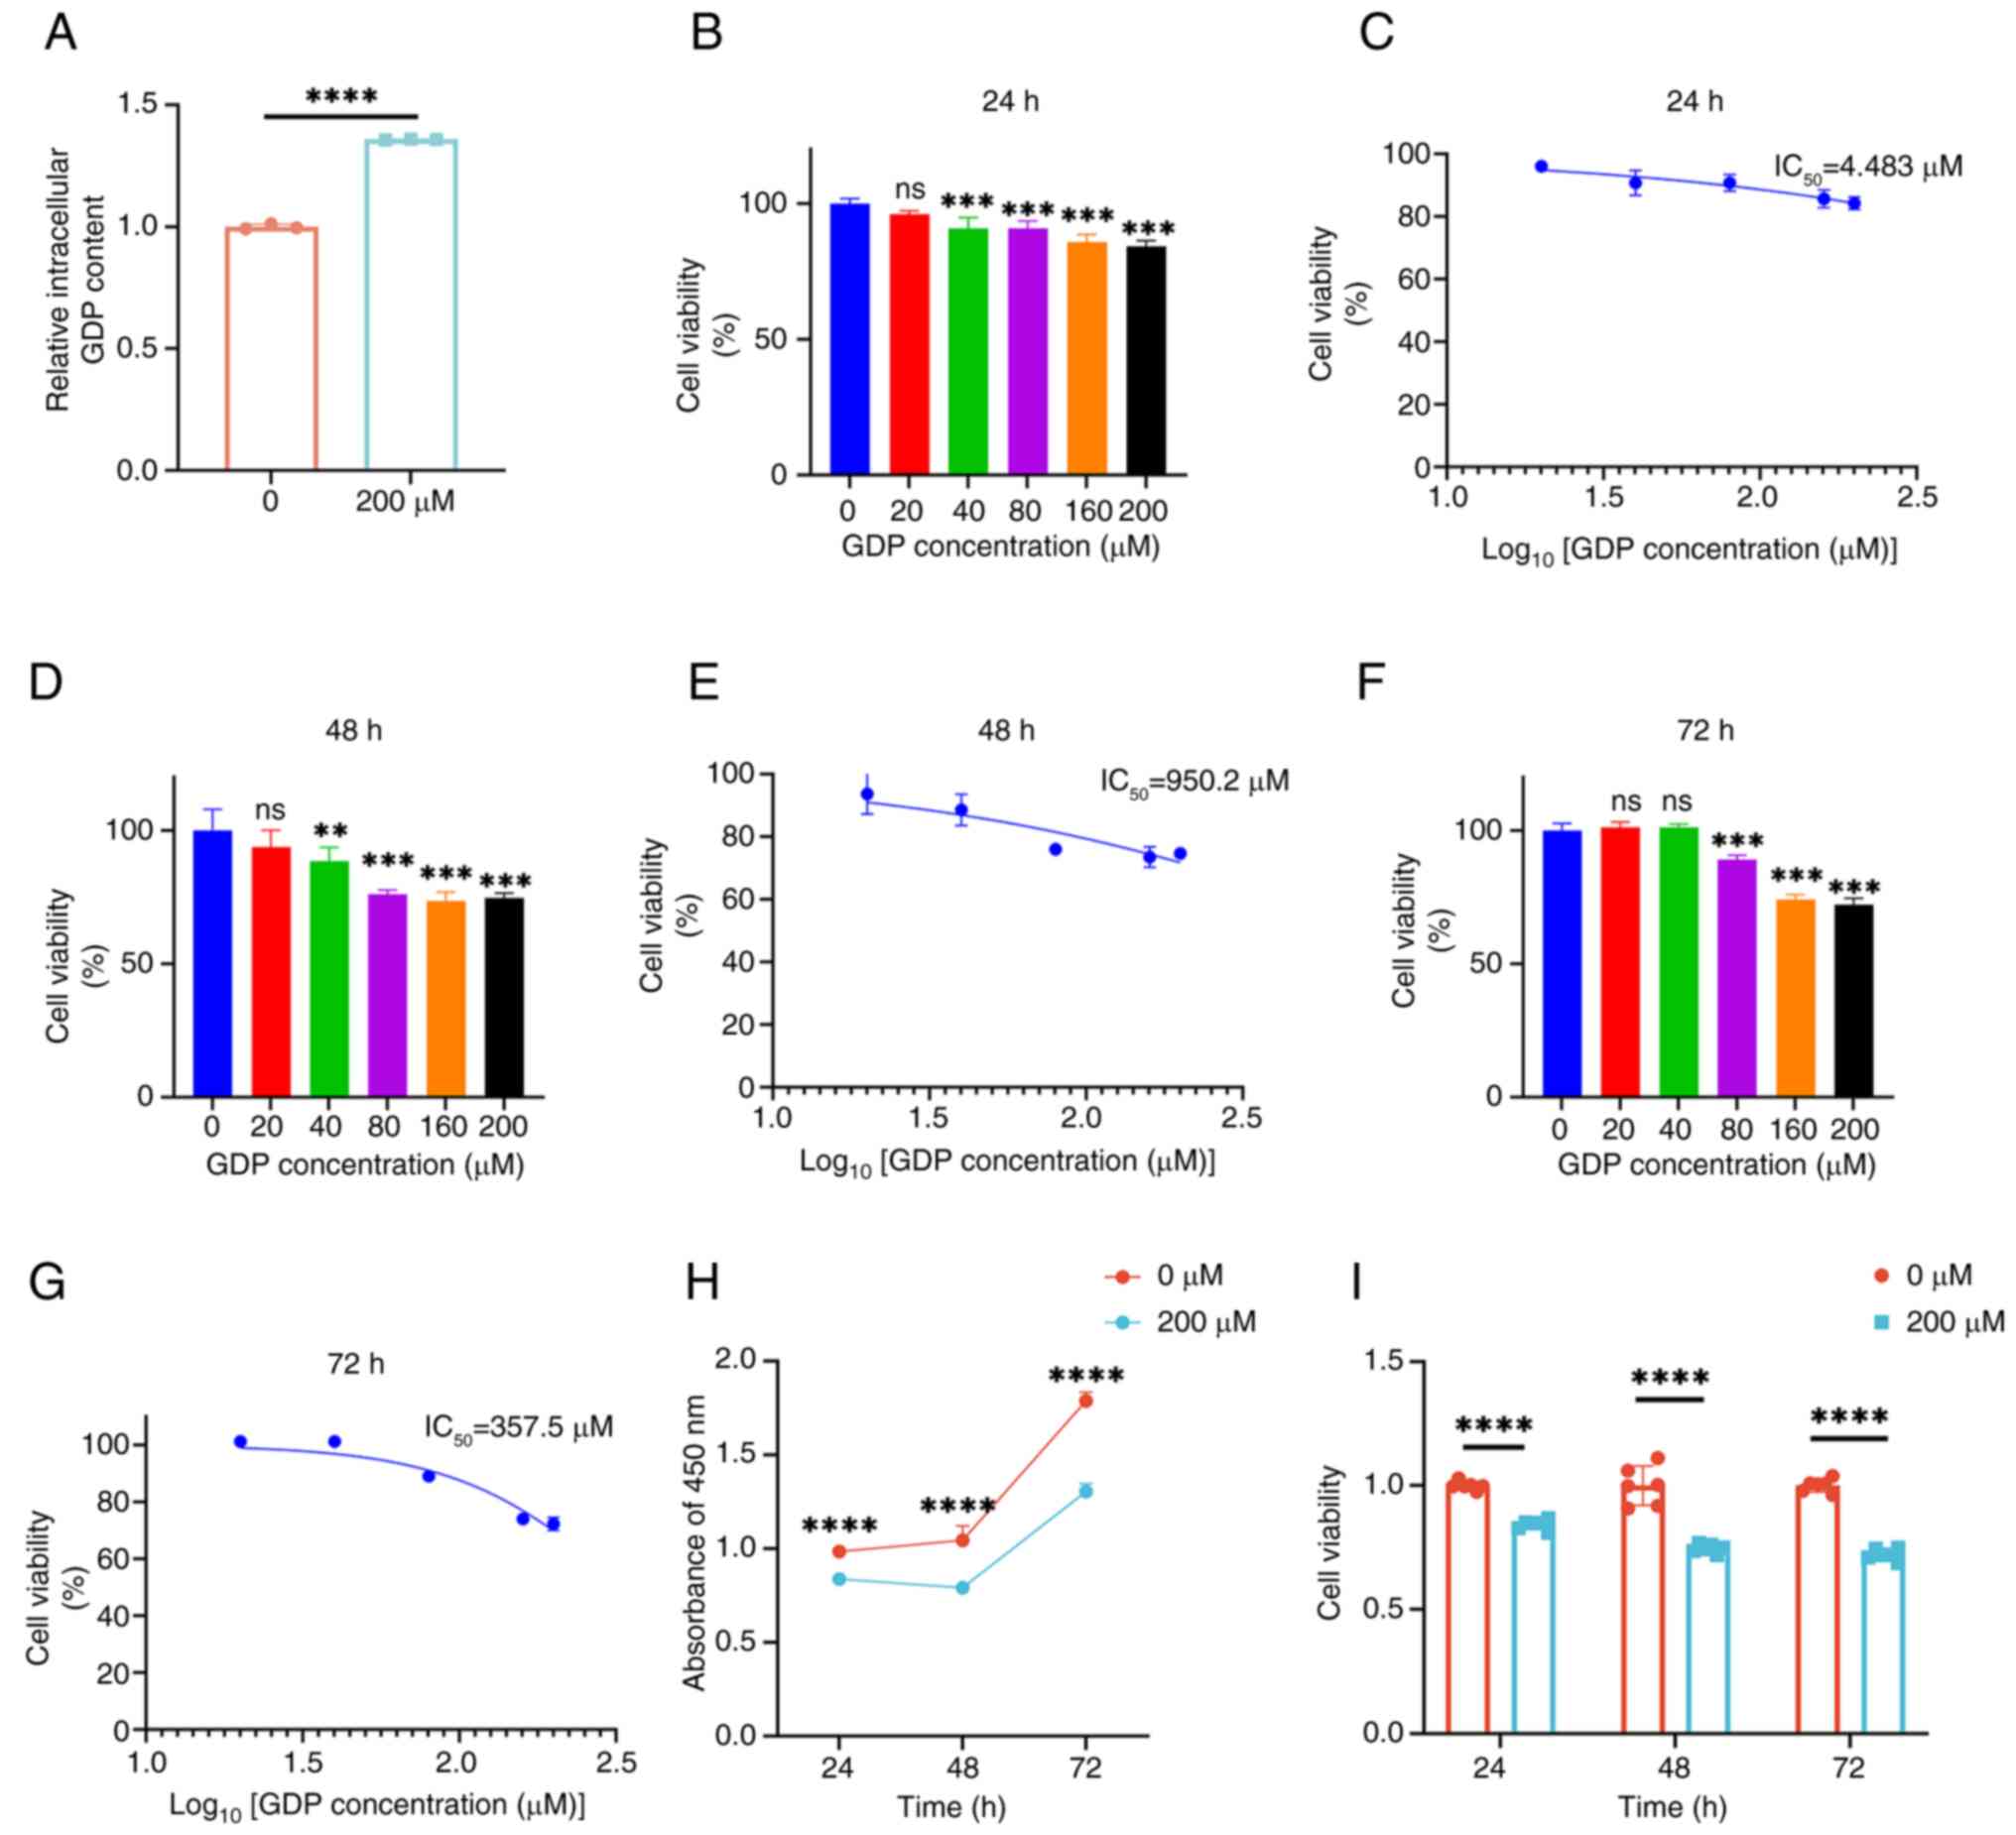
Initially, ELISA experiments were conducted to detect the GDP
content of HepG2 cells following treatment with 200 µM GDP
(Fig. 6A). It was observed that the
intracellular GDP content increased by ~35% after treatment with
200 µM GDP compared with that in cells without GDP treatment.
The proliferation of HepG2 cells was then evaluated
using the CCK-8 assay. The results indicated that a significant
reduction in the viability of HepG2 cells occurred following
treatment with 40–200 µM GDP compared with that in the control
group (Fig. 6). Moreover, the
inhibitory effect of GDP gradually intensified as its concentration
increased, suggesting a concentration-dependent effect of GDP on
the inhibition of HepG2 cell activity. Additionally, as shown in
Fig. 6B-G, the inhibitory effect of
GDP on HepG2 cells increased over time, compared with that in the
control group. Specifically, following GDP treatment, the
IC50 values decreased from 4,483 µM at 24 h to 950.2 µM
at 48 h, and further to 357.5 µM at 72 h.
A 200 µM concentration of GDP was selected for use
in subsequent experiments. The viability of HepG2 cells treated
with 200 µM GDP for 24, 48 and 72 h was measured, as shown in
Fig. 6H and I. The viability of
HepG2 cells was significantly decreased after treatment with 200 µM
GDP at each time point. These results indicate that GDP inhibits
the proliferation of HepG2 cells.
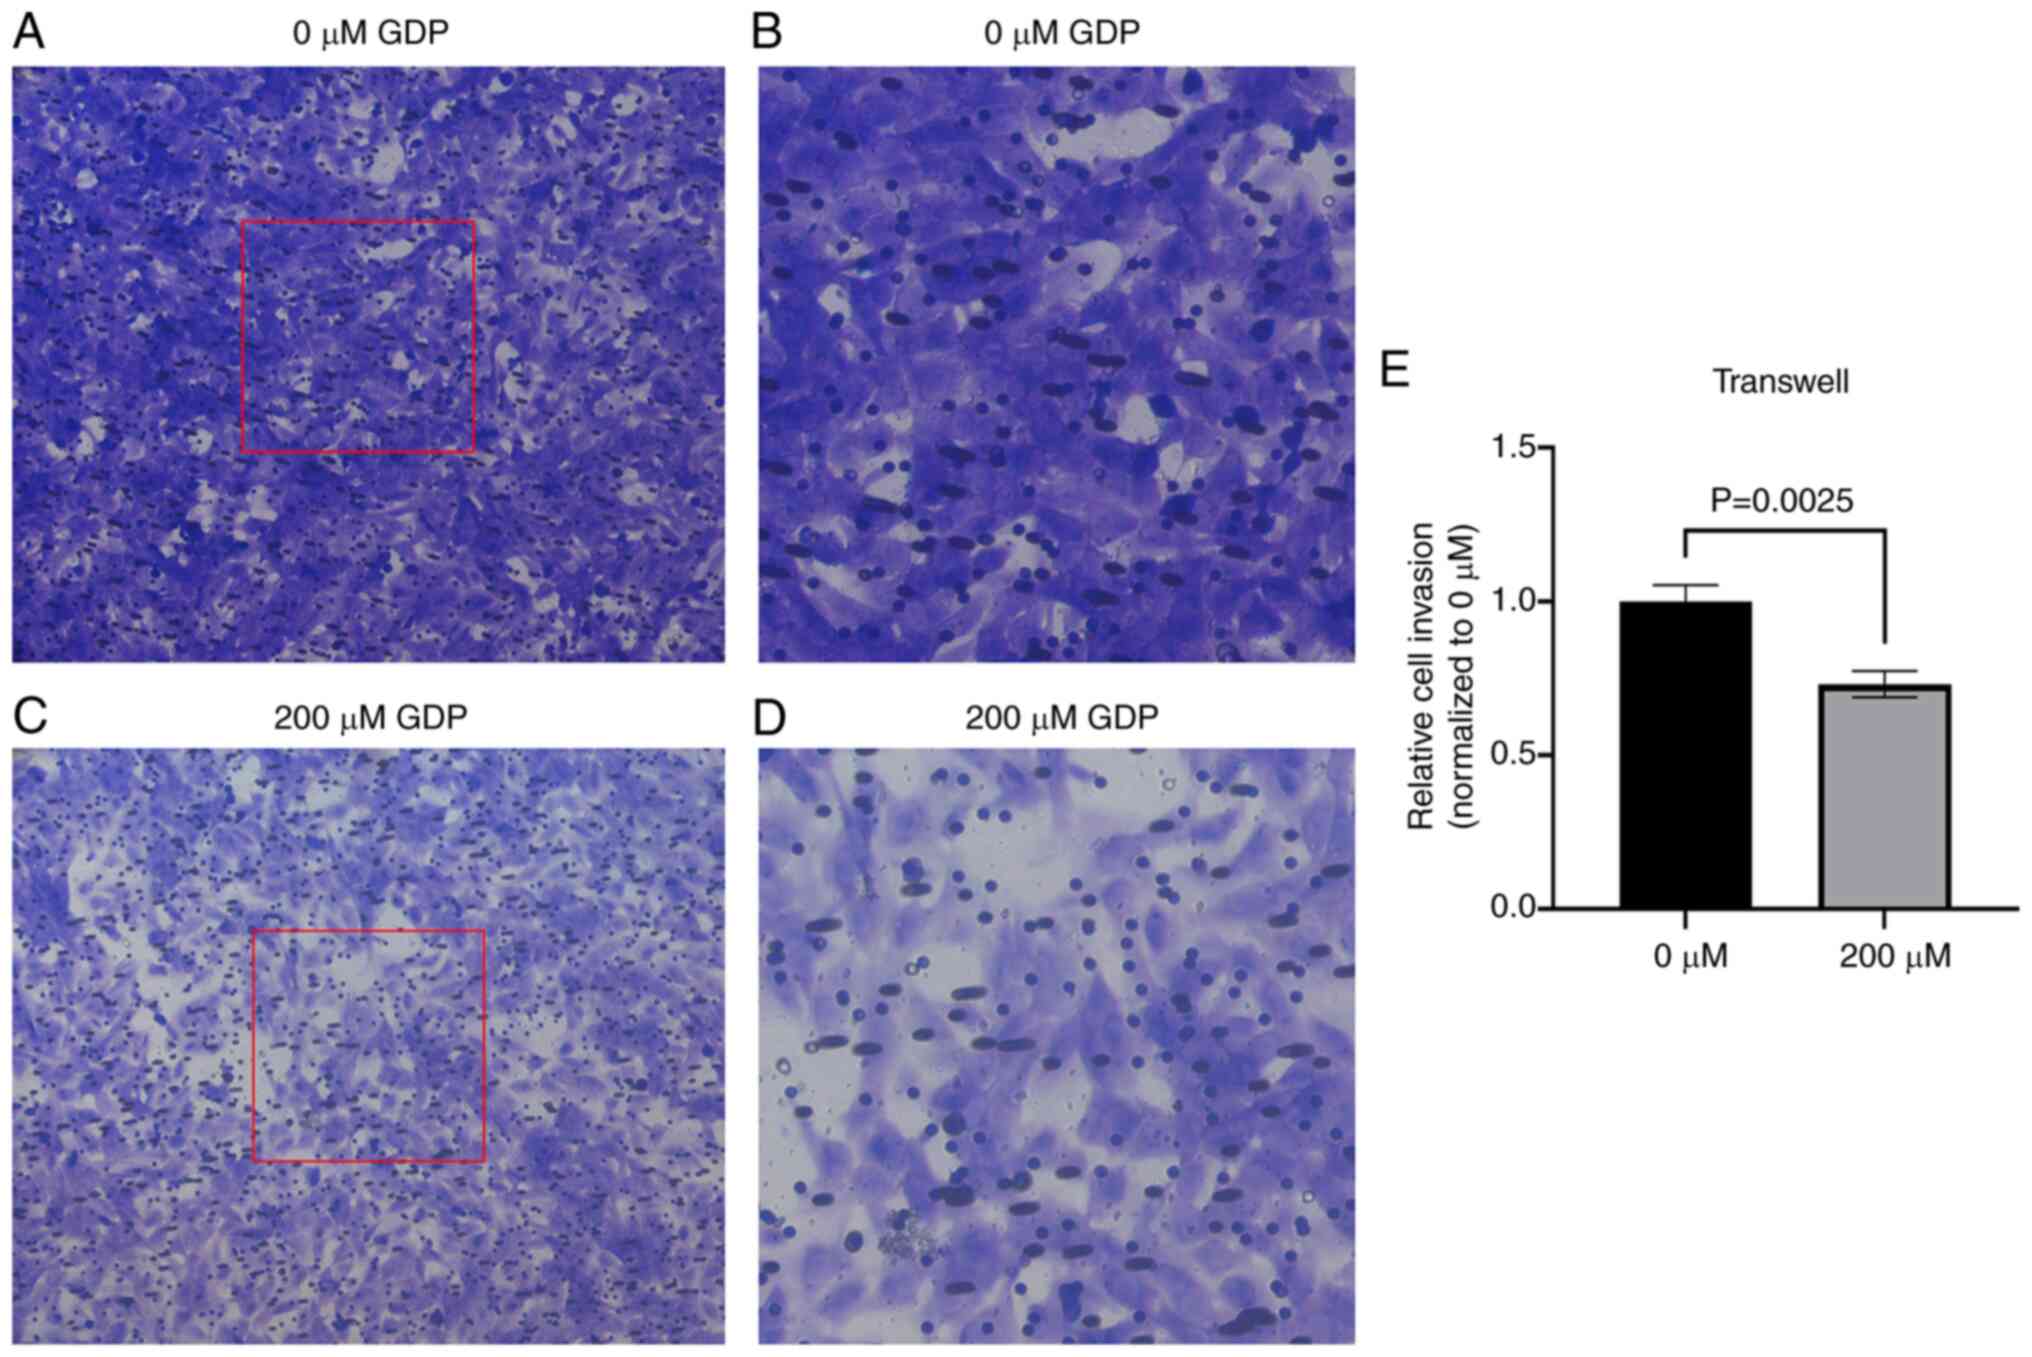
GDP inhibits HepG2 cell invasion
To comprehensively evaluate the inhibitory effects
of GDP on liver cancer, a Transwell assay was performed to assess
the invasive ability of HepG2 cells after treatment with 200 µM GDP
(Fig. 7). The number of HepG2 cells
passing through the Transwell membrane significantly decreased
following treatment with 200 µM GDP compared with that of untreated
cells, indicating a significant inhibition of the invasive ability
of HepG2 cells by GDP.
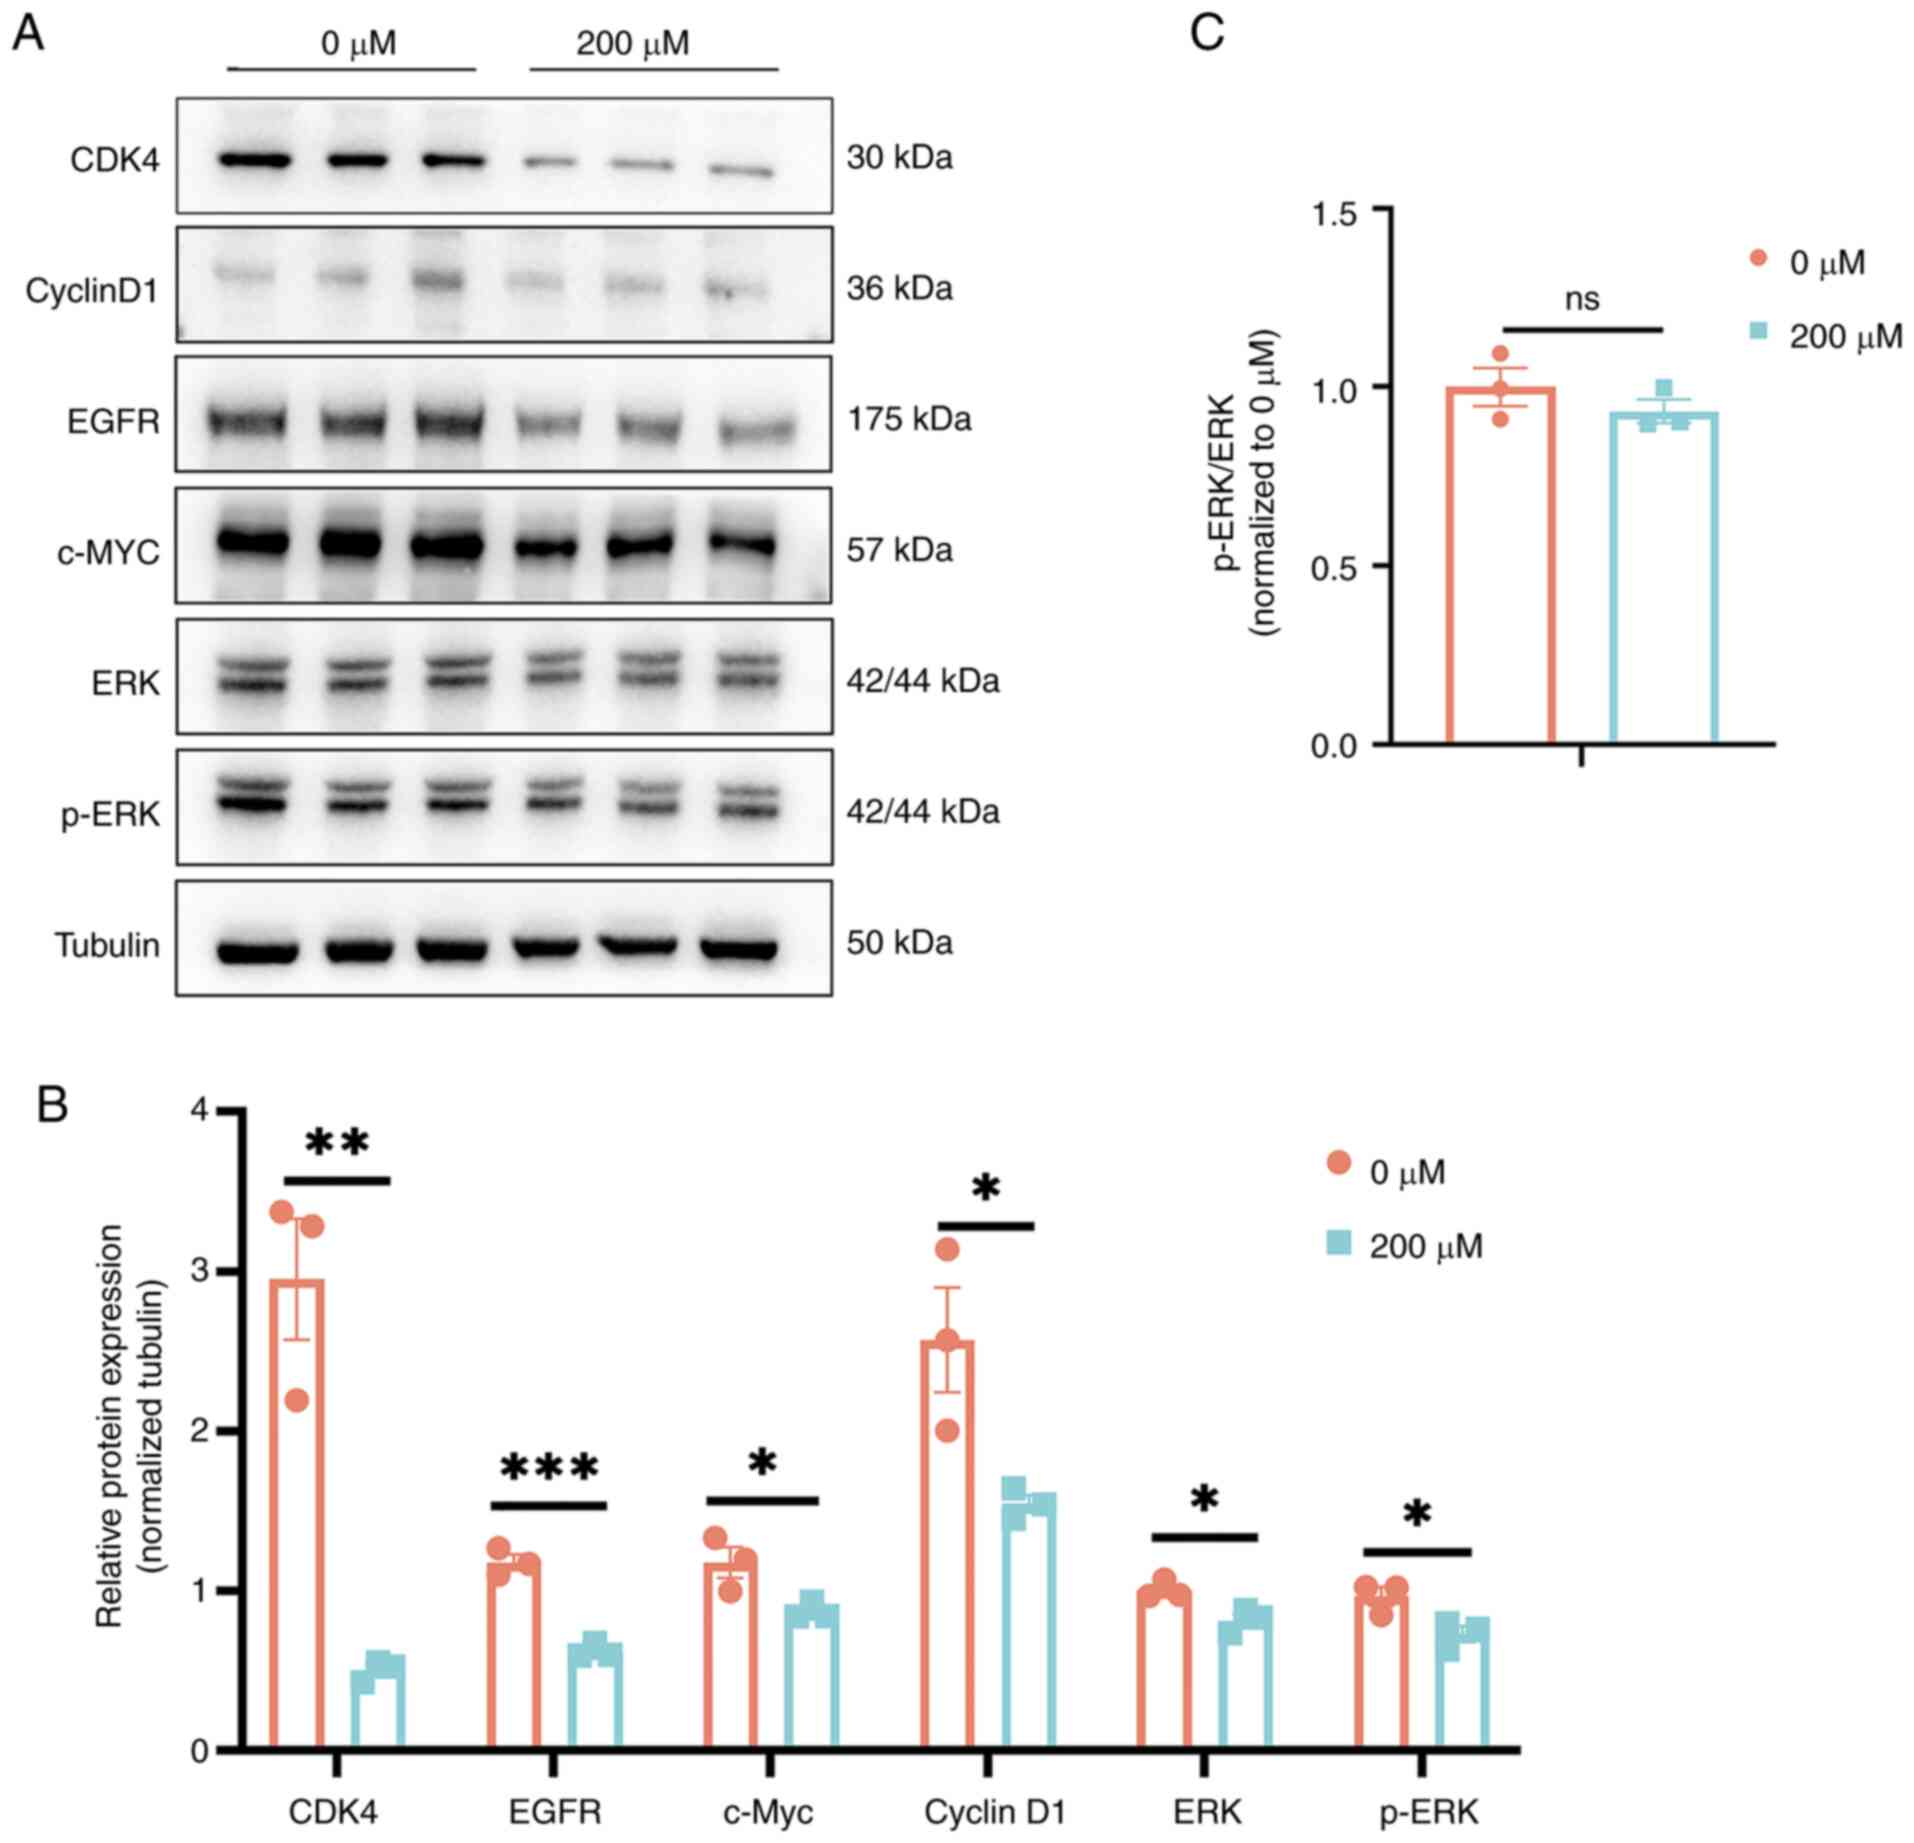
GDP inhibits MAPK/ERK signaling
To explore the impact of increased GDP levels on the
signaling pathways within HepG2 cells, guided by metabolomic
insights, key signaling molecules in the Ras/ERK pathway and
several proteins associated with cell proliferation were examined
via western blot analysis (Fig. 8).
The results demonstrated that after the treatment of HepG2 cells
with 200 µM GDP, the expression levels of ERK, EGFR, c-Myc and the
cell cycle-related proteins, CDK4 and cyclin D1, were all
significantly downregulated. These findings suggest that an
increase in GDP levels may inhibit the Ras/ERK signaling
pathway.
Discussion
Lipid metabolism is closely associated with the
occurrence and development of liver cancer (33). Our previous study indicated that
FAXDC2 is significantly downregulated in various types of cancer
tissues, including liver cancer, and its low expression is closely
associated with a poor prognosis in patients (23). Based on preliminary research
findings, combined with the metabolomics and experimental biology
analyses performed in the present study, it is proposed that: i)
FAXDC2 inhibits the progression of liver cancer by modulating GDP
concentration; and ii) GDP regulates HepG2 cell proliferation and
invasion via the MAPK/ERK pathway.
The present study identified GDP as a significantly
upregulated differential metabolite through metabolomics analysis
following FAXDC2 overexpression. GDP had the highest VIP value
among all differential metabolites, indicating that it made the
greatest contribution to the differences between the experimental
and control groups. Additionally, among the differentially enriched
metabolites in the KEGG pathways, GDP was the only differential
metabolite enriched in both the ‘Ras signaling pathway’ and ‘Rap1
signaling pathway’. Therefore, the present study further
investigated the impact of an elevated GDP concentration on the
Ras/ERK signaling pathway. Through western blot analysis, it was
observed that the increase in GDP content significantly inhibited
ERK expression. A potential explanation of the process by which
elevated intracellular concentrations of GDP induce changes in Ras
activity is protein succinylation, a modification that can be
influenced by the concentration of succinyl-CoA within mitochondria
(34). There may be a discrete
subcellular compartment where Ras activity is regulated by GDP
concentration, operating independently of the canonical mechanism
involving GTPase-activating protein (GAP) and guanine nucleotide
exchange factors. However, this hypothesis requires rigorous
empirical validation through ongoing and future investigations.
A common hallmark of tumor growth signaling mediated
by the Ras/Raf/MEK/ERK cascade within the MAPK/ERK pathway is the
sustained activation of ERK1/2 (35). Ras and Raf are known to be
oncogenes, and Ras/Raf/MEK/ERK signaling is activated in ~50% of
patients with early-stage liver cancer and nearly all patients with
late-stage liver cancer (36). In
addition, it has been shown that specific inhibition of MEK1 blocks
ERK1/2 phosphorylation, and dose-dependently inhibits the
proliferation of liver cancer cells (37). The Ras isoforms H-Ras, K-Ras and
N-Ras regulate cell proliferation, survival and differentiation
(38), by acting as a critical
component in numerous signal transduction processes and functioning
as a ‘switch’. When activated, the Raf serine/threonine kinases are
recruited to the plasma membrane, triggering the activation of the
ERK signaling pathway and other targets (39). In the active GTP-bound state, Ras
proteins undergo conformational changes, which allow them to bind
to effector proteins and contribute to signal transduction
(40). Intrinsic Ras GTPases
convert Ras-GTP to Ras-GDP by hydrolysis with the assistance of
GAPs; this renders Ras inactive and stops signal transduction
(40).
A number of studies have shown that GDP, as a
metabolite of GTP, competes with GTP for binding to the small G
protein Ras, thereby facilitating the interconversion of Ras
between its active (Ras-GTP) and inactive (Ras-GDP) states
(41–43). In its inactive state, Ras/Raf/ERK
signal transduction is blocked, which leads to a reduction in cell
proliferation capacity. Studies have shown that even when GPCRs are
not catalytically active, tumors can be promoted by the
acceleration of GDP dissociation from the receptors (44–46).
Despite this, few studies have reported on the role of GDP in
cancer cells.
A comprehensive investigation conducted by Traut
(32) in 1994 meticulously
elucidated the distribution patterns of GDP in diverse human
cellular populations, encompassing lymphocytes, monocytes,
neutrophils, platelets, eosinophils and erythrocytes, in addition
to its presence in rat liver tissue and hepatocellular carcinoma.
Leveraging their findings as a foundation, the application of a
range of GDP concentrations to HepG2 cells was performed in the
present study, with the subsequent analysis of cell viability by
CCK-8 assay. The analysis revealed that 200 µM GDP had a pronounced
inhibitory effect on HepG2 cells. Consequently, a 200 µM GDP
concentration was selected as the treatment standard for HepG2
cells in the present study. Overall, the results of the present
study indicate that overexpression of FAXDC2 leads to an increase
in GDP levels, which may inhibit Ras activity, thereby suppressing
Ras/Raf/ERK signal transduction (Fig.
9). This was confirmed by western blotting results, which are
consistent with those in our previous study, which concluded that
FAXDC2 inhibits ERK phosphorylation, thereby suppressing the
occurrence and development of liver cancer (23). AlphaFold3 predicted a potential
direct interaction between FAXDC2 and GDP, thus indicating the
importance of investigating whether increased GDP concentrations
influence the enzymatic activity of FAXDC2. Concerning the
mechanism by which FAXDC2 potentially regulates GDP levels, the
non-targeted metabolomics profiling revealed insignificant or
undetectable changes in the levels of GDP-related metabolites, such
as guanosine monophosphate, guanosine triphosphate, deoxy-GDP and
guanosine tetraphosphate. Therefore, it is speculated that FAXDC2
adjusts intracellular GDP levels via an obscure and as yet
uncharacterized pathway. To comprehensively determine the specific
mechanisms of this pathway, an in-depth investigation will be
performed in a future study with the aim of uncovering the
underlying principles.
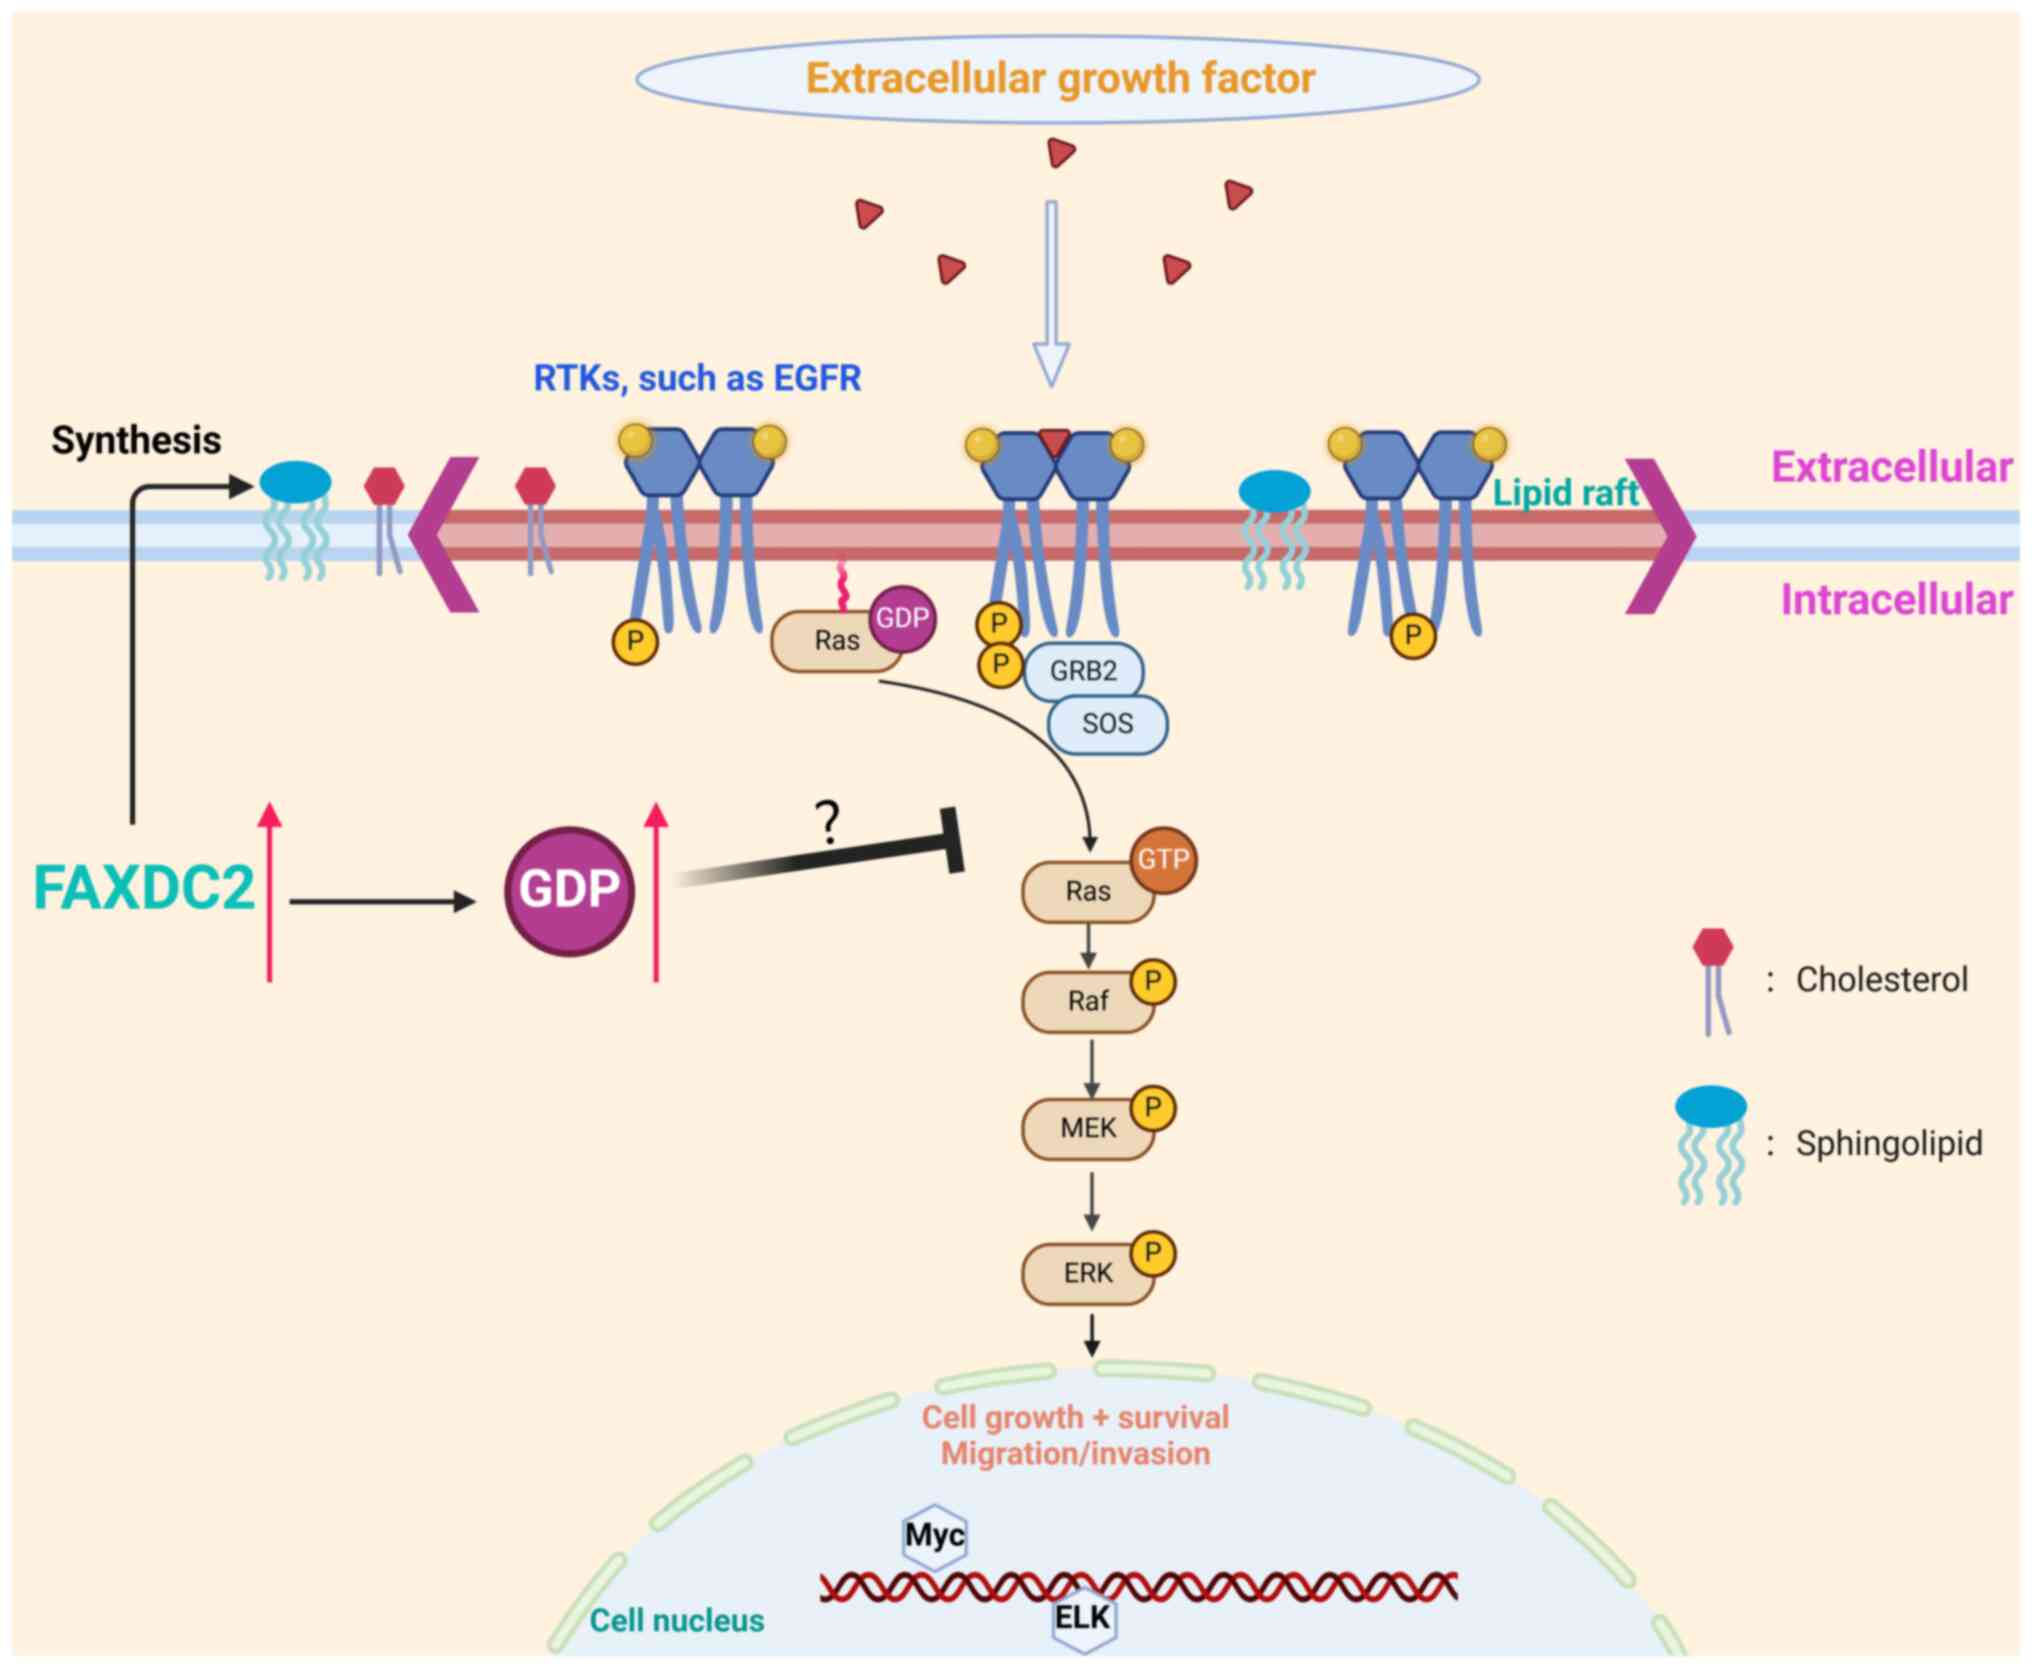 | Figure 9.Diagram of the potential role of GDP
in HepG2 cells. It is speculated that GDP competes with GTP for
binding to Ras, leaving Ras in an inactivated state, thereby
inhibiting downstream gene transduction. GDP, guanosine
diphosphate; GTP, guanosine triphosphate; FAXCD2, fatty acid
hydroxylase domain containing 2; RTKs, receptor tyrosine kinases;
EGFR, epidermal growth factor receptor; GRB2, growth factor
receptor-bound protein 2; SOS, son of sevenless; ERK, extracellular
signal-regulated kinase; ELK, Ets-like; p, phosphorylation. |
The direct treatment of HepG2 cells with GDP was
observed to inhibit the proliferation and invasion of the cells, as
determined by CCK-8, Transwell and western blotting assays. The
results also suggest that GDP inhibits cancer cell growth in a
concentration-dependent manner. The direct inhibition of small
molecules has great potential in the treatment of diseases.
Research has shown that the administration of nicotinamide
mononucleotide (NMN), which can directly regulate disease, for up
to 12 months can effectively combat aging without significant
toxicity, severe side effects or increased mortality rates,
indicating its long-term safety (47). Similarly, another study demonstrated
that NMN has anti-aging effects on mice (48). In addition, the metabolically active
small molecule resveratrol can be directly used to prevent a
variety of diseases, including obesity (49), aging (50,51)
and neurodegenerative diseases (52). Notably, a previous study
demonstrated that an intraperitoneal injection of resveratrol
ameliorated the oxidative stress-induced aging damage of oocytes
after ovulation in middle-aged mice (53). However, there are few reports on the
direct inhibition of liver cancer via the metabolism of small
molecule substances. As a metabolite involved in tumor metabolic
reprogramming, GDP is likely to play an inhibitory role in the
process of tumor occurrence and development. Moreover, as it is a
substance produced metabolically in the body, GDP is unlikely to
cause harm during its anticancer action. Furthermore, in the
present investigation of the GDP content of HepG2 cells, it was
noted that the intracellular GDP concentration in HepG2 cells
treated with 200 µM GDP increased by only 35% compared with that in
the untreated control group. This finding suggests that GDP might
not only enter cells to perform its functions but could also
interact with receptors on the cell membrane to exert its effects.
This suggestion warrants further exploration and elucidation in
subsequent studies.
It is imperative to acknowledge that, despite the
innovative nature of the present study, it is not without
limitations. Notably, it did not directly demonstrate that GDP
mediates the inhibitory effects of FAXDC2 on HepG2 cells. Moreover,
exploration of the underlying mechanisms remains relatively
superficial, necessitating a more detailed investigation in
subsequent studies. Furthermore, given that the HepG2 cell line
originates from hepatoblastoma, it is not typically considered a
representative model of a hepatocellular carcinoma cell line.
Therefore, the scope of the validation process will be broadened to
encompass a greater diversity of liver cancer cells in future
studies, with the objective of deriving more detailed conclusions.
In addition, the effects of GDP were only examined in cells, and no
in vivo experiments were performed using animals to further
evaluate its function within a biological context. In addition,
whether there is any difference in intracellular GDP concentration
in humans between physiological conditions and cancerous states was
not detected. In follow-up studies, the difference in GDP
concentration between cancer tissues and adjacent tissues in liver
cancer patients will be analyzed, to more accurately evaluate the
potential of GDP as a small molecule inhibitor. These limitations
will serve as pivotal targets for future studies.
In summary, to the best of our knowledge, the
present study is the first to demonstrate that GDP can directly
inhibit the proliferation and invasion of HepG2 cells. This study
provides experimental evidence that may be relevant to the
development of liver cancer and may aid in the search for new
diagnostic and intervention methods.
Acknowledgements
Not applicable.
Funding
This study was supported in part by grants from the National
Natural Science Foundation of China (grant nos. 81970324 and
81974019), Shanghai Key Laboratory of Regulatory Biology, Institute
of Biomedical Sciences, East China Normal University, National Key
Research and Development Program of China (grant no.
2018YFA0108700), Guangzhou Science and Technology Plan Project
(grant no. 202201000006) and Guangdong Provincial Special Support
Program for Prominent Talents (grant no. 2021JC06Y656).
Availability of data and materials
The data generated in the present study may be
requested from the corresponding author. The metabolomics data
generated in the present study may be found in the National Omics
Data Encyclopedia (NODE) under accession number OEP00005871 or at
the following URL: https://www.biosino.org/node/browse?keyword=OEP00005871.
Authors' contributions
Conceptualization was performed by ZP, WY, YW and
XF. Methodology was the responsibility of XW and FL. Data analysis
was performed by SX, PZ, YL and HW. Data validation was performed
by ZhoJ, SL and YH. Formal analysis was conducted by ZP, ML, ZhiJ,
YC and YS. Research background investigations (including
researching the experimental scheme) were carried out by ZP and ML.
Resources were obtained by FL, YW and YS. Data was curated by ZhiJ,
YS and YC. The original draft of the manuscript was prepared by ZP,
and reviewed and edited by XF, PZ, YL and XW. Language editing was
performed by PZ, YL, ZhiJ, ML and FL. Data visualization (for
mapping and typesetting the obtained data) was performed by YW, YC
and WY. Supervision was by YL, HW and FL, project administration
was by WY, SX, HW and FL, and funding was acquired by XF and PZ. ZP
and XF confirm the authenticity of all the raw data. All authors
read and approved the final version of the manuscript.
Ethics approval and consent to
participate
Not applicable.
Patient consent for publication
Not applicable.
Competing interests
The authors declare that they have no competing
interests.
References
|
1
|
Siegel RL, Miller KD, Wagle NS and Jemal
A: Cancer statistics, 2023. CA Cancer J Clin. 73:17–48. 2023.
View Article : Google Scholar : PubMed/NCBI
|
|
2
|
Gao S, Gang J, Yu M, Xin G and Tan H:
Computational analysis for identification of early diagnostic
biomarkers and prognostic biomarkers of liver cancer based on GEO
and TCGA databases and studies on pathways and biological functions
affecting the survival time of liver cancer. BMC cancer.
21:7912021. View Article : Google Scholar : PubMed/NCBI
|
|
3
|
Yang WS, Zeng XF, Liu ZN, Zhao QH, Tan YT,
Gao J, Li HL and Xiang YB: Diet and liver cancer risk: A narrative
review of epidemiological evidence. Br J Nutr. 124:330–340. 2020.
View Article : Google Scholar : PubMed/NCBI
|
|
4
|
Anwanwan D, Singh SK, Singh S, Saikam V
and Singh R: Challenges in liver cancer and possible treatment
approaches. Biochim Biophys Acta Rev Cancer. 1873:1883142020.
View Article : Google Scholar : PubMed/NCBI
|
|
5
|
Li S, Yin S, Ding H, Shao Y, Zhou S, Pu W,
Han L, Wang T and Yu H: Polyphenols as potential metabolism
mechanisms regulators in liver protection and liver cancer
prevention. Cell Prolif. 56:e133462023. View Article : Google Scholar : PubMed/NCBI
|
|
6
|
Raoul JL, Forner A, Bolondi L, Cheung TT,
Kloeckner R and de Baere T: Updated use of TACE for hepatocellular
carcinoma treatment: How and when to use it based on clinical
evidence. Cancer Treat Rev. 72:28–36. 2019. View Article : Google Scholar : PubMed/NCBI
|
|
7
|
Llovet JM, Kelley RK, Villanueva A, Singal
AG, Pikarsky E, Roayaie S, Lencioni R, Koike K, Zucman-Rossi J and
Finn RS: Hepatocellular carcinoma. Nat Rev Dis Primers. 7:62021.
View Article : Google Scholar : PubMed/NCBI
|
|
8
|
Luo X, Cheng C, Tan Z, Li N, Tang M, Yang
L and Cao Y: Emerging roles of lipid metabolism in cancer
metastasis. Mol Cancer. 16:762017. View Article : Google Scholar : PubMed/NCBI
|
|
9
|
Yi M, Li J, Chen S, Cai J, Ban Y, Peng Q,
Zhou Y, Zeng Z, Peng S, Li X, et al: Emerging role of lipid
metabolism alterations in cancer stem cells. J Exp Clin Cancer Res.
37:1182018. View Article : Google Scholar : PubMed/NCBI
|
|
10
|
Medes G, Thomas A and Weinhouse S:
Metabolism of neoplastic tissue. IV. A study of lipid synthesis in
neoplastic tissue slices in vitro. Cancer Res. 13:27–29.
1953.PubMed/NCBI
|
|
11
|
Ookhtens M, Kannan R, Lyon I and Baker N:
Liver and adipose tissue contributions to newly formed fatty acids
in an ascites tumor. Am J Physiol. 247:R146–R153. 1984.PubMed/NCBI
|
|
12
|
Yang H, Deng Q, Ni T, Liu Y, Lu L, Dai H,
Wang H and Yang W: Targeted Inhibition of LPL/FABP4/CPT1 fatty acid
metabolic axis can effectively prevent the progression of
nonalcoholic steatohepatitis to liver cancer. Int J Biol Sci.
17:4207–4222. 2021. View Article : Google Scholar : PubMed/NCBI
|
|
13
|
Wu D, Yang Y, Hou Y, Zhao Z, Liang N, Yuan
P, Yang T, Xing J and Li J: Increased mitochondrial fission drives
the reprogramming of fatty acid metabolism in hepatocellular
carcinoma cells through suppression of Sirtuin 1. Cancer Commun
(Lond). 42:37–55. 2022. View Article : Google Scholar : PubMed/NCBI
|
|
14
|
Wang W, Bai L, Li W and Cui J: The lipid
metabolic landscape of cancers and new therapeutic perspectives.
Front Oncol. 10:6051542020. View Article : Google Scholar : PubMed/NCBI
|
|
15
|
Beloribi-Djefaflia S, Vasseur S and
Guillaumond F: Lipid metabolic reprogramming in cancer cells.
Oncogenesis. 5:e1892016. View Article : Google Scholar : PubMed/NCBI
|
|
16
|
Du D, Liu C, Qin M, Zhang X, Xi T, Yuan S,
Hao H and Xiong J: Metabolic dysregulation and emerging
therapeutical targets for hepatocellular carcinoma. Acta Pharm Sin
B. 12:558–580. 2022. View Article : Google Scholar : PubMed/NCBI
|
|
17
|
Sun Y, Liu WZ, Liu T, Feng X, Yang N and
Zhou HF: Signaling pathway of MAPK/ERK in cell proliferation,
differentiation, migration, senescence and apoptosis. J Recept
Signal Transduct Res. 35:600–604. 2015. View Article : Google Scholar : PubMed/NCBI
|
|
18
|
Delire B and Stärkel P: The Ras/MAPK
pathway and hepatocarcinoma: Pathogenesis and therapeutic
implications. Eur J Clin Invest. 45:609–623. 2015. View Article : Google Scholar : PubMed/NCBI
|
|
19
|
Dimri M and Satyanarayana A: Molecular
signaling pathways and therapeutic targets in hepatocellular
carcinoma. Cancers (Basel). 12:4912020. View Article : Google Scholar : PubMed/NCBI
|
|
20
|
Peng Y, Song Y and Wang H: Systematic
elucidation of the aneuploidy landscape and identification of
aneuploidy driver genes in prostate cancer. Front Cell Dev Biol.
9:7234662021. View Article : Google Scholar : PubMed/NCBI
|
|
21
|
Zhang P, Ma K, Ke X, Liu L, Li Y, Liu Y
and Wang Y: Development and validation of a Five-RNA-Based
signature and identification of candidate drugs for neuroblastoma.
Front Genet. 12:6856462021. View Article : Google Scholar : PubMed/NCBI
|
|
22
|
Jin Q, Ren Y, Wang M, Suraneni PK, Li D,
Crispino JD, Fan J and Huang Z: Novel function of FAXDC2 in
megakaryopoiesis. Blood Cancer J. 6:e4782016. View Article : Google Scholar : PubMed/NCBI
|
|
23
|
Peng Z, Xu S, Zhang Q, Yang X, Yuan W,
Wang Y, Li Y, Zhu P, Wu X, Jiang Z, et al: FAXDC2 inhibits the
proliferation and invasion of human liver cancer HepG2 cells. Exp
Ther Med. 27:272024. View Article : Google Scholar : PubMed/NCBI
|
|
24
|
Livak KJ and Schmittgen TD: Analysis of
relative gene expression data using real-time quantitative PCR and
the 2(−Delta Delta C(T)) method. Methods. 25:402–408. 2001.
View Article : Google Scholar : PubMed/NCBI
|
|
25
|
Rao G, Sui J and Zhang J: Metabolomics
reveals significant variations in metabolites and correlations
regarding the maturation of walnuts (Juglans regia L.). Biol Open.
5:829–836. 2016. View Article : Google Scholar : PubMed/NCBI
|
|
26
|
Boulesteix AL and Strimmer K: Partial
least squares: A versatile tool for the analysis of
high-dimensional genomic data. Brief Bioinform. 8:32–44. 2007.
View Article : Google Scholar : PubMed/NCBI
|
|
27
|
Wen B, Mei Z, Zeng C and Liu S: metaX: A
flexible and comprehensive software for processing metabolomics
data. BMC Bioinformatics. 18:1832017. View Article : Google Scholar : PubMed/NCBI
|
|
28
|
Abramson J, Adler J, Dunger J, Evans R,
Green T, Pritzel A, Ronneberger O, Willmore L, Ballard AJ, Bambrick
J, et al: Accurate structure prediction of biomolecular
interactions with AlphaFold 3. Nature. 630:493–500. 2024.
View Article : Google Scholar : PubMed/NCBI
|
|
29
|
Wu M, Zhao Y, Tao M, Fu M, Wang Y, Liu Q,
Lu Z and Guo J: Malate-based biodegradable scaffolds activate
cellular energetic metabolism for accelerated wound healing. ACS
Appl Mater Interfaces. 15:50836–50853. 2023. View Article : Google Scholar : PubMed/NCBI
|
|
30
|
Adeva-Andany MM, Pérez-Felpete N,
Fernández-Fernández C, Donapetry-García C and Pazos-García C: Liver
glucose metabolism in humans. Biosci Rep. 36:e004162016. View Article : Google Scholar : PubMed/NCBI
|
|
31
|
Vetter IR and Wittinghofer A: The guanine
nucleotide-binding switch in three dimensions. Science.
294:1299–1304. 2001. View Article : Google Scholar : PubMed/NCBI
|
|
32
|
Traut TW: Physiological concentrations of
purines and pyrimidines. Mol Cell Biochem. 140:1–22. 1994.
View Article : Google Scholar : PubMed/NCBI
|
|
33
|
Ni T, He Z, Dai Y, Yao J, Guo Q and Wei L:
Oroxylin A suppresses the development and growth of colorectal
cancer through reprogram of HIF1α-modulated fatty acid metabolism.
Cell Death Dis. 8:e28652017. View Article : Google Scholar : PubMed/NCBI
|
|
34
|
Ali HR, Michel CR, Lin YH, McKinsey TA,
Jeong MY, Ambardekar AV, Cleveland JC, Reisdorph R, Reisdorph N,
Woulfe KC and Fritz KS: Defining decreased protein succinylation of
failing human cardiac myofibrils in ischemic cardiomyopathy. J Mol
Cell Cardiol. 138:304–317. 2020. View Article : Google Scholar : PubMed/NCBI
|
|
35
|
Cook SJ, Stuart K, Gilley R and Sale MJ:
Control of cell death and mitochondrial fission by ERK1/2 MAP
kinase signalling. FEBS J. 284:4177–4195. 2017. View Article : Google Scholar : PubMed/NCBI
|
|
36
|
Llovet JM, Villanueva A, Lachenmayer A and
Finn RS: Advances in targeted therapies for hepatocellular
carcinoma in the genomic era. Nat Rev Clin Oncol. 12:408–424. 2015.
View Article : Google Scholar : PubMed/NCBI
|
|
37
|
Wiesenauer CA, Yip-Schneider MT, Wang Y
and Schmidt CM: Multiple anticancer effects of blocking MEK-ERK
signaling in hepatocellular carcinoma. J Am Coll Surg. 198:410–421.
2004. View Article : Google Scholar : PubMed/NCBI
|
|
38
|
Yang J, Pan WH, Clawson GA and Richmond A:
Systemic targeting inhibitor of kappaB kinase inhibits melanoma
tumor growth. Cancer Res. 67:3127–3134. 2007. View Article : Google Scholar : PubMed/NCBI
|
|
39
|
Roy S, Luetterforst R, Harding A, Apolloni
A, Etheridge M, Stang E, Rolls B, Hancock JF and Parton RG:
Dominant-negative caveolin inhibits H-Ras function by disrupting
cholesterol-rich plasma membrane domains. Nat Cell Biol. 1:98–105.
1999. View Article : Google Scholar : PubMed/NCBI
|
|
40
|
Higgins EM, Bos JM, Mason-Suares H, Tester
DJ, Ackerman JP, MacRae CA, Sol-Church K, Gripp KW, Urrutia R and
Ackerman MJ: Elucidation of MRAS-mediated Noonan syndrome with
cardiac hypertrophy. JCI Insight. 2:e912252017. View Article : Google Scholar : PubMed/NCBI
|
|
41
|
Xu J, Hedberg C, Dekker FJ, Li Q, Haigis
KM, Hwang E, Waldmann H and Shannon K: Inhibiting the
palmitoylation/depalmitoylation cycle selectively reduces the
growth of hematopoietic cells expressing oncogenic Nras. Blood.
119:1032–1035. 2012. View Article : Google Scholar : PubMed/NCBI
|
|
42
|
Wang Y, Ji D, Lei C, Chen Y, Qiu Y, Li X,
Li M, Ni D, Pu J, Zhang J, et al: Mechanistic insights into the
effect of phosphorylation on Ras conformational dynamics and its
interactions with cell signaling proteins. Comput Struct Biotechnol
J. 19:1184–1199. 2021. View Article : Google Scholar : PubMed/NCBI
|
|
43
|
Li Q, Haigis KM, McDaniel A,
Harding-Theobald E, Kogan SC, Akagi K, Wong JC, Braun BS, Wolff L,
Jacks T and Shannon K: Hematopoiesis and leukemogenesis in mice
expressing oncogenic NrasG12D from the endogenous locus. Blood.
117:2022–2032. 2011. View Article : Google Scholar : PubMed/NCBI
|
|
44
|
Kan Z, Jaiswal BS, Stinson J, Janakiraman
V, Bhatt D, Stern HM, Yue P, Haverty PM, Bourgon R, Zheng J, et al:
Diverse somatic mutation patterns and pathway alterations in human
cancers. Nature. 466:869–873. 2010. View Article : Google Scholar : PubMed/NCBI
|
|
45
|
Garcia-Marcos M, Ghosh P and Farquhar MG:
Molecular basis of a novel oncogenic mutation in GNAO1. Oncogene.
30:2691–2696. 2011. View Article : Google Scholar : PubMed/NCBI
|
|
46
|
Leyme A, Marivin A, Casler J, Nguyen LT
and Garcia-Marcos M: Different biochemical properties explain why
two equivalent Gα subunit mutants cause unrelated diseases. J Biol
Chem. 289:21818–21827. 2014. View Article : Google Scholar : PubMed/NCBI
|
|
47
|
Mills KF, Yoshida S, Stein LR, Grozio A,
Kubota S, Sasaki Y, Redpath P, Migaud ME, Apte RS, Uchida K, et al:
Long-term administration of nicotinamide mononucleotide mitigates
Age-associated physiological decline in mice. Cell Metab.
24:795–806. 2016. View Article : Google Scholar : PubMed/NCBI
|
|
48
|
de Picciotto NE, Gano LB, Johnson LC,
Martens CR, Sindler AL, Mills KF, Imai S and Seals DR: Nicotinamide
mononucleotide supplementation reverses vascular dysfunction and
oxidative stress with aging in mice. Aging Cell. 15:522–530. 2016.
View Article : Google Scholar : PubMed/NCBI
|
|
49
|
Wang S, Liang X, Yang Q, Fu X, Zhu M,
Rodgers BD, Jiang Q, Dodson MV and Du M: Resveratrol enhances brown
adipocyte formation and function by activating AMP-activated
protein kinase (AMPK) α1 in mice fed high-fat diet. Mol Nutr Food
Res. 61:102017. View Article : Google Scholar : PubMed/NCBI
|
|
50
|
Pearson KJ, Baur JA, Lewis KN, Peshkin L,
Price NL, Labinskyy N, Swindell WR, Kamara D, Minor RK, Perez E, et
al: Resveratrol delays age-related deterioration and mimics
transcriptional aspects of dietary restriction without extending
life span. Cell Metab. 8:157–168. 2008. View Article : Google Scholar : PubMed/NCBI
|
|
51
|
Park SJ, Ahmad F, Philp A, Baar K,
Williams T, Luo H, Ke H, Rehmann H, Taussig R, Brown AL, et al:
Resveratrol ameliorates aging-related metabolic phenotypes by
inhibiting cAMP phosphodiesterases. Cell. 148:421–433. 2012.
View Article : Google Scholar : PubMed/NCBI
|
|
52
|
Bernier M, Wahl D, Ali A, Allard J,
Faulkner S, Wnorowski A, Sanghvi M, Moaddel R, Alfaras I, Mattison
JA, et al: Resveratrol supplementation confers neuroprotection in
cortical brain tissue of nonhuman primates fed a high-fat/sucrose
diet. Aging (Albany NY). 8:899–916. 2016. View Article : Google Scholar : PubMed/NCBI
|
|
53
|
Liang QX, Lin YH, Zhang CH, Sun HM, Zhou
L, Schatten H, Sun QY and Qian WP: Resveratrol increases resistance
of mouse oocytes to postovulatory aging in vivo. Aging (Albany NY).
10:1586–1596. 2018. View Article : Google Scholar : PubMed/NCBI
|