Introduction
Glioma is a common primary tumor of the central
nervous system with a high degree of malignancy and has long been a
key issue in neuro-oncology research (1). Gliomas can be divided into low-grade
(grades I and II) and high-grade gliomas (grades III and IV)
according to the cell morphology and growth state (2). Gliomas are extremely heterogeneous,
and their tumor cells can proliferate rapidly, invade normal brain
tissue, and show strong resistance to traditional treatments
(3). Despite resection,
radiotherapy and chemotherapy, the prognosis of most patients
remains poor (4). Therefore,
studying the molecular mechanisms of gliomas and the tumor
microenvironment has become an effective means of monitoring and
treating tumors (5).
Cysteine- and glycine-rich protein 2 (CSRP2) is an
intracellular protein belonging to the CSRP family. It contains
specific LIM-only domains and a conserved amino acid sequence
(6). CSRP2 is involved in several
intracellular processes (7). CSRP2
maintains the structure of cardiomyocytes (8) and fibroblasts (9). Additionally, CSRP2 inhibits the
migration of vascular smooth muscle cells to prevent the occurrence
of occlusive vascular diseases (10,11).
In recent years, the role of CSRP2 in tumors has begun to receive
attention, and it has been shown to play different roles in
different tumors. It is upregulated in most malignant tumors, such
as breast cancer (12) and head and
neck squamous cell carcinoma (13).
Hoffmann et al (12)
reported that CSRP2 promotes the invasion of breast cancer cells in
a hypoxia-induced tumor cell model. However, the opposite is true
in colorectal and gastric cancers (9,14). For
example, Chen et al (14)
found that CSRP2 inhibits the progression of colorectal cancer by
inhibiting epithelial-mesenchymal transition in colorectal cancer
cells. This phenomenon may be a self-regulatory mechanism within
tumor cells that inhibits tumor growth and spread. However, the
specific mechanism of action remains unclear. Therefore, it is
important to explore the molecular mechanisms of CSRP2 in the
survival and metabolism of tumor cells.
Materials and methods
Bioinformatics analysis
TCGA RNA-seq transcriptome data were downloaded from
ucscxena (https://xenabrowser.net/). The
expression levels of CSRP2 in primary tumors, recurrent tumors, and
normal tissues were analyzed, and the correlation between the
expression levels of CSRP2 and STAT1 in gliomas was analyzed using
the TNMplot database (https://tnmplot.com/analysis/). Gene expression levels
in different cell lines were obtained from the Cancer Cell Line
Encyclopedia (https://sites.broadinstitute.org/ccle/).
Clinical samples
All samples were collected from the Department of
Neurosurgery at the Second Hospital of Hebei Medical University
from August to October 2024. Inclusion criteria for patients with
glioma were as follows: Diagnosed with glioma and meeting surgical
indications; and glioma with obvious compression symptoms and
recommended surgical resection according to guidelines; patients
with other neurological neoplasms and secondary operations were
excluded; and no history of surgery in the past year. Exclusion
criteria for glioma patients were as follows: history of diabetes,
severe hypertension, or other cardiovascular and cerebrovascular
diseases and immune system diseases; history of hepatitis,
syphilis, HIV and other infectious diseases; a history of acute and
chronic infection; and preoperative radiotherapy, chemotherapy and
biological therapy having been performed. According to the WHO
grading standard, patients were divided into six cases of grade II,
six cases of grade III, and six cases of grade IV. Inclusion
criteria of control group were as follows: Diagnosis of
hypertensive cerebral hemorrhage, arteriovenous malformation, brain
trauma, epilepsy and surgical treatment; no primary tumor; and no
history of surgery in the past year. Patients or family members
sign informed consent forms. Exclusion criteria for control group
were as follows: History of diabetes, tumor and immune system
disease; a history of hepatitis, syphilis, HIV and other infectious
diseases; history of acute and chronic infection; and preoperative
radiotherapy, chemotherapy and biological therapy having been
performed. In total, six tumor-free specimens of volunteers were
obtained from patients who underwent brain surgery after trauma.
The age range of the patients was 18-65 years, including 15 men and
9 women. The present study was approved (approval no. 2024-R613) by
the Research Ethics Committee of the Second Hospital of the Hebei
Medical University (Shijiazhuang, China). Informed consent was
obtained from all the patients in accordance with the ethical
principles of the Declaration of Helsinki.
Cell culture
One normal human astrocyte (NHA) and five human
glioma cell lines (AM-38, T98G, U251MG, A-172 and U138MG) were used
in the present study. NHA (cat. no. H10834) and AM-38 (cat. no.
YS3265C) cell lines were purchased from Shanghai yaji Biotechnology
Co., Ltd. The T98G (cat. no. CL-0583), U251MG (cat. no. CL-0237)
and A-172 (cat. no. CL-0012) cell lines were purchased from Procell
Life Science & Technology Co., Ltd., while the U138MG (cat. no.
SNL-485) cell line was purchased from Wuhan Sunncell Biotechnology
Co., Ltd. NHA, T98G, U251MG, A-172, and U138MG cells were cultured
in Dulbecco's Modified Eagle's medium (cat. no. C3113-0500;
Shanghai VivaCell Biotechnology Co. Ltd.) + 10% fetal bovine serum
(FBS) (cat. no. A5670701; Thermo Fisher Scientific, Inc.) and 1%
penicillin/streptomycin (cat. no. p1400; Beijing Solarbio Science
& Technology Co., Ltd), while AM-38 cells were cultured in
Eagle's minimal essential medium with 20% heat-inactivated FBS. The
cells were cultured at 37°C and 5% CO2. To verify the
role of JAK-STAT1 signaling pathway on necroptosis of glioma cells,
5 µM Ruxolitinib (cat. no. INCB18424; MedChemExpress) was used to
treat cells.
Gene overexpression
The CSRP2 gene fragment was amplified by PCR using
the primers listed in Table SI.
BamHI (cat. no. 1010A) and EcoRI (cat. no. 1040A; both from Takara
Bio, Inc.) were used for enzyme digestion of the target gene
fragment and pcDNA3.1 vector (cat. no. V79020; Thermo Fisher
Scientific, Inc.), respectively. The concentration of plasmid used
in transient transfection was 0.5 µg/µl. The recombinant vector was
constructed using T4 ligase (cat. no. EL0011; Thermo Fisher
Scientific, Inc.). The conjugates were transformed into receptive
Escherichia coli (cat. no. 18265017; Thermo Fisher
Scientific, Inc.) and subsequently screened for recombinant vectors
using a culture medium containing antibiotics. Lipofectamine 3000
Transfection Reagent (cat. no. L3000001; Thermo Fisher Scientific,
Inc.) was prepared in Opti-MEM medium when the T98G cell density
reached 80%. The overexpressed vector plasmid was supplemented with
the P3000 reagent, and then mixed with Lipofectamine 3000 reagent
in a 1:1 ratio to form the DNA liposome complex. The DNA liposome
complex was added to the T98G cells and incubated at 37°C for 2
days to achieve overexpression of CSRP2. The overexpression
efficiency was confirmed using reverse transcription-quantitative
PCR (RT-qPCR) and western blotting.
Gene knockdown
The si-CSRP2 and si-NC sequences were synthesized by
Sangon Biotech Co., Ltd. as listed in Table SII. When the U251MG cells density
reached 80%, transfection was initiated using Lipofectamine 3000
Transfection Reagent diluted in Opti-MEM medium. The siRNA was
dissolved in 25 µl of Opti-MEM medium to achieve a final
concentration of 2 nM. Small interfering RNA (siRNA) was mixed with
Lipofectamine 3000 reagent and incubated at 25°C for 20 min to
allow the formation of a DNA liposome complex. The DNA liposome
complex was added to the U251MG cells and incubated at 37°C for 48
h to facilitate gene knockdown. The knockdown efficiency was
verified using RT-qPCR and western blotting.
Transcriptome sequencing
U251MG cells successfully transfected with si-CSRP2
were selected as the treatment group (n=3), and U251MG cells as the
control group (n=3). Total RNA was extracted using a TRIzol Plus
RNA Purification Kit (cat. no. 12183555; Thermo Fisher Scientific,
Inc.). The concentration and purity of total RNA were detected by
microspectrophotometer (cat. no. NanoDrop 2000; Thermo Fisher
Scientific, Inc.). RNA integrity was detected by Agilent RNA 6000
Nano kit (cat. no. 5067-1511; Agilent Technologies. Inc.). In
total, 1 µg of total RNA was selected to construct a cDNA library
using the NEBNext Ultra II RNA Library Prep Kit for Illumina (cat.
no. E7770S; New England Biolabs, Inc.). Initially, the insert size
of the library was assessed with the Agilent 2100 Bioanalyzer (cat.
no. 5991-3323EN; Agilent Technologies Inc.). Then the effective
concentration of the library was accurately quantified by qPCR (the
effective concentration of the library >2 nM). The mixed
libraries were sequenced by PE150S double-ended on Illumina
sequencers (cat. no. Novaseq 6000; Illumina, Inc.), and the nucleic
acid length was 300-400 bp. The fastp (v0.22.0; http://github.com/OpenGene/fastp) software was
first used to filter the sequencing data to obtain Clean data. Then
HISAT2 (v2.1.0; http://daehwankimlab.github.io/hisat2/download/)
was sued to map the filtered reads to the reference genome. HTSeq
(v0.9.1; http://htseq.readthedocs.io/en/release_0.9.1/install.html)
was used to count the number of reads aligned to each gene. The
expression levels were normalized using the TPM method. Finally,
DESeq2 (v1.46.0; http://bioconductor.org/packages/release/bioc/html/DESeq2.html)
software was used for differential expression analysis between the
two comparative groups. Differentially expressed genes were
screened with |log2FC|>1.5 and P<0.05 as threshold
values. The transcriptome data has been submitted to the NCBI
Sequence Read Archive database (https://www.ncbi.nlm.nih.gov/sra) under accession
number PRJNA1146801. Individual sample run accession numbers
include SRR30206129, SRR30206130, SRR30206131, SRR30206132,
SRR30206133 and SRR30206134.
Functional enrichment analysis of
differential genes
Gene ontology (GO) functional enrichment was used to
analyze the biological functions that differentially expressed
genes (DEGs) may participate in. The Kyoto Encyclopedia of Genes
and Genomes (KEGG; http://www.genome.jp/kegg/) was used to count the
number of DEGs contained in different levels of the pathway and
finally determine the metabolic and signaling pathways involved in
the DEGs.
RT-qPCR
Cells in different groups were removed from the
culture medium, 1 ml Redzol (cat. no. FTR-50; SBS Genetech Co.,
Ltd.) was added to the lysed cells, and RNA was extracted according
to the manufacturer's protocol. The extracted RNA was
reverse-transcribed to cDNA using a PrimeScript RT Reagent Kit
(cat. no. RR037Q; Takara Bio, Inc.). The reaction system used was
as follows: In total, 2 µl 5X PrimeScript Buffer, 0.5 µl
PrimeScript RT Enzyme Mix I, 0.5 µl Oligo dT Primer, 0.5 µl Random
6-mers and 1 µg Total RNA were supplemented with RNase-free
dH2O to 10 µl. Reverse transcription reaction conditions
according to the manufacturer's protocol; and the product was
preserved at −20°C. RT-qPCR was performed using the TB Green Premix
Ex Taq II (cat. no. RR820Q; Takara Bio, Inc.). The reaction system
was as follows: 10 µl TB Green Premix Ex Taq II, 0.8 µl PCR Forward
Primer, 0.4 µl ROX Reference Dye, 2 µl DNA template, 6 µl
sterilized water. The reaction conditions were as follows: 95°C for
30 sec, (95°C for 5 sec, and 60°C for 30 sec) ×40 cycles. GAPDH was
used as reference gene. The primers used in the experiment are
listed in Table SIII. The results
were calculated according to the 2−ΔΔcq method (15).
Western blotting
RIPA lysate (250 µl; cat. no. C1055; Applygen
Technologies, Inc.) was added to the cells collected by
centrifugation, placed in an ice bath for 10 min, and centrifuged
at 8,000 × g for 10 min at 4°C to collect the supernatant. The
protein concentration was determined using a BCA protein
concentration determination kit (cat. no. BL521A; Biosharp Life
Sciences). Proteins (20 µg) were separated using SDS-PAGE (10%
polyacrylamide gel) and transferred to PVDF membranes (cat. no.
03010040001; Merck KGaA). Membranes were then incubated with 5%
skim milk powder (cat. no. D8340; Beijing Solarbio Science &
Technology Co., Ltd.) for 2 h at 25°C. The closed PVDF membrane was
incubated overnight at 4°C with a primary antibody working
solution. The HRP-conjugated secondary antibody working solution
was then incubated at 25°C for 1 h. Finally, an ECL
chemiluminescence reagent (cat. no. BL520A; Biosharp Life Sciences)
was added to visualize the bands in the gel imaging system. The
antibody information used in the experiment is included in Table SIV. Densitometric analysis was
conducted using the ImageJ software (version 1.52p; National
Institutes of Health).
Hematoxylin and eosin staining
The 5-µm-thick tissue sections were placed on
slides; slices were placed in xylene I (cat. no. 1330-20-7;
Sigma-Aldrich; Merck KGaA) for 10 min, and for 5 min in xylene II,
then dewaxed. Slices were then subjected to ethanol hydration (cat.
no. 64-17-5; Sigma-Aldrich; Merck KGaA) and added to distilled
water. The slices were stained with a hematoxylin dye solution
(cat. no. C0105S; Beyotime Institute of Biotechnology) for 5 min,
and then rinsed with tap water to remove the excess dye. The cells
were differentiated with 1% hydrochloric alcohol (cat. no.
7647-01-0; Sigma-Aldrich; Merck KGaA) for 30 sec until the nuclei
were of a suitable color and washed with tap water. The sections
were placed in ammonia solution (cat. no. 1336-21-6; Sigma-Aldrich;
Merck KGaA) until turned blue. The slices were placed in an eosin
dye solution and stained for 3 min at 25°C; they were then
dehydrated with ethanol at different concentrations and made
transparent in xylene I and II. The samples were sealed with a
neutral gum (cat. no. E675007-0100; Sangon Biotech Co., Ltd.).
Immunohistochemistry
The tissue sections were placed on slides. The
slices were then incubated in an oven at 60°C for 30 min. Xylene I
and II were soaked for dewaxing. Then, sections were hydrated with
ethanol at different concentration gradients, and thermal antigen
repair was performed (cat. no. C1032; Beijing Solarbio Science
& Technology Co., Ltd.). The sections were incubated with a 3%
hydrogen peroxide solution (cat. no. MM0750; Changzhou Maokang
Medical Products Co., Ltd.) for 10 min. The sections were incubated
with 10% goat serum blocking solution (cat. no. SL038; Beijing
Solarbio Science & Technology Co., Ltd.) in a wet box at 25°C
for 10 min. Specific primary antibody (1:1,000; cat. no. 10892-AP;
Proteintech Group, Inc.) was added and incubated overnight in a wet
box at 4°C. The labeled Goat anti-rabbit IgG H&L (HRP)
(1:1,000; cat. no. ab6721; Abcam) was then added and incubated at
25°C for 10 min. DAB developing agent (cat. no. DA1010; Beijing
Solarbio Science & Technology Co., Ltd.) was added for the
color reaction. Nuclei were stained with hematoxylin for 2 min. The
samples were dehydrated using an ethanol gradient and made
transparent with xylene. The sections were scanned using a
pathology slide scanner (cat. no. PRECICE 500; Beijing UNIC
Technology Co., Ltd.).
Cell Counting Kit-8 (CCK-8)
Transfected T98G and U251MG cells were treated with
trypsin digestion solution (cat. no. C0201; Beyotime Institute of
Biotechnology) and incubated for 2 min. The medium was then added,
and the cells were suspended in a centrifuge tube (1,200 × g) and
centrifuged for 3 min at 25°C. The cell density was calculated
using a cell counter (cat. no. A50298; Thermo Fisher Scientific,
Inc.). The cells were inoculated into 96-well plates at 2,000
PCS/well. After incubation at 37°C for 0, 24, 48 and 72 h, 10 µl of
CCK-8 was added to each well of the 96-well plate and incubated for
4 h. The absorbance of each well was measured at 450 nm using an
enzyme labeler.
EdU assay
The RiboBio EdU Cell Proliferation Assay Kit (cat.
no. C10310; Guangzhou RiboBio Co., Ltd.) was used. Cells at the
logarithmic growth stage were inoculated into 96-well plates at a
density of 4,000 cells/well. Diluted EdU solution (100 µl) was
added to each well and incubated for 2 h at 37°C. The culture
medium was discarded, and 50 µl of cell-fixing solution was added
to each well and incubated at 25°C for 30 min. The fixing solution
was discarded, 100 µl of penetrant was added to each well, and
incubated at 25°C for 10 min. Apollo staining solution (100 µl) was
added to each well and incubated at 25°C for 30 min. The dye
reaction solution was discarded, 100 µl of penetrant solution was
added, and the mixture was washed twice for 10 min each time.
Osmotic fluid was discarded. A total of 100 µl of 1X Hoechst 33342
reaction solution was added to each well and incubated at 25°C for
30 min. The dye reaction solution was discarded, and 100 µl PBS was
added for washing twice. After sealing with an anti-fluorescence
quenched tablet, it was stored at 4°C in the dark.
Cell healing experiment
When the cells in the dish formed a monolayer, a
sterile gun tip was used to create a vertical scratch on the
monolayer. The cells were washed with PBS and added to a serum-free
medium. The cell status at 0 h was immediately recorded using an
inverted microscope. The cells were cultured in a petri dish for 48
and 96 h and then images were captured using an inverted
microscope. The healing rate was expressed as a proportion of the
change in the width of the scratch, and the healing rate of the
cells was calculated for 48 h.
Transwell assay
In total, 100 µl of matrix glue was uniformly
applied to the upper chamber of the Transwell cell (cat. no. 3378;
Corning, Inc.). After solidification, 5×10⁵ cells were
inoculated in the upper chamber, and 500 µl of medium containing
20% FBS was added to the lower chamber. The cells were cultured in
an incubator for 48 h at 37°C. The cells were removed and fixed
with 600 µl of fixative solution (cat. no. P1110; Beijing Solarbio
Science & Technology Co., Ltd.) for 30 min. The fixing solution
was then discarded, and 0.2% crystal violet (cat. no. C8470;
Beijing Solarbio Science & Technology Co., Ltd.) was added for
staining for 10 min. The number of cells that crossed the membrane
and reached the lower chamber was observed under the inverted
biological microscope (cat. no. ICX41; Ningbo Sunny Instruments
Co., Ltd.).
Hoechst 33342/PI dual staining
The cells were then digested, collected and counted.
A total of 105 cells were suspended in a medium
containing 5 µl Hoechst and 5 µl PI staining solutions (cat. no.
BL116A; Biosharp Life Sciences) and incubated at 4°C for 30 min.
The cells were collected using centrifugation at 1,200 × g for 3
min and stained to observe the red and blue fluorescence.
Flow cytometry
The Annexin V-FITC/PI Apoptosis Detection Kit (cat.
no. 40302ES20; Shanghai Yeasen Biotechnology Co., Ltd.) was used to
detect apoptotic cells. The cells were digested using
ethylene-diamine-tetra-acetic acid-free pancreatic enzymes (cat.
no. C0205; Beyotime Institute of Biotechnology) and collected.
Cells (1×10⁵) were selected, and 100 µl of Binding
Buffer was added to the cells. Staining Solution with 5 µl Annexin
V-FITC and 10 µl PI was mixed and stained at 25°C for 10 min. A 400
µl 1X Binding Buffer was added and detected by flow cytometry (cat.
no. A24858; Thermo Fisher Scientific, Inc.). Data analysis was
performed using FlowJo software (version 10.8.1; FlowJo LLC).
Transmission electron microscopy
The transfected cells were collected, and the cell
structure was fixed at 4°C for 2 h using 2.5% electron microscope
fixation solution (cat. no. G1102; Wuhan Servicebio Biotechnology
Co., Ltd.). A solution of 1% agarose (cat. no. 10208ES60; Shanghai
Yeasen Biotechnology Co., Ltd.) was prepared, and the cell
precipitates were embedded in agarose. Then, 1% osmic acid (cat.
no. RBS0086; Shanghai Rongbai biological technology Co., Ltd.) was
added to avoid light at 25°C for 2 h. Gradient ethanol
concentrations were used for dehydration. Acetone and 812 embedding
agents [cat. no. SPI-02660; HEAD (BEIJING) Biotechnology Co., Ltd.]
were used for infiltration embedding. The embedded plates were
incubated at 60°C for 48 h. Ultrathin slices (60 nm) were prepared
using an ultrathin microtome (ARTOS 3D; Leica Microsystems GmbH). A
2% uranium acetate-saturated alcohol solution (cat. no. 541-09-3;
Hubei Shixing Chemical Co., Ltd.) was used to avoid light staining
for 8 min and a 2.6% lead citrate solution (cat. no. 77-92-9;
Shanghai Aladdin Biochemical Technology Co., Ltd) was used to avoid
carbon dioxide staining for 8 min. Spectra Ultra S/TEM (Thermo
Fisher Scientific, Inc.) was used for observation, image collection
and analysis.
ELISA
Cytokines IL-6 (cat. no. EK1153), TNF-α (cat. no.
EK182HS), IFN-γ (cat. no. EK180HS) and IL-10 (cat. no. EK110/2)
were all purchased from Hangzhou Lianke Biotechnology Co., Ltd. The
absorbance was measured using a full-wavelength enzyme labeler
(Multiskan SkyHigh; Thermo Fisher Scientific, Inc.).
Co-immunoprecipitation (Co-IP)
An immunoprecipitation kit (cat. no. P2179S;
Beyotime Institute of Biotechnology) was for the experiments.
Transfected cells were collected and lysed on ice, and the
supernatant was collected. For every 500 µg of total protein
lysate, 20 µl of Protein A/G Agarose slurry was added and incubated
at 25°C for 2 h. Primary antibody (1 µg) was added to the remaining
lysate and incubated at 4°C overnight. Pre-treated Protein A/G
agarose beads were added and incubated at 4°C for 2 h. The beads
were collected using centrifugation at 1,000 × g at 4°C for 3 min
and rinsed with the elution buffer. Western blotting was performed
on the eluent to analyze the coprecipitated proteins. The primary
antibodies used were anti-CSRP2 (1:1,000; cat. no. 10892-AP;
Proteintech Group, Inc.) and anti- protein inhibitor of activated
STAT1 (PIAS1) (1:1,000; cat. no. ab109388; Abcam).
Correlation analysis of gene
expression
The TIMER 2.0 database (http://cistrome.org/TIMER/) was used for analysis
CSRP2 and pertinence of STAT1 in glioma. Gene Correlation analysis
was selected in the Cancer Exploration module. The restrictions
were set to CSRP2, STAT1 and glioma. Spearman rank correlation
coefficient was used to analyze the correlation of gene
expression.
Statistical analyses
Statistical analysis of the experimental results was
performed using the ImageJ software (version 1.52p; National
Institutes of Health). GraphPad Prism software (version 9;
Dotmatics) was used for data analysis. Statistical differences
between two groups of data were analyzed using the unpaired t-test,
and other data were analyzed using one-way ANOVA. The Tukey's
Honestly Significant Difference test was then used to compare the
significant differences between the groups. The Spearman rank
correlation coefficient was used to determine the correlation
between genes. P<0.05 was considered to indicate a statistically
significant difference.
Results
CSRP2 is upregulated in glioma
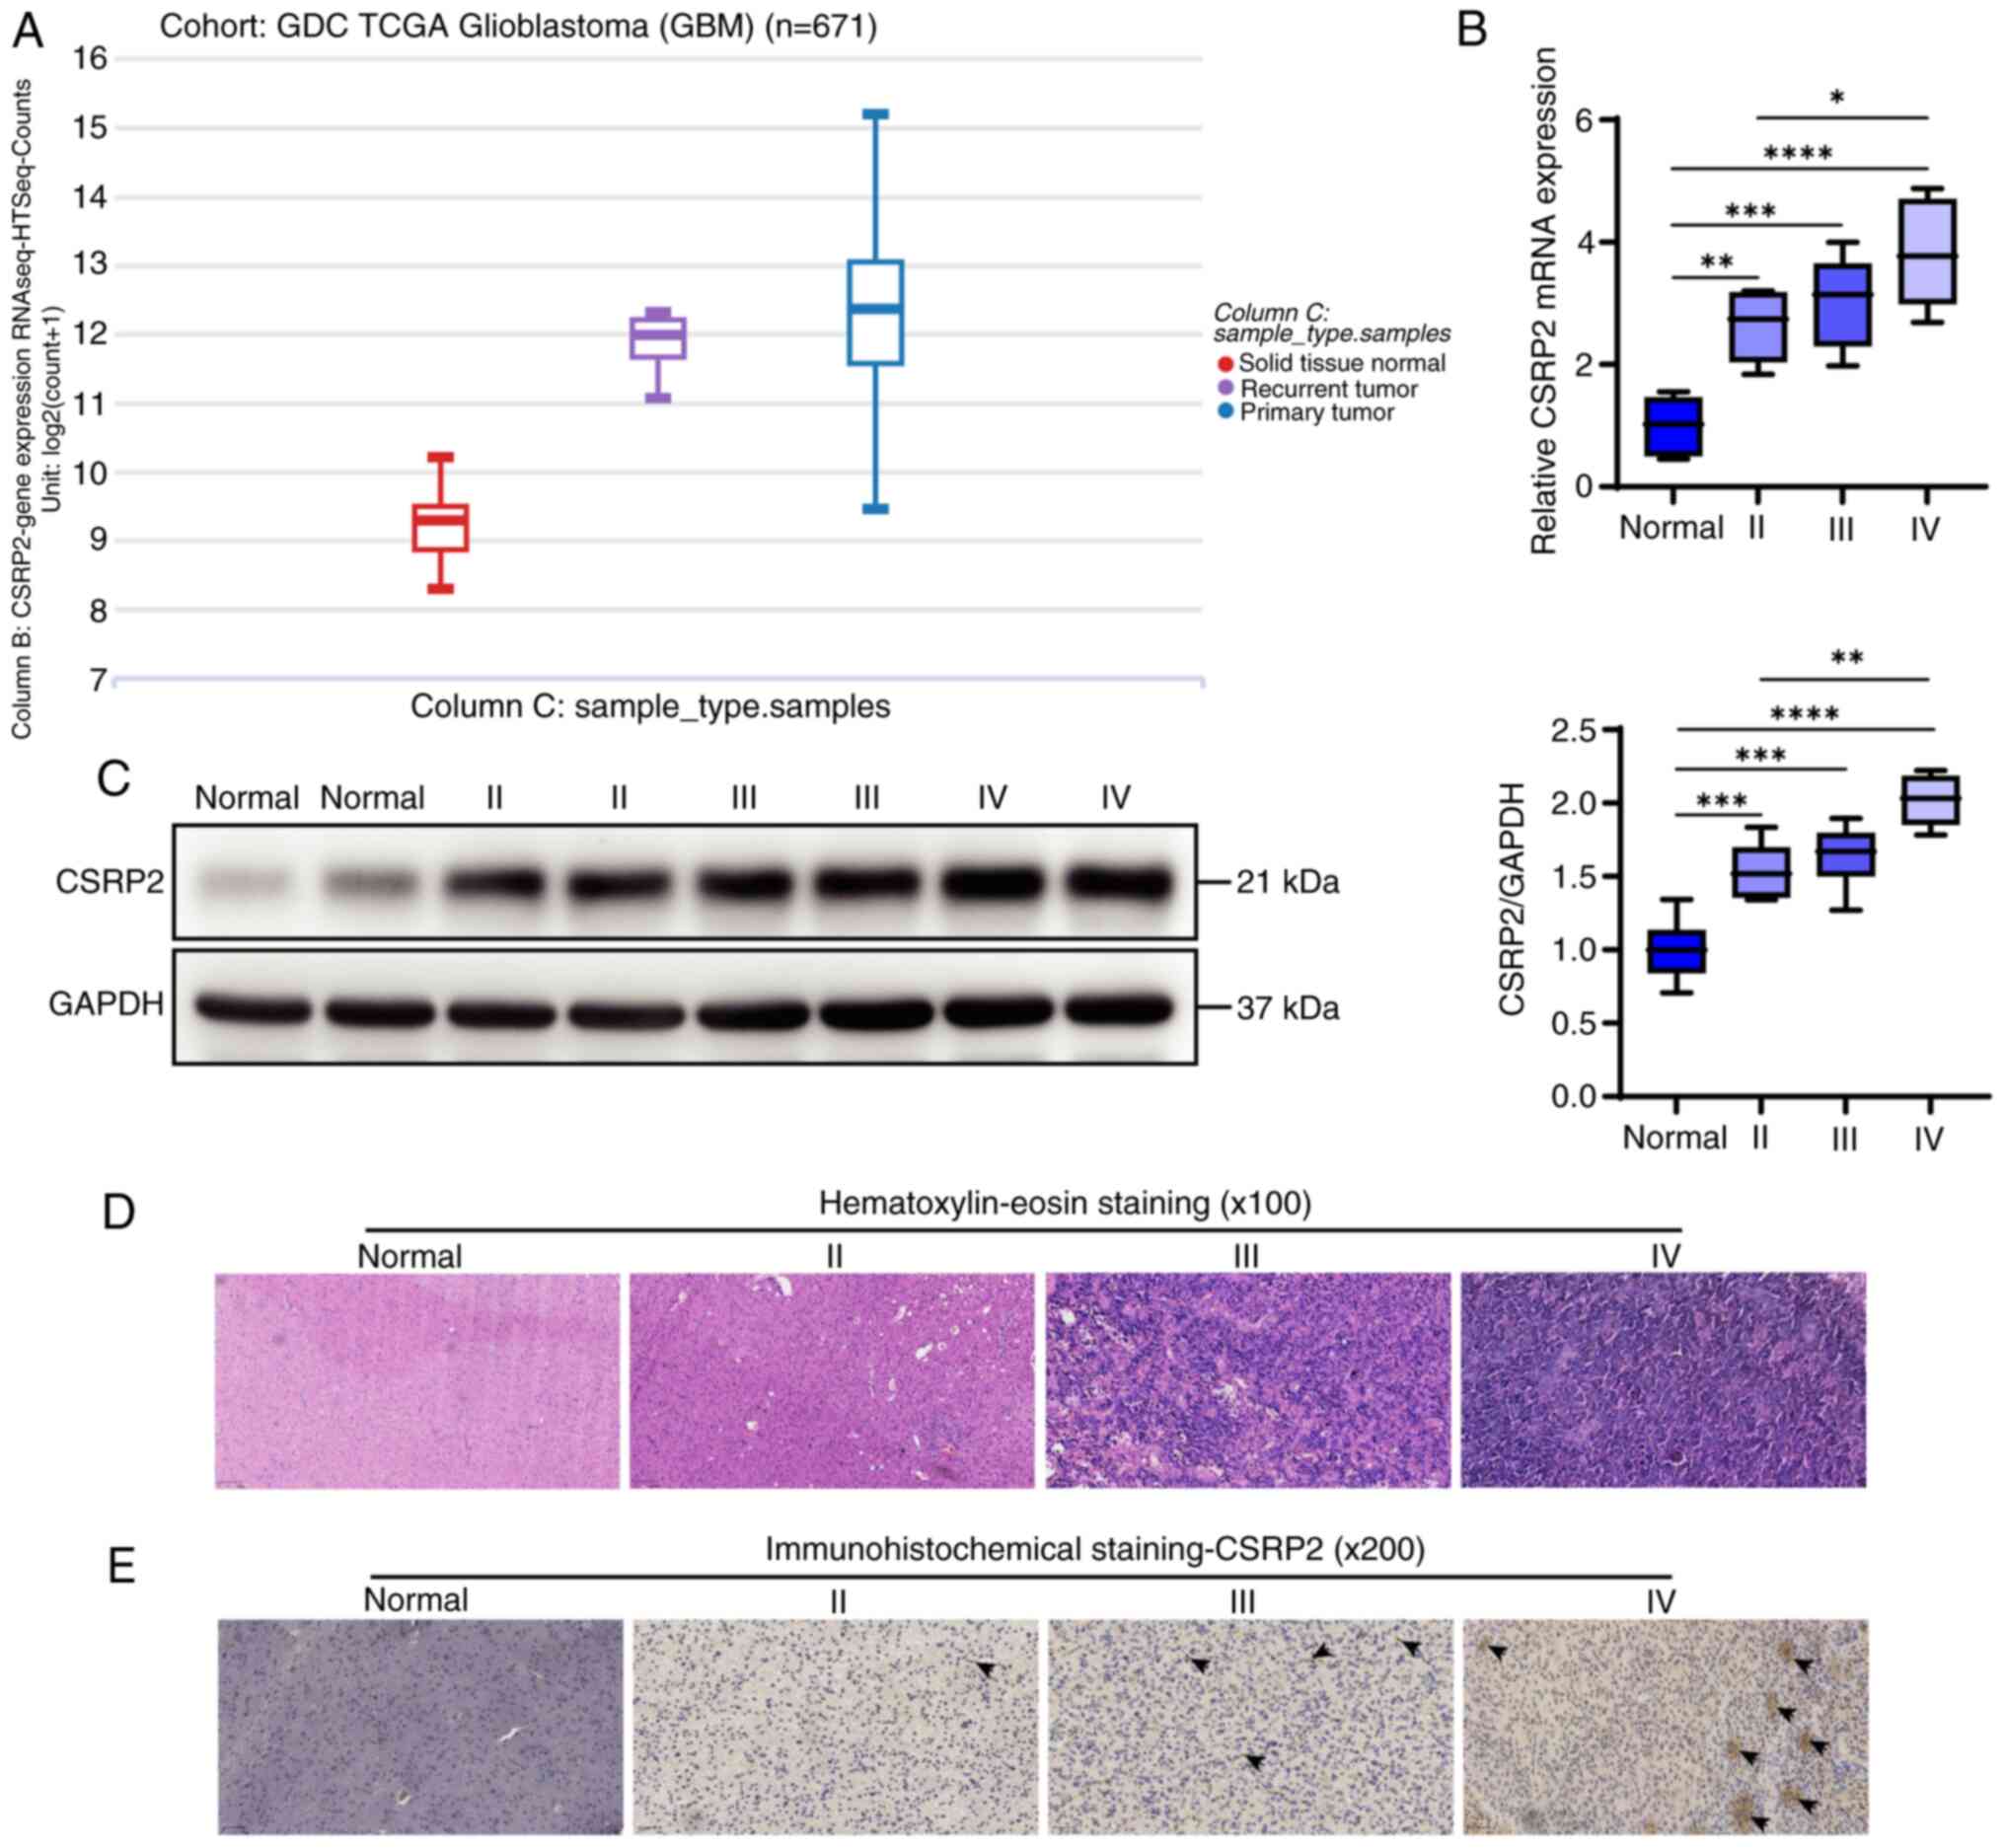
TCGA RNA-seq transcriptome data were downloaded from
the UCSC Xena website (https://xena.ucsc.edu/). The expression levels of
CSRP2 in both recurrent and primary tumors were significantly
higher than that in normal tissues (Fig. 1A). Tissues were further collected
from patients with glioma, and RT-qPCR results demonstrated that
CSRP2 expression levels in glioma were significantly higher than
those in normal tissues, and CSRP2 expression showed an increasing
trend with tumor grade (Fig. 1B).
Western blotting revealed similar results (Fig. 1C). Hematoxylin and eosin staining
were used to evaluate inflammation in the glioma tissues. Different
degrees of inflammatory cell aggregation and infiltration were
observed in glioma tissues of different grades (Fig. 1D). CSRP2 content was detected using
immunohistochemical staining. It was observed that CSRP2 was
positively expressed in glioma tissues, with the highest positivity
rate observed in grade IV tumors (Fig.
1E).
CSRP2 promotes the proliferation,
migration and invasion of glioma cells
To explore the effects of CSRP2 on the biological
function of glioma cells, The Cancer Cell Line Encyclopedia was
used to screen glioma cell lines. A total of five glioma cell lines
and one human astrocyte NHA cell line were selected for the RT-qPCR
analysis. The results showed that the expression levels of CSRP2 in
glioma cells was significantly higher than that in NHA cells
(Fig. 2A). Therefore, U251MG cells
with the highest CSRP2 expression levels were selected for gene
knockdown experiments and T98G cells with the lowest expression
levels were selected for gene overexpression experiments. In total,
three candidate siRNAs were designed and RT-qPCR was used to
determine the efficiency of the gene knockdown. Finally, si-CSRP2-1
was selected for gene knockdown experiments in U251MG cells
(Fig. 2B). The overexpression and
knockdown effects of CSRP2 in cells were verified using western
blotting (Fig. 2C).
CCK-8 results identified that overexpression of
CSRP2 improved the viability of NHA cells, whereas CSRP2 knockdown
had no significant effect on NHA cell viability (Fig. 3A). The viability of glioma cells was
then assessed. It was found that CSRP2 overexpression significantly
increased the viability of T98G cells, whereas CSRP2 downregulation
inhibited the viability of U251MG cells (Fig. 3B). EdU experiments further revealed
that CSRP2 overexpression promoted the proliferation of T98G cells,
whereas CSRP2 knockdown inhibited the proliferation of U251MG cells
(Fig. 3C). The results of the wound
healing (Fig. 3D) and Transwell
(Fig. 3E) assays showed that
overexpression of CSRP2 promoted the invasion and migration of T98G
cells, whereas knockdown of CSRP2 revealed the opposite
results.
CSRP2 inhibits necroptosis of glioma
cells
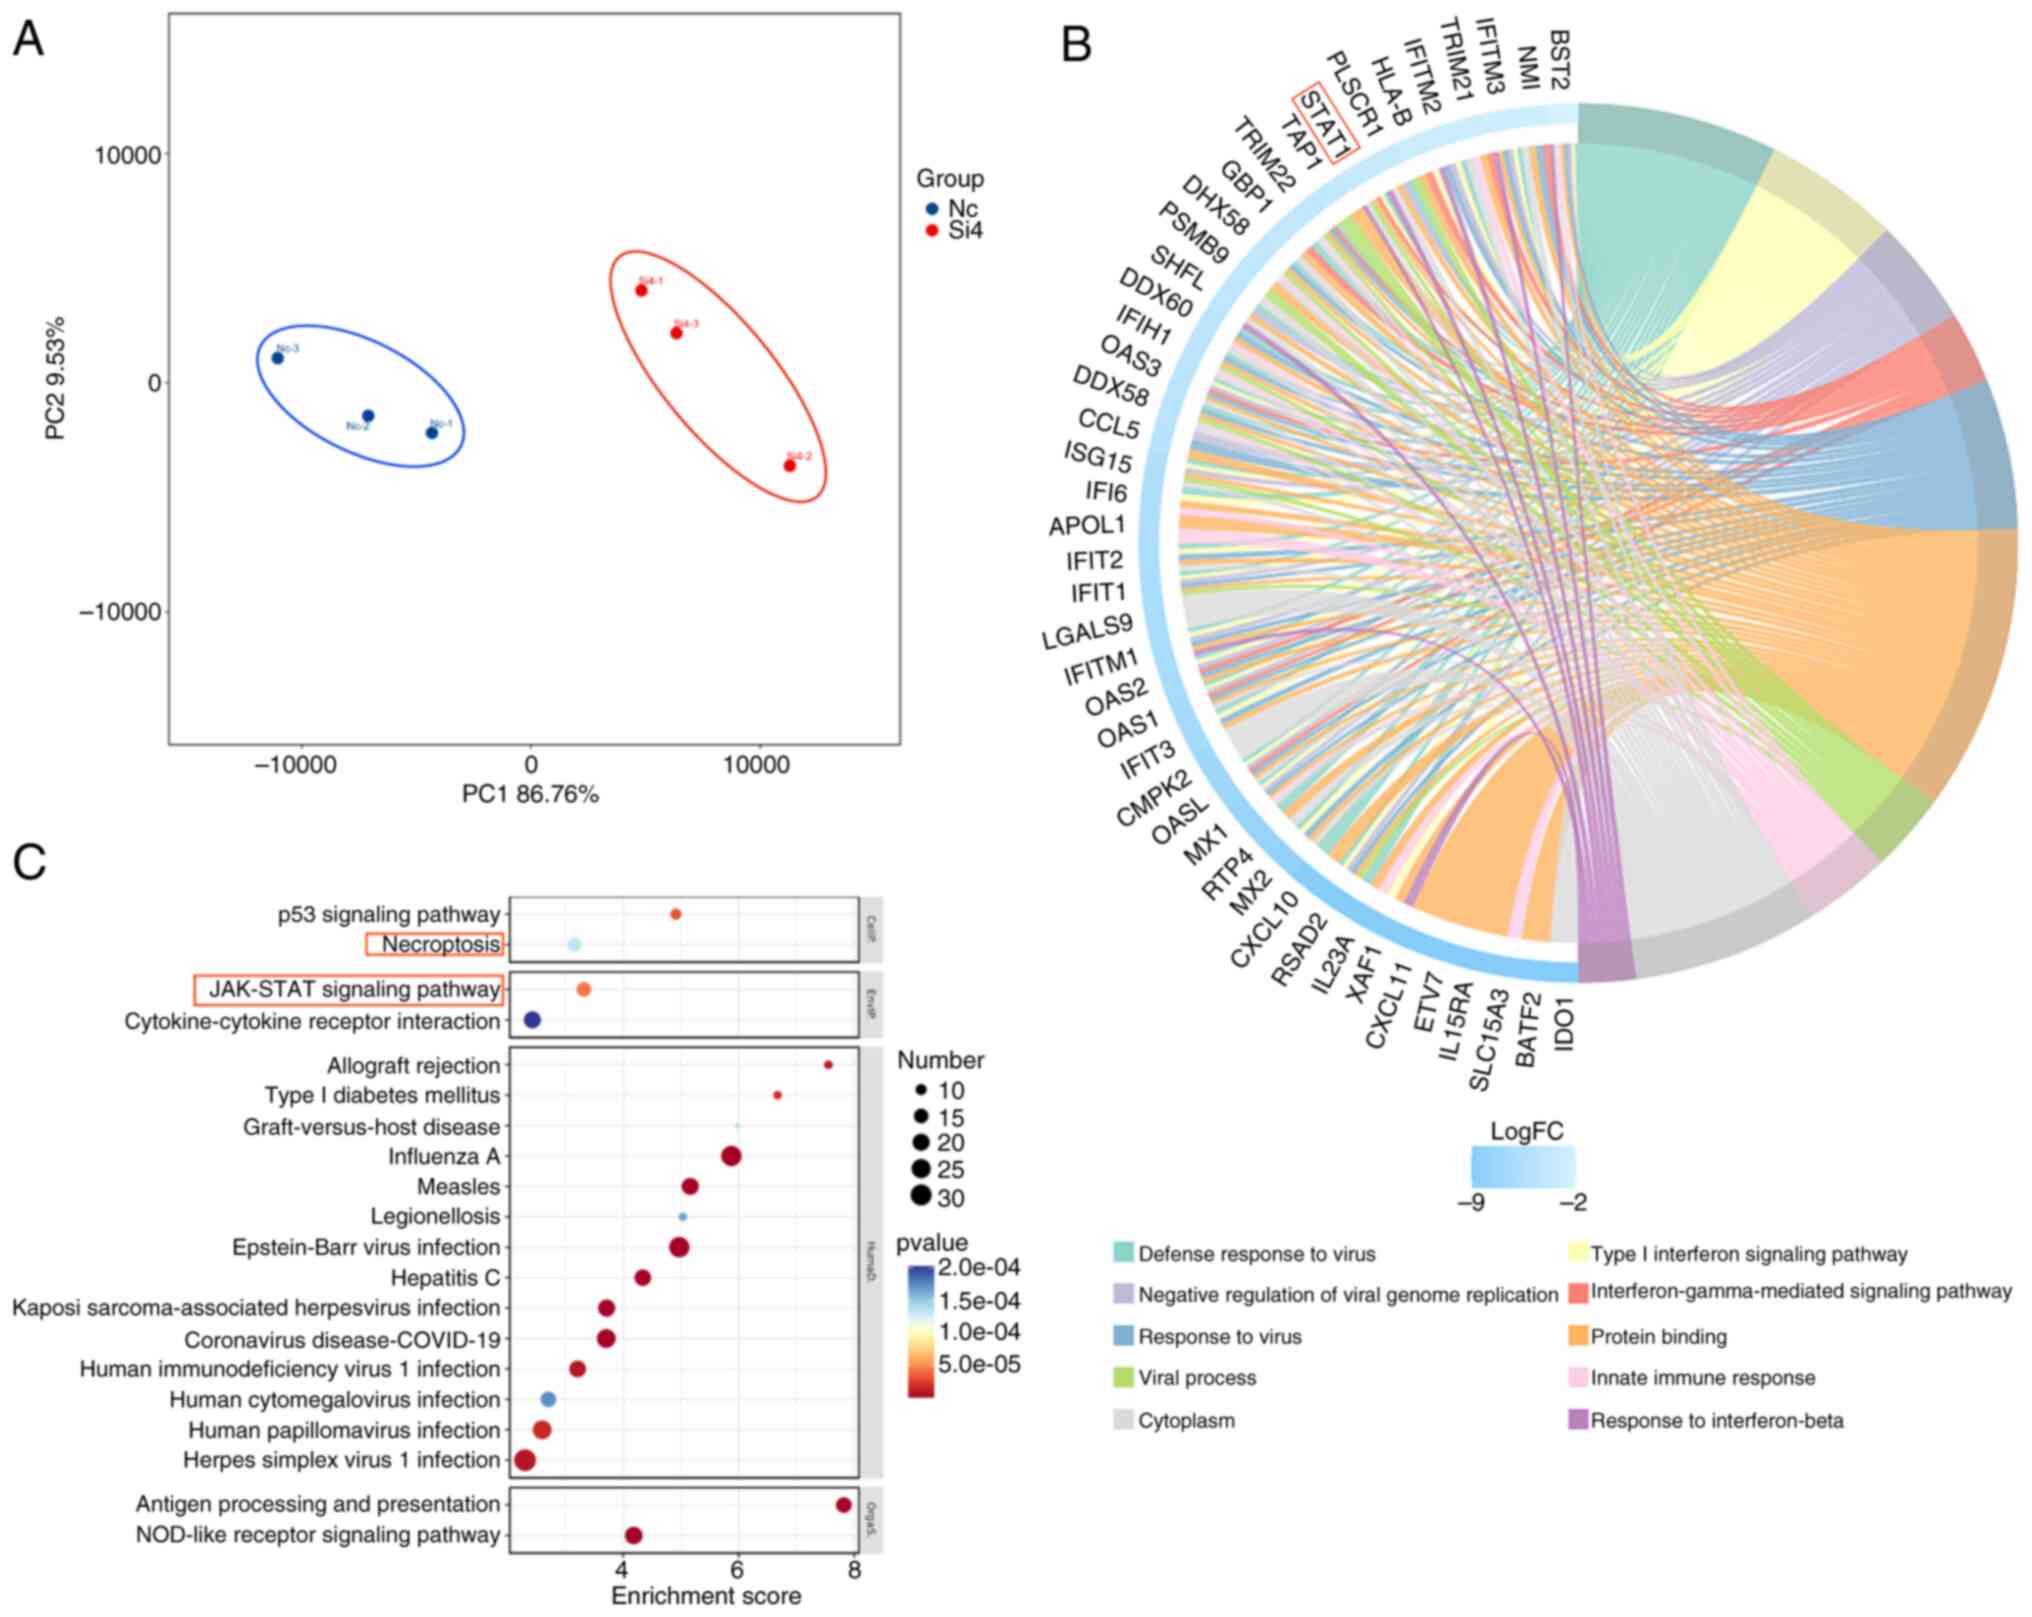
CSRP2 expression in U251MG cells was knocked down
and transcriptome sequencing was performed. Principal component
analysis revealed that the control and glioma cell groups clustered
significantly (Fig. 4A). The DEGs
were screened with P<0.05 and |log 2FC|>1.5. A
total of 100 upregulated and 337 downregulated genes were
identified. The selected DEGs were used to create a GO chord
diagram (Fig. 4B). The DEGs were
mainly involved in the inflammatory pathways. Next, enrichment of
KEGG signaling pathways was performed (Fig. 4C). Focus was primarily addressed on
cellular processes and environmental information processing.
Although the P53 signaling pathway is highly enriched in cancer,
its role in cancer has been well-established, with gene therapies
and targeted treatments already in place (16). Furthermore, it was observed that
STAT1, a gene enriched in both necroptosis and the JAK-STAT
signaling pathway, potentially links these two processes. This
connection suggests that the JAK-STAT pathway may not only be a
central regulatory factor in glioma biology but also a convergence
point for necroptosis, offering a new perspective on the
pathophysiology of gliomas. In light of these insights, it was have
chosen to further explore the JAK-STAT signaling pathway in the
context of gliomas, with a particular emphasis on its interaction
with necroptosis.
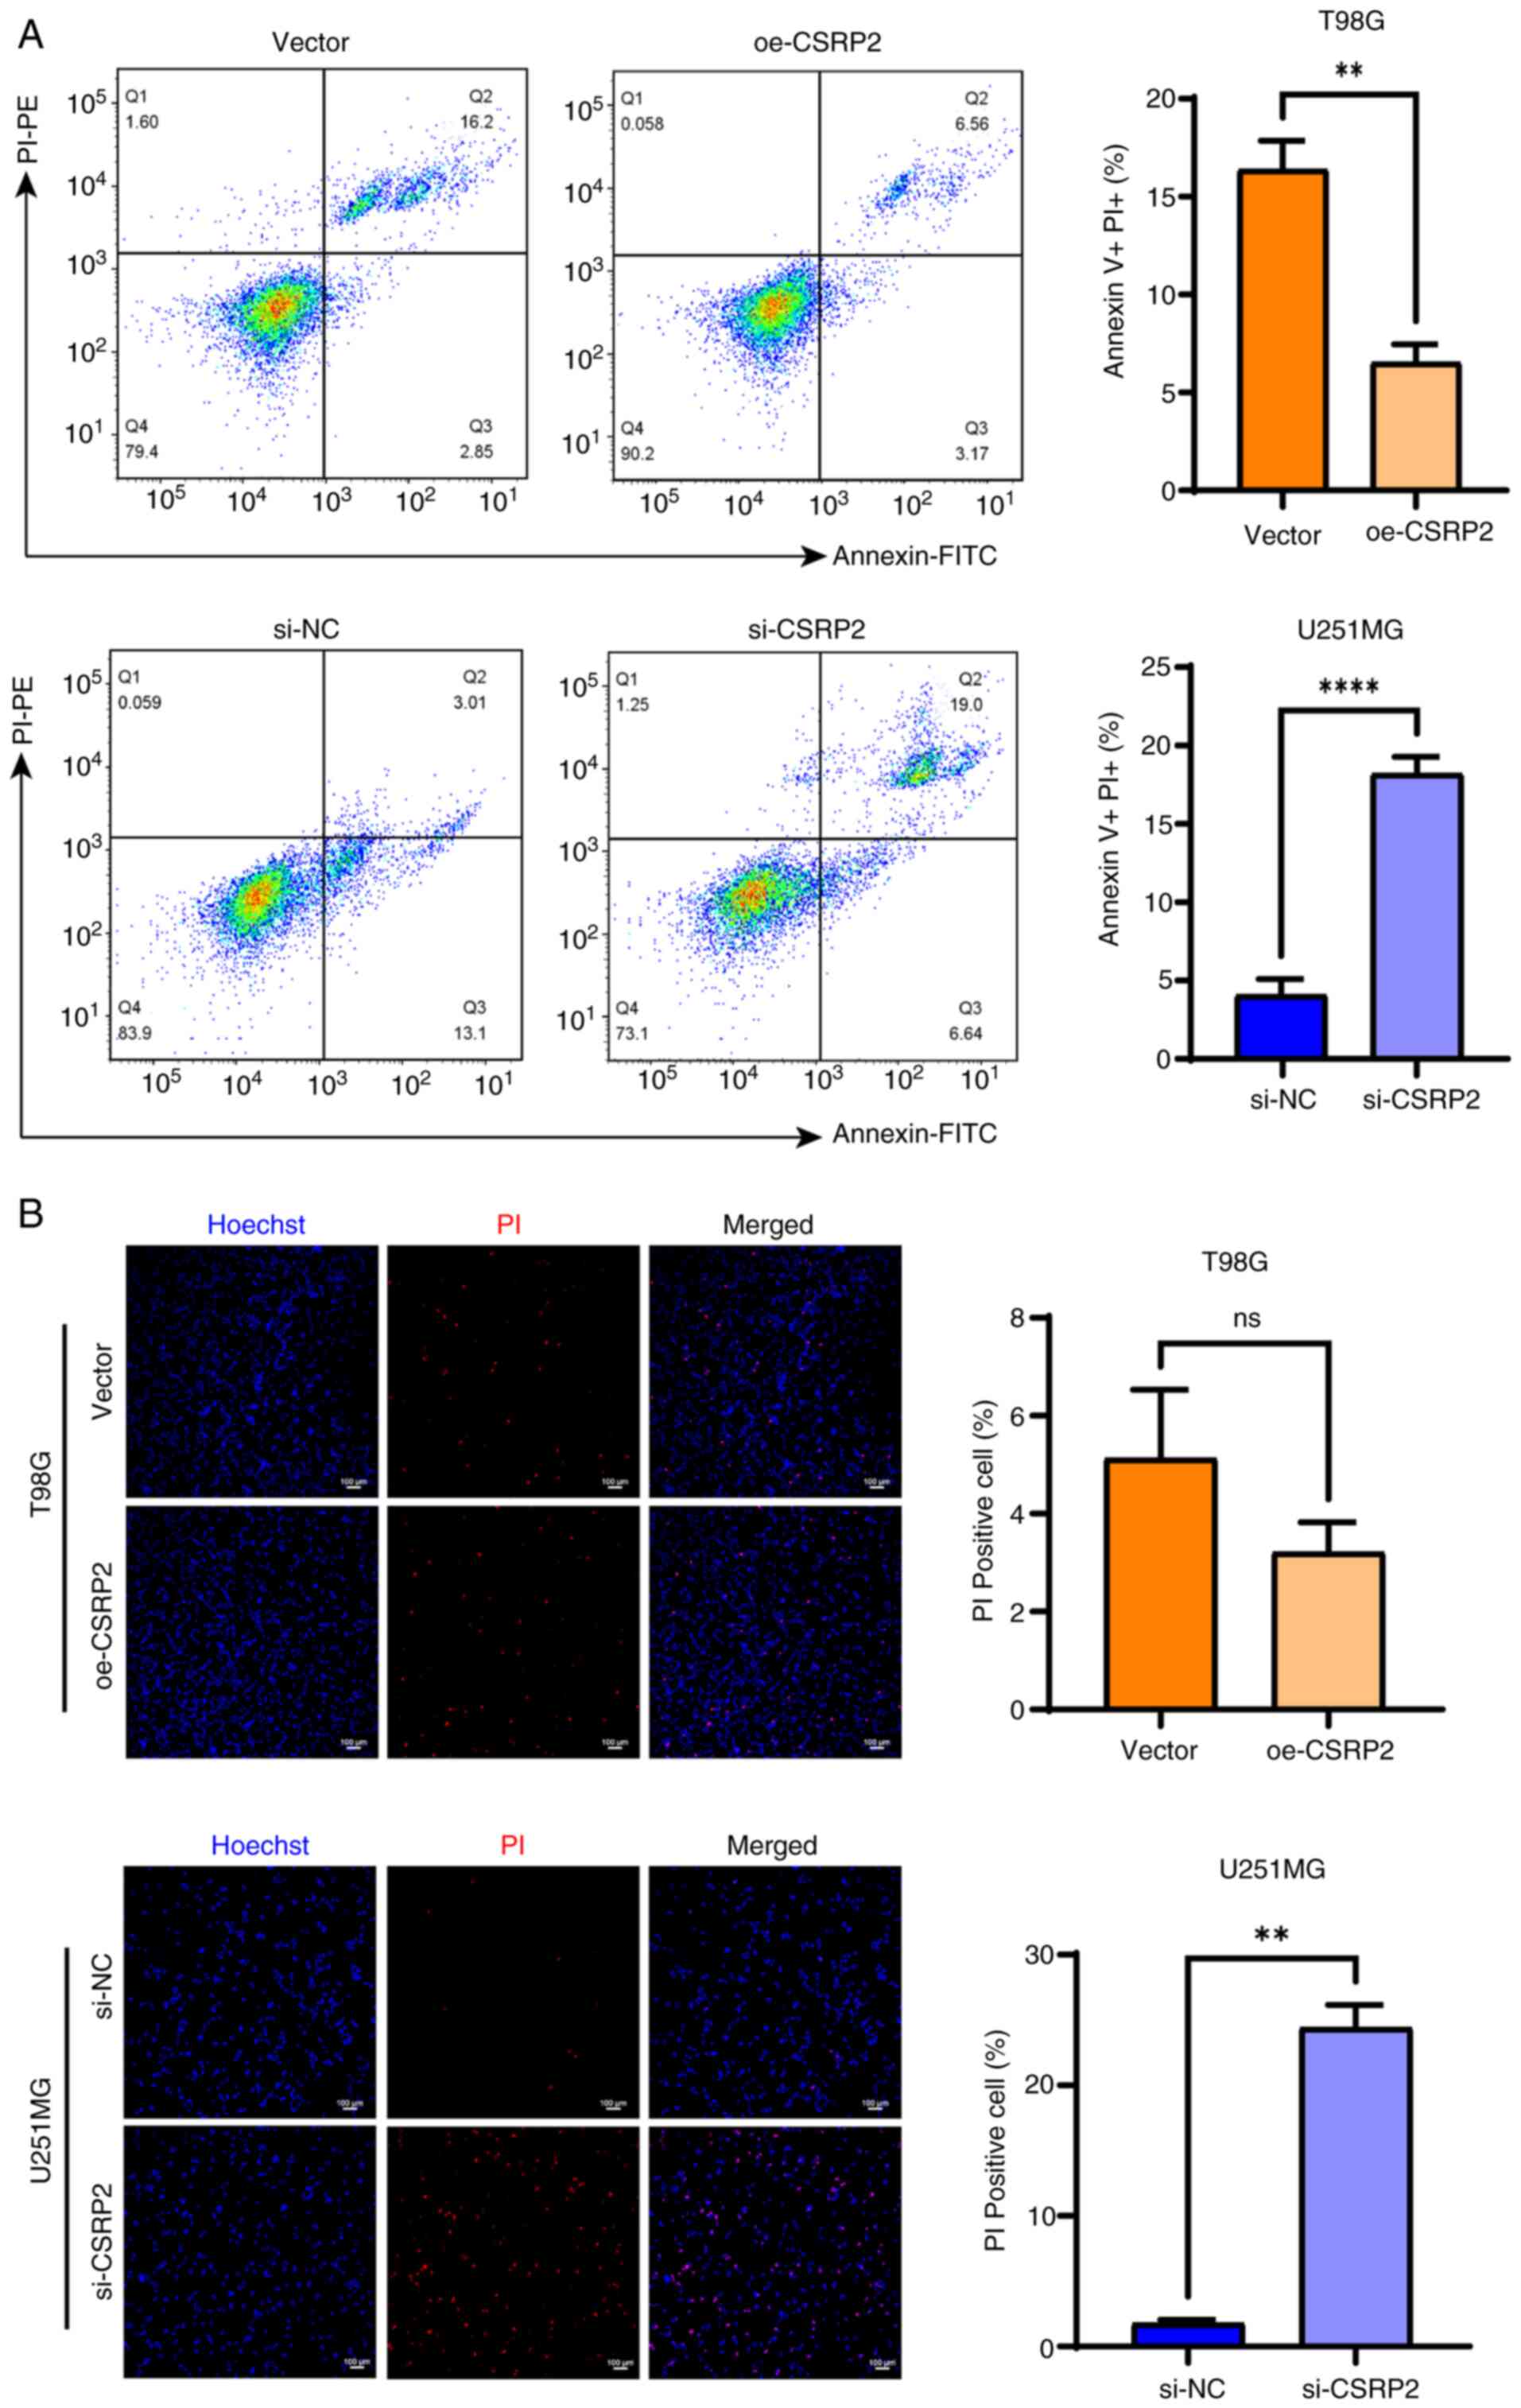
Flow cytometric results showed that CSRP2
overexpression inhibited apoptosis of T98G cells, whereas CSRP2
knockdown increased the apoptotic rate of U251MG cells (Fig. 5A). Cells that are positive for PI
staining may be in a late apoptotic or necrotic state. Compared
with the control group, the necrosis rate in the overexpression
(oe)-CSRP2 group was significantly reduced, whereas the necrosis
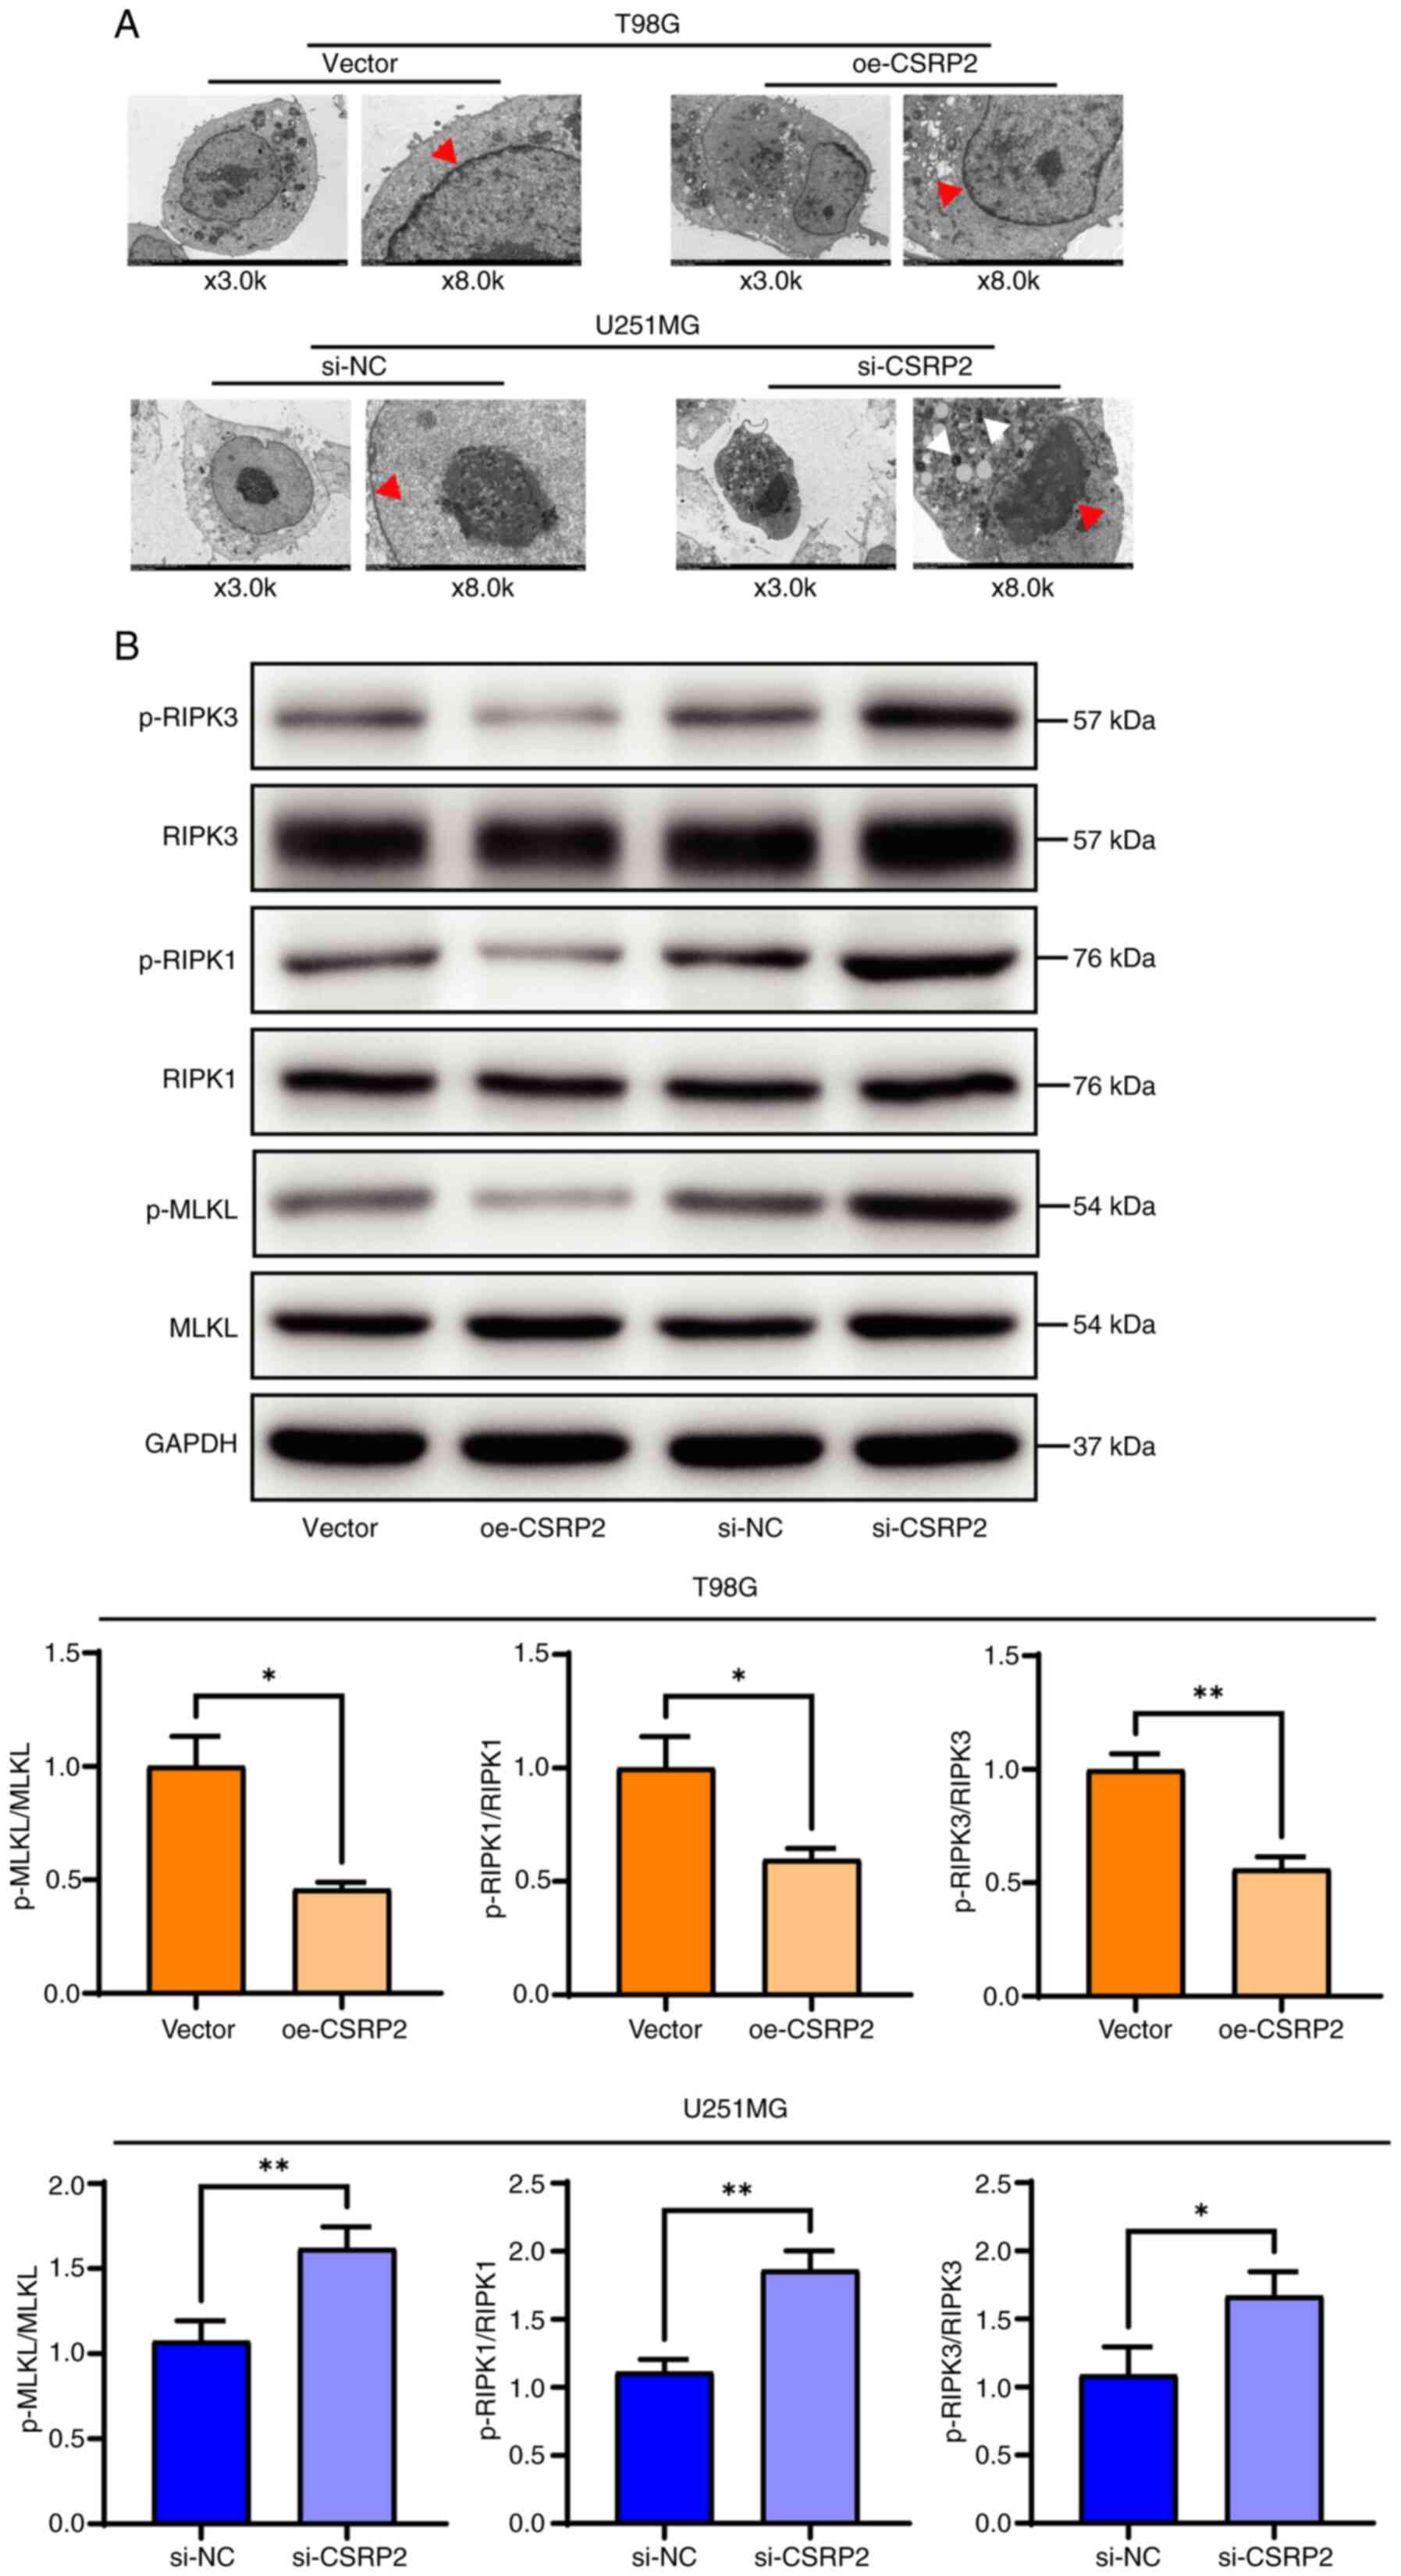
rate in the si-CSRP2 group was significantly increased (Fig. 5B). Using transmission electron
microscopy, it was observed that the cell membrane of U251MG cells
with CSRP2 knockdown was broken incompletely, with evident nuclear
shrinkage and destruction of organelles such as the mitochondria
(Fig. 6A). Western blot analysis
detected the expression of necroptosis-related proteins; it was
found that the expression levels of the necroptosis-related
proteins phosphorylated (p-)MLKL, p-RIPK1 and p-RIPK3 were
significantly decreased in the oe-CSRP2 group. By contrast, the
expression levels of these proteins were significantly increased in
the si-CSRP2 group (Fig. 6B).
CSRP2 activates inflammation in glioma
cells
Our previous analysis of transcriptome sequencing
data predicted that CSRP2 knockdown may activate the inflammatory
pathways. Therefore, the levels of the inflammation-related factors
IL-6, TNF-α, IFN-γ and IL-10 were detected using ELISA (Fig. 7A). It was found that overexpression
of CSRP2 increased the levels of the pro-inflammatory cytokines
IL-6, TNF-α and IFN-γ in T98G cells, whereas the levels of the
anti-inflammatory cytokine IL-10 decreased. These cytokines showed
the opposite trend in U251MG cells with CSRP2 knockdown (Fig. 7B).
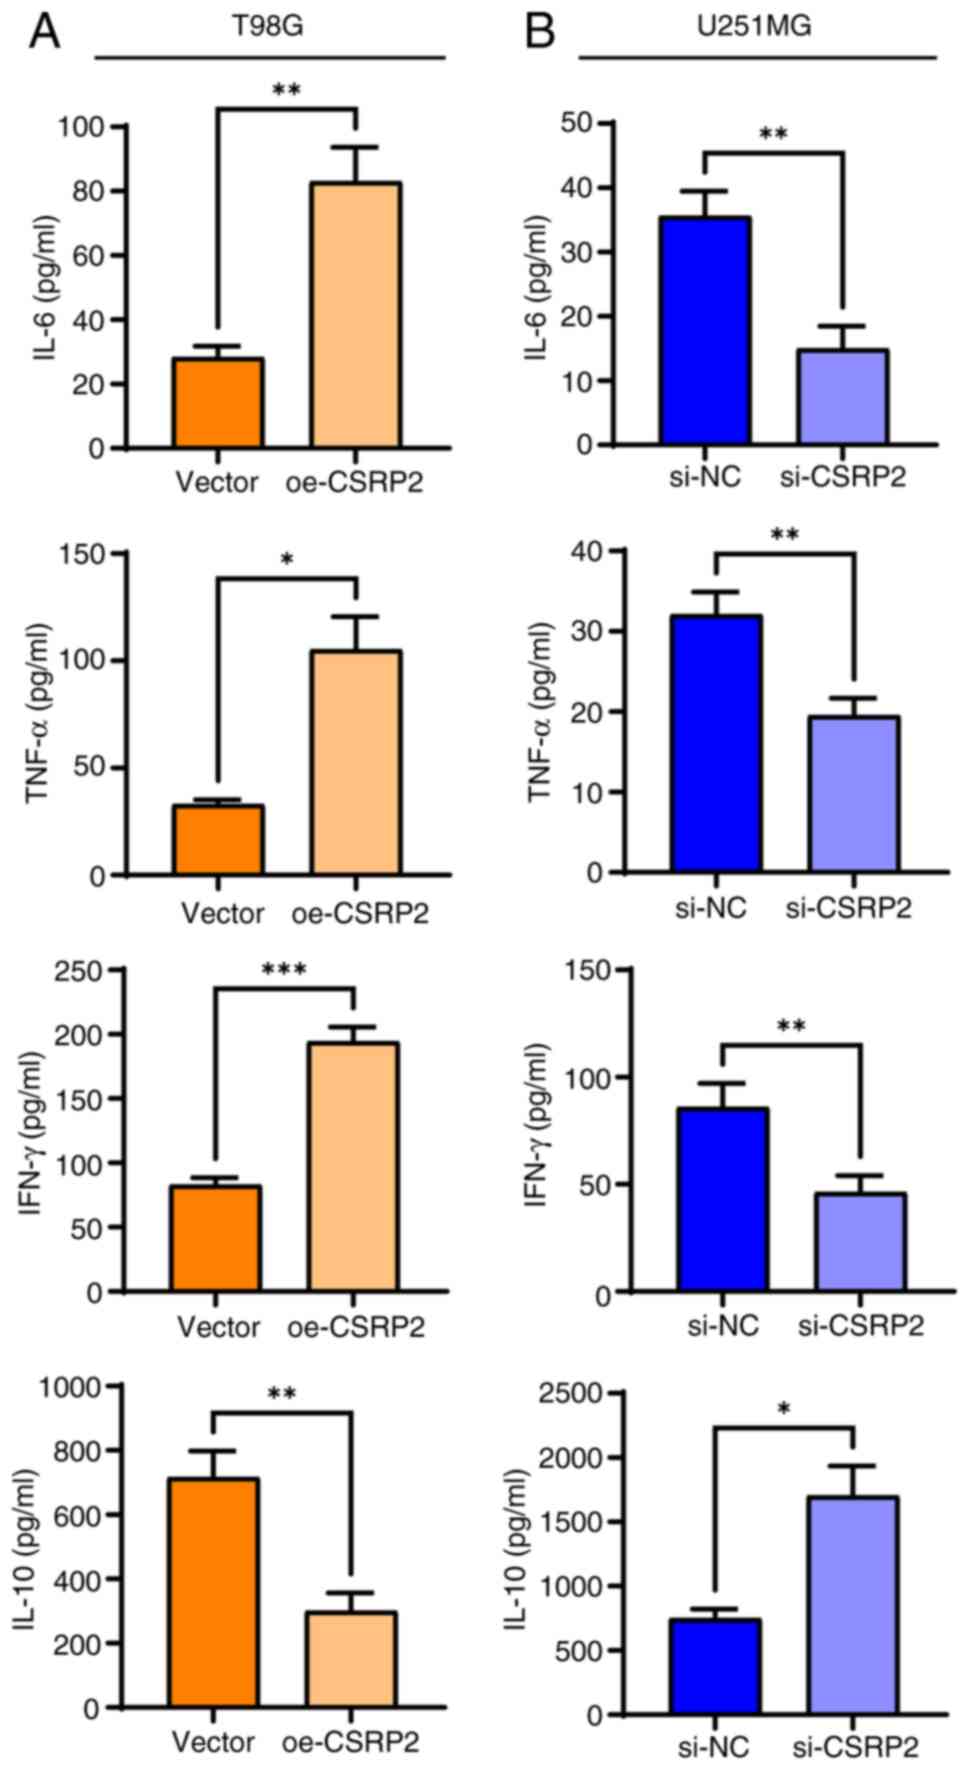 | Figure 7.CSRP2 activates inflammatory response
in glioma cells. (A) Levels of IL-6, TNF-α, IFN-γ and IL-10 in T98G
cells were detected by ELISA. (B) The contents of IL-6, TNF-α,
IFN-γ and IL-10 in U251M cells were detected by ELISA. *P<0.05,
**P<0.01 and ***P<0.001. CSRP2, cysteine- and glycine-rich
protein; si-, small interfering; NC, negative control; oe-,
overexpression; p-, phosphorylated. |
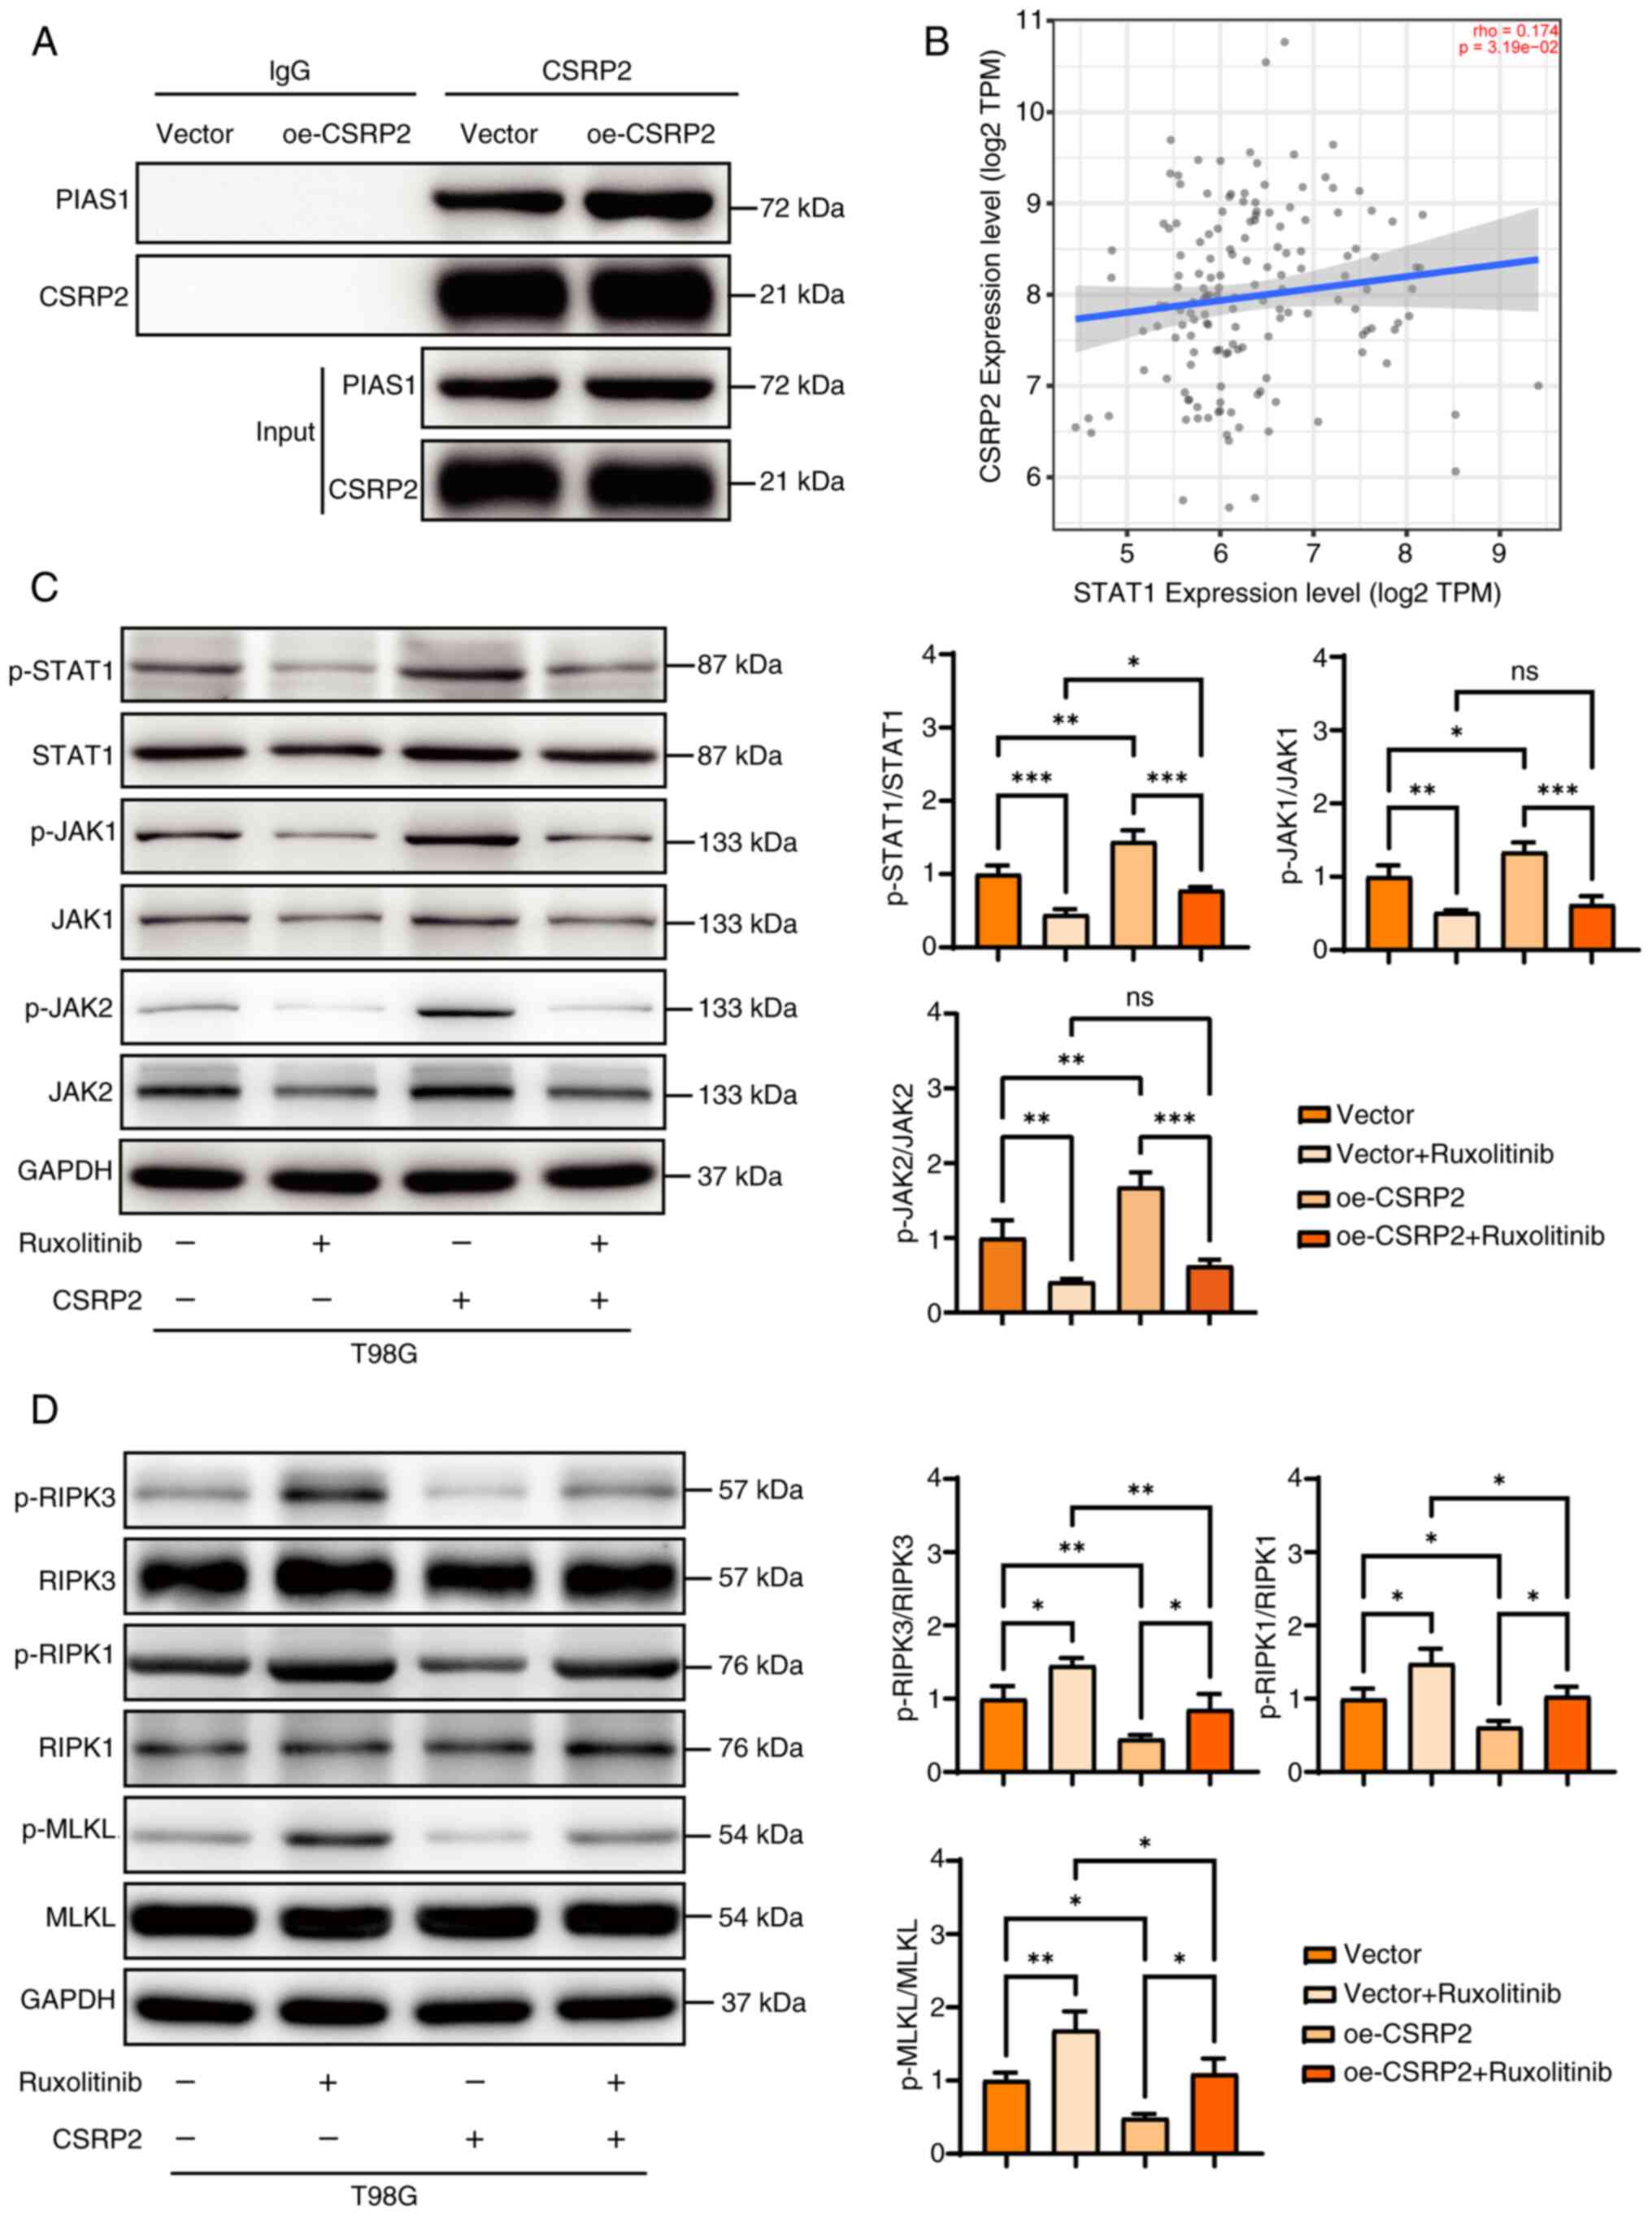
CSRP2 inhibits necroptosis of glioma
cells by activating the JAK-STAT1 signaling pathway
CSRP2 interacts with PIAS1 (17). The binding of CSRP2 to PIAS1 was
further confirmed using Co-IP (Fig.
8A). TIMER 2.0 database analysis showed that the expression of
CSRP2 and STAT1 in glioma was positively correlated (rho=0.174,
P=3.19×10⁻²) (Fig. 8B).
Owing to the weak correlation between these two genes, the
relationship between CSRP2 and the JAK-STAT1 pathway was further
verified using western blotting. Ruxolitinib is a JAK-STAT1 pathway
inhibitor that specifically targets Janus kinase 1 and 2 (JAK1/2).
Overexpression of CSRP2 increased the relative expression of
p-STAT1 and p-JAK1, which recovered after the addition of the
pathway inhibitor Ruxolitinib (Fig.
8C). Simultaneously, the expression levels of p-JAK1, p-JAK2
and p-STAT1 in the pathway were consistent. The expression of
necroptosis-related proteins was further detected using western
blotting (Fig. 8D). It was found
that the inhibitors of the JAK-STAT1 signaling pathway increased
the expression of p-MLKL, p-RIPK1 and p-RIPK3, whereas
overexpression of CSRP2 reduced the expression of these proteins.
Overexpression of CSRP2 and the addition of pathway inhibitors
restored the expression of these proteins to the control level. The
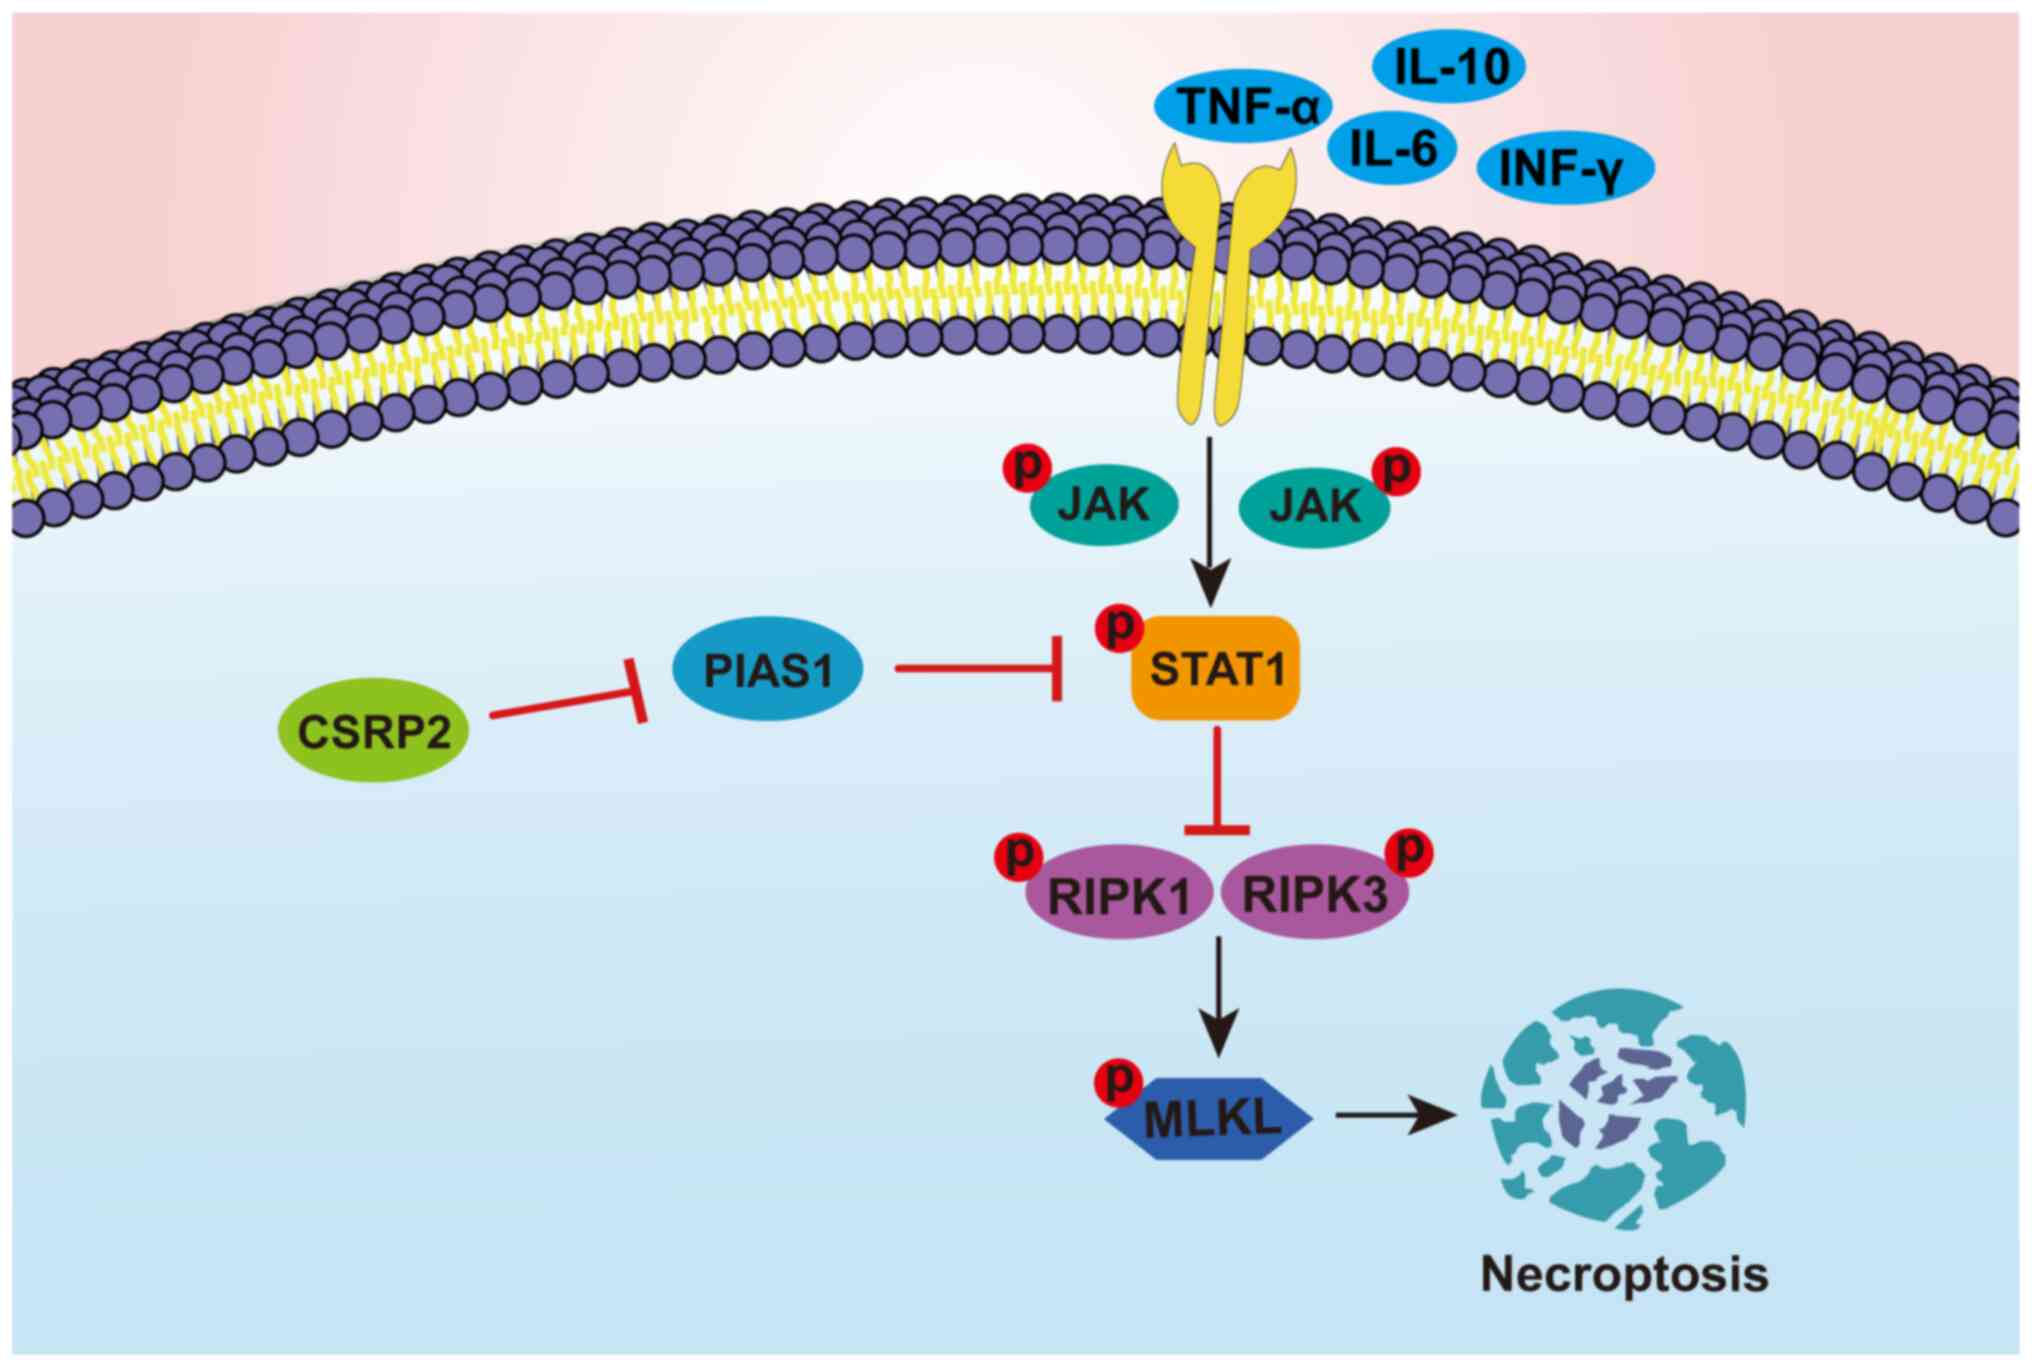
mechanism of CSRP2 involvement in glioma cell necroptosis is
displayed in Fig. 9. It was
hypothesized that CSRP2 inhibits the expression of PIAS1, which
maintains the JAK-STAT1 pathway in an activated state. At this
time, the phosphorylation of the downstream necroptosis-related
proteins RIPK1 and RIPK3 is inhibited, which directly leads to the
phosphorylation of MLKL, thereby inhibiting necroptosis in glioma
cells.
Discussion
There are significant differences in gene expression
between tumors and normal tissues owing to the heterogeneity of
gliomas (18). The present study
showed that CSRP2 is upregulated to varying degrees in grade II–IV
gliomas. Cell experiments further demonstrated that CSRP2 promotes
the proliferation, migration and invasion of U251M and T98G glioma
cells. The mechanism of action of CSRP2 differs among different
tumor types. It was found that in U251M cells with CSRP2 knockdown,
DEGs were enriched in cellular processes, such as necroptosis, and
DEGs were significantly correlated with the JAK-STAT signaling
pathway. Therefore, the molecular mechanisms underlying CSRP2
regulation of glioma necroptosis were analyzed.
Necroptosis is closely associated with the
proliferation and metastasis of tumor cells (19). Necroptosis-related proteins are
upregulated in breast cancer (20),
hepatocellular carcinoma (21) and
gastric cancer (22). Specific
drugs inhibit RIPK3 and promote the proliferation and metastasis of
tumor cells (23). Therefore,
targeting key genes involved in necroptosis may be a new direction
for cancer immunotherapy. Owing to its particularity, necroptosis
is expected to overcome the resistance to apoptosis during
therapy.
PIAS1 binds to STAT1, thereby inhibiting its
transcriptional activation (24).
Weiskirchen et al (17)
reported that CSRP2 binds to PIAS1 and participates in JAK-STAT1
signal transduction. The protein interaction between CSRP2 and
PIAS1 was verified through co-IP and it was found that CSRP2
overexpression promoted the phosphorylation of STAT1, JAK1 and
JAK2. Therefore, it was hypothesized that CSRP2 interacts with
PIAS1 to block the inhibition of PIAS1 on STAT1, thus activating
the JAK-STAT1 signaling pathway.
Typically, the JAK-STAT signaling pathway is
abnormally activated in various malignancies. Cytokines, such as
interleukins and interferons, activate the JAK-STAT pathway via
transmembrane transport into cells (25). The JAK-STAT pathway is involved in
programmed cell death. Activated STAT1 and STAT3 contribute to iron
death by participating in ferrimodulin expression or antioxidant
system regulation (26). After
activation of the JAK-STAT pathway, STAT proteins can enter the
nucleus, bind to the promoter region of specific genes, and promote
the expression of anti-apoptotic genes such as Bcl-2 and Mcl-1,
thus inhibiting the apoptosis of tumor cells (27). CSRP2 was knocked down in U251M cells
and it was found that the DEGs were enriched in cellular processes
such as necroptosis. STAT1 can bind to the necroptosis pathway
protein RIPK3 (28). It was
identified that CSRP2 knockdown promoted necroptosis in U251M
cells, resulting in nuclear condensation and cell membrane rupture,
whereas phosphorylation of necroptosis proteins RIPK1, RIPK3 and
MLKL was inhibited.
In reflecting on the scope and findings of the
present study, it is recognized that while it has shed light on the
role of CSRP2 in glioma and its potential interactions with the
JAK-STAT signaling pathway, there are inherent limitations that
warrant consideration. The analysis utilizing the TIMER database
revealed a modest positive correlation between CSRP2 and STAT1,
suggesting a possible association that may not be as robust as
might be expected for key regulatory elements in glioma
progression. This subtle relationship could indicate that other
factors or pathways may also play significant roles in glioma
biology, which the present study has not fully explored.
Additionally, the research is confined to in vitro models,
and the translation of these findings to in vivo settings
and clinical relevance remains to be established. The sample size,
while sufficient for the analyses conducted, may not capture the
full diversity of glioma patient populations, which could influence
the generalizability of the results. Despite these limitations, the
current study provides a solid foundation for further exploration
into the complex interplay of CSRP2 with other signaling elements
in glioma.
Supplementary Material
Supporting Data
Acknowledgements
Not applicable.
Funding
The present study was supported by the Natural Science
Foundation of Hebei (grant no. H2021206037), the Government-funded
Project on Training of Outstanding Clinical Medical Personnel of
Hebei in 2021 (grant no. 303-16-20-06) and the Medical Research
Project of Hebei Provincial Health Commission (grant no.
20230031).
Availability of data and materials
The data generated in the present study may be
requested from the corresponding author.
Authors' contributions
DL, LiqL and LiaL conceptualized the study. XH, LH
and JL managed and analyzed data. DL conducted investigation and
wrote the original draft. XH, ZS and AZ developed methodology and
performed data visualization. ZS, AZ and LiaL provided resources.
LiaL performed project administration, wrote, reviewed and edited
the manuscript. All authors read and approved the final version of
the manuscript. DL and LiqL confirm the authenticity of all the raw
data.
Ethics approval and consent to
participate
The present study was approved (approval no.
2024-R613) by the Research Ethics Committee of the Second Hospital
of the Hebei Medical University (Shijiazhuang, China). Informed
consent was obtained from all the patients in accordance with the
ethical principles of the Declaration of Helsinki.
Patient consent for publication
Not applicable.
Competing interests
The authors declare that they have no competing
interests.
References
|
1
|
van den Bent MJ, Geurts M, French PJ,
Smits M, Capper D, Bromberg JEC and Chang SM: Primary brain tumours
in adults. Lancet. 402:1564–1579. 2023. View Article : Google Scholar : PubMed/NCBI
|
|
2
|
Weller M, Wen PY, Chang SM, Dirven L, Lim
M, Monje M and Reifenberger G: Glioma. Nat Rev Dis Primers.
10:332024. View Article : Google Scholar : PubMed/NCBI
|
|
3
|
Chai X, Zhang Y, Zhang W, Feng K, Jiang Y,
Zhu A, Chen X, Di L and Wang R: Tumor metabolism: A new field for
the treatment of glioma. Bioconjug Chem. 35:1116–1141. 2024.
View Article : Google Scholar : PubMed/NCBI
|
|
4
|
Obrador E, Moreno-Murciano P,
Oriol-Caballo M, López-Blanch R, Pineda B, Gutiérrez-Arroyo JL,
Loras A, Gonzalez-Bonet LG, Martinez-Cadenas C, Estrela JM and
Marqués-Torrejón MÁ: Glioblastoma therapy: Past, present and
future. Int J Mol Sci. 25:25292024. View Article : Google Scholar : PubMed/NCBI
|
|
5
|
Mishchenko TA, Turubanova VD, Gorshkova
EN, Krysko O, Vedunova MV and Krysko DV: Glioma: Bridging the tumor
microenvironment, patient immune profiles and novel personalized
immunotherapy. Front Immunol. 14:12990642023. View Article : Google Scholar : PubMed/NCBI
|
|
6
|
Weiskirchen R and Günther K: The
CRP/MLP/TLP family of LIM domain proteins: Acting by connecting.
BioEssays. 25:152–162. 2003. View Article : Google Scholar : PubMed/NCBI
|
|
7
|
Schallus T, Fehér K, Ulrich AS, Stier G
and Muhle-Goll C: Structure and dynamics of the human muscle LIM
protein. FEBS Lett. 583:1017–1022. 2009. View Article : Google Scholar : PubMed/NCBI
|
|
8
|
Chang DF, Belaguli NS, Chang J and
Schwartz RJ: LIM-only protein, CRP2, switched on smooth muscle gene
activity in adult cardiac myocytes. Proc Natl Acad Sci U S A.
104:157–162. 2007. View Article : Google Scholar : PubMed/NCBI
|
|
9
|
Wang J, Guan X, Zhang Y, Ge S, Zhang L, Li
H, Wang X, Liu R, Ning T, Deng T, et al: Exosomal miR-27a derived
from gastric cancer cells regulates the transformation of
fibroblasts into cancer-associated fibroblasts. Cell Physiol
Biochem. 49:869–883. 2018. View Article : Google Scholar : PubMed/NCBI
|
|
10
|
Chen CH, Ho YC, Ho HH, Chang IC, Kirsch
KH, Chuang YJ, Layne MD and Yet SF: Cysteine-rich protein 2 alters
p130Cas localization and inhibits vascular smooth muscle cell
migration. Cardiovasc Res. 100:461–471. 2013. View Article : Google Scholar : PubMed/NCBI
|
|
11
|
Wu ML, Chen CH, Lin YT, Jheng YJ, Ho YC,
Yang LT, Chen L, Layne MD and Yet SF: Divergent signaling pathways
cooperatively regulate TGFbeta induction of cysteine-rich protein 2
in vascular smooth muscle cells. Cell Commun Signal. 12:222014.
View Article : Google Scholar : PubMed/NCBI
|
|
12
|
Hoffmann C, Mao X, Brown-Clay J, Moreau F,
Al Absi A, Wurzer H, Sousa B, Schmitt F, Berchem G, Janji B and
Thomas C: Hypoxia promotes breast cancer cell invasion through
HIF-1alpha-mediated up-regulation of the invadopodial actin
bundling protein CSRP2. Sci Rep. 8:101912018. View Article : Google Scholar : PubMed/NCBI
|
|
13
|
Zhang MJ, Liu J, Wan SC, Li JX, Wang S,
Fidele NB, Huang CF and Sun ZJ: CSRP2 promotes cell stemness in
head and neck squamous cell carcinoma. Head Neck. 45:2161–2172.
2023. View Article : Google Scholar : PubMed/NCBI
|
|
14
|
Chen L, Long X, Duan S, Liu X, Chen J, Lan
J, Liu X, Huang W, Geng J and Zhou J: CSRP2 suppresses colorectal
cancer progression via p130Cas/Rac1 axis-meditated ERK, PAK, and
HIPPO signaling pathways. Theranostics. 10:11063–11079. 2020.
View Article : Google Scholar : PubMed/NCBI
|
|
15
|
Livak KJ and Schmittgen TD: Analysis of
relative gene expression data using real-time quantitative PCR and
the 2-(−Delta Delta C(T)) method. Methods. 25:402–408. 2001.
View Article : Google Scholar : PubMed/NCBI
|
|
16
|
Huang J: Current developments of targeting
the p53 signaling pathway for cancer treatment. Pharmacol Ther.
220:1077202021. View Article : Google Scholar : PubMed/NCBI
|
|
17
|
Weiskirchen R, Moser M, Weiskirchen S,
Erdel M, Dahmen S, Buettner R and Gressner AM: LIM-domain protein
cysteine- and glycine-rich protein 2 (CRP2) is a novel marker of
hepatic stellate cells and binding partner of the protein inhibitor
of activated STAT1. Biochem J. 359:485–496. 2001. View Article : Google Scholar : PubMed/NCBI
|
|
18
|
Śledzińska P, Bebyn MG, Furtak J,
Kowalewski J and Lewandowska MA: Prognostic and predictive
biomarkers in gliomas. Int J Mol Sci. 22:103732021. View Article : Google Scholar : PubMed/NCBI
|
|
19
|
Tong X, Tang R, Xiao M, Xu J, Wang W,
Zhang B, Liu J, Yu X and Shi S: Targeting cell death pathways for
cancer therapy: Recent developments in necroptosis, pyroptosis,
ferroptosis, and cuproptosis research. J Hematol Oncol. 15:1742022.
View Article : Google Scholar : PubMed/NCBI
|
|
20
|
Huang FY, Dai SZ, Xu WT, Xiong W, Sun Y,
Huang YH, Wang JY, Lin YY, Chen H, Tan GH and Zheng WP:
3′-epi-12beta-hydroxyfroside-mediated autophagy degradation of
RIPK1/RIPK3 necrosomes leads to anergy of immunogenic cell death in
triple-negative breast cancer cells. Pharmacol Res. 187:1066132023.
View Article : Google Scholar : PubMed/NCBI
|
|
21
|
Pomlok K, Pata S, Kulaphisit M, Pangnuchar
R, Wipasa J, Smith DR, Kasinrerk W and Lithanatudom P: An IgM
monoclonal antibody against domain 1 of CD147 induces non-canonical
RIPK-independent necroptosis in a cell type specific manner in
hepatocellular carcinoma cells. Biochim Biophys Acta Mol Cell Res.
1869:1192952022. View Article : Google Scholar : PubMed/NCBI
|
|
22
|
Vetrivel P, Nachimuthu S, Abuyaseer A,
Bhosale PB, Ha SE, Kim HH, Park MY and Kim GS: Investigation on the
cellular mechanism of prunetin evidenced through next generation
sequencing and bioinformatic approaches against gastric cancer. Sci
Rep. 12:118522022. View Article : Google Scholar : PubMed/NCBI
|
|
23
|
Wang HL, Chang JC, Fang LW, Hsu HF, Lee
LC, Yang JF, Liang MT, Hsiao PC, Wang CP, Wang SW, et al: Bulnesia
sarmientoi supercritical fluid extract exhibits necroptotic effects
and anti-metastatic activity on lung cancer cells. Molecules.
23:33042018. View Article : Google Scholar : PubMed/NCBI
|
|
24
|
Liu B, Mink S, Wong KA, Stein N, Getman C,
Dempsey PW, Wu H and Shuai K: PIAS1 selectively inhibits
interferon-inducible genes and is important in innate immunity. Nat
Immunol. 5:891–898. 2004. View
Article : Google Scholar : PubMed/NCBI
|
|
25
|
Xue C, Yao Q, Gu X, Shi Q, Yuan X, Chu Q,
Bao Z, Lu J and Li L: Evolving cognition of the JAK-STAT signaling
pathway: Autoimmune disorders and cancer. Signal Transduct Target
Ther. 8:2042023. View Article : Google Scholar : PubMed/NCBI
|
|
26
|
Chen Y, Fang ZM, Yi X, Wei X and Jiang DS:
The interaction between ferroptosis and inflammatory signaling
pathways. Cell Death Dis. 14:2052023. View Article : Google Scholar : PubMed/NCBI
|
|
27
|
Vier J, Groth M, Sochalska M and Kirschnek
S: The anti-apoptotic Bcl-2 family protein A1/Bfl-1 regulates
neutrophil survival and homeostasis and is controlled via PI3K and
JAK/STAT signaling. Cell Death Dis. 7:e21032016. View Article : Google Scholar : PubMed/NCBI
|
|
28
|
Yu X, Ma H, Li B, Ji Y, Du Y, Liu S, Li Z,
Hao Y, Tian S, Zhao C, et al: A novel RIPK1 inhibitor reduces GVHD
in mice via a nonimmunosuppressive mechanism that restores
intestinal homeostasis. Blood. 141:1070–1086. 2023. View Article : Google Scholar : PubMed/NCBI
|