Introduction
Since the identification of actin in non-muscle
cells, it has been suggested that the regulation of the mechanical
behaviors of filamentous actin cytoskeleton (F-actin) regulates
cellular shape changes and the generation of forces during cell
migration and division (1–3).
There are different types of F-actin structures that are crucial in
many aspects of cell physiology (4). One of these aspects is the
maintenance of cell shape and polarity, which are important in the
formation of cell-cell junctions. It has been shown that through
the cooperation of junctional actin and F-actin thin bundles, the
overall morphological changes may lead to the development of a
polarized epithelial cell (5).
Atherosclerosis affects the arteries and results in
heart disease and myocardial infarction. Atherosclerosis is caused
by injury to the artery endothelium caused by mechanical and
environmental factors and the resulting inflammatory response in
the vessel wall (6). Previous
clinical and experimental studies have indicated that mild to
moderate increases in the plasma homocysteine concentration are
casual risk factors for vascular disease (7–10).
The link between homocysteine and cardiovascular disease has not
yet been clearly established, and there is no consensus regarding
the mechanism of L-homocysteine-induced endothelial dysfunction
(11). One of the proposed
mechanisms by which homocysteine induces endothelial dysfunction is
vascular cell type-specific oxidative stress, by the formation of
intracellular reactive oxygen species (12).
Similar to epithelial cells, endothelial cells have
specialized junctional regions that are comparable to adherens
junctions and tight junctions. However, whereas in the majority of
epithelial cells tight junctions are concentrated at the more
apical side of the intercellular cleft, in the endothelium they are
frequently intermixed with adherens junctions along the cleft
(13). The actin cytoskeleton and
associated proteins play a vital role in cell-cell adhesion
(14). Through their cytoplasmic
tails, junctional adhesion proteins may bind to cytoskeletal and
signaling proteins, which allows the anchoring of the adhesion
proteins to F-actin and the transfer of intracellular signals
inside the cell (15–18). The association with actin is
required not only for the stabilization of the junctions, but also
for the dynamic regulation of junction opening and closure.
Although the key role of the actin cytoskeleton in the formation
and maintenance of adherens junctions has been recognized due to
the molecular links between cadherins and actin filaments (19–21), the structural organization and
specific role of the actin cytoskeleton at adherens junctions
remain unknown, particularly in endothelial cells (14).
Cultured human origin endothelial cells are widely
used as a tool for in vitro studies of endothelial injury
(22–25). However, primary endothelial cells,
such as human umbilical vein endothelial cells (HUVECs) and
immortalized cell lines are not devoid of certain disadvantages
(26). In the present study, the
EA.hy926 cell line, derived by fusion of HUVECs with the human
epithelial cell line, A549 (27),
was investigated. EA.hy926 cells have been characterized as regards
their morphology and the expression of endothelial-specific
markers, and have proven to be useful in endothelial-based studies
(27–31).
The aim of the present study was to determine the
effect of L-homocysteine on EA.hy926 endothelial cells in the
context of the maintenance cell-cell junctions through the
stabilization of F-actin. The actin filaments were stabilized by
the overexpression of tropomyosin-1, which has the ability to
stabilize actin filaments in muscle and non-muscle cells (32–36).
Materials and methods
Cell culture and treatment
The EA.hy926 immortalized human endothelial cells
(ATCC, CRL-2922) were cultured in monolayer at 37°C in a humidified
CO2 incubator (5% CO2) in DMEM
(Gibco/Invitrogen Life Technologies, Carlsbad, CA, USA) with the
addition of 10% fetal bovine serum (FBS; Gibco/Invitrogen Life
Technologies) and 50 μg/ml of gentamycin (Sigma-Aldrich, St.
Louis, MO, USA). The cells were grown in 6-well plates (Falcon/BD
Biosciences, Bedford, MA, USA) and treated with 12.5, 25 and 50
μM L-homocysteine thiolactone hydrochloride for 24 h. The
control cells were grown under the same conditions without
L-homocysteine treatment.
Plasmid construction
The tropomyosin-1 (α) isoform 1 (NM 001018005) cDNA
was synthesized and subcloned de novo by GeneArt into
QIAgenes Expression Construct Insect/Mammalia (Qiagen, Hilden,
Germany) based on the pQE-TriSystem vector. Confirmed by
restriction analysis and DNA sequencing, transfection-ready and
expression-ready constructs were obtained from Qiagen. For the
negative control, the pQE-TriSystem vector (Qiagen) was used. The
pmaxGFP™ control vector for the assessment of transfection
efficiency was obtained from Lonza (Basel, Switzerland), as a part
of the SE Cell Line 4D-Nucleofector® X kit (Lonza).
Transfection by nucleofection
For the nucleofection of EA.hy926 cells, the cells
were grown up to 80–90% confluency in DMEM (Gibco/Invitrogen Life
Technologies) with the addition of 10% fetal bovine serum (FBS;
Gibco/Invitrogen Life Technologies) and 50 μg/ml of
gentamycin (Sigma-Aldrich). Following trypsinization, the suspended
cells were transfected using the SE Cell Line
4D-Nucleofector® X kit according to the manufacturer’s
instructions. Briefly, a total of 1×10⁶ cells were
resuspended in 100 μl of SE Nucleofector solution, together
with 2 μg of the plasmid DNA: control vector pmaxGFP,
pQE-TriSystem vector or QIAgenes Expression Construct
Insect/Mammalia with cloned cDNA of tropomyosin-1. The mixture was
then transferred into a kit-provided cuvette and the cells were
electroporated using 4D-Nucleofector device (Lonza) with program
DS-120. Transfection efficiency was analyzed on the day of the
experiments by GFP fluorescence intensity analysis using a Tali
Image-based cytometer (Invitrogen/Life Technologies) in the cells
transfected with the pmaxGFP control vector.
Western blot analysis
Semi-quantitative analysis of the post-translational
expression of tropomyosin-1 was performed by western blot analysis.
The EA.hy926 endothelial cells transfected with the pQE-TriSystem
vector or QIAgenes Expression Construct Insect/Mammalia with cloned
cDNA of tropomyosin-1 were lysed with RIPA buffer (Sigma-Aldrich).
Following normalization of the protein concentration using the BCA
protein assay kit (Thermo Scientific Pierce, Rockford, IL, USA) and
absorbace using a spectrophotometer, equal amounts of protein (15
μg of total protein per lane) were separated by 4–12% NuPage
Bis-Tris gel (Novex/Life Technologies) and transferred onto
nitrocellulose membranes using the iBlot dry western blotting
system (Invitrogen/Life Technologies). Pre-stained molecular weight
markers (Thermo Scientific Pierce) were used to estimate the
position of the protein bands. Subsequently, the membranes were
processed using the BenchPro 4100 card processing station
(Invitrogen/Life Technologies). The membranes were blocked with 5%
non-fat milk in TBS-T for 2 h and then incubated with the primary
rabbit anti-tropomyosin-1 (Sigma-Aldrich; 1:250) and rabbit
anti-GADPH (Sigma-Aldrich; 1:5,000) antibodies diluted in TBS-T for
2 h at room temperature. After washing with TBS-T, the membranes
were incubated with the secondary antibodies conjugated with
peroxidase (Sigma-Aldrich; 1:80,000) diluted in TBS-T for 1 h at
room temperature. The immunoreactive bands were visualized by
enhanced chemiluminescence (ECL) on CL-XPosure Film (Thermo
Scientific). After scanning, the densitometry of the bands was
quantified using Quantity One Basic software ver3.6.5 (Bio-Rad,
Hercules, CA, USA).
Cell death analysis
The analysis of cell death was performed using a
Tali Image-based cytometer and a Tali Apoptosis kit
(Invitrogen/Life Technologies) according to manufacturer’s
instructions. Briefly, following trypsinization, the suspended
cells were resuspended in Annexin binding buffer at a concentration
of ~5×10⁵ to 5×10⁶. A total of 5 μl of
Annexin V Alexa Fluor 488 was then added to each 100 μl of
sample and mixed, followed by incubation at room temperature in the
dark for 20 min. The cells were then centrifuged and resuspended in
100 μl of Annexin binding buffer. After the addition of 1
μl of propidium iodide to each sample, the cells were
incubated at room temperature in the dark for 3 min. A total of 25
μl of stained cells were then loaded into a Tali Cellular
Analysis Slide (Invitrogen/Life Technologies). The data were
analyzed using FCS Express Research Edition software ver4.03 (De
Novo Software, Los Angeles, CA, USA) on assumption that viable
cells are both Annexin V Alexa Fluor 488- and propidium
iodide-negative cells; cells that are in early apoptosis are
Annexin V Alexa Fluor 488-positive and propidium iodide-negative;
cells that are in late apoptosis are both Annexin V Alexa Fluor
488- and propidium iodide-positive; whereas necrotic cells are
Annexin V Alexa Fluor 488-negative and propidium
iodide-positive.
In vitro scratch wound healing assay
The EA.hy926 cells transfected with the
pQE-TriSystem vector or QIAgenes Expression Construct
Insect/Mammalia with cloned cDNA of tropomyosin-1 were seeded into
6-well plates (Falcon/BD Biosciences) and grown to confluency. The
cell monolayer was then subjected to a mechanical scratch wound
induced using a 200 μl sterile pipette tip. Cells were then
cultured for an additional period of 24 h in the presence or
absence of 12.5, 25, or 50 μM L-homocysteine thiolactone
hydrochloride. Cells in the injured area were visualized under
phase-contrast optics (×10 objective) using a TE100-U inverted
microscope and photographed using a CCD camera DS-5Mc-U1 and
NIS-Elements software ver3.30 (all from Nikon, Tokyo, Japan). The
wound area was measured at 0, 3, 6, 12 and 24 h after treatment of
the cells with L-homocysteine thiolactone hydrochloride using
ImageJ software ver1.45s (NIH Image).
Fluorescent staining
The EA.hy926 cells transfected with the
pQE-TriSystem vector or QIAgenes Expression Construct
Insect/Mammalia with cloned cDNA of tropomyosin-1 were seeded into
6-well plates (Falcon/BD Biosciences) and grown on glass
coverslips. The cells were then cultured for an additional period
of 24 h in the presence or absence of 12.5, 25, or 50 μM
L-homocysteine thiolactone hydrochloride and fixed with 4%
paraformaldehyde in PBS, pH 7.4 (15 min, room temperature), blocked
in 1% (w/v) BSA/PBS and then double stained for junctional proteins
and F-actin using antibodies and phalloidin conjugates in the
following arrangement: (i) mouse anti-α-catenin (Invitrogen/Life
Technologies), anti-mouse antibody-Alexa Fluor 488 (Invitrogen/Life
Technologies), phalloidin-TRITC (Sigma-Aldrich); (ii) rabbit
anti-β-catenin (Sigma-Aldrich), anti-rabbit antibody-Alexa Fluor
555 (Invitrogen/Life Technologies) and phalloidin-Alexa Fluor 488
(Molecular Probes/Life Technologies); (iii) mouse anti-Zonula
occludens (ZO)-1 (Invitrogen/Life Technologies) anti-mouse
antibody-Alexa Fluor 488 (Invitrogen/Life Technologies),
phalloidin-TRITC (Sigma-Aldrich). Cell nuclei were stained with
DAPI (Sigma-Aldrich). The slides were mounted in Aqua-Poly/Mount
(Polysciences, Inc., Warrington, PA, USA) and examined under a C1
laser-scanning confocal microscope (Nikon) with ×100 oil immersion
objective. The images from triple labeling were simultaneously
collected at the brightest signals of junctional protein using
Nikon EZ-C1 software ver3.80 (Nikon). All acquisition parameters,
including laser power, pixel dwell time and gains, were kept at the
same level for all experiments performed on the same junctional
protein.
Measuring of fluorescence intensity
The measurement of fluorescence intensity of each
junctional protein and F-actin in the EA.hy926 cells overexpressing
tropomyosin-1 and in the cells not overexpressing tropomyosin-1
following treatment with 12.5, 25 and 50 μM L-homocysteine
thiolactone hydrochloride, was performed on confocal images
acquired at the brightest signals of junctional protein at the cell
edge. The fluorescence intensity measurement of α-catenin,
β-catenin and ZO-1 was performed in whole cells and cell-cell
interaction areas using Nikon EZ-C1 software ver3.90 (Gold; Nikon).
The relative fluorescence values of junctional proteins were
calculated by dividing the fluorescence intensity values measured
in the cell-cell interaction areas by the median of the
fluorescence intensity measured in the cell-cell interaction areas
of the control and the cells transfected with the pQE-TriSystem
vector or QIAgenes Expression Construct Insect/Mammalia with cloned
cDNA of tropomyosin-1.
Statistical analysis
The data in this study are presented as the means ±
SEM. A two-way ANOVA analysis was performed for the wound healing
data, and a two-tailed unpaired t-test was utilized to analyze the
statistical significance of the differences between the percentage
of the wound area in the EA.hy926 cells transfected with the
pQE-TriSystem vector or QIAgenes Expression Construct
Insect/Mammalia with cloned cDNA of tropomyosin-1. Statistical
comparisons between 2 groups of fluorescence intensity or cell
death data were performed using a two-tailed Mann-Whitney U test. A
p-value <0.05 was considered to indicate a statistically
significant difference. GraphPad Prism 5.0 (GraphPad Software) was
used for statistical analyses.
Results
Examination of tropomyosin-1
overexpression
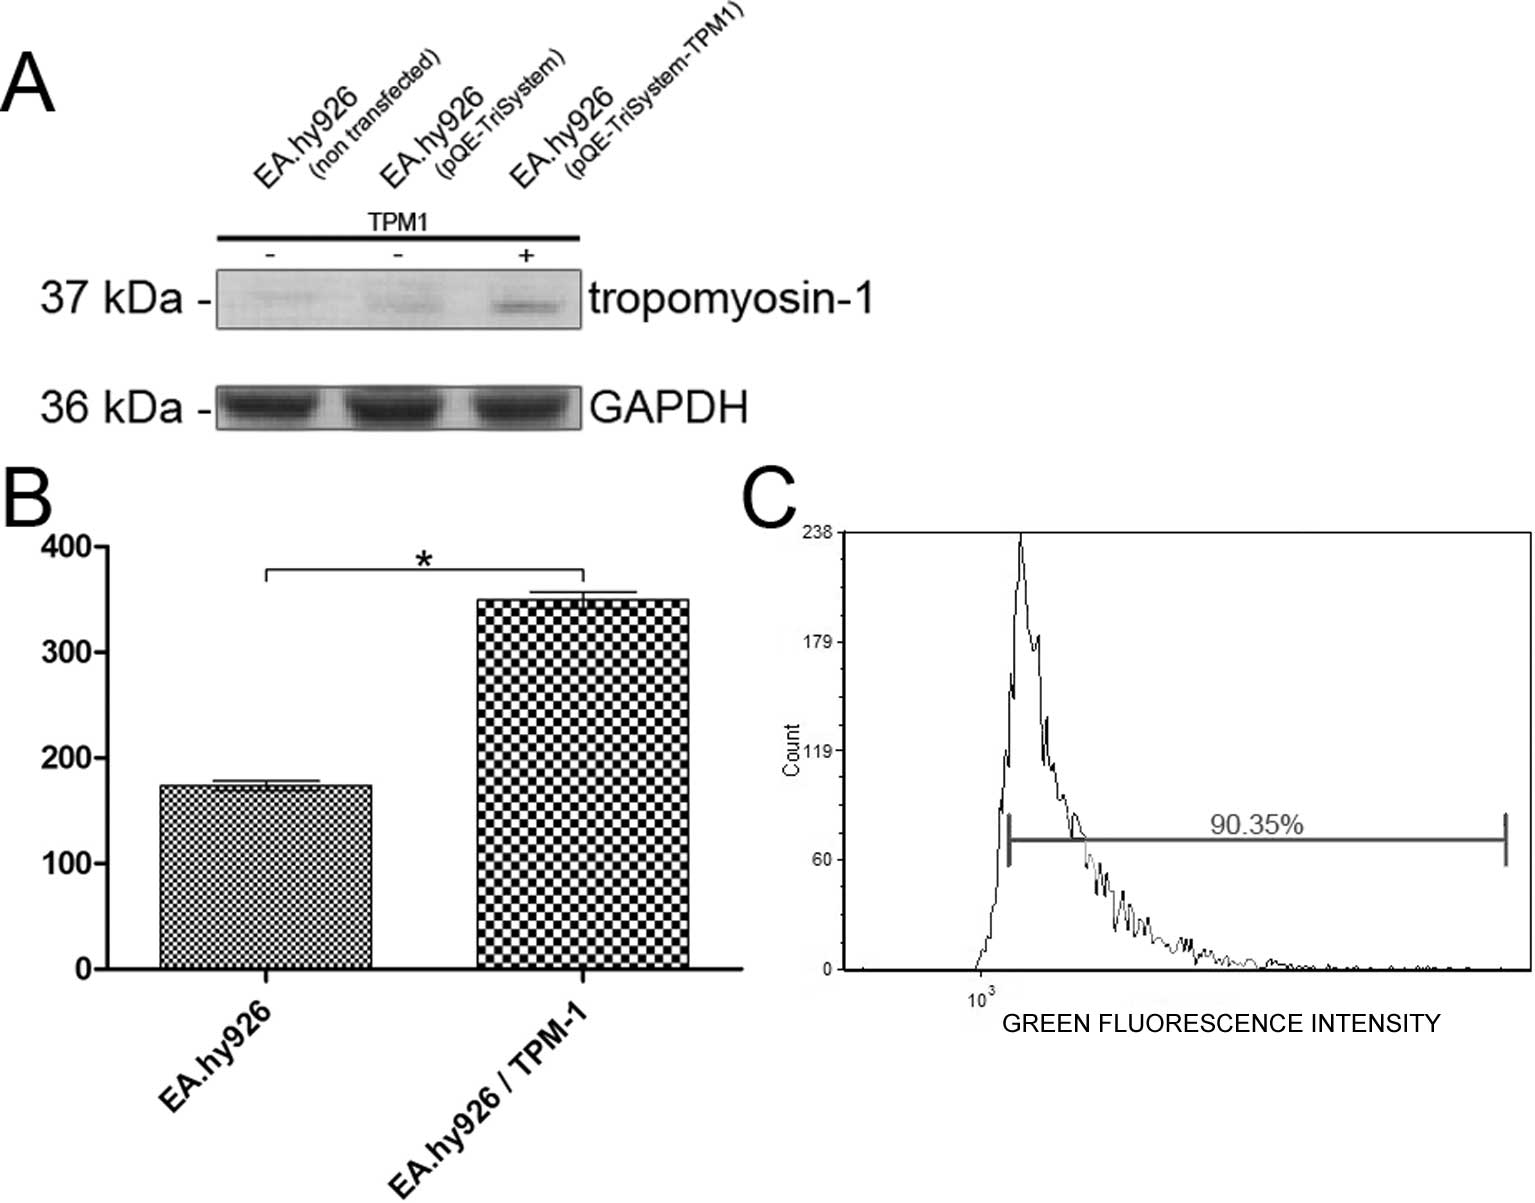
The over-expression of tropomyosin-1 in the EA.hy926
cell line was examined by western blot analysis or the measurement
of fluorescence intensity using specific antibodies. Western blot
analysis showed a 2.16-fold increase in the expression of
tropomyosin-1 in the cells transfected with QIAgenes Expression
Construct Insect/Mammalia compared to the cells transfected with
the empty plasmid (Fig. 1A).
Similarly, the analysis of the fluorescence intensity of
tropomyosin-1 labeled cells revealed a 2.01-fold increase in
tropomyosin-1 fluorescence intensity, compared to that observed in
the cells transfected with the empty pQE-TriSystem vector (Fig. 1B). The transfection efficiency was
analyzed using a Tali Image-based cytometer in the EA.hy926 cells
transfected with the pmaxGFP control vector. The average
transfection efficiency was 88.87% (Fig. 1C).
Analysis of cell death using Annexin V
Alexa Fluor® 488 and propidium iodide assay
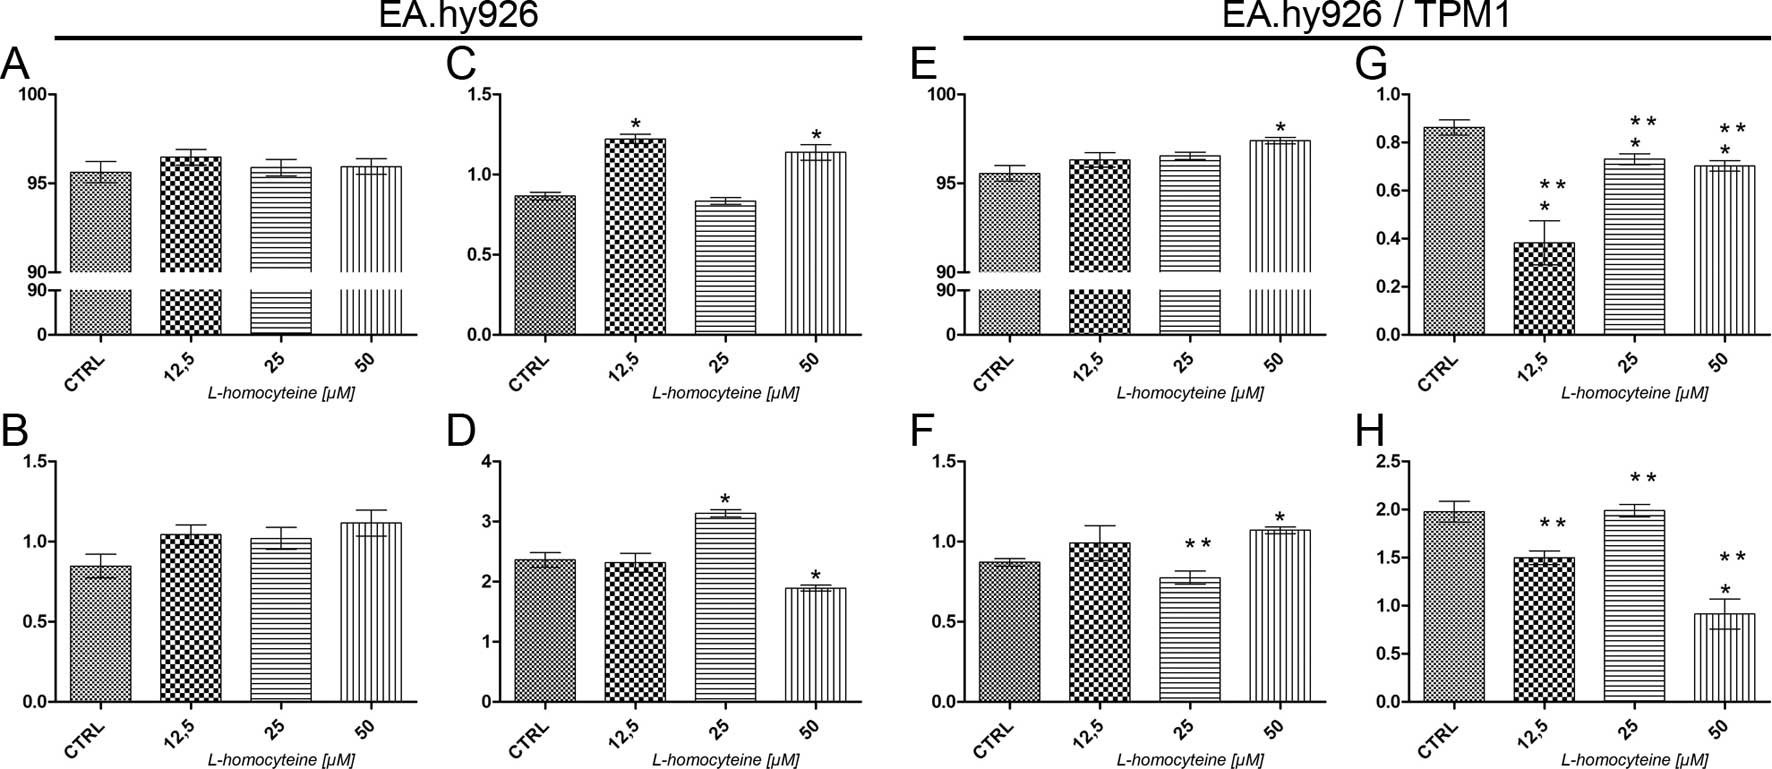
The analysis of cell death was performed using a
Tali Image-based cytometer following Annexin V Alexa
Fluor® 488 and propidium iodide double staining. In the
EA.hy926 cells transfected with the empty plasmid, no statistically
significant differences in the percentage of live and early
apoptotic cells were observed following treatment with all
L-homocysteine doses, as compared to the control (Fig. 2A and B). As regards the percentage
of late apoptotic cells, we observed an increase from 0.86 to 1.22%
(P=0.0284) and 1.14% (P=0.0295) in the cells treated with 12.5 and
50 μM L-homocysteine in comparison to the control,
respectively (Fig. 2C). There was
a statistically significant increase in the percentage of necrotic
cells (from 2.36 to 3.13%, P=0.0284) following treatment with 25
μM L-homocysteine and a decrease in the cells treated with
the dose of 50 μM (to 1.89, P=0.0396) (Fig. 2D).
In the EA.hy926 cells overexpressing plasmid-encoded
tropomyosin-1, a statistically significant increase in the
percentage of live (from 95.56 to 97,40%, P=0.0284) and early
apoptotic cells (from 0.87 to 1.07%, P=0.0284) was observed
following treatment of the cells with 50 μM L-homocysteine,
as compared to the control (Fig. 2E
and F). Moreover, the percentage of late apoptotic cells
decreased following treatment of the cells with all L-homocysteine
doses in comparison to the control (from 0.86 to 0.38%, P=0,0284;
0.73%, P=0.0275; and 0.70%, P=0.0256 for the cells treated with
12.5, 25 and 50 μM L-homocysteine, respectively) (Fig. 2G). There was a statistically
significant decrease in the percentage of necrotic cells following
treatment of the cells with 50 μM L-homocysteine (from 1.98
to 0.91%, P=0.0286) (Fig.
2H).
After an analysis of cell death, the results
demonstrated that due to the overexpression of tropomyosin-1, there
was a statistically significant decrease in the percentage of late
apoptotic and necrotic cells following L-homocysteine treatment as
compared to the cells transfected with the empty plasmid (Fig. 2C, D, G and H). Additionally, there
were no statistically significant differences observed between the
percentage of live cells (Fig. 2A and
E); however, the percentage of early apoptotic cells decreased
following treatment of the cells with 25 μM L-homocysteine
in comparison to the EA.hy926 cells not overexpressing
tropomyosin-1, treated with the same dose of L-homocysteine
(Fig. 2B and F).
Analysis of cell migration using in vitro
scratch wound healing assay
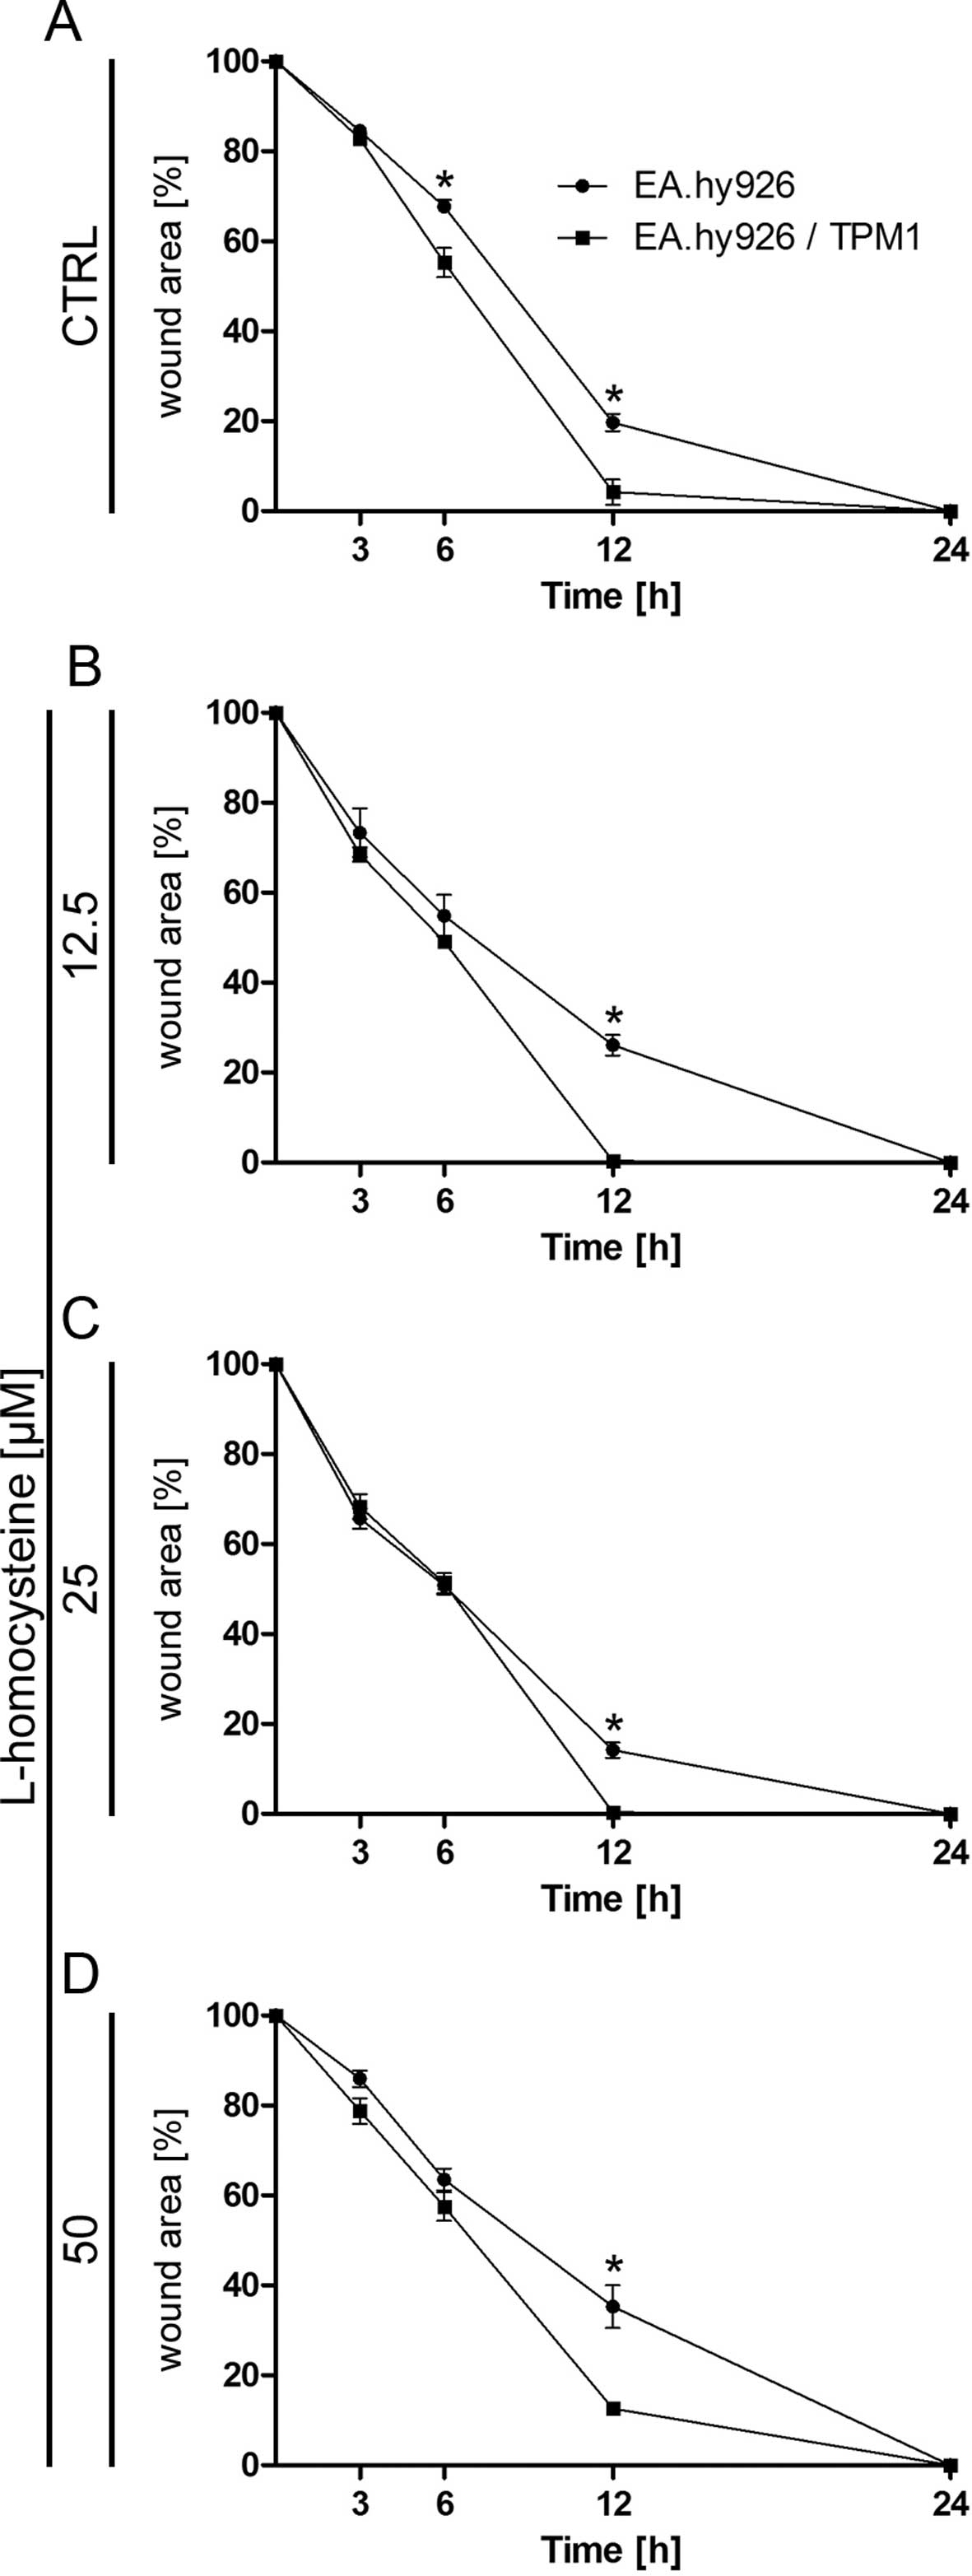
Cell mobility was assessed with a wound healing
assay. The results indicated that, while the wound was almost
completely repaired after 12 h in the EA.hy926 cells overexpressing
plasmid-encoded tropomyosin-1 treated with all used doses of
L-homocysteine, the wound borders were still clearly detectable in
the cells transfected with the empty plasmid. After 24 h, wound
borders were no longer detectable in the EA.hy926 cells
overexpressing tropomyosin-1 and in the cells not overexpressing
tropomyosin-1 (Fig. 3A–D).
Statistical analysis using an unpaired t-test revealed a
significant decrease in the percentage of the wound area in the
control EA.hy926 cells overexpressing tropomyosin-1 and in the
cells not overexpressing tropomyosin-1 after 6 and 12 h from the
time when the wound was formed (from 67.74 to 55.28%, P=0.0250 and
from 19.71 to 4.26%, P=0.0104, respectively) (Fig. 3A). Following treatment of the
cells with L-homocysteine, cell mobility measured as the percentage
of the wound area was also higher in the cells overexpressing
tropomyosin-1, as compared to the cells transfected with the empty
plasmid after 12 h from the time when the wound was formed (from
26.09 to 0.33%, P=0.0004; from 14.20 to 0.40%, P=0.0013; and from
35,29 to 12.62%, P=0.0096 for cells treated with 12.5, 25 and 50
μM L-homocysteine, respectively) (Fig. 3B–D). Moreover, a comparison of the
cells overexpressing tropomyosin-1 and those not overexpressing
tropomyosin-1 using two-way ANOVA indicated that time (duration of
the experiment) played a crucial role in the control cells and the
cells treated with 12.5, 25 and 50 μM L-homocysteine.
Fluorescence staining of α-catenin and
F-actin
The effect of L-homocysteine on the fluorescence
staining of α-catenin and F-actin in the EA.hy926 cells
overexpressing tropomyosin-1 and in those not overexpressing
tropomyosin-1 was investigated using a laser scanning confocal
microscope. The images were acquired in confocal mode at the focal
plane of junctional α-catenin. Fluorescence double staining of
α-catenin and F-actin in the EA.hy926 cells transfected with the
empty plasmid revealed a decrease in fluorescence labeling of
α-catenin following treatment with 12.5, 25 and 50 μM
L-homocysteine, as compared to the control (Fig. 4A, D, G and J). The weakest
labeling intensity of α-catenin was observed following treatment of
the cells with 12.5 μM L-homocysteine (Fig. 4D). By contrast, F-actin labeling
revealed a dose-dependent increase in F-actin fluorescence
following treatment with L-homocysteine in the form of thick stress
fibers (Fig. 4B, E, H and K).
Moreover, the extracellular spaces were reduced in size following
treatment with L-homocysteine in comparison to the control
(Fig. 4A–L).
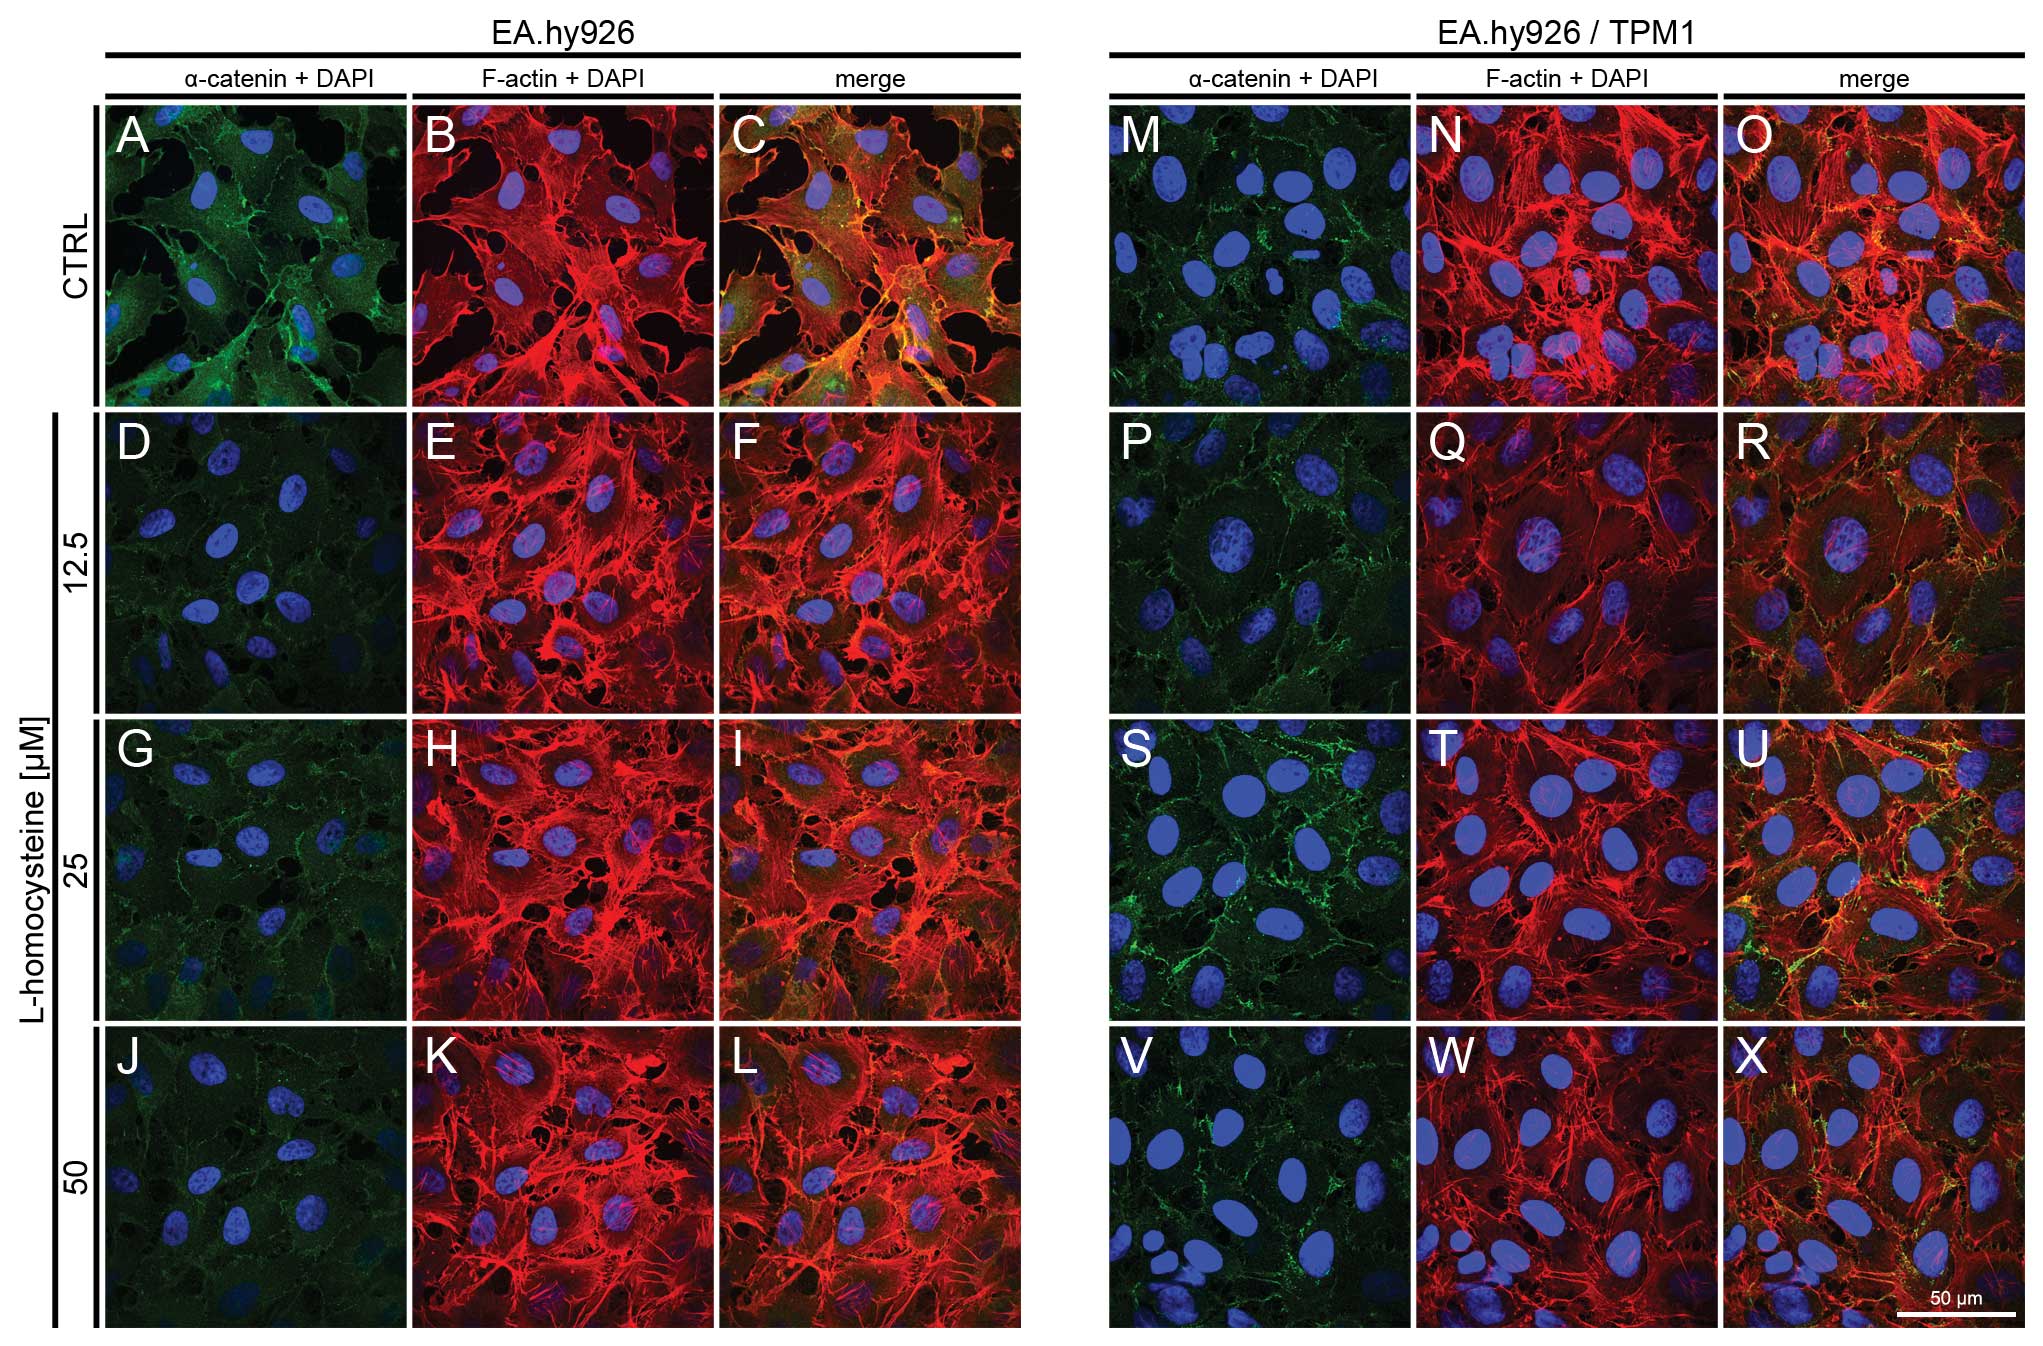 | Figure 4.Effect of L-homocysteine thiolactone
hydrochloride on fluorescence staining of α-catenin and F-actin.
EA.hy926 cells transfected with the empty plasmid or the plasmid
with subcloned cDNA of tropomyosin-1 (α) isoform 1 were treated
with L-homocysteine thiolactone hydrochloride for 24 h, fixed and
double-stained for α-catenin and F-actin. Nuclei were
counterstained with DAPI. Images were captured at the focal plane
of junctional α-catenin under a confocal microscope. Bar, 50
μm. (A–C) Control EA.hy926 cells transfected with the empty
plasmid. (D–F) EA.hy926 cells transfected with the empty plasmid
and treated with 12.5 μM L-homocysteine thiolactone
hydrochloride. (G–I) EA.hy926 cells transfected with the empty
plasmid and treated with 25 μM L-homocysteine thiolactone
hydrochloride. (J–L) EA.hy926 cells transfected with the empty
plasmid and treated with 50 μM L-homocysteine thiolactone
hydrochloride. (M–O) Control EA.hy926 cells transfected with the
plasmid encoding tropomyosin-1 (α) isoform 1. (P–R) EA.hy926 cells
transfected with the plasmid encoding tropomyosin-1 (α) isoform 1
and treated with 12.5 μM L-homocysteine thiolactone
hydrochloride. (S–U) EA.hy926 cells transfected with the plasmid
encoding tropomyosin-1 (α) isoform 1 and treated with 25 μM
L-homocysteine thiolactone hydrochloride. (V–X) EA.hy926 cells
transfected with the plasmid encoding tropomyosin-1 (α) isoform 1
and treated with 50 μM L-homocysteine thiolactone
hydrochloride. (A, D, G and J; M, P, S and V) α-catenin + DAPI. (B,
E, H and K; N, Q, T and W) F-actin + DAPI. (C, F, I and L; O, R, U
and X) Merge. TPM1, tropomyosin-1. |
In the EA.hy926 cells with stabilized F-actin
cytoskeleton by the overexpression of tropomyosin-1, the labeling
of α-catenin following exposure of the cells to L-homocysteine was
also decreased in comparison to the control and EA.hy926 cells
transfected with the empty plasmid (Fig. 4M, P, S and V). However, α-catenin
fluorescence at the cell periphery area was increased, as compared
to the cells without stabilization of F-actin by tropomyosin-1
(Fig. 4M, P, S and V). Following
the stabilization of F-actin, α-catenin fluorescence decreased
after treatment with L-homocysteine and stress fibers were thinner
than those observed in the control cells and in the cells
transfected with the empty plasmid (Fig. 4N, Q, T and W). Additionally, the
extracellular spaces were significantly reduced following F-actin
stabilization (Fig. 4A–X).
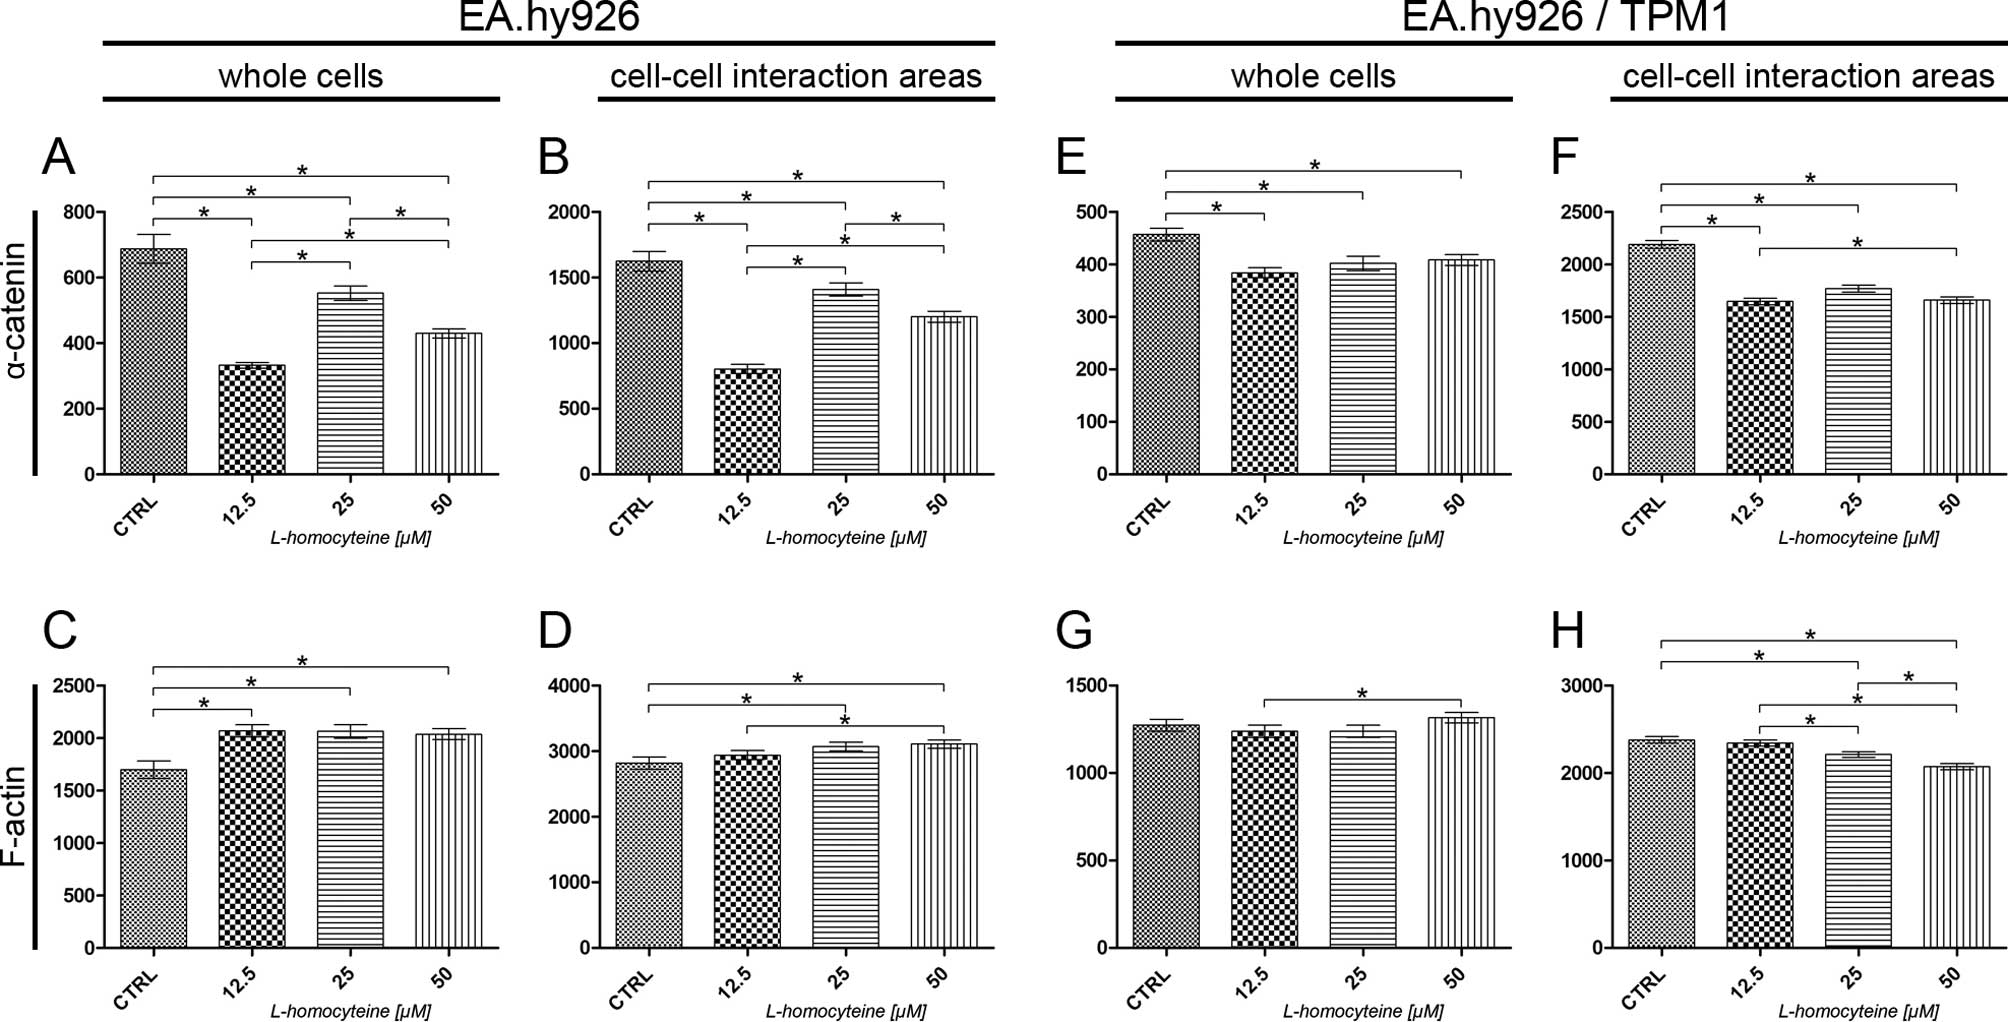
The measurement of fluorescence intensity of
α-catenin and F-actin in the EA.hy926 cells and the cells
overexpressing tropomyosin-1 was performed on confocal images
acquired at the focal plane of α-catenin. The fluorescence
intensity of F-actin and α-catenin was measured in whole cells and
in cell-cell interaction areas, at the focal plane of α-catenin.
The analysis of the fluorescence intensity of α-catenin measured in
whole EA.hy926 cells transfected with the empty plasmid revealed a
statistically significant decrease in comparison to the control
(from 687.18 to 332.00, P<0.0001; 552.23, P=0.0148; and 429.41,
P<0.0001 for the cells treated with 12.5, 25 and 50 μM
L-homocysteine, respectively). Additionally, statistically
significant differences were obsereved when comparing the different
groups (Fig. 5A). The same
correlation was observed after the measurement of α-catenin
fluorescence intensity in the cell-cell interaction areas, although
the values were 2.36- to 2.70-fold higher (Fig. 5B). There was a statistically
significant increase in the fluorescence intensity of F-actin
measured in whole cells following treatment of the cells with
L-homocysteine in comparison to the control (from 1698.91 to
2067.32, P=0.0021; 2063.77, P=0.0012; and 2037.07, P=0.0019 for the
cells treated with 12.5, 25 and 50 μM L-homocysteine,
respectively). The differences between L-homocysteine doses were
not statistically significant (Fig.
5C). F-actin fluorescence intensity in the cell-cell
interaction areas was statistically significant higher in the cells
treated with 25 and 50 μM L-homocysteine, as compared to the
control (from 2818.09 to 3069.35, P=0.0209 and 3106.83, P=0.0066,
respectively). Furthermore, a comparison of the results of F-actin
fluorescence intensity measured in the cell-cell interaction areas
revealed statistically significant differences between the cells
treated with 12.5 and 50 μM L-homocysteine (Fig. 5D).
Similar to the results obtained for the cells
transfected with the empty plasmid, the measurement of the
fluorescence intensity of α-catenin in whole EA.hy926 cells
overexpressing tropomyosin-1 revealed a statistically significant
decrease following treatment with L-homocysteine in comparison to
the control (from 456.93 to 383.97, P<0.0001; 401.91, P=0.0021;
and 408.35, P=0.0016 for cells treated with 12.5, 25 and 50
μM L-homocysteine, respectively). The differences between
the results obtained from the groups of cells treated with
L-homocysteine were statistically insignificant. Moreover, the
α-catenin fluorescence intensity measured in whole cells with
stabilized F-actin cytoskeleton was decreased in comparison to that
measured in cells transfected with the empty plasmid (Fig. 5E). The same correlation was
observed after the measurement of α-catenin fluorescence intensity
in the cell-cell interaction areas (decrease in fluorescence
intensity from 2189.76 to 1646.73, P<0.0001; 1767.05,
P<0.0001; and 1658.60, P<0.0001 for the cells treated with
12.5, 25 and 50 μM L-homocysteine, respectively); however, a
statistically significant difference was observed between the
results obtained for the cells treated with 12.5 and 50 μM
L-homocysteine. Furthermore, the fluorescence intensity of
α-catenin measured in the cell-cell interaction areas of EA.hy926
cells with stabilized F-actin cytoskeleton by the overexpression of
tropomyosin-1 increased 1.25- to 2.05-fold, as compared to the
values measured in the cell-cell interaction area of the cells
transfected with the empty plasmid (Fig. 5F).
The measurement of F-actin fluorescence intensity in
whole cells overexpressing tropomyosin-1 did not reveal any
statistically significant differences, as compared to the control.
A comparison of the results of the measurement of F-actin
fluorescence intensity following treatment with L-homocysteine
revealed statistically significant differences between the cells
treated with 12.5 and 50 μM L-homocysteine (1237.81 and
1316.38, P=0.0395, respectively) (Fig. 5G). In contrast to the results
obtained for the cells transfected with the empty plasmid, there
was a statistically significant decrease in the F-actin
fluorescence intensity in the cell-cell interaction areas of the
cells overexpressing tropomyosin-1 in the cells treated with 25 and
50 μM L-homocysteine, as compared to the control (from
2379.86 to 2210.09, P=0.0006; and 2070.97, P<0.0001,
respectively). Furthermore, a comparison of the results of F-actin
fluorescence intensity measured in the cell-cell interaction areas
revealed statistically significant differences between the cells
treated with all L-homocysteine doses. Additionally, the
fluorescence intensity of F-actin measured in the cell-cell
interaction areas of the transfected cells decreased by 0.67- to
0.84-fold, as compared to the cells transfected with the empty
plasmid (Fig. 5H).
Fluorescence staining of β-catenin and
F-actin
The effect of L-homocysteine on the fluorescence
staining of β-catenin and F-actin in the EA.hy926 cells
overexpressing tropomyosin-1 and in those not overexpressing
tropomyosin-1 was investigated using a laser scanning confocal
microscope. The images were acquired in confocal mode at the focal
plane of junctional β-catenin. Fluorescence double staining of
β-catenin and F-actin in the EA.hy926 cells transfected with the
empty plasmid revealed an increase in the fluorescence labeling of
β-catenin following treatment with all doses of L-homocysteine in
comparison to the control (Fig. 6A,
D, G and J). The weakest labeling intensity was observed in the
control cells, and the fluorescence at the cell periphery area was
only slightly higher than that in the central area of the cells
(Fig. 6A). Similar to the results
obtained at the focal plane of α-catenin, F-actin labeling revealed
a dose-dependent increase in fluorescence following treatment with
L-homocysteine in the form of thick stress fibers (Fig. 6B, E, H and K), and the
extracellular spaces were reduced in size following treatment with
L-homocysteine in comparison to the control (Fig. 6A–X).
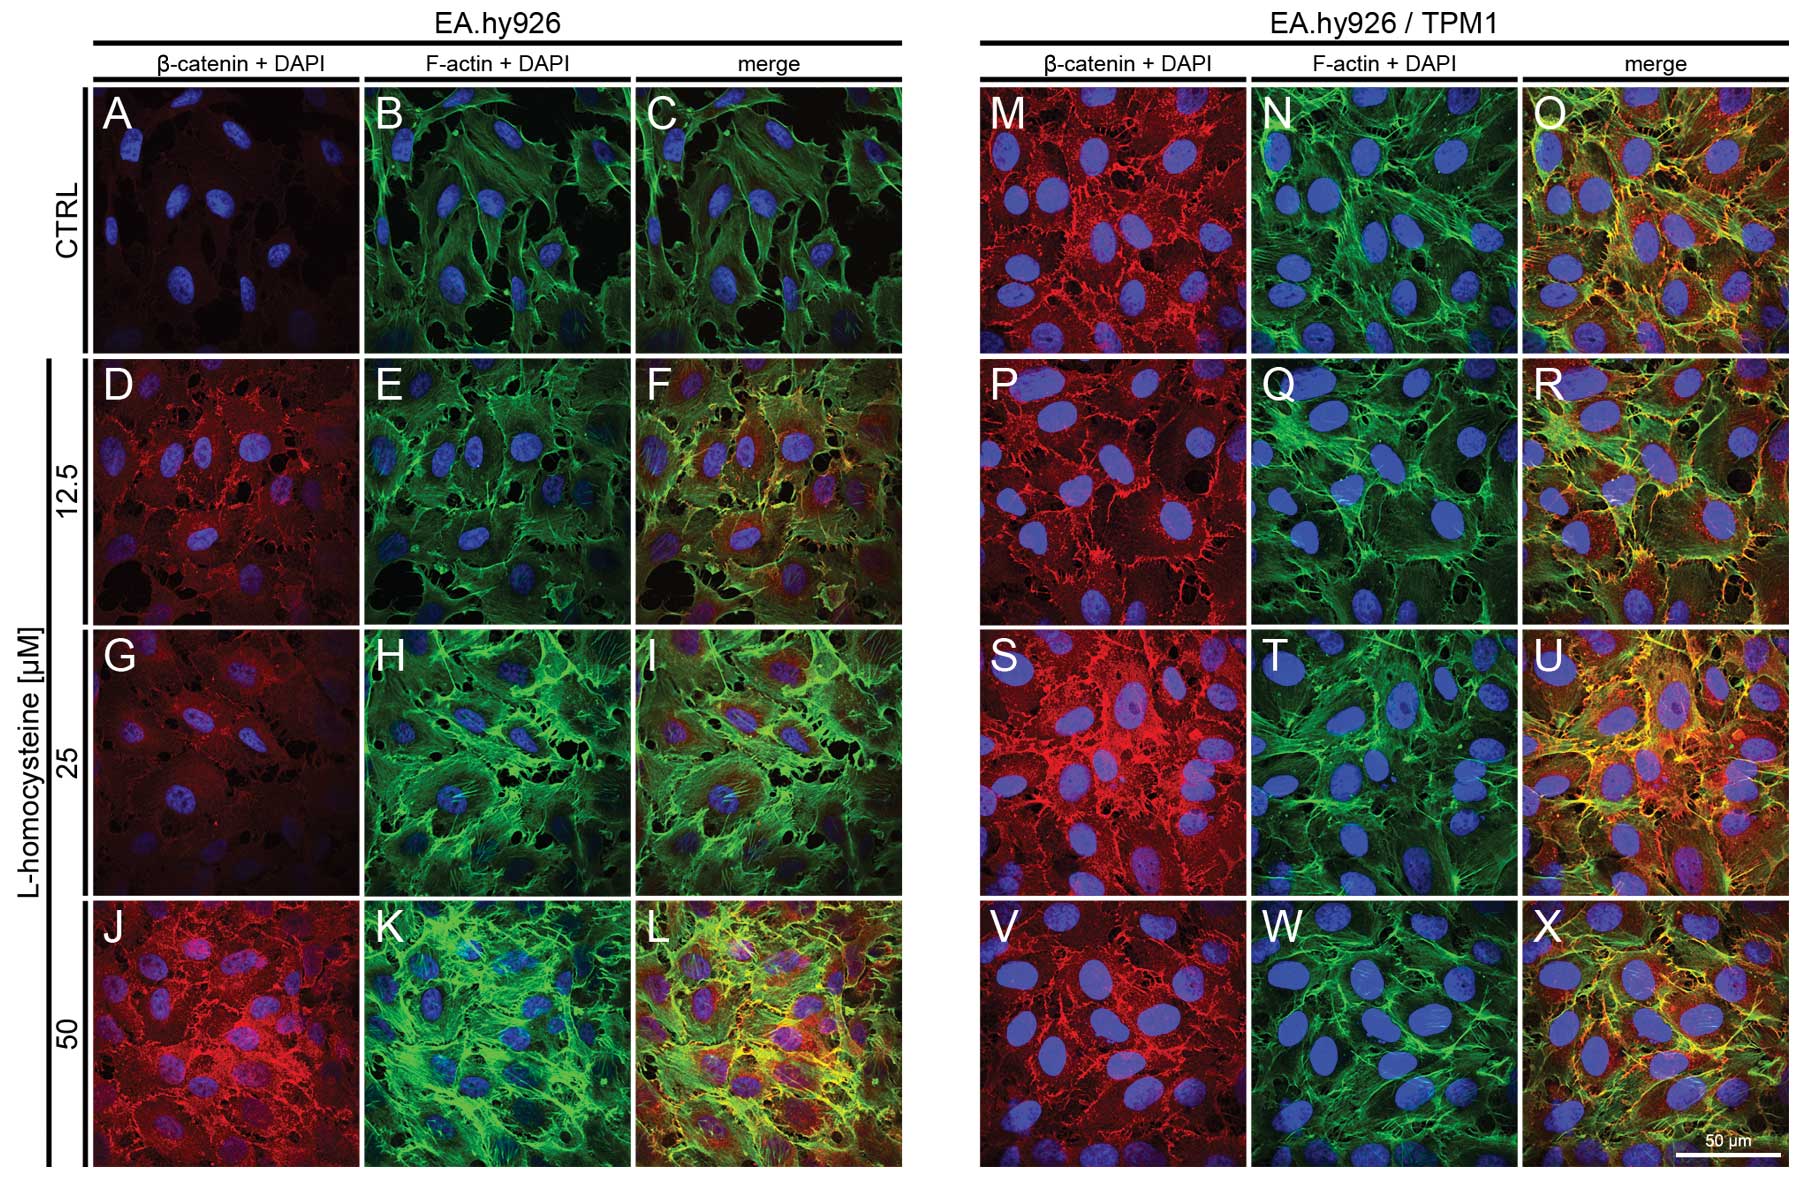 | Figure 6.Effect of L-homocysteine thiolactone
hydrochloride on fluorescence staining of β-catenin and F-actin.
EA.hy926 cells transfected with the empty plasmid or the plasmid
with subcloned cDNA of tropomyosin-1 (α) isoform 1 were treated
with L-homocysteine thiolactone hydrochloride for 24 h, fixed and
double-stained for the β-catenin and F-actin. Nuclei were
counterstained with DAPI. Images were captured at the focal plane
of junctional β-catenin under a confocal microscope. Bar, 50
μm. (A–C) Control EA.hy926 cells transfected with the empty
plasmid. (D–F) EA.hy926 cells transfected with the empty plasmid
and treated with 12.5 μM L-homocysteine thiolactone
hydrochloride. (G–I) EA.hy926 cells transfected with the empty
plasmid and treated with 25 μM L-homocysteine thiolactone
hydrochloride. (J–L) EA.hy926 cells transfected with the empty
plasmid and treated with 50 μM L-homocysteine thiolactone
hydrochloride. (M–O) Control EA.hy926 cells transfected with the
plasmid encoding tropomyosin-1 (α) isoform 1. (P–R) EA.hy926 cells
transfected with the plasmid encoding tropomyosin-1 (α) isoform 1
and treated with 12.5 μM L-homocysteine thiolactone
hydrochloride. (S–U) EA.hy926 cells transfected with the plasmid
encoding tropomyosin-1 (α) isoform 1 and treated with 25 μM
L-homocysteine thiolactone hydrochloride. (V–X) EA.hy926 cells
transfected with the plasmid encoding tropomyosin-1 (α) isoform 1
and treated with 50 μM L-homocysteine thiolactone
hydrochloride. (A, D, G and J; M, P, S and V) β-catenin + DAPI. (B,
E, H and K; N, Q, T and W) F-actin + DAPI. (C, F, I and L; O, R, U
and X) Merge. TPM1, tropomyosin-1. |
In the EA.hy926 cells with stabilized F-actin
cytoskeleton by the overexpression of tropomyosin-1, the labeling
of β-catenin following exposure of the cells to L-homocysteine was
increased in comparison to the control and treated cells,
particularly at the doses of 25 and 50 μM L-homocysteine.
Moreover, the fluorescence of β-catenin was significantly higher in
the control and the cells treated with 12.5 and 25 μM
L-homocysteine, as compared to the EA.hy926 cells transfected with
the empty plasmid. However, β-catenin fluorescence at the cell
periphery area was increased in the cells overexpressing
tropomyosin-1 compared to the cells not overexpressing
tropomyosin-1 (Fig. 6M, P, S and
V). Following the stabilization of F-actin, β-catenin
fluorescence was at a similar level in control and in the cells
treated with L-homocysteine. Moreover, stress fibers were thinner
than those observed in the control cells and the cells transfected
with the empty plasmid (Fig. 6N, Q, T
and W). Additionally, the extracellular spaces were
significantly reduced following F-actin stabilization, as compared
to the cells transfected with the empty plasmid (Fig. 6A–X).
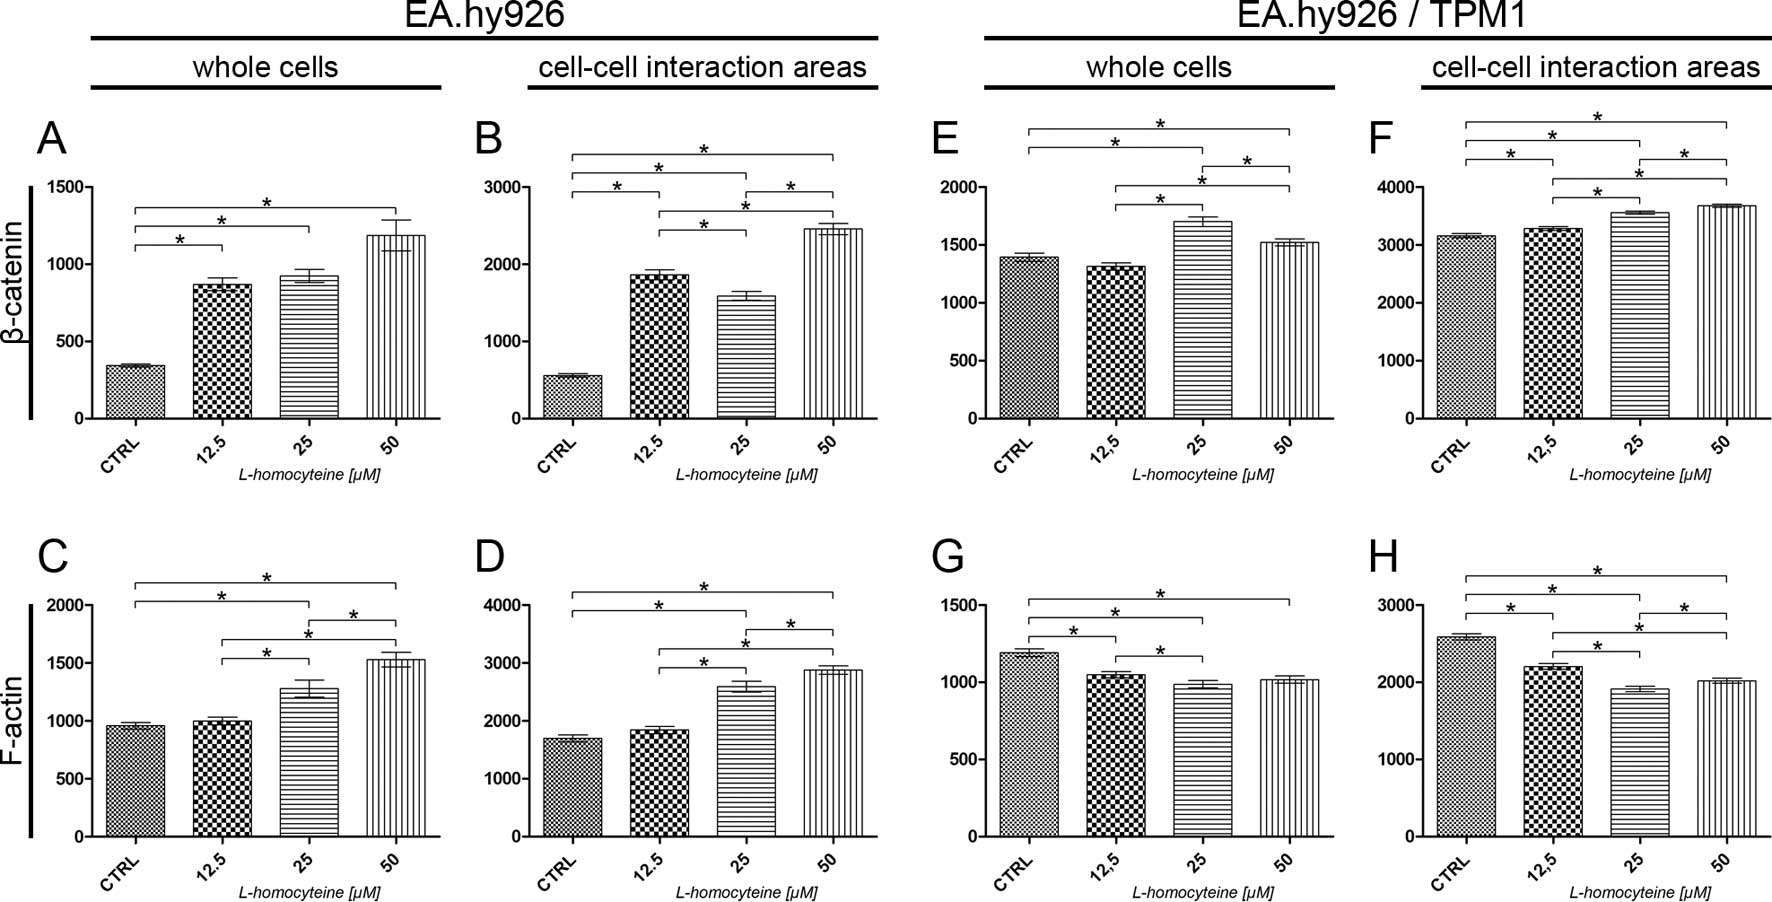
The measurement of fluorescence intensity of
β-catenin and F-actin in the EA.hy926 cells overexpressing
tropomyosin-1 and in those not overexpressing tropomyosin-1 was
performed on confocal images acquired at the focal plane of
β-catenin. The fluorescence intensity of F-actin and β-catenin was
measured in whole cells and in the cell-cell interaction areas, at
the focal plane of β-catenin. The analysis of the fluorescence
intensity of β-catenin measured in whole EA.hy926 cells transfected
with the empty plasmid revealed a statistically significant
dose-dependent increase in comparison to the control (from 343.79
to 868.79, P<0.0001; 923.96, P<0.0001; and 1185.90,
P<0.0001 for cells treated with 12.5, 25 and 50 μM
L-homocysteine, respectively). The differences between
L-homocysteine doses were statistically insignificant (Fig. 7A). A similar increase in β-catenin
fluorescence in comparison to the control was observed after the
measurement of its intensity in the cell-cell interaction areas;
however, the values were statistically significant between the
L-homocysteine doses used (Fig.
7B). Additionally, the results of the measurement of β-catenin
fluorescence intensity in the cell-cell interaction areas were
1.63- to 2.14-fold higher than the values obtained from whole
cells. There was a statistically significant increase in
fluorescence intensity of F-actin measured in whole cells following
treatment of the cells with 25 and 50 μM L-homocysteine in
comparison to the control (from 956.89 to 1278.88, P=0.0002; and
1528.29, P<0.0001, respectively). Moreover, the differences
between L-homocysteine doses were statistically significant
(Fig. 7C). A similar correlation
was observed in F-actin intensity measured in the cell-cell
interaction areas; however, the fluorescence intensity was 1.77- to
2.02-fold higher than the intensity measured in whole cells
(Fig. 7D).
Analysis of the fluorescence intensity of β-catenin
measured in whole EA.hy926 cells overexpressing tropomyosin-1
revealed a statistically significant increase only in the cells
treated with 25 and 50 μM L-homocysteine, as compared to the
control (from 1293.70 to 1700.32, P<0.0001; and 1522,22
P=0.0150, respectively). However, statistically significant
differences between L-homocysteine doses were observed.
Additionally, the fluorescence intensity values were significantly
higher (1.28- to 4.05-fold) than those in the cells transfected
with the empty plasmid (Fig. 7E).
The fluorescence intensity measured in the cell-cell interaction
areas increased in a dose-dependent manner following the
stabilization of F-actin cytoskeleton by tropomyosin-1 in the
EA.hy926 cells (from 3157.99 to 3283.89, P=0.0026; 3557.68,
P<0.0001; and 3675.25, P<0.0001 for the cells treated with
12.5, 25 and 50 μM L-homocysteine, respectively).
Furthermore, statistically significant differences between the
L-homocysteine doses were observed. Similar to the results obtained
by measurements in whole cells, the cell-cell interaction areas
exhibited significantly higher β-catenin fluorescence intensity
than that observed in the cells without stabilized F-actin (1.50-
to 5.64-fold); however, these values were 2.09- to 2.41-fold higher
than those obtained from measurements in whole cells overexpressing
tropomyosin-1 (Fig. 7F).
The measurement of F-actin fluorescence intensity at
focal plane of β-catenin in whole cells overexpressing
tropomyosin-1 revealed a statistically significant decrease, as
compared to the control (from 1191.57 to 1048.44, P<0.0001;
986.88, P<0.0001; and 1017.10, P<0.0001 for the cells treated
with 12.5, 25 and 50 μM L-homocysteine, respectively). A
comparison of the results of the measurement of F-actin
fluorescence intensity following treatment with L-homocysteine
revealed statistically significant differences only between the
cells treated with 12.5 and 50 μM L-homocysteine (P=0.0420)
(Fig. 7G). A similar correlation
was observed in F-actin intensity measured in the cell-cell
interaction areas; however, the fluorescence intensity was 1.93- to
2.17-fold higher than the intensity measured in whole cells.
Moreover, statistically significant differences between F-actin
fluorescence measured in the cells treated with L-homocysteine were
observed (Fig. 7H).
Fluorescence staining of ZO-1 and
F-actin
The effect of L-homocysteine on the fluorescence
staining of ZO-1 and F-actin in the EA.hy926 cells overexpressing
tropomyosin-1 and in those not overexpressing tropomyosin-1 was
investigated using a laser scanning confocal microscope. The images
were acquired in confocal mode at the focal plane of junctional
ZO-1. Fluorescence double staining of ZO-1 and F-actin in the
EA.hy926 cells transfected with the empty plasmid revealed an
increase in the fluorescence labeling of ZO-1 following treatment
with all doses of L-homocysteine in comparison to the control
(Fig. 8A, D, G and J). The
weakest labeling intensity was observed in the control cells, the
ZO-1 fluorescence at the cell periphery area was only slightly
higher than that in the central area of the cells (Fig. 8A). Similarly, F-actin labeling at
the focal plane of ZO-1 revealed a dose-dependent increase in
fluorescence following treatment with L-homocysteine in the form of
thick stress fibers, particularly at the doses of 25 and 50
μM L-homocysteine (Fig. 8B, E,
H and K). Furthermore, the extracellular spaces were reduced in
size following treatment with L-homocysteine in comparison to the
control (Fig. 8A–L).
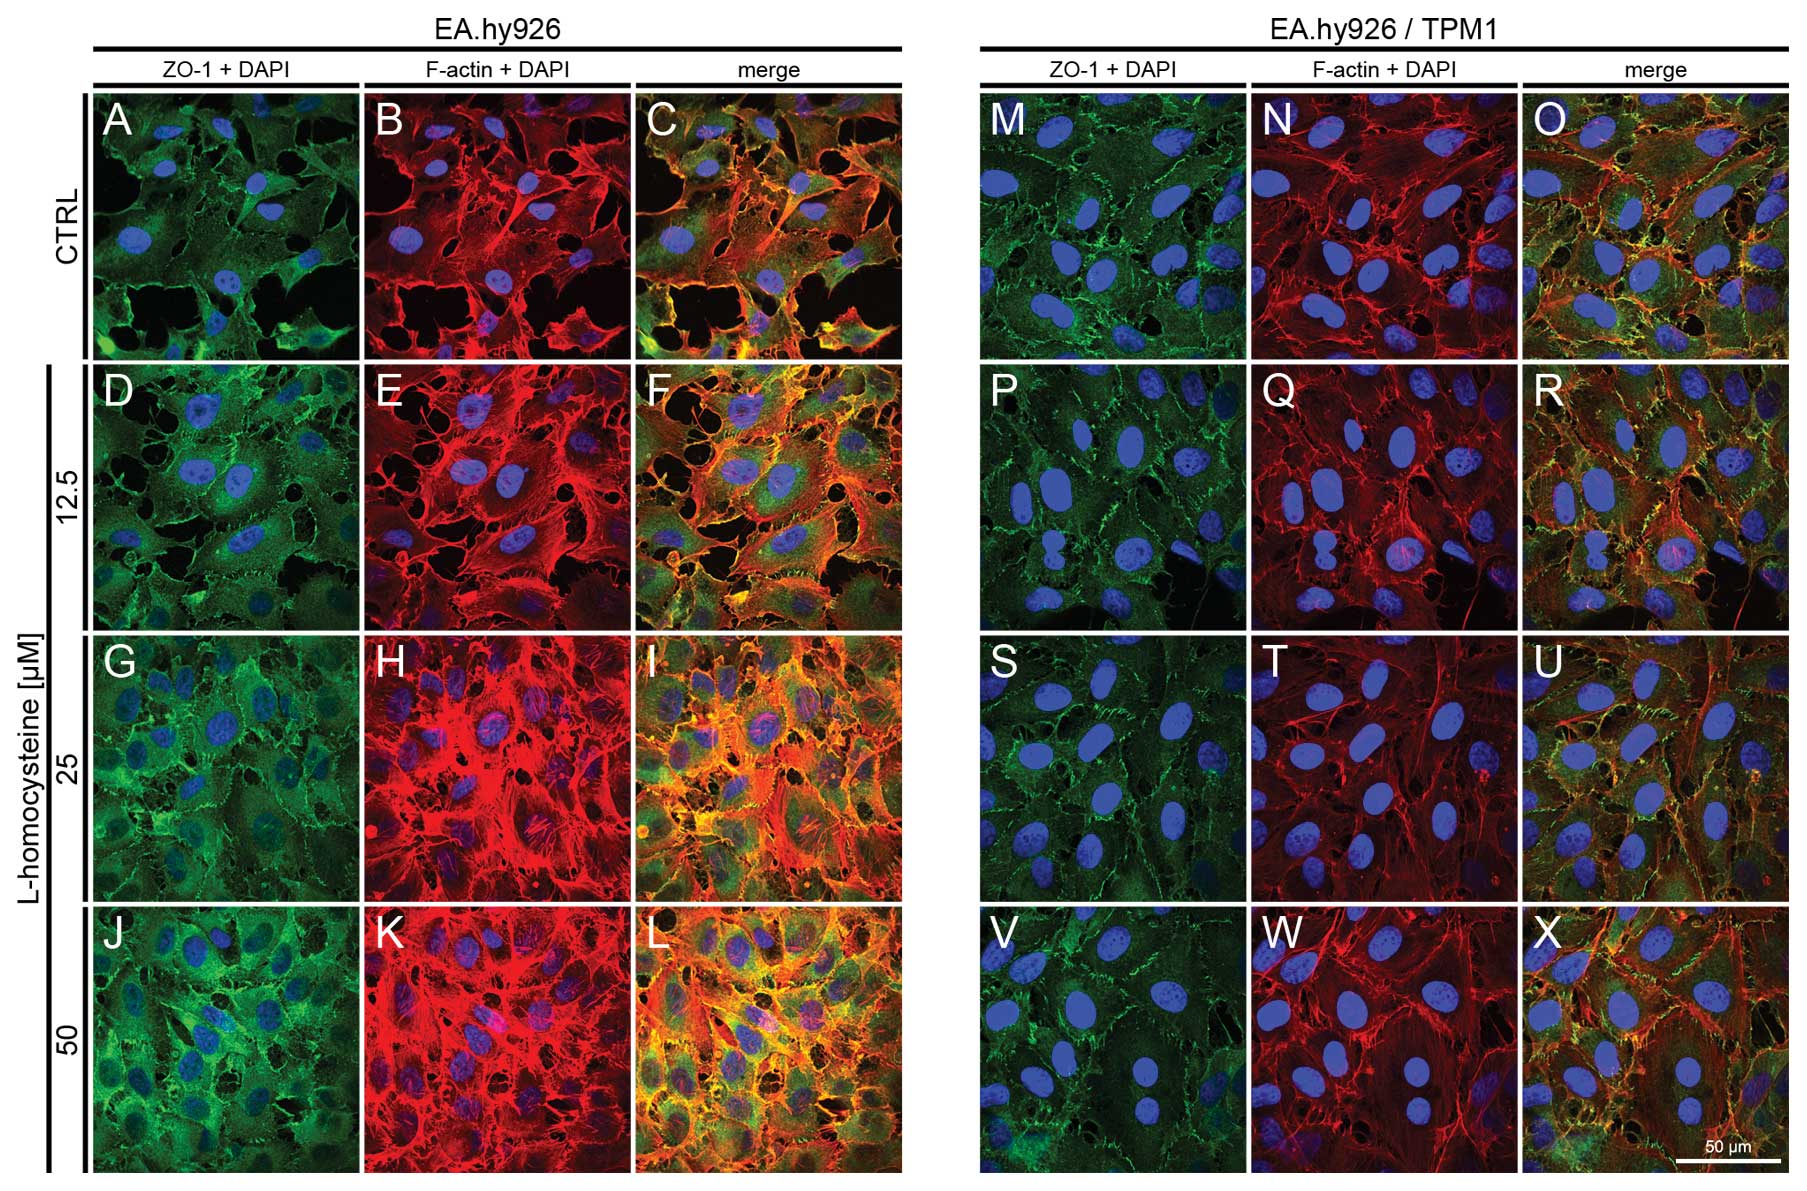 | Figure 8.Effect of L-homocysteine thiolactone
hydrochloride on fluorescence staining of ZO-1 and F-actin.
EA.hy926 cells transfected with the empty plasmid or the plasmid
with subcloned cDNA of tropomyosin-1 (α) isoform 1 were treated
with L-homocysteine thiolactone hydrochloride for 24 h, fixed and
double-stained for the ZO-1 and F-actin. Nuclei were counterstained
with DAPI. Images were captured at the focal plane of junctional
ZO-1 under a confocal microscope. Bar, 50 μm. (A–C) Control
EA.hy926 cells transfected with the empty plasmid. (D–F) EA.hy926
cells transfected with the empty plasmid and treated with 12.5
μM L-homocysteine thiolactone hydrochloride. (G–I) EA.hy926
cells transfected with the empty plasmid and treated with 25
μM L-homocysteine thiolactone hydrochloride. (J–L) EA.hy926
cells transfected with the empty plasmid and treated with 50
μM L-homocysteine thiolactone hydrochloride. (M–O) Control
EA.hy926 cells transfected with the plasmid encoding tropomyosin-1
(α) isoform 1. (P–R) EA.hy926 cells transfected with the plasmid
encoding tropomyosin-1 (α) isoform 1 and treated with 12.5
μM L-homocysteine thiolactone hydrochloride. (S–U) EA.hy926
cells transfected with the plasmid encoding tropomyosin-1 (α)
isoform 1 and treated with 25 μM L-homocysteine thiolactone
hydrochloride. (V–X) EA.hy926 cells transfected with the plasmid
encoding tropomyosin-1 (α) isoform 1 and treated with 50 μM
L-homocysteine thiolactone hydrochloride. (A, D, G and J; M, P, S
and V) ZO-1 + DAPI. (B, E, H and K; N, Q, T and W) F-actin + DAPI.
(C, F, I and L; O, R, U and X) Merge. TPM1, tropomyosin-1. |
In the EA.hy926 cells with stabilized F-actin
cytoskeleton by the overexpression of tropomyosin-1, the labeling
of ZO-1 following exposure of the cells to L-homocysteine was
decreased in comparison to the control cells and the cells
transfected with the empty plasmid. However, ZO-1 fluorescence at
the cell periphery was higher than that observed in the control
cells and the cells transfected with the empty plasmid (Fig. 8M, P, S and V). Following the
stabilization of F-actin, and after treatment of the cells with
L-homocysteine, ZO-1 fluorescence was slightly decreased in
comparison to the control, and significantly decreased, as compared
to the cells transfected with the empty plasmid. Moreover, stress
fibers were thinner than those observed in the control cells and
the cells transfected with the empty plasmid (Fig. 8N, Q, T and W). Additionally, the
extracellular spaces were significantly reduced following F-actin
stabilization, as compared to the cells transfected with the empty
plasmid (Fig. 8A–X).
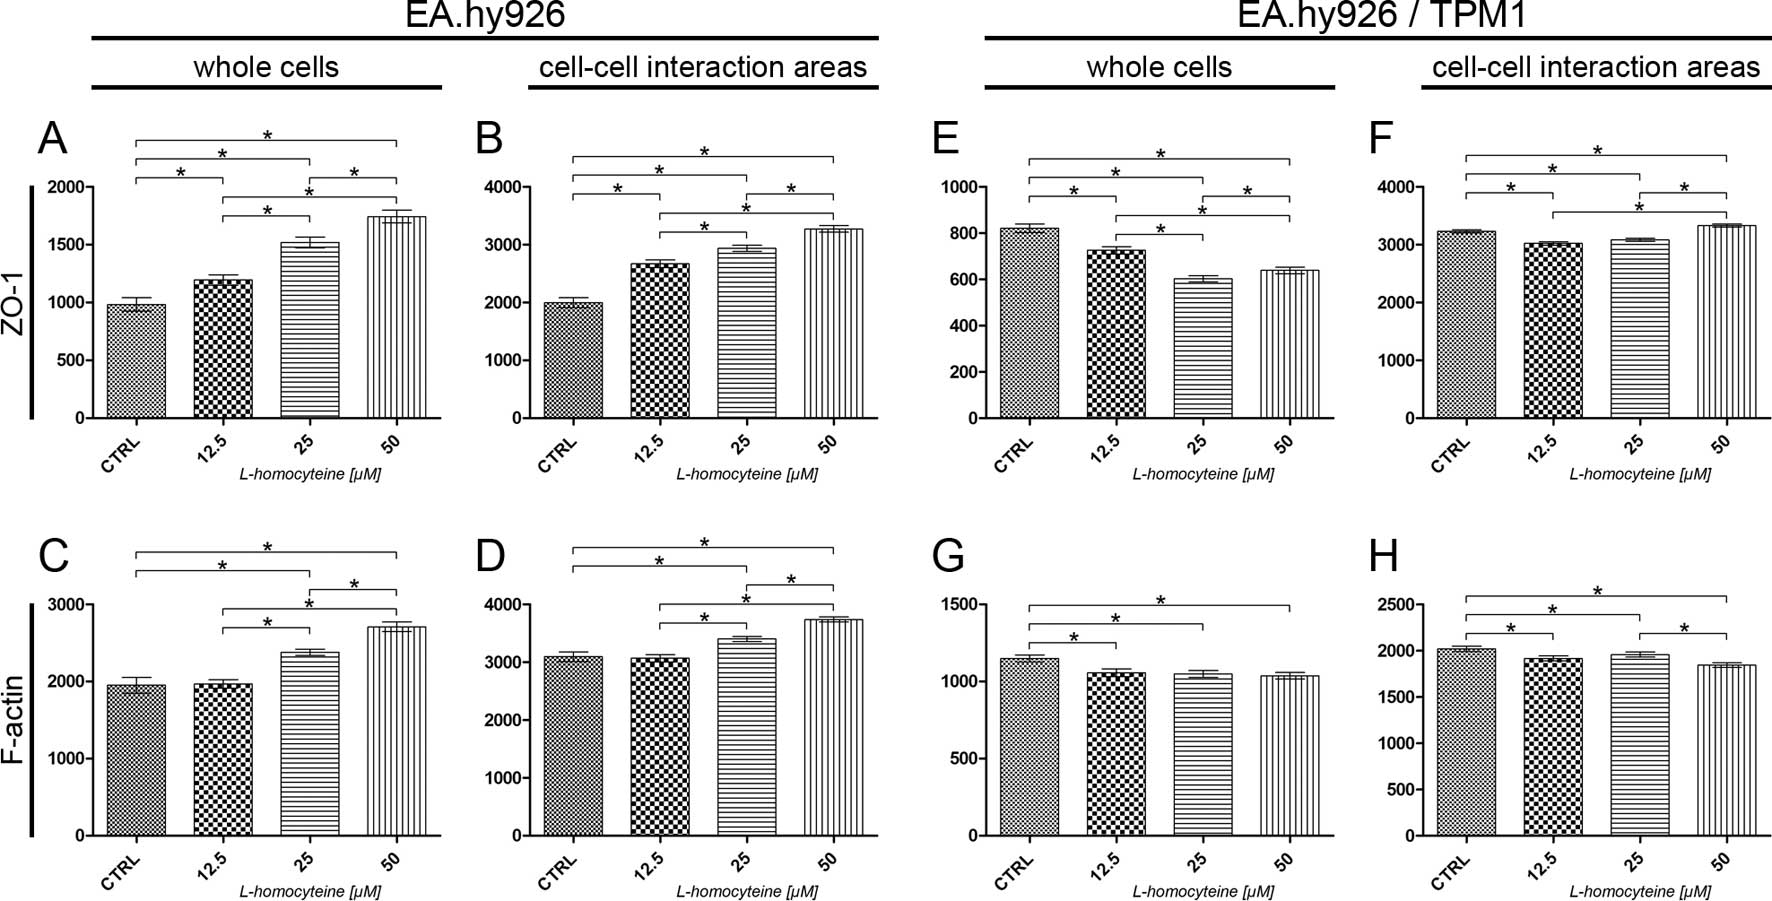
The measurement of the fluorescence intensity of
ZO-1 and F-actin in the EA.hy926 cells and the cells overexpressing
tropomyosin-1 was performed on confocal images acquired at the
focal plane of ZO-1. The fluorescence intensity of F-actin and ZO-1
was measured in whole cells and in the cell-cell interaction areas,
at the focal plane of ZO-1. The analysis of the fluorescence
intensity of ZO-1 measured in the whole EA.hy926 cells transfected
with the empty plasmid revealed a statistically significant
dose-dependent increase in comparison to the control (from 982.96
to 1194.46, P=0.0044; 1518.39, P<0.0001; and 1742.49,
P<0.0001 for the cells treated with 12.5, 25 and 50 μM
L-homocysteine, respectively). Additionally, statistically
significant differences were observed in the comparison between the
groups (Fig. 9A). A similar
increase in ZO-1 fluorescence in comparison to the control and a
correlation between the doses of L-homocysteine were observed
following the measurement of its intensity in the cell-cell
interaction areas, although the values were 1.88- to 2.23-fold
higher, as compared to the fluorescence intensity measured in the
whole cells (Fig. 9B). A
statistically significant increase in the fluorescence intensity of
F-actin was observed in the whole cells following the treatment of
the cells with 25 and 50 μM L-homocysteine in comparison to
the control (from 1950.04 to 2377.88, P=0.0003; and 2708.54,
P<0.0001, respectively). Moreover, the differences between the
doses of L-homocysteine were statistically significant (Fig. 9C). A similar correlation was
observed in F-actin intensity measured in the cell-cell interaction
areas; however, the fluorescence intensity was 1.38- to 1.58-fold
higher than the intensity measured in the whole cells (Fig. 9D).
An analysis of the fluorescence intensity of ZO-1
measured in whole EA.hy926 cells overexpressing tropomyosin-1
revealed a statistically significant decrease following treatment
of the cells with L-homocysteine (from 820.85 to 725.23,
P<0.0001; 602.80, P<0.0001; and 638.74, P<0.0001 for the
cells treated with 12.5, 25 and 50 μM L-homocysteine,
respectively). Moreover, statistically significant differences were
observed between the doses of L-homocysteine. Additionally, the
fluorescence intensity values were 1.65- to 2.73-fold lower than
those in the cells transfected with the empty plasmid (Fig. 9E). There was a statistically
significant decrease in the fluorescence intensity of ZO-1 measured
in the cell-cell interaction areas following treatment of the
EA.hy926 cells with stabilized F-actin cytoskeleton by
tropomyosin-1 with 12.5 and 25 μM L-homocysteine (from
3230.88 to 3020.65, P<0.0001; and 3083.39, P=0.0023,
respectively) and an increase following treatment of the cells with
50 μM L-homocysteine (to 3329.29, P=0.0170), as compared to
the control (Fig. 9F).
Furthermore, the cell-cell interaction areas exhibited a slightly
higher (1.02- to 1.62-fold) fluorescence intensity of ZO-1 than
that observed in the cells without stabilized F-actin (Fig. 9F).
The measurement of F-actin fluorescence intensity at
the focal plane of ZO-1 in the whole cells overexpressing
tropomyosin-1 revealed a statistically significant decrease, as
compared to the control (from 1148.77 to 1056.86, P=0.0026;
1048.67, P=0.0021; and 1036.54, P=0.0012 for the cells treated with
12.5, 25 and 50 μM L-homocysteine, respectively). The
differences between the results obtained from the cells treated
with L-homocysteine were statistically insignificant (Fig. 9G). A similar correlation was
observed in F-actin intensity measured in the cell-cell interaction
areas, although the fluorescence intensity was 1.76- to 1.87-fold
higher than the intensity measured in the whole cells (Fig. 9H).
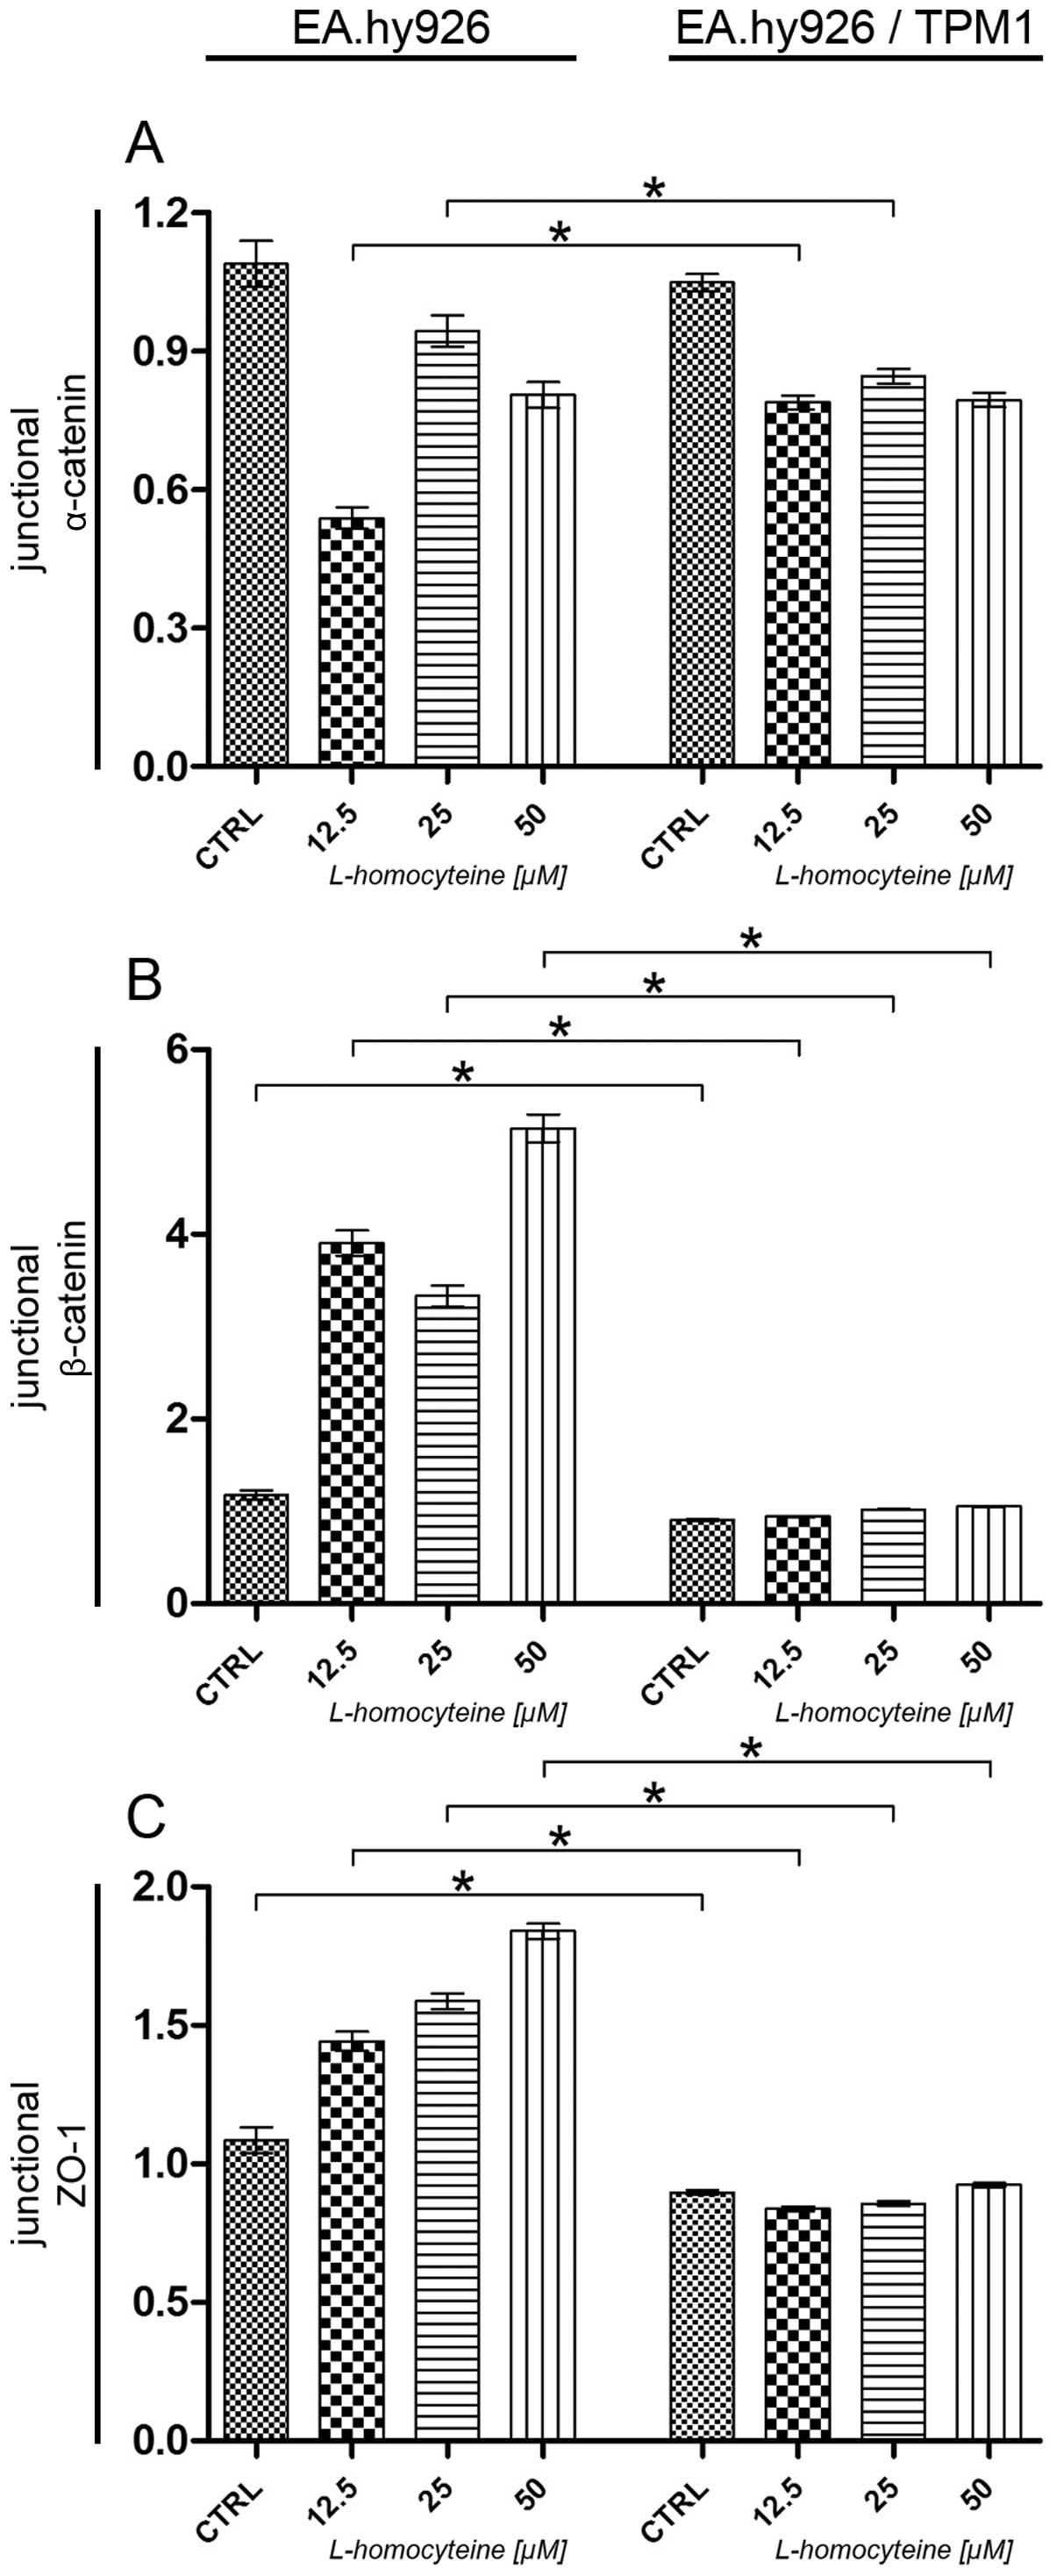
Analysis of relative fluorescence changes
of junctional α-catenin, β-catenin and ZO-1
The effect of L-homocysteine on relative
fluorescence changes of α-catenin, β-catenin and ZO-1 in the
EA.hy926 cells overexpressing tropomyosin-1 and in those not
overexpressing tropomyosin-1 was investigated by using a laser
scanning confocal microscope. The images were acquired in confocal
mode at the focal plane of the junctional proteins. The relative
fluorescence values of the junctional proteins were calculated by
dividing the fluorescence intensity values measured in the
cell-cell interaction areas by the median of the fluorescence
intensity measured in the cell-cell interaction areas of the
control and the transfected cells or the cells transfected with the
empty plasmid.
An analysis of junctional α-catenin relative
fluorescence revealed a statistically significant increase
following treatment of the cells overexpressing tropomyosin-1 with
12.5 μM L-homocysteine in comparison to the cells
transfected with the empty plasmid treated with the same
L-homocysteine dose (0.54-0.79, P<0.0001). Moreover, a
comparison of both types of cells following treatment with 25
μM L-homocysteine revealed a statistically significant
decrease in the relative fluorescence of junctional α-catenin
(0.94-0.84, P= 0.0036). Furthermore, no statistically significant
differences were observed between the control cells and the cells
treated with 50 μM L-homocysteine (Fig. 10A).
As regards junctional β-catenin, analysis revealed a
statistically significant decrease in the relative fluorescence of
β-catenin in the transfected control cells and the cells treated
with all L-homocysteine doses, as compared to the cells transfected
with the empty plasmid (1.17-0.90, P=0.0031; 3.90-0.94,
P<0.0001; 3.33-1.02, P<0.0001; and 5.15-1.05, P<0.0001 for
the control cells, and the cells treated with 12.5, 25 and 50
μM L-homocysteine, respectively) (Fig. 10B).
Similar to the results obtained for junctional
β-catenin, analysis revealed a statistically significant decrease
in the relative fluorescence of ZO-1 in the control cells
overexpressing tropomyosin-1 and the same cells treated with all
L-homocysteine doses, as compared to the cells transfected with the
empty plasmid (1.08-0.90, P=0.0071; and 1.44-0.84, P<0.0001;
1.59-0.85, P<0.0001; or 1.84-0.92, P<0.0001 for the control
cells, and the cells treated with 12.5, 25 and 50 μM
L-homocysteine, respectively) (Fig.
10C).
Discussion
Atherosclerosis affects the arteries and results in
heart disease and myocardial infarction. Atherosclerosis results
from injury to the artery endothelium caused by mechanical and
environmental factors, and the resulting inflammatory response in
the vessel wall (6). Previous
clinical and experimental studies have indicated that mild to
moderate increases in the plasma homocysteine concentration are
casual risk factors for vascular disease (7–10).
As it has been previously shown by Plazar and Jurdana, the normal
and abnormal homocysteine levels are set by individual
laboratories. However, the concentration of homocysteine is
considered normal at levels <13 μM, levels between 13 and
60 μM are considered moderately elevated, and levels >60
to 100 μM are considered significantly elevated (37). Moreover, the total plasma
homocysteine concentrations during hyperhomocysteinemia are between
12 and 30 μM, with gender differences being present. Higher
values are measured in males, while the presence of estrogen in
females determines the plasma concentration and following
menopause, the blood levels of homocysteine are similar to those
observed in males (38). A number
of in vitro studies have indicated that at micromolar
concentrations, homocysteine exerts anti-angiogenic effects and
decreases the bioavailability of endothelium-derived nitric oxide
(39,40). At higher micromolar
concentrations, homocysteine has been shown to induce apoptosis and
decrease the migration of endothelial cells (40–43).
In this study, we used 12.5, 25 and 50 μM
L-homocysteine thiolactone hydrochloride to investigate the effect
L-homocysteine on endothelial EA.hy926 cells in the context of
changes in cell-cell junctions. Moreover, through the
overexpression of tropomyosin-1, we stabilized F-actin cytoskeleton
to determine whether organizational changes of F-actin play a role
in endothelial injury. Mercié et al showed that homocysteine
thiolactone in the range of 50–200 μM induced endothelial
cell apoptosis in a concentration-dependent manner, independently
of the caspase pathway. Additionally, the apoptosis was not
influenced by the serum concentration in the culture medium, and
inhibitors such as leupeptin, fumosinin B1, catalase, or z-VAD-fmk
were able to prevent homocysteine-induced apoptic cell death
(44). On the contrary, in the
present study, no statistically significant differences were
observed between the percentage of live and early apoptotic cells
following treatment with L-homocysteine as compared to the control.
In the study by Rodríguez-Nieto et al, it was shown that 5
mM homocysteine had only a weak cyotoxic effect on BAE cells, as
revealed both by cell counting and by negative results obtained by
TUNEL assay and caspase-3 activity assay (45). Additionally, our results revealed
that the stabilization of F-actin cytoskeleton caused a significant
decrease in the percentage of late apoptotic and necrotic cells
following treatment with L-homocysteine as compared to the cells
transfected with the empty plasmid. Furthermore, the percentage of
early apoptotic cells was decreased following treatment of the
cells with 25 μM L-homocysteine in comparison to the
EA.hy926 cells not overexpressing tropomyosin-1, treated with the
same dose of L-homocysteine. However, no statistically significant
differences were observed between the percentage of live cells as
compared to the cells overexpressing tropomyosin-1 and those not
overexpressing tropomyosin-1. Our results demonstrate that through
the stabilization of F-actin, tropomyosin-1 protects EA.hy926 cells
against late apoptosis and necrosis.
As regards endothelial cell mobility following
treatment with homocysteine, homocysteine has been shown to inhibit
cell migration and invasion (45). Our study demonstrated an increase
in the cell mobility of EA.hy926 cells overexpressing
tropomyosin-1, as compared to the EA.hy926 cells transfected with
the empty plasmid after 12 h from the time when the wound was
formed. This suggests that the stabilization of F-actin does not
affect the migratory potential of cells, and consequently protects
the EA.hy926 cells against the L-homocysteine-induced decrease in
cell mobility. Similar results were obtained by Wejksza et
al following treatment of bovine aorta endothelial cell
cultures with kynurenic acid (KYNA). The above cited authors showed
that KYNA exerted a protective effect against the
homocysteine-induced impairment of endothelial cells. The addition
of 0.01 mM KYNA to the cell culture containing 0.5 mM
DL-homocysteine significantly increased endothelial cell migration
and proliferation, which were diminished by homocysteine. KYNA also
protected the cells against homocysteine-induced cytotoxicity
(46).
The filamentous actin protein includes a variety of
different structures that are crucial in many aspects of cell
physiology, including the maintenance of cell shape and polarity,
which are important in the formation of cellular junctions
(4). As has previously been shown
by Zhang, the cooperation of junctional actin and F-actin thin
bundles lead to the overall morphological changes and develop a
polarized epithelial cell shape (5). Similar to epithelial cells,
endothelial cells have specialized junctional regions that are
comparable to adherens junctions and tight junctions. However, in
the endothelium, tight junctions are frequently intermixed with
adherens junctions along the intercellular cleft (13). The actin cytoskeleton and
associated proteins play a vital role in cell-cell adhesion
(14). As it has been shown in a
number of studies, there is the possibility of interaction between
the cytoplasmic tails of junctional proteins and both cytoskeletal
and signaling proteins, which allows the anchorage of the adhesion
proteins to F-actin and the transfer of intracellular signals
inside the cell (15–18). The association with actin is
required not only for the stabilization of junctions, but also for
the dynamic regulation of junction opening and closure. Although a
key role of the actin cytoskeleton in the formation and maintenance
of adherens junctions has been recognized, particularly as regards
the molecular linkages between cadherins and actin filaments, the
structural organization and specific roles of the actin
cytoskeleton at adherens junctions remain unknown, particularly in
endothelial cells (14,19–21).
In endothelial adherens junctions, the transmembrane
vascular endothelial (VE)-cadherin binds the cytoplasmic proteins,
β-catenin and p120-catenin. β-catenin also binds α-catenin, which
could link the adheren junction complex to actin filaments
(47). However, the established
model of a direct link between cortical actin filaments (F-actin)
and α-catenin in adherens junctions in epithelial cells has been
questioned. It has been suggested that the binding of α-catenin to
β-catenin and to F-actin is mutually exclusive, and that the role
of α-catenin is the stabilization of adherens junctions by
regulating actin polymerization as opposed to linking F-actin to
adherens junctions (48,49). Our study demonstrated that the
stabilization of F-actin by the overexpression of tropomyosin-1 in
EA.hy926 cells significantly increased the expression of junctional
β-catenin, measured by fluorescence intensity changes, compared to
the cells not overexpressing tropomyosin-1. Similarly, the
fluorescence intensity of junctional α-catenin was also increased
in the cells with stabilized F-actin cytoskeleton. However, this
increase was only slightly higher than that observed in the
EA.hy926 cells not overexpressing tropomyosin-1. Moreover,
following an analysis of the increase of α-catenin fluorescence by
relative fluorescence intensity analysis, the results revealed a
similar distribution following treatment with L-homocysteine in the
EA.hy926 cells with and without stabilized F-actin cytoskeleton.
Together with the decreased fluorescence intensity of junctional
F-actin measured in the cell-cell contact area at the focal plane
of α-catenin, it can be hypothesized that α-catenin may participate
in the suppression of actin polymerization in the area of cell-cell
junctions. Our results are in agreement with those presented in the
study by Drees et al, that α-catenin can locally regulate
actin dynamics and organization. Furthermore, we confirm the
hypothesis that α-catenin directly regulates actin filament
organization by suppressing Arp2/3-mediated actin polymerization,
possibly by competing with the Arp2/3 complex for binding to actin
filaments (48). However, Millán
et al suggested that endothelial discontinuous adheren
junctions formed by complexes of VE-cadherin, α-catenin, β-catenin
and p120-catenin, can be physically linked to actin stress fibers
(50). However, in this study,
the analysis of α-catenin and β-catenin relative fluorescence in
the cells with stabilized F-actin cytoskeleton, confirm the
hypotheses made by Drees et al and Yamada et al, that
α-catenin does not bind simultaneously to the E-cadherin-β-catenin
complex and actin filaments (48,49).
ZO-1 is a member of the membrane-associated
guanylate kinase homolog (MAGUK) family of membrane-associated
signaling molecules that binds directly to both cytosolic and
transmembrane components of the tight junction and is believed to
organize these proteins within the apical junctional complex
(51). It also binds directly to
F-actin (52–54). Although the functional relevance
of this interaction is unknown, it is believed that ZO-1 limits
solute permeability in established tight junctions, possibly by
forming a stabilizing link between the barrier and perijunctional
actomyosin ring (55). Van
Itallie et al also indicated that F-actin localization is
significantly altered in ZO-1 knockdown cells, with an increase in
actin staining at the apical junctional complex and into scattered
apical dots (55). The analysis
of relative fluorescence presented in this study revealed a
statistically significant decrease in the relative fluorescence of
ZO-1 in the cell-cell junction area among the cells with stabilized
F-actin cytoskeleton in comparison to the cells not overexpressing
tropomyosin-1. Our results suggest that ZO-1, similar to β-catenin,
can bind to F-actin directly, and stabilize the endothelial barrier
function through the stabilization of F-actin. However, as has
previously been suggested by Van Itallie et al (55), ZO-1 has very specific effects on
actin dynamics at the apical junctional complex, possibly by
localizing the activity of cytoskeletal proteins, such as
α-actinin, α-catenin or shroom2 (52,55–57). Furthermore, we observed that
through the stabilization of F-actin, the localization of
junctional ZO-1 did not change drastically following treatment with
L-homocysteine, as was confirmed by relative fluorescence analysis;
these results confirm those presented in the study by Fanning et
al (51).
In conclusion, the present study demonstrates that
the stabilization of F-actin does not affect the migratory
potential of cells, and consequently protects the EA.hy926 cells
against the L-homocysteine-induced decrease in cell mobility.
Moreover, the data presented in this study suggest that α-catenin
participates in the suppression of actin polymerization in the area
of cell-cell junctions. Our data are in agreement with those
presented in the studies by Drees et al and Yamada et
al, namely that α-catenin does not bind simultaneously to the
E-cadherin-β-catenin complex and actin filaments (48,49). Furthermore, we hypothesize that
the stabilization of F-actin strengthens adherens junctions and
tight junctions by increasing the number of cell-cell junctions due
to the amplification of β-catenin and the ZO-1 fluorescence signal.
However, ZO-1 stabilizes the endothelial barrier function through
the stabilization of F-actin and F-actin itself stabilizes the
localization of ZO-1.
Acknowledgements
This study was supported by the Polish
National Science Center (NCN) under the Grant no. N N401
596140.
References
|
1.
|
Pollard TD: Cytoskeletal functions of
cytoplasmic contractile proteins. J Supramol Struct. 5:317–334.
1976. View Article : Google Scholar : PubMed/NCBI
|
|
2.
|
Clarke M and Spudich JA: Nonmuscle
contractile proteins: the role of actin and myosin in cell motility
and shape determination. Annu Rev Biochem. 46:797–822. 1977.
View Article : Google Scholar : PubMed/NCBI
|
|
3.
|
Stossel TP: Contractile proteins in cell
structure and function. Annu Rev Med. 29:427–457. 1978. View Article : Google Scholar : PubMed/NCBI
|
|
4.
|
Stricker J, Falzone T and Gardel ML:
Mechanics of the F-actin cytoskeleton. J Biomech. 43:9–14. 2010.
View Article : Google Scholar : PubMed/NCBI
|
|
5.
|
Zhang J, Betson M, Erasmus J, Zeikos K,
Bailly M, Cramer LP and Braga VM: Actin at cell-cell junctions is
composed of two dynamic and functional populations. J Cell Sci.
118:5549–5562. 2005. View Article : Google Scholar : PubMed/NCBI
|
|
6.
|
Homeister JW and Willis MS:
Atherosclerosis: Pathogenesis, Genetics and Experimental Models.
Encyclopedia of Life Sciences 2010. John Wiley & Sons Ltd;
Chichester: 2010, View Article : Google Scholar
|
|
7.
|
Boushey CJ, Beresford SA, Omenn GS and
Motulsky AG: A quantitative assessment of plasma homocysteine as a
risk factor for vascular disease. Probable benefits of increasing
folic acid intakes. JAMA. 274:1049–1057. 1995. View Article : Google Scholar : PubMed/NCBI
|
|
8.
|
Nygård O, Vollset SE, Refsum H, et al:
Total plasma homocysteine and cardiovascular risk profile. The
Hordaland Homocysteine Study. JAMA. 274:1526–1533. 1995.PubMed/NCBI
|
|
9.
|
Ueland PM, Refsum H, Beresford SA and
Vollset SE: The controversy over homocysteine and cardiovascular
risk. Am J Clin Nutr. 72:324–332. 2000.PubMed/NCBI
|
|
10.
|
Tehlivets O: Homocysteine as a risk factor
for atherosclerosis: is its conversion to s-adenosyl-L-homocysteine
the key to deregulated lipid metabolism? J Lipids. 2011:7028532011.
View Article : Google Scholar : PubMed/NCBI
|
|
11.
|
McDowell IF and Lang D: Homocysteine and
endothelial dysfunction: a link with cardiovascular disease. J
Nutr. 130:369S–372S. 2000.PubMed/NCBI
|
|
12.
|
Heydrick SJ, Weiss N, Thomas SR, Cap AP,
Pimentel DR, Loscalzo J and Keaney JF Jr: L-Homocysteine and
L-homocystine stereospecifically induce endothelial nitric oxide
synthase-dependent lipid peroxidation in endothelial cells. Free
Radic Biol Med. 36:632–640. 2004. View Article : Google Scholar
|
|
13.
|
Dejana E: Endothelial cell-cell junctions:
happy together. Nat Rev Mol Cell Biol. 5:261–270. 2004. View Article : Google Scholar : PubMed/NCBI
|
|
14.
|
Hoelzle MK and Svitkina T: The
cytoskeletal mechanisms of cell-cell junction formation in
endothelial cells. Mol Biol Cell. 23:310–323. 2012. View Article : Google Scholar : PubMed/NCBI
|
|
15.
|
Bazzoni G, Martínez Estrada O and Dejana
E: Molecular structure and functional role of vascular tight
junctions. Trends Cardiovasc Med. 9:147–152. 1999. View Article : Google Scholar : PubMed/NCBI
|
|
16.
|
Braga VM: Cell-cell adhesion and
signalling. Curr Opin Cell Biol. 14:546–556. 2002. View Article : Google Scholar : PubMed/NCBI
|
|
17.
|
Matter K and Balda MS: Signalling to and
from tight junctions. Nat Rev Mol Cell Biol. 4:225–236. 2003.
View Article : Google Scholar : PubMed/NCBI
|
|
18.
|
Wheelock MJ and Johnson KR:
Cadherin-mediated cellular signaling. Curr Opin Cell Biol.
15:509–514. 2003. View Article : Google Scholar : PubMed/NCBI
|
|
19.
|
Harris ES and Nelson WJ: VE-cadherin: at
the front, center, and sides of endothelial cell organization and
function. Curr Opin Cell Biol. 22:651–658. 2010. View Article : Google Scholar : PubMed/NCBI
|
|
20.
|
Harris TJ and Tepass U: Adherens
junctions: from molecules to morphogenesis. Nat Rev Mol Cell Biol.
11:502–514. 2010. View Article : Google Scholar : PubMed/NCBI
|
|
21.
|
Yonemura S: Cadherin-actin interactions at
adherens junctions. Curr Opin Cell Biol. 23:515–522. 2011.
View Article : Google Scholar : PubMed/NCBI
|
|
22.
|
Nwariaku FE, Liu Z, Zhu X, et al: NADPH
oxidase mediates vascular endothelial cadherin phosphorylation and
endothelial dysfunction. Blood. 104:3214–3220. 2004. View Article : Google Scholar : PubMed/NCBI
|
|
23.
|
Kinumi T, Ogawa Y, Kimata J, Saito Y,
Yoshida Y and Niki E: Proteomic characterization of oxidative
dysfunction in human umbilical vein endothelial cells (HUVEC)
induced by exposure to oxidized LDL. Free Radic Res. 39:1335–1344.
2005. View Article : Google Scholar : PubMed/NCBI
|
|
24.
|
Xu Y, Arai H, Murayama T, Kita T and
Yokode M: Hypercholesterolemia contributes to the development of
atherosclerosis and vascular remodeling by recruiting bone
marrow-derived cells in cuff-induced vascular injury. Biochem
Biophys Res Commun. 363:782–787. 2007. View Article : Google Scholar : PubMed/NCBI
|
|
25.
|
Javanmard SH and Dana N: The effect of
interferon γ on endothelial cell nitric oxide production and
apoptosis. Adv Biomed Res. 1:692012.
|
|
26.
|
Bouïs D, Hospers GA, Meijer C, Molema G
and Mulder NH: Endothelium in vitro: a review of human vascular
endothelial cell lines for blood vessel-related research.
Angiogenesis. 4:91–102. 2001.PubMed/NCBI
|
|
27.
|
Edgell CJ, Reisner HM and Graham JB:
Endothelial cell hybrids and the suspension of factor VIII related
antigen expression. Br J Haematol. 46:613–620. 1980. View Article : Google Scholar : PubMed/NCBI
|
|
28.
|
Edgell CJ, Haizlip JE, Bagnell CR,
Packenham JP, Harrison P, Wilbourn B and Madden VJ: Endothelium
specific Weibel-Palade bodies in a continuous human cell line,
EA.hy926. In Vitro Cell Dev Biol. 26:1167–1172. 1990. View Article : Google Scholar : PubMed/NCBI
|
|
29.
|
Claise C, Chalas J, Edeas M, Abella A,
Khalfoun Y, Laurent D and Lindenbaum A: Comparison of oxidized
low-density lipoprotein toxicity on EA.hy 926 cells and human vein
endothelial cells: influence of antioxidant systems. Cell Mol Life
Sci. 53:156–161. 1997. View Article : Google Scholar : PubMed/NCBI
|
|
30.
|
Vrekoussis T, Stathopoulos EN, De Giorgi
U, et al: Modulation of vascular endothelium by imatinib: a study
on the EA.hy 926 endothelial cell line. J Chemother. 18:56–65.
2006. View Article : Google Scholar : PubMed/NCBI
|
|
31.
|
Rosenkranz AC, Lob H, Breitenbach T,
Berkels R and Roesen R: Endothelial antioxidant actions of
dihydropyridines and angiotensin converting enzyme inhibitors. Eur
J Pharmacol. 529:55–62. 2006. View Article : Google Scholar : PubMed/NCBI
|
|
32.
|
Pittenger MF, Kazzaz JA and Helfman DM:
Functional properties of non-muscle tropomyosin isoforms. Curr Opin
Cell Biol. 6:96–104. 1994. View Article : Google Scholar : PubMed/NCBI
|
|
33.
|
Perry SV: Vertebrate tropomyosin:
distribution, properties and function. J Muscle Res Cell Motil.
22:5–49. 2001. View Article : Google Scholar : PubMed/NCBI
|
|
34.
|
Cooper JA: Actin dynamics: tropomyosin
provides stability. Curr Biol. 12:R523–R525. 2002. View Article : Google Scholar : PubMed/NCBI
|
|
35.
|
Gunning PW, Schevzov G, Kee AJ and
Hardeman EC: Tropomyosin isoforms: divining rods for actin
cytoskeleton function. Trends Cell Biol. 15:333–341. 2005.
View Article : Google Scholar : PubMed/NCBI
|
|
36.
|
Lin JJ, Eppinga RD, Warren KS and McCrae
KR: Human tropomyosin isoforms in the regulation of cytoskeleton
functions. Adv Exp Med Biol. 644:201–222. 2008. View Article : Google Scholar : PubMed/NCBI
|
|
37.
|
Plazar N and Jurdana M:
Hyperhomocysteinemia: relation to cardiovascular disease and venous
thromboembolism. Pathophysiology and Clinical Aspects of Venous
Thromboembolism in Neonates, Renal Disease and Cancer Patients.
Abdelaal MA: InTech; Rijeka: pp. 17–34. 2012
|
|
38.
|
Ridker PM, Manson JE, Buring JE, Shih J,
Matias M and Hennekens CH: Homocysteine and risk of cardiovascular
disease among postmenopausal women. JAMA. 281:1817–1821. 1999.
View Article : Google Scholar : PubMed/NCBI
|
|
39.
|
Upchurch GR Jr, Welch GN, Fabian AJ,
Freedman JE, Johnson JL, Keaney JF Jr and Loscalzo J:
Homocyst(e)ine decreases bioavailable nitric oxide by a mechanism
involving glutathione peroxidase. J Biol Chem. 272:17012–17017.
1997. View Article : Google Scholar : PubMed/NCBI
|
|
40.
|
Nagai Y, Tasaki H, Takatsu H, Nihei S,
Yamashita K, Toyokawa T and Nakashima Y: Homocysteine inhibits
angiogenesis in vitro and in vivo. Biochem Biophys Res Commun.
281:726–731. 2001. View Article : Google Scholar : PubMed/NCBI
|
|
41.
|
Zhang C, Cai Y, Adachi MT, Oshiro S, Aso
T, Kaufman RJ and Kitajima S: Homocysteine induces programmed cell
death in human vascular endothelial cells through activation of the
unfolded protein response. J Biol Chem. 276:35867–35874. 2001.
View Article : Google Scholar : PubMed/NCBI
|
|
42.
|
Lee SJ, Kim KM, Namkoong S, et al: Nitric
oxide inhibition of homocysteine-induced human endothelial cell
apoptosis by down-regulation of p53-dependent Noxa expression
through the formation of S-nitrosohomocysteine. J Biol Chem.
280:5781–5788. 2005. View Article : Google Scholar : PubMed/NCBI
|
|
43.
|
Suhara T, Fukuo K, Yasuda O, et al:
Homocysteine enhances endothelial apoptosis via upregulation of
Fas-mediated pathways. Hypertension. 43:1208–1213. 2004. View Article : Google Scholar : PubMed/NCBI
|
|
44.
|
Mercié P, Garnier O, Lascoste L, et al:
Homocysteine-thiolactone induces caspase-independent vascular
endothelial cell death with apoptotic features. Apoptosis.
5:403–411. 2000.PubMed/NCBI
|
|
45.
|
Rodríguez-Nieto S, Chavarría T,
Martínez-Poveda B, Sánchez-Jiménez F, Rodríguez Quesada A and
Medina MA: Anti-angiogenic effects of homocysteine on cultured
endothelial cells. Biochem Biophys Res Commun. 293:497–500.
2002.PubMed/NCBI
|
|
46.
|
Wejksza K, Rzeski W and Turski WA:
Kynurenic acid protects against the homocysteine-induced impairment
of endothelial cells. Pharmacol Rep. 61:751–756. 2009. View Article : Google Scholar : PubMed/NCBI
|
|
47.
|
Vincent PA, Xiao K, Buckley KM and
Kowalczyk AP: VE-cadherin: adhesion at arm’s length. Am J Physiol
Cell Physiol. 286:C987–C997. 2004.
|
|
48.
|
Drees F, Pokutta S, Yamada S, Nelson WJ
and Weis WI: α-catenin is a molecular switch that binds
E-cadherin-β-catenin and regulates actin-filament assembly. Cell.
123:903–915. 2005.
|
|
49.
|
Yamada S, Pokutta S, Drees F, Weis WI and
Nelson WJ: Deconstructing the cadherin-catenin-actin complex. Cell.
123:889–901. 2005. View Article : Google Scholar : PubMed/NCBI
|
|
50.
|
Millán J, Cain RJ, Reglero-Real N, et al:
Adherens junctions connect stress fibres between adjacent
endothelial cells. BMC Biol. 8:112010.PubMed/NCBI
|
|
51.
|
Fanning AS, Ma TY and Anderson JM:
Isolation and functional characterization of the actin binding
region in the tight junction protein ZO-1. FASEB. 16:1835–1837.
2002.PubMed/NCBI
|
|
52.
|
Itoh M, Nagafuchi A, Moroi S and Tsukita
S: Involvement of ZO-1 in cadherin-based cell adhesion through its
direct binding to alpha catenin and actin filaments. J Cell Biol.
138:181–192. 1997. View Article : Google Scholar : PubMed/NCBI
|
|
53.
|
Fanning AS, Jameson BJ, Jesaitis LA and
Anderson JM: The tight junction protein ZO-1 establishes a link
between the trans-membrane protein occludin and the actin
cytoskeleton. J Biol Chem. 273:29745–29753. 1998. View Article : Google Scholar : PubMed/NCBI
|
|
54.
|
Wittchen ES, Haskins J and Stevenson BR:
Protein interactions at the tight junction. Actin has multiple
binding partners, and ZO-1 forms independent complexes with ZO-2
and ZO-3. J Biol Chem. 274:35179–35185. 1999. View Article : Google Scholar : PubMed/NCBI
|
|
55.
|
Van Itallie CM, Fanning AS, Bridges A and
Anderson JM: ZO-1 stabilizes the tight junction solute barrier
through coupling to the perijunctional cytoskeleton. Mol Biol Cell.
20:3930–3940. 2009.PubMed/NCBI
|
|
56.
|
Chen VC, Li X, Perreault H and Nagy JI:
Interaction of zonula occludens-1 (ZO-1) with alpha-actinin-4:
application of functional proteomics for identification of PDZ
domain-associated proteins. J Proteome Res. 5:2123–2134. 2006.
View Article : Google Scholar : PubMed/NCBI
|
|
57.
|
Etournay R, Zwaenepoel I, Perfettini I,
Legrain P, Petit C and El-Amraoui A: Shroom2, a myosin-VIIa- and
actin-binding protein, directly interacts with ZO-1 at tight
junctions. J Cell Sci. 120:2838–2850. 2007. View Article : Google Scholar : PubMed/NCBI
|