Introduction
Spinal disc herniation is known as degenerated discs
protruding into the spinal canal or the foraminal canal (1). The associated symptoms, such as
lower back pain and radiating leg pain (2) tend to severely affect the quality of
life of patients and impose a massive economic burden on society
(3,4). Herniated discs may exhibit severe
ossification which may adhere to the epidural membrane, and can
lead to ossification of the epidural membrane with a high risk of
cerebrospinal fluid leakage and this complicates surgical treatment
(5). However, the mechanisms of
disc ossification remain unclear.
Herniated disc ossification is related to disc
degeneration. Patients with a prolonged history of spinal disc
herniation are susceptible to disc ossification (6). Degenerated disc cells have been
shown to express bone morphogenetic proteins (BMPs) and their
receptors (7). Although some
studies have documented the BMP-induced stimulation of
chondrogenesis and the regeneration of the extracellular matrix of
the intervertebral disc (8,9),
another study demonstrated no effect of BMPs in preventing the
degeneration of the intervertebral disc, but demonsrated that it
led to intervertebral disc calcification (10). The expression of runt-related
transcription factor 2 (Runx2), a key transcription factor for
chondrocyte hypertrophic differentiation (11), has been shown to be upregulated in
the degenerative discs of dogs (12) and humans (13). Unlike dystrophic calcification,
disc ossification is a positive osteogenic process associated with
osteoblasts (14); however, the
origin of osteogenic cells remains unclear. According to Risbud
et al, these osteogenic cells differentiate from the initial
cells residing in intervertebral disc tissue (15). Studies have demonstrated the
osteogenic potential of annulus fibrosus cells which leads to
ossification by osteogenic inductive stimulation (16,17). Owing to the linkage between
ossification and degeneration, the local environmental factors
appear to be instrumental in causing disc ossification.
The association of disc degeneration (or herniation)
and inflammation is well documented, with several inflammatory
factors now known to be implicated in the degeneration of
intervertebral discs (18).
However, whether these inflammatory factors are the cause of
degeneration or the result of degeneration is yet to be completely
understood. The presence of local inflammation and angiogenesis in
herniated and ossified discs indicates that the ossification
process may be related to these two processes (19). However, whether the inflammatory
and angiogenic factors involved in disc herniation are akin to
those in ossified discs has yet to be determined.
High-throughput sequencing is a useful method to
detect the underlying molecular mechanisms of any disease and can
provide valuable pointers to guide future research. There are very
few studies which have applied bioinformatics analysis and
identified group of genes and single nucleotide polymorphisms
(SNPs) associated with intervertebral disc degeneration and
disc-related disorders (20).
These studies have mainly centered on the genes involved in
degeneration of the intervertebral discs, and do not dwell on the
osteogenic process in the degenerated discs. Screening for
differentially expressed genes (DEGs) focuses on the mRNA
expression in a tissue, and can allow for the detection of
different genes between 2 groups, and which in turn may help to
unravel the probable mechanisms of a certain pathogenesis at the
gene level.
The purpose of this study was to detect the DEGs
between ossified and non-ossified herniated discs. In addition,
bioinformatics tools were employed to identify potential candidate
genes and pathways for further research.
Materials and methods
Case selection and grouping
Patients diagnosed with lumbar intervertebral disc
herniation or herniation combined with spinal canal stenosis at the
Peking University Third hospital from February, 2015 to May, 2015
were included in the study. All cases were scheduled for lumbar
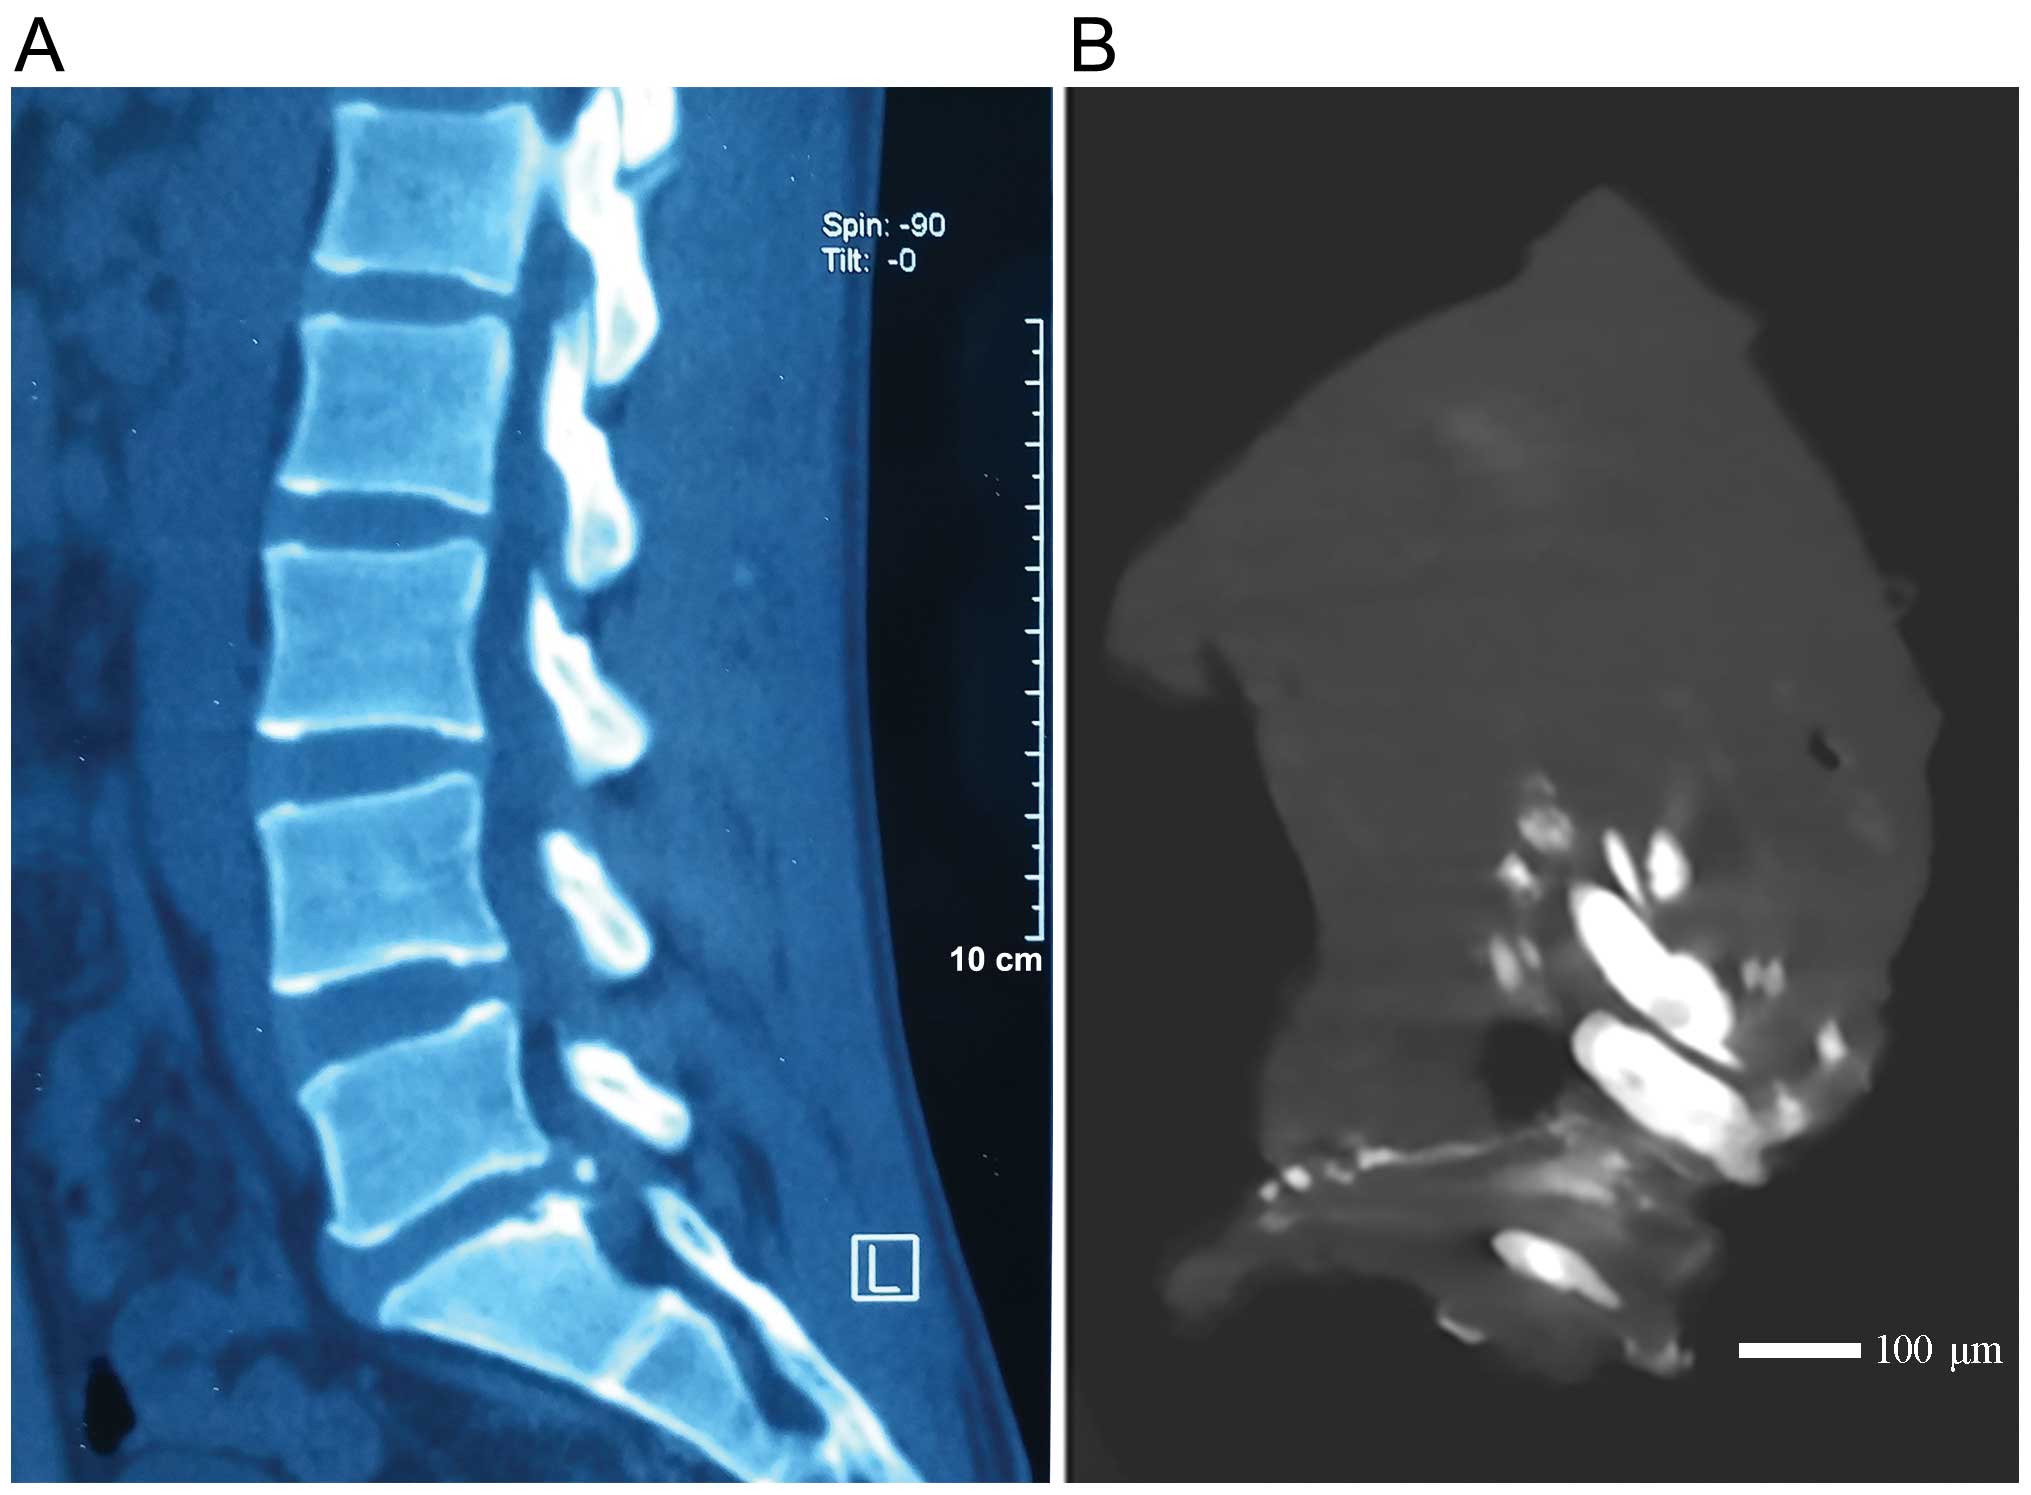
spinal surgery for the first time. We sampled 6 discs from 6
patients with ossified intervertebral discs as the experiment
group. After sampling, these cases were confirmed by computed
tomography (CT) scan and verified by micro CT scan as shown in
Fig. 1. Another 6 iscs from 6
patients suffering from intervertebral disc herniation without disc
ossification served as the control group. Patients with gout,
hypercalcemia, congenital bone metabolism disorders or bone
malformation were excluded from the study. This study was approved
by Medical Scientific Research Ethics Committee of Peking
University Third Hospital, Beijing, China with the certification
number 2015006. Written informed consent was obtained from all
patients prior to obtaining the samples.
Reagents
TRIzol reagent (15596-026) for total RNA extraction
was obtained from Invitrogen, Life Technologies (Carlsbad, CA,
USA). The RevertAid first-strand cDNA synthesis kit (K1633) from
ThermoScientific (Waltham, MA, USA) was used for reverse
transcription. FastStart Universal SYBR-Green Master from Roche
(Basel, Switzerland) was used for carrying out quantitative
polymerase chain reaction (qPCR). Primers were synthesized by
Invitrogen Biotechnology Co., Ltd. (Shanghai, China).
Sampling
After the laminas were removed by the posterior
lumbar spinal procedure, the nerve root and the posterior
longitudinal ligament of the herniated side of the intervertebral
disc was retracted, leaving space for a circular incision to be
made in the annular fibrosus. A nucleus pulposus clamp was used to
extract the first piece of the herniated disc, and used as a
specimen. For the purpose of uniformity, totally ossified discs
which could not be sampled by this method were excluded. Following
their excision, the specimens were immediately kept in frozen
storage tubes and placed in liquid nitrogen. As the pre-procedure
CT scan images had already been obtained, the specimens were
directly transported for the micro CT scan and later stored at
−80°C until further analyses.
Micro CT scan
A Siemens Inveon Micro CT scanner (Siemens Medical
Solutions, Knoxville, TN, USA) was used to analyze the specimens
using the following parameters: X-ray beam voltage, 80 kV; current,
500 μA; and effective resolution 13.6 μm. Referring
to the semi-quantitative grading criteria of Rutges et al
(14), the following criteria
were adopted for this analysis: the absence of calcification was
indicated as -; the presence of a single area of calcification as
±; the presence of 2 clear areas of calcification as +; and the
clear presence of multiple areas of calcification as ++. We
designated - or ± for a negative CT scan as the control group; ++
with positive CT scan as experiment group. At least 2 of the
authors collaborated to assess the ossification from the CT
radiograph and the ossification grade according to the micro CT
analysis.
mRNA extraction
Following micro-CT analysis, the ossified disc group
was considered as the experiment group, and the degenerated
herniated disc group without ossification as the control group. For
the mRNA extraction, the specimens were treated with TRIzol reagent
and grinded sufficiently. The specimens were then centrifuged (8000
× g, 4°C) and reconstituted in methenyltrichloride and propyl
alcohol. The total RNA was stored at −80°C for further sequencing
and verification.
Sequencing and bioinformatics
analysis
Sequencing was performed at the Beijing Genomics
Institute (BGI). The total RNA samples were treated with DNase I to
avoid DNA contamination. The enriched mRNA was mixed and fragmented
into short fragments using fragmentation buffer. After the
double-strand cDNA fragments were synthesized and purified, end
reparation and 3′-end single nucleotide A (adenine) addition was
performed. Finally, the sequencing adaptors to the fragments were
ligated. Following enrichment by PCR amplification, the fragments
were sequenced using a Illumina HiSeq™ 2000 sequencer (Illumina
Inc., Santiago, CA, USA). Primary sequencing data generated by
Illumina HiSeq™ 2000 was referred to as raw reads. The raw reads
are filtered into clean reads which were aligned to the reference
sequences subsequently by using the Burrows-Wheeler Alignment BWA
(21)/Bowtie2 (22) tool. The NOISeq (23) method was used to screen DEGs
between 2 groups. Furthermore, an in depth analysis using
bioinformatics tools based on the DEGs was performed, including GO
enrichment analysis, KEGG pathway enrichment analysis, and
protein-protein interaction network analysis. After mapping all the
DEGs to GO terms according to the database in the website,
http://www.geneontology.org/, the
numbers for each GO term were calculated; the significantly
enriched GO terms were found by using 'GO::TermFinder' tool on the
website, http://www.yeastgenome.org/help/analyze/go-term-finder.
All the DEGs annotated in the GO database were used to perform GO
functional classification using WEGO (24) software for understanding the
distribution of gene functions from the macro level. DEGs for KEGG
enrichment analysis were mapped to the KEGG database. After the GO
and KEGG data were analyzed, a P-value was obtained. The
protein-protein interaction network of the top 20 DEGs was
completed based on the local database of BGI which integrated the
Biomolecular Interaction Network Database (BIND), Biological
General Repository for Interaction Datasets (BioGRID) and the Human
Protein Reference Database (HPRD).
Verification
ELK2P was tagged for the member of the ETS oncogene
family, and the expression of bone gamma-carboxyglutamate protein
(BGLAP) had been tested in our previous study (25). Hence, we verified the top 6 DEGs
excluding ELK2P and BGLAP by RT-qPCR after the screening of the
DEGs. Reverse transcription for cDNA synthesis was performed as per
the manufacturer's instructions (RevertAid First Strand cDNA
synthesis kit). Glyceraldehyde 3-phosphate dehydrogenase (GAPDH)
was used as the reference gene, and qPCR was performed as per the
protocol recommended by the manufacturer (FastStart Universal
SYBR-Green Master) with the primers listed in Table I. The PCR program was set as
follows: pre-denaturation at 95°C for 10 min, cooling to 60°C for
15 sec, held for 60 sec for 40 cycles, elongation at 60°C for 5
min, and then an increase from 75°C to 95°C at 1°C/20 sec to obtain
the melting curve. Relative gene expression was normalized to the
control group by referring to the Livak and Schmittgen method
(26).
 | Table ISequences of primers for RT-qPCR. |
Table I
Sequences of primers for RT-qPCR.
| Gene | Upstream
primer | Downstream
primer |
|---|
| GAPDH |
AGCCACATCGCTCAGACAC |
GCCCAATACGACCAAATCC |
| SOST |
GTGGCAGGCGTTCAAGAATG |
CCCGGTTCATGGTCTTGTTG |
| IGJ |
GGAGTCCTGGCGGTTTTTAT |
GGATCTTCGGAAGAACGGAT |
| DEFA4 |
GCCCTCCTCGCTGCTATTCT |
ATGTCCTGGTCTTCTGGCCC |
| SFRP4 |
ACTGCGAGCCCCTCATGAAG |
CTTCAGGCGAGATGCACACG |
| PRTN3 |
CCTGCAGGAGCTCAATGTCA |
GAGTCTCCGAAGCAGATGCC |
| CTSG |
AACGGAAGGCTGCCTTCAAG |
CTGGAGGAACCCCTGACGAC |
Statistical analysis
The NOISeq method was used to assess the DEGs in the
2 groups using the following criteria as default: fold-change ≥2.0
and diverge probability ≥0.8. The associated P-value for the GO and
KEGG enrichment analysis was subjected to Bonferroni Correction and
a corrected P-value obtained. A Corrected P-value <0.05 was
considered indicative of a statistically significant difference.
Statistical analysis of the verification was performed using SPSS
20.0 (International Business Machines Corporation, Armonk, NY,
USA). An independent sample t-test was used to analyze the RT-qPCR
verification results between the ossified and non-ossified
degeneration group. Inter-group differences with an associated
P-value <0.05 were considered as statistically significant.
Results
Sequencing and raw data filtering
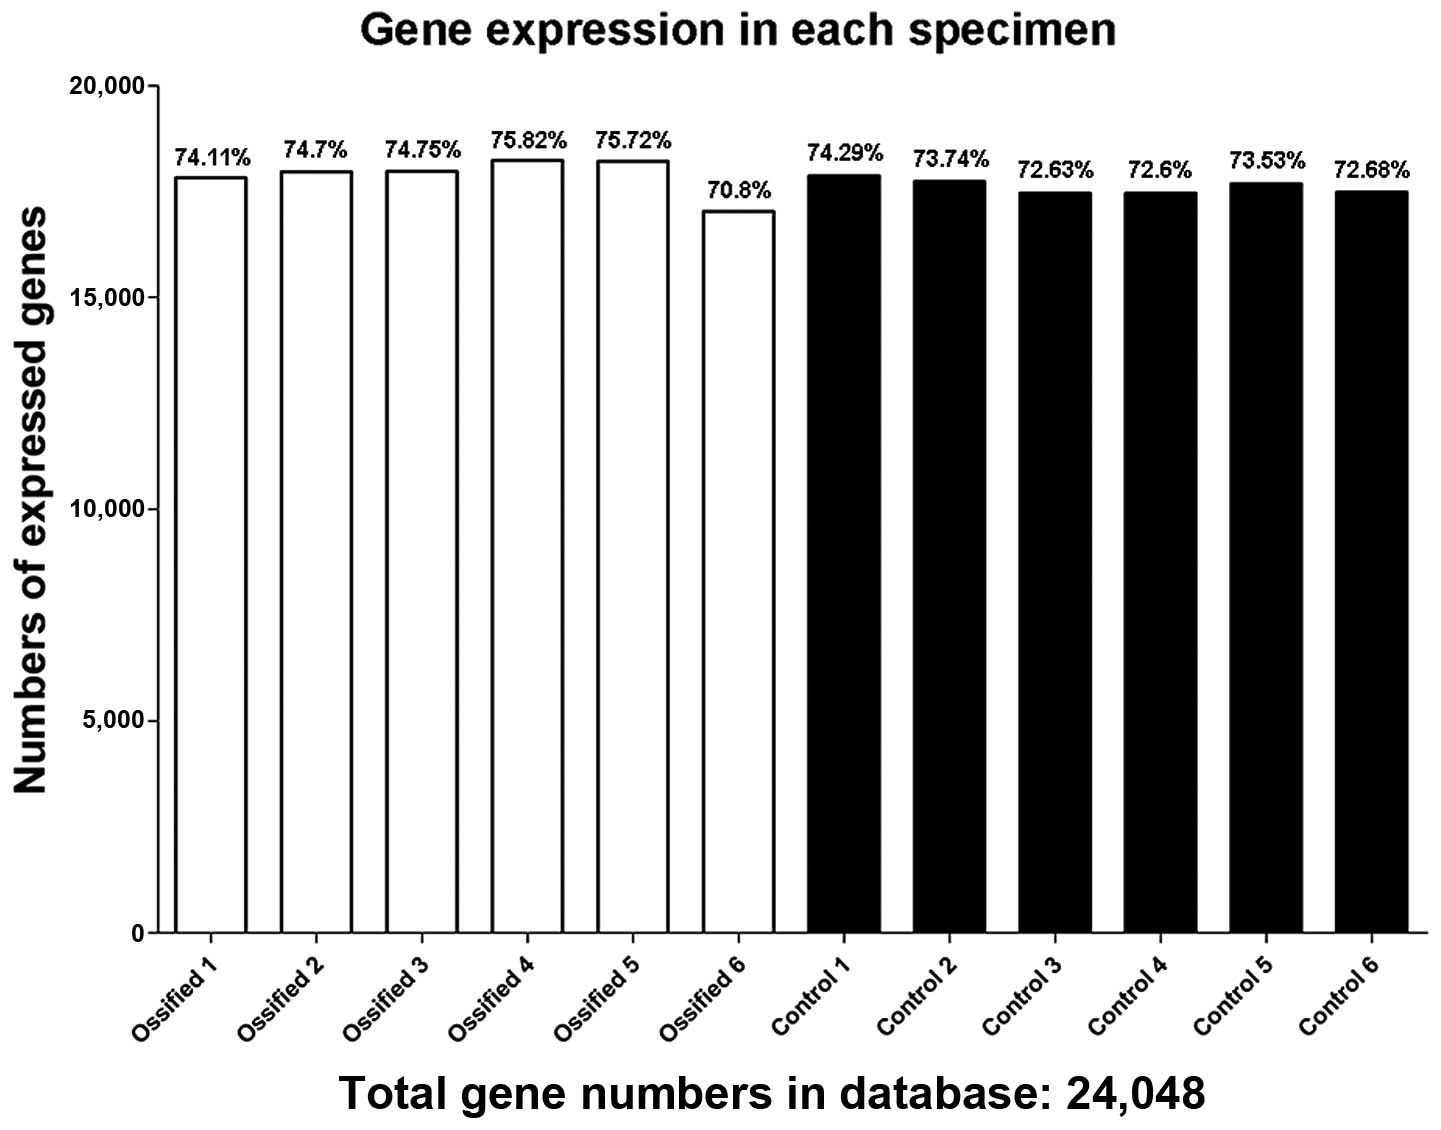
We sequenced 12 samples by RNA-Seq technology and
generated an average of 13,127,595.5 raw reads. After the low
quantity reads were filtered, an average of 12,994,408 clean reads
was acquired. The data pertaining to each sample are listed in
Table II. The numbers of
expressed genes and the expression ratio in each specimen are shown
in Fig. 2.
| Table IISequencing data for each
specimen. |
Table II
Sequencing data for each
specimen.
| Sample | Age (years) | Gender | Raw reads no. | Clean reads
no. | Clean datarate
(%) | Clean Read1 Q20 (%)
≥95 | Clean Read1 Q30 (%)
≥90 | Clean Reads ≥10
M | Gene mapping ratio
(%) ≥80 | Genome mapping
ratio (%) ≥50 |
|---|
| Ossified 1 | 62 | F | 13,127,663 | 13,113,920 | 99.89 | 98.9 (Y) | 96.0 (Y) | 13.11M (Y) | 92.22 (Y) | 86.64 (Y) |
| Ossified 2 | 33 | M | 13,127,599 | 13,100,270 | 99.79 | 98.8 (Y) | 95.9 (Y) | 13.10M (Y) | 92.03 (Y) | 86.20 (Y) |
| Ossified 3 | 62 | F | 13,127,628 | 13,106,545 | 99.83 | 98.9 (Y) | 96.0 (Y) | 13.11M (Y) | 90.67 (Y) | 88.20 (Y) |
| Ossified 4 | 63 | F | 13,127,584 | 12,524,724 | 95.4 | 98.9 (Y) | 96.1 (Y) | 12.52M (Y) | 83.85 (Y) | 88.96 (Y) |
| Ossified 5 | 50 | M | 13,127,257 | 13,110,977 | 99.87 | 99.1 (Y) | 97.0 (Y) | 13.11M (Y) | 91.05 (Y) | 88.56 (Y) |
| Ossified 6 | 26 | M | 13,127,394 | 12,597,800 | 95.96 | 99.0 (Y) | 96.6 (Y) | 12.60M (Y) | 82.21 (Y) | 88.91 (Y) |
| Control 1 | 58 | F | 13,127,248 | 13,107,152 | 99.84 | 98.8 (Y) | 95.9 (Y) | 13.11M (Y) | 92.30 (Y) | 86.93 (Y) |
| Control 2 | 12 | F | 13,127,788 | 12,907,909 | 98.32 | 98.8 (Y) | 95.9 (Y) | 12.91M (Y) | 92.56 (Y) | 85.80 (Y) |
| Control 3 | 53 | F | 13,127,674 | 13,059,401 | 99.47 | 98.8 (Y) | 95.9 (Y) | 13.06M (Y) | 93.05 (Y) | 86.58 (Y) |
| Control 4 | 25 | M | 13,127,590 | 13,079,633 | 99.63 | 99.1 (Y) | 97.0 (Y) | 13.08M (Y) | 91.84 (Y) | 86.71 (Y) |
| Control 5 | 24 | F | 13,127,758 | 13,114,894 | 99.9 | 99.0 (Y) | 96.4 (Y) | 13.11M (Y) | 92.16 (Y) | 86.40 (Y) |
| Control 6 | 38 | M | 13,127,963 | 13,109,683 | 99.86 | 99.2 (Y) | 97.3 (Y) | 13.11M (Y) | 93.13 (Y) | 82.50 (Y) |
Differentially expressed genes
A total of 132 DEGs was detected in this study. A
total of 129 in the ossification group were upregulated as compared
to those in the control group, while 3 genes were found to be
downregulated. The top 20 DEGs according to the probability value
are listed in Table III.
| Table IIITop 20 DEGs. |
Table III
Top 20 DEGs.
| Gene ID | Symbol | log2Ratio
(ossified/control) | Probability | Up/down
regulation | Description |
|---|
| 50964 | SOST | 9.658888588 | 0.980396 | Up | Sclerostin |
| 3512 | IGJ | 6.673912182 | 0.967813 | Up | Immunoglobulin J
polypeptide |
| 632 | BGLAP | 5.492969178 | 0.962151 | Up | Bone
γ-carboxyglutamate (gla) protein |
| 2003 | ELK2AP | 5.437789846 | 0.960819 | Up | ELK2A |
| 1669 | DEFA4 | 5.317314168 | 0.956617 | Up | Defensin, α4 |
| 6424 | SFRP4 | 5.055694219 | 0.95017 | Up | Secreted
frizzled-related protein 4 |
| 5657 | PRTN3 | 4.933061142 | 0.947346 | Up | Proteinase 3 |
| 1511 | CTSG | 4.657946704 | 0.941332 | Up | Cathepsin G |
| 1991 | ELANE | 4.591945637 | 0.941047 | Up | Elastase |
| 566 | AZU1 | 4.584099727 | 0.940888 | Up | Azurocidin 1 |
| 100423062 | IGLL5 | 4.310197783 | 0.933947 | Up | Immunoglobulin
λ-like polypeptide 5 |
| 2812 | GP1BB | 10.73075316 | 0.931232 | Up | Glycoprotein Ib
(platelet), β polypeptide |
| 63924 | CIDEC | 6.76165846 | 0.930184 | Up | Cell death-inducing
DFFA-like effector c |
| 3543 | IGLL1 | 5.1749338 | 0.928683 | Up | Immunoglobulin
λ-like polypeptide 1 |
| 728358 | DEFA1B | 3.988886669 | 0.92734 | Up | Defensin, α1B |
| 4353 | MPO | 4.209517648 | 0.927108 | Up |
Myeloperoxidase |
| 55363 | HEMGN | 4.89235857 | 0.927006 | Up | Hemogen |
| 6037 | RNASE3 | 4.64090047 | 0.926718 | Up | Ribonuclease, RNase
A family, 3 |
| 6036 | RNASE2 | 4.154822975 | 0.919141 | Up | Ribonuclease, RNase
A family, 2 |
| 11197 | WIF1 | 5.058808822 | 0.917018 | Up | WNT inhibitory
factor 1 |
GO enrichment analysis
The GO functional classification used in this study
is illustrated in Fig. 3.
Referring to the corrected P-values, the top 3 enrichment terms in
all the 3 GO ontologies were listed: cellular component, molecular
function and biological process (Table IV).
| Table IVTop 3 enrichment terms in all three
GO ontologies. |
Table IV
Top 3 enrichment terms in all three
GO ontologies.
| GO ontologies | GO terms | Cluster
frequency | Genome frequency of
use | Corrected
P-value |
|---|
| Cellular
component | GO:0044421 -
extracellular region part | 32 (101),
31.7% | 1055 (16090),
6.6% | 1.70E-12 |
| Cellular
component | GO:0005576 -
extracellular region | 32 (101),
31.7% | 1077 (16090),
6.7% | 3.02E-12 |
| Cellular
component | GO:0016023 -
cytoplasmic membrane- bounded vesicle | 12 (101),
11.9% | 609 (16090),
3.8% | 0.03246 |
| Molecular
function | GO:0030247 -
polysaccharide binding | 11 (95), 11.6% | 159 (15165),
1.0% | 3.48E-07 |
| Molecular
function | GO:0001871 -
pattern binding | 11 (95), 11.6% | 169 (15165),
1.1% | 6.60E-07 |
| Molecular
function | GO:0005539 -
glycosaminoglycan binding | 10 (95), 10.5% | 142 (15165),
0.9% | 1.54E-06 |
| Biological
process | GO:0006952 -
defense response | 25 (108),
23.1% | 601 (14596),
4.1% | 6.26E-10 |
| Biological
process | GO:0002376 - immune
system process | 33 (108),
30.6% | 1106 (14596),
7.6% | 8.06E-10 |
| Biological
process | GO:0050896 -
response to stimulus | 54 (108),
50.0% | 3380 (14596),
23.2% | 4.94E-07 |
KEGG enrichment analysis
The most enriched pathways based on KEGG were
asthma, malaria, African trypanosomiasis, staphylococcus
aureus infection, collecting duct acid secretion and primary
immunodeficiency. The top 10 KEGG enriched pathways are listed in
Table V.
| Table VThe top 10 KEGG enriched
pathways. |
Table V
The top 10 KEGG enriched
pathways.
| Pathway ID | Pathway | DEGs with pathway
annotation
(108) | All genes with
pathway annotation
(17252) | P-value |
|---|
| ko05310 | Asthma | 7 (6.48%) | 47 (0.27%) | 1.58E-08 |
| ko05144 | Malaria | 7 (6.48%) | 76 (0.44%) | 4.75E-07 |
| ko05143 | African
trypanosomiasis | 6 (5.56%) | 54 (0.31%) | 1.06E-06 |
| ko05150 | Staphylococcus
aureus infection | 6 (5.56%) | 139 (0.81%) | 0.00024 |
| ko04966 | Collecting duct
acid secretion | 4
(3.7%) | 51 (0.3%) | 0.00029 |
| ko05340 | Primary
immunodeficiency | 4
(3.7%) | 61 (0.35%) | 0.00058 |
| ko04610 | Complement and
coagulation cascades | 6 (5.56%) | 181 (1.05%) | 0.00097 |
| ko05322 | Systemic lupus
erythematosus | 6 (5.56%) | 188 (1.09%) | 0.0012 |
| ko04640 | Hematopoietic cell
lineage | 5 (4.63%) | 152 (0.88%) | 0.0027 |
| ko03320 | PPAR signaling
pathway | 4
(3.7%) | 135 (0.78%) | 0.01 |
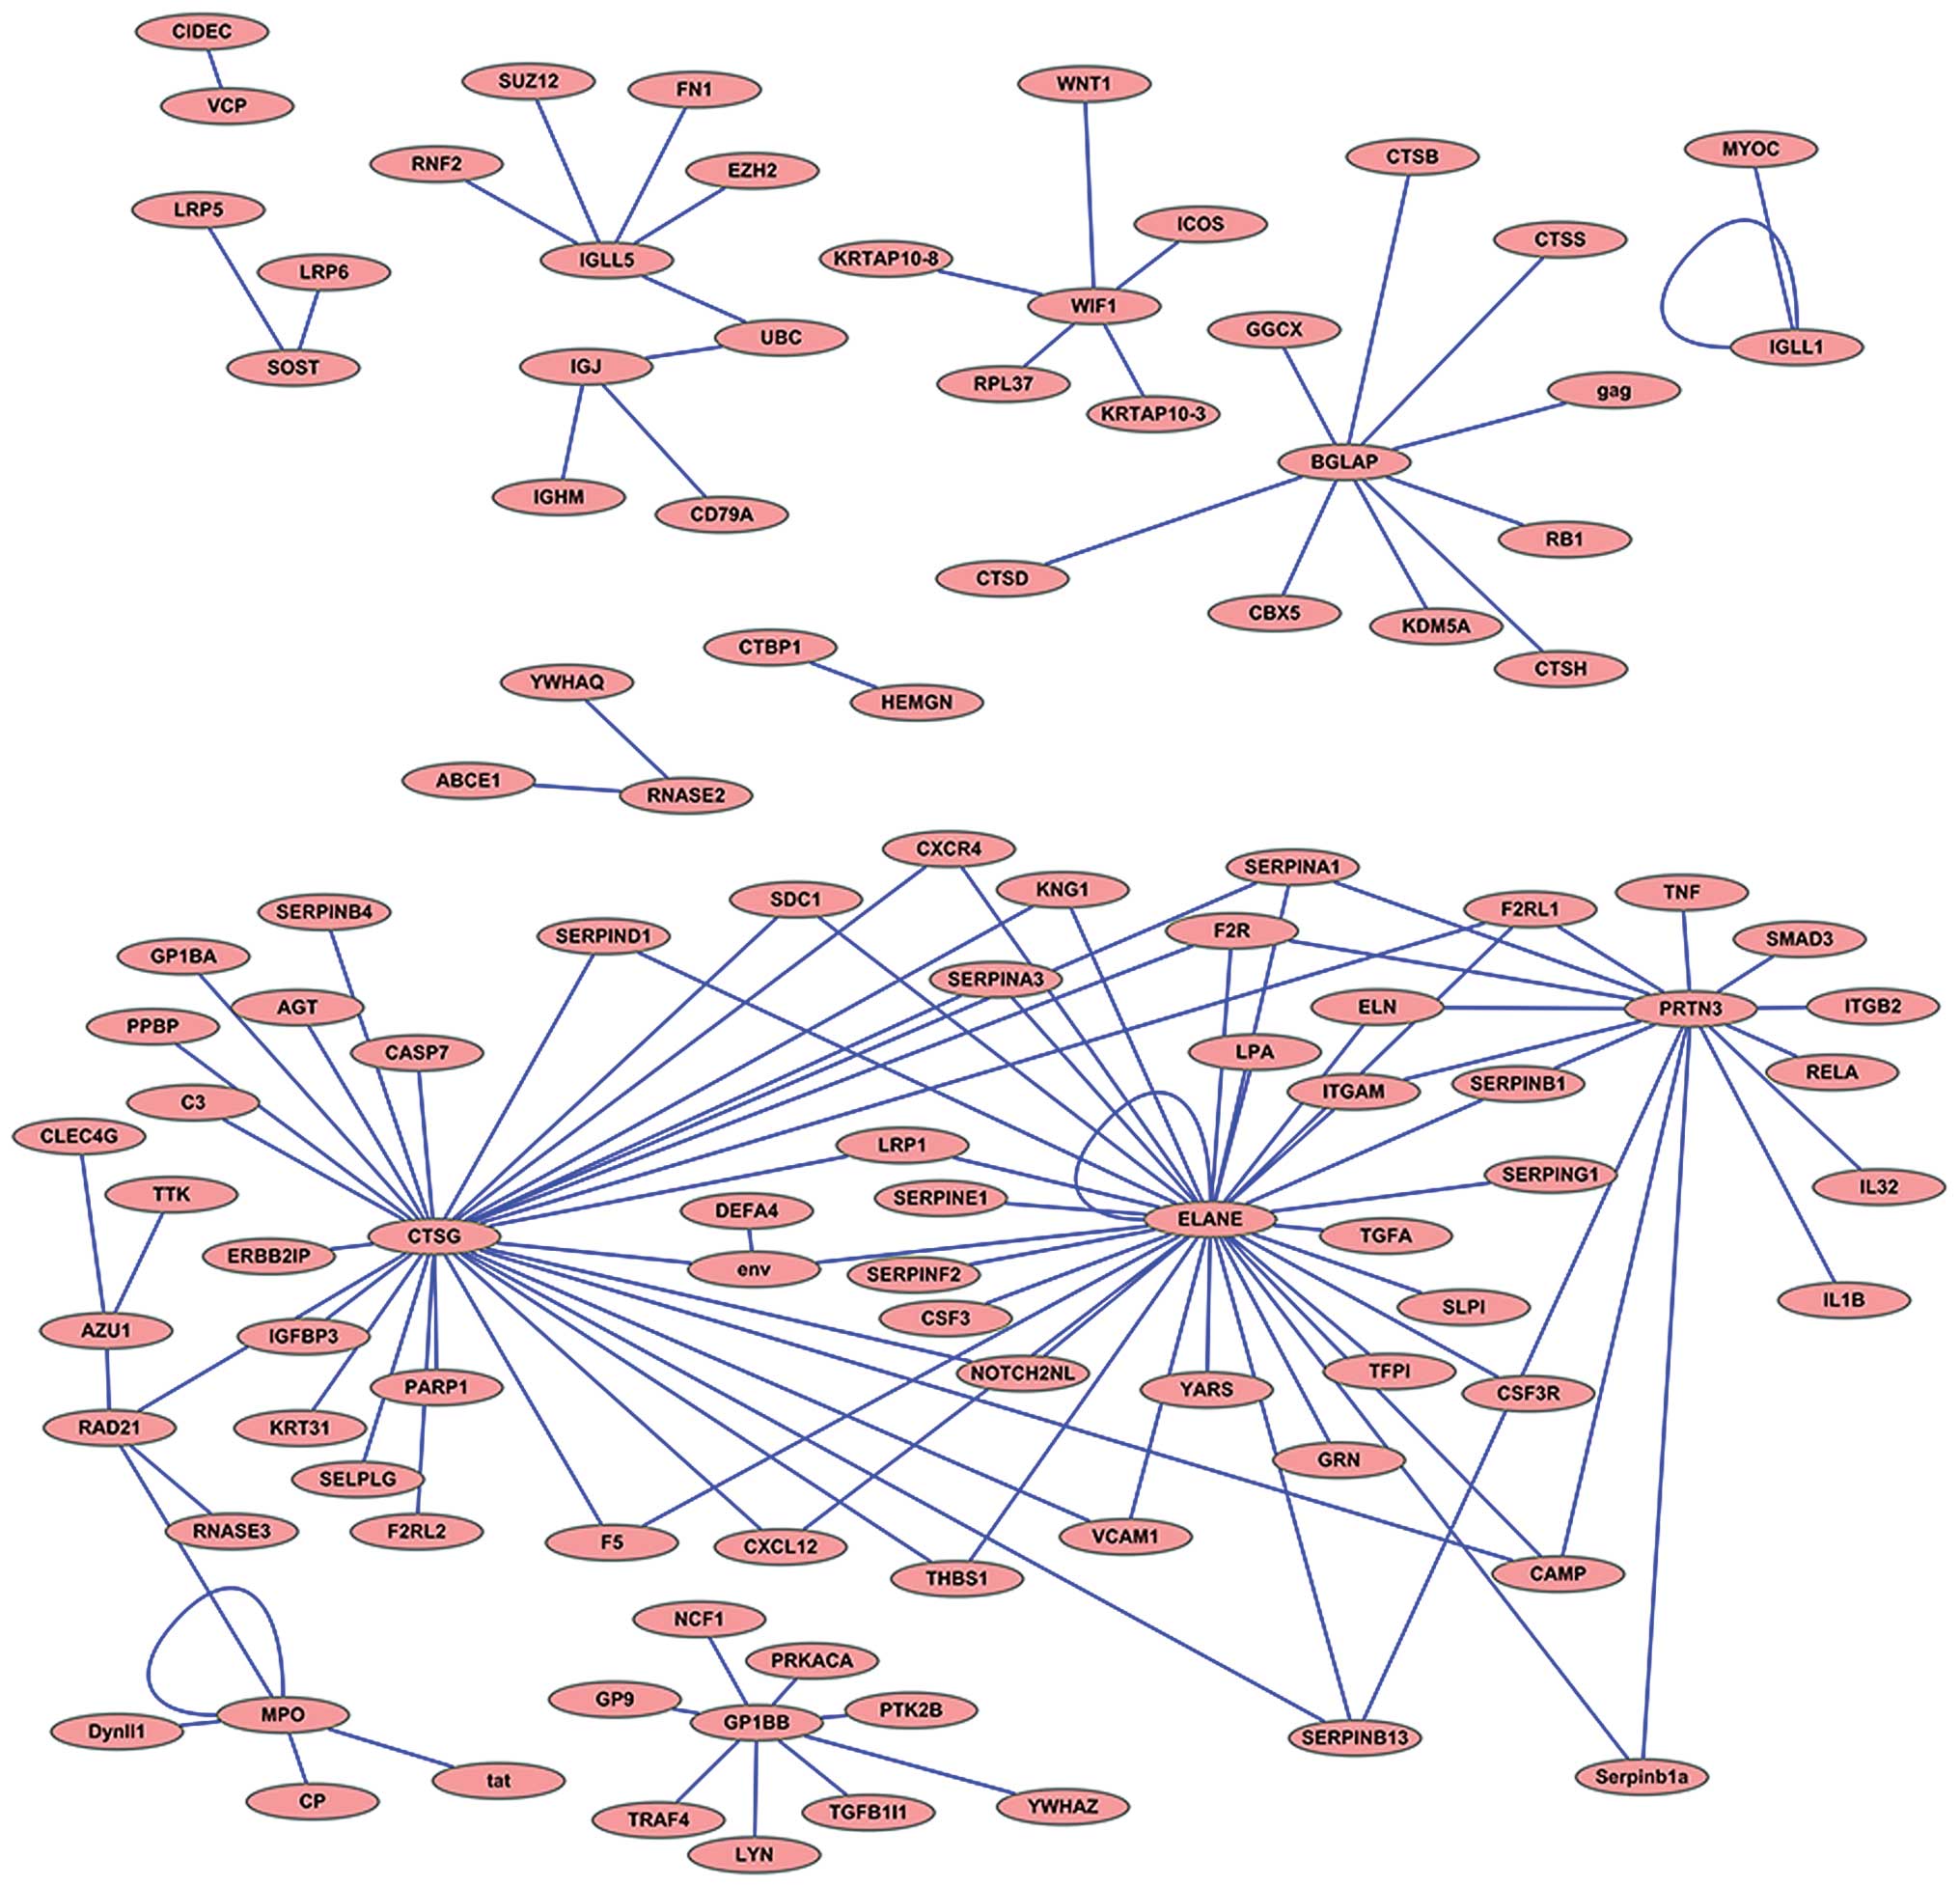
Protein-protein interaction network
analysis
Protein-protein interaction network analysis was
performed using the coding proteins of the top 20 DEGs based on the
interaction network database BIND; the results are illustrated
using Medusa software (27)
(Fig. 4).
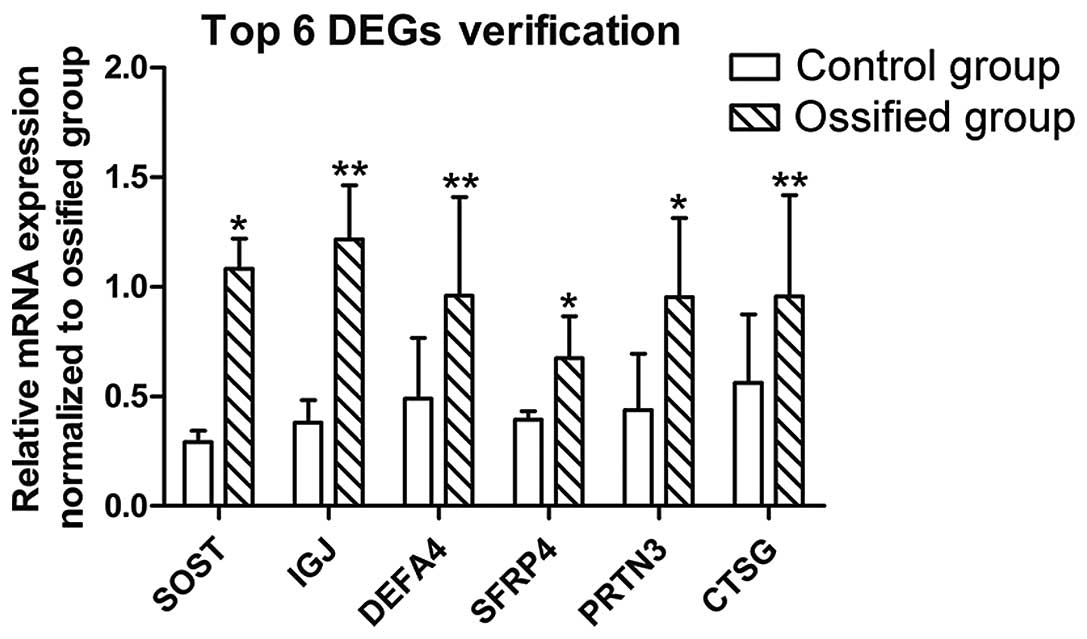
Verification by RT-qPCR
The results of RT-PCR are shown in Fig. 5. The ossified discs exhibierd a
higher expression of the top 6 DEGs: SOST, IGJ, DEFA4, SFRP4, PRTN3
and CTSG, with associated P-values of 0.045, 0.000, 0.008, 0.010,
0.015 and 0.002, respectively, and F-values of 4.868, 159.719,
10.201, 8.401, 8.266 and 17.783, respectively, calculated using an
independent sample t-test. The results were consistent with those
of the DEG sequencing.
Discussion
Disc ossification is not a rare phenomenon (28). The ossification rate is known to
correlate with the degeneration grade of intervertebral discs and
the Modic type endplate (19).
The underlying mechanisms responsible for the ossification of
intervertebral discs are unclear. To the best of our knowledge, the
present study is the first to determine the DEGs between ossified
discs and non-ossified discs by employing high-throughput
sequencing technology. After sequencing, the NOISeq method was
applied to determine the DEGs. These results were verified and were
found to be consistent with those of DEGs obtained by performing
RT-qPCR.
We selected the top 20 DEGs and focused on some of
these genes as our candidate genes for further research. According
to the diverge probability calculated by the NOISeq method, SOST
was the topmost DEG. The coding product of SOST is sclerostin, a
glycoprotein secreted by osteocytes, which is an important marker
of late-stage osteoblasts/osteocytes. An earlier study suggested
sclerostin to act as a BMP-inhibitor by competitively binding to
BMP receptors, thereby inhibiting osteoblast differentiation and
osteogenesis induced by BMPs (29). By contrast, other studies have
suggested that the inhibitory effect of sclerostin was mediated
through the Wnt signaling pathway and not by BMP (30,31). Since there are contradicting
results related to the effect of sclerostin on the ossification of
discs (32), further studies are
required to delineate its role.
We were interested in another DEG, BGLAP, which
codes for osteocalcin protein. Osteocalcin is an important protein
marker of late stage osteogenesis secreted by osteoblasts (33). It is abundant in γ-carboxyglutamic
acid (Gla) residue and can combine with the calcium ions in
hydroxyapatite to form osteoid element (34,35). The upregulated expression of SOST
and BGLAP indicated that the calcification of the intervertebral
disc was not a dystrophic calcification, but an osteogenic process
involving the participation of osteoblasts. This observation is
consistent with some earlier reports (14,15), and it also serves to verify the
rationale behind our sampling process using CT and micro CT
scan.
All the top 3 cellular components of GO ontologies
analysis based on DEGs were extracellular components which indicate
that these proteins are of the secretory type. GO functions are
mainly related to the interaction of the glycoprotein in the cell
membrane with the extracellular matrix. The GO processes are
associated with completing response to stimulus, immune reflex and
defense.
The top 5 KEGG enrichment pathways are associated
with infection and inflammation. On scrutinizing the top 20 DEGs,
we found that 3 genes: SOST, WIF1 and SFRP4 were related to the
inhibition of the Wnt signaling pathway (36–38). SOST, the topmost DEG, is not
termed by KEGG. The KEGG enrichment pathway analysis was performed
using all the DEGs, which, to some extent, could have served to
obscure the identification of the Wnt pathway. We believe that disc
ossification is associated with the inhibition of the Wnt pathway
due to the identification of several gene products related to Wnt
inhibition. Whether the ossification is caused by Wnt pathway
inhibition or Wnt was inhibited by the ossification is still not
clear from the findings of our study.
Degenerative discs do exhibit the expression of
BMP-2 (39), which is a widely
known inducer of bone formation. Furthermore, the existence of
crosstalk between BMP-2 and Wnt pathways in the degenerated discs
suggests that BMP-2 pathway can inhibit the Wnt pathway (40). However in a recent study,
Wnt/β-catenin signaling was found to activate BMP-2 expression in
osteoblasts (41). Taking into
consideration the association between the Wnt/β-catenin signaling
and BMP-2 pathway, we hypothesized that the BMP-2 pathway may play
a role in the the overexpression of Wnt inhibitors. This needs to
be further investigated in in vitro cell experiments.
Although inflammation is thought to play an
important role in intervertebral disc degeneration and herniation
(18), definitive evidence of
this association has yet to be obtained. Several inflammatory
factors, such as tumor necrosis factor (TNF)-α, interleukin
(IL)-1β, IL-6 and IL-8, have been implicated in the causation of
disc degeneration and herniation (42–45). By contrast, this study found that
none of the DEGs encoded for these inflammatory factors. We found a
comprehensive expression of inflammation-related factors, such as
defencin α4, proteinase 3, cathepsin G, elastase, azurocidin 1 and
defensin α1B, which are encoded by the genes, DEFA4, PRTN3, CTSG,
ELANE, AZU1 and DEFA1B. These genes were among the top 20
differentially expressed genes between the experimental and the
control groups. As regards the link between the intervertebral disc
calcification and inflammation around the herniated discs (19), as well as the association between
inflammation and ossification (46), we believe that the inflammatory
factors coding DEGs may be specifically related to disc
ossification.
The main limitation of the present study is its
descriptive nature. The abnormal Wnt pathway and the overexpression
of some inflammation-related factors documented in this study
appear to be two crucial elements involved in causing disc
ossification. However, in vivo and in vitro studies
are required to thoroughly assess this observed association. We
performed an elementary study of the molecular mechanisms
underlying disc ossification. We found a potential mechanism,
which, however, needs to be further investigated as a step towards
the development of gene therapy targeting disc ossification in the
future. We believe that our study is helpful to finally elucidate
out the mechanisms responsible for disc ossification, and patients
may benefit from the prevention and treatment of herniated disc
with ossification at the gene level.
Abbreviations:
|
CT
|
computed tomography
|
|
DEGs
|
differentially expressed genes
|
|
GO
|
Gene Ontology
|
|
KEGG
|
Kyoto Encyclopedia of Genes and
Genomes
|
|
PCR
|
polymerase chain reaction
|
|
BMPs
|
bone morphogenetic proteins
|
|
Runx2
|
runt-related transcription factor
2
|
|
SNPs
|
single nucleotide polymorphisms
|
|
BGI
|
Beijing Genomics Institute
|
|
BIND
|
Biomolecular Interaction Network
Database
|
|
BioGRID
|
Biological General Repository for
Interaction Datasets
|
|
HPRD
|
Human Protein Reference Database
|
|
Gla
|
γ-carboxyglutamic acid
|
References
|
1
|
Urban JP and Roberts S: Degeneration of
the intervertebral disc. Arthritis Res Ther. 5:120–130. 2003.
View Article : Google Scholar : PubMed/NCBI
|
|
2
|
Taher F, Essig D, Lebl DR, Hughes AP, Sama
AA, Cammisa FP and Girardi FP: Lumbar degenerative disc disease:
Current and future concepts of diagnosis and management. Adv
Orthop. 2012:9707522012. View Article : Google Scholar : PubMed/NCBI
|
|
3
|
Parker SL, Godil SS, Mendenhall SK,
Zuckerman SL, Shau DN and McGirt MJ: Two-year comprehensive medical
management of degenerative lumbar spine disease (lumbar
spondylolisthesis, stenosis, or disc herniation): a value analysis
of cost, pain, disability, and quality of life: clinical article. J
Neurosurg Spine. 21:143–149. 2014. View Article : Google Scholar : PubMed/NCBI
|
|
4
|
Froud R, Patterson S, Eldridge S, Seale C,
Pincus T, Rajendran D, Fossum C and Underwood M: A systematic
review and meta-synthesis of the impact of low back pain on
people's lives. BMC Musculoskelet Disord. 15:502014. View Article : Google Scholar : PubMed/NCBI
|
|
5
|
Barbanera A, Serchi E, Fiorenza V, Nina P
and Andreoli A: Giant calcified thoracic herniated disc:
considerations aiming a proper surgical strategy. J Neurosurg Sci.
53:25–26. 2009.
|
|
6
|
Prescher A: Anatomy and pathology of the
aging spine. Eur J Radiol. 27:181–195. 1998. View Article : Google Scholar : PubMed/NCBI
|
|
7
|
Takae R, Matsunaga S, Origuchi N, Yamamoto
T, Morimoto N, Suzuki S and Sakou T: Immunolocalization of bone
morphogenetic protein and its receptors in degeneration of
intervertebral disc. Spine. 24:1397–1401. 1999. View Article : Google Scholar : PubMed/NCBI
|
|
8
|
Tim Yoon S, Su Kim K, Li J, Soo Park J,
Akamaru T, Elmer WA and Hutton WC: The effect of bone morphogenetic
protein-2 on rat intervertebral disc cells in vitro. Spine.
28:1773–1780. 2003. View Article : Google Scholar : PubMed/NCBI
|
|
9
|
Kim H, Lee JU, Moon SH, Kim HC, Kwon UH,
Seol NH, Kim HJ, Park JO, Chun HJ, Kwon IK and Lee HM: Zonal
responsiveness of the human intervertebral disc to bone
morphogenetic protein-2. Spine. 34:1834–1838. 2009. View Article : Google Scholar : PubMed/NCBI
|
|
10
|
Haschtmann D, Ferguson SJ and Stoyanov JV:
BMP-2 and TGF-β3 do not prevent spontaneous degeneration in rabbit
disc explants but induce ossification of the annulus fibrosus. Eur
Spine J. 21:1724–1733. 2012. View Article : Google Scholar : PubMed/NCBI
|
|
11
|
Drissi H, Zuscik M, Rosier R and O'Keefe
R: Transcriptional regulation of chondrocyte maturation: Potential
involvement of transcription factors in OA pathogenesis. Mol
Aspects Med. 26:169–179. 2005. View Article : Google Scholar : PubMed/NCBI
|
|
12
|
Itoh H, Hara Y, Tagawa M, Kato T, Ochi H,
Koga D, Okawa A and Asou Y: Evaluation of the association between
runt-related transcription factor 2 expression and intervertebral
disk aging in dogs. Am J Vet Res. 73:1553–1559. 2012. View Article : Google Scholar : PubMed/NCBI
|
|
13
|
Sato S, Kimura A, Ozdemir J, Asou Y,
Miyazaki M, Jinno T, Ae K, Liu X, Osaki M, Takeuchi Y, et al: The
distinct role of the Runx proteins in chondrocyte differentiation
and intervertebral disc degeneration: findings in murine models and
in human disease. Arthritis Rheum. 58:2764–2775. 2008. View Article : Google Scholar : PubMed/NCBI
|
|
14
|
Rutges JP, Duit RA, Kummer JA, Oner FC,
van Rijen MH, Verbout AJ, Castelein RM, Dhert WJ and Creemers LB:
Hypertrophic differentiation and calcification during
intervertebral disc degeneration. Osteoarthritis Cartilage.
18:1487–1495. 2010. View Article : Google Scholar : PubMed/NCBI
|
|
15
|
Risbud MV, Guttapalli A, Tsai TT, Lee JY,
Danielson KG, Vaccaro AR, Albert TJ, Gazit Z, Gazit D and Shapiro
IM: Evidence for skeletal progenitor cells in the degenerate human
intervertebral disc. Spine. 32:2537–2544. 2007. View Article : Google Scholar : PubMed/NCBI
|
|
16
|
Nosikova Y, Santerre JP, Grynpas MD and
Kandel RA: Annulus fibrosus cells can induce mineralization: An in
vitro study. Spine J. 13:443–453. 2013. View Article : Google Scholar : PubMed/NCBI
|
|
17
|
Jin L, Liu Q, Scott P, Zhang D, Shen F,
Balian G and Li X: Annulus fibrosus cell characteristics are a
potential source of intervertebral disc pathogenesis. PLoS One.
9:e965192014. View Article : Google Scholar : PubMed/NCBI
|
|
18
|
Molinos M, Almeida CR, Caldeira J, Cunha
C, Gonçalves RM and Barbosa MA: Inflammation in intervertebral disc
degeneration and regeneration. J R Soc Interface. 12:201504292015.
View Article : Google Scholar : PubMed/NCBI
|
|
19
|
Karamouzian S, Eskandary H, Faramarzee M,
Saba M, Safizade H, Ghadipasha M, Malekpoor AR and Ohadi A:
Frequency of lumbar intervertebral disc calcification and
angiogenesis, and their correlation with clinical, surgical, and
magnetic resonance imaging findings. Spine. 35:881–886. 2010.
View Article : Google Scholar : PubMed/NCBI
|
|
20
|
Näkki A, Battié MC and Kaprio J: Genetics
of disc-related disorders: Current findings and lessons from other
complex diseases. Eur Spine J. 23(Suppl 3): S354–S363. 2014.
View Article : Google Scholar
|
|
21
|
Li H and Durbin R: Fast and accurate short
read alignment with Burrows-Wheeler transform. Bioinformatics.
25:1754–1760. 2009. View Article : Google Scholar : PubMed/NCBI
|
|
22
|
Langmead B, Trapnell C, Pop M and Salzberg
SL: Ultrafast and memory-efficient alignment of short DNA sequences
to the human genome. Genome Biol. 10:R252009. View Article : Google Scholar : PubMed/NCBI
|
|
23
|
Tarazona S, García-Alcalde F, Dopazo J,
Ferrer A and Conesa A: Differential expression in RNA-seq: A matter
of depth. Genome Res. 21:2213–2223. 2011. View Article : Google Scholar : PubMed/NCBI
|
|
24
|
Ye J, Fang L, Zheng H, Zhang Y, Chen J,
Zhang Z and Wang J, Li S, Li R, Bolund L and Wang J: WEGO: A web
tool for plotting GO annotations. Nucleic Acids Res. 34:W293–W297.
2006. View Article : Google Scholar : PubMed/NCBI
|
|
25
|
Shao J, Yu M, Jiang L, Wei F, Wu F, Liu Z
and Liu X: Differences in calcification and osteogenic potential of
herniated discs according to the severity of degeneration based on
Pfirrmann grade: a cross-sectional study. BMC Musculoskelet Disord.
17:1912016. View Article : Google Scholar : PubMed/NCBI
|
|
26
|
Livak KJ and Schmittgen TD: Analysis of
relative gene expression data using real-time quantitative PCR and
the 2(-Delta Delta C(T)) Method. Methods. 25:402–408. 2001.
View Article : Google Scholar
|
|
27
|
Hooper SD and Bork P: Medusa: A simple
tool for interaction graph analysis. Bioinformatics. 21:4432–4433.
2005. View Article : Google Scholar : PubMed/NCBI
|
|
28
|
Chanchairujira K, Chung CB, Kim JY,
Papakonstantinou O, Lee MH, Clopton P and Resnick D: Intervertebral
disk calcification of the spine in an elderly population:
Radiographic prevalence, location, and distribution and correlation
with spinal degeneration. Radiology. 230:499–503. 2004. View Article : Google Scholar : PubMed/NCBI
|
|
29
|
Kusu N, Laurikkala J, Imanishi M, Usui H,
Konishi M, Miyake A, Thesleff I and Itoh N: Sclerostin is a novel
secreted osteoclast-derived bone morphogenetic protein antagonist
with unique ligand specificity. J Biol Chem. 278:24113–24117. 2003.
View Article : Google Scholar : PubMed/NCBI
|
|
30
|
van Bezooijen RL, Roelen BA, Visser A, van
der Wee-Pals L, de Wilt E, Karperien M, Hamersma H, Papapoulos SE,
ten Dijke P and Löwik CW: Sclerostin is an osteocyte-expressed
negative regulator of bone formation, but not a classical BMP
antagonist. J Exp Med. 199:805–814. 2004. View Article : Google Scholar : PubMed/NCBI
|
|
31
|
van Bezooijen RL, Svensson JP, Eefting D,
Visser A, van der Horst G, Karperien M, Quax PH, Vrieling H,
Papapoulos SE, ten Dijke P and Löwik CW: Wnt but not BMP signaling
is involved in the inhibitory action of sclerostin on
BMP-stimulated bone formation. J Bone Miner Res. 22:19–28. 2007.
View Article : Google Scholar
|
|
32
|
Poole KE, van Bezooijen RL, Loveridge N,
Hamersma H, Papapoulos SE, Löwik CW and Reeve J: Sclerostin is a
delayed secreted product of osteocytes that inhibits bone
formation. FASEB J. 19:1842–1844. 2005.PubMed/NCBI
|
|
33
|
Hoang QQ, Sicheri F, Howard AJ and Yang
DS: Bone recognition mechanism of porcine osteocalcin from crystal
structure. Nature. 425:977–980. 2003. View Article : Google Scholar : PubMed/NCBI
|
|
34
|
Price PA, Otsuka AA, Poser JW, Kristaponis
J and Raman N: Characterization of a gamma-carboxyglutamic
acid-containing protein from bone. Proc Natl Acad Sci USA.
73:1447–1451. 1976. View Article : Google Scholar : PubMed/NCBI
|
|
35
|
Hauschka PV, Lian JB, Cole DE and Gundberg
CM: Osteocalcin and matrix Gla protein: Vitamin K-dependent
proteins in bone. Physiol Rev. 69:990–1047. 1989.PubMed/NCBI
|
|
36
|
Hsieh JC, Kodjabachian L, Rebbert ML,
Rattner A, Smallwood PM, Samos CH, Nusse R, Dawid IB and Nathans J:
A new secreted protein that binds to Wnt proteins and inhibits
their activities. Nature. 398:431–436. 1999. View Article : Google Scholar : PubMed/NCBI
|
|
37
|
Nakanishi R, Akiyama H, Kimura H, Otsuki
B, Shimizu M, Tsuboyama T and Nakamura T: Osteoblast-targeted
expression of Sfrp4 in mice results in low bone mass. J Bone Miner
Res. 23:271–277. 2008. View Article : Google Scholar
|
|
38
|
Yamada A, Iwata T, Yamato M, Okano T and
Izumi Y: Diverse functions of secreted frizzled-related proteins in
the osteoblastogenesis of human multipotent mesenchymal stromal
cells. Biomaterials. 34:3270–3278. 2013. View Article : Google Scholar : PubMed/NCBI
|
|
39
|
Takae R, Matsunaga S, Origuchi N, Yamamoto
T, Morimoto N, Suzuki S and Sakou T: Immunolocalization of bone
morphogenetic protein and its receptors in degeneration of
intervertebral disc. Spine. 24:1397–1401. 1999. View Article : Google Scholar : PubMed/NCBI
|
|
40
|
Hiyama A, Sakai D, Tanaka M, Arai F,
Nakajima D, Abe K and Mochida J: The relationship between the
Wnt/β-catenin and TGF-β/BMP signals in the intervertebral disc
cell. J Cell Physiol. 226:1139–1148. 2011. View Article : Google Scholar
|
|
41
|
Zhang R, Oyajobi BO, Harris SE, Chen D,
Tsao C, Deng HW and Zhao M: Wnt/β-catenin signaling activates bone
morphogenetic protein 2 expression in osteoblasts. Bone.
52:145–156. 2013. View Article : Google Scholar
|
|
42
|
Burke JG, Watson RW, McCormack D, Dowling
FE, Walsh MG and Fitzpatrick JM: Intervertebral discs which cause
low back pain secrete high levels of proinflammatory mediators. J
Bone Joint Surg Br. 84:196–201. 2002. View Article : Google Scholar : PubMed/NCBI
|
|
43
|
Weiler C, Nerlich AG, Bachmeier BE and
Boos N: Expression and distribution of tumor necrosis factor alpha
in human lumbar intervertebral discs: a study in surgical specimen
and autopsy controls. Spine (Phila Pa 1976). 30:44–54. 2005.
View Article : Google Scholar
|
|
44
|
Le Maitre CL, Hoyland JA and Freemont AJ:
Catabolic cytokine expression in degenerate and herniated human
intervertebral discs: IL-1beta and TNFalpha expression profile.
Arthritis Res Ther. 9:R772007. View
Article : Google Scholar : PubMed/NCBI
|
|
45
|
Shamji MF, Setton LA, Jarvis W, So S, Chen
J, Jing L, Bullock R, Isaacs RE, Brown C and Richardson WJ:
Proinflammatory cytokine expression profile in degenerated and
herniated human intervertebral disc tissues. Arthritis Rheum.
62:1974–1982. 2010.PubMed/NCBI
|
|
46
|
Park JO, Lee BH, Kang YM, Kim TH, Yoon JY,
Kim H, Kwon UH, Lee KI, Lee HM and Moon SH: Inflammatory cytokines
induce fibrosis and ossification of human ligamentum flavum cells.
J Spinal Disord Tech. 26:E6–E12. 2013. View Article : Google Scholar
|