Introduction
Most metastatic cancer cannot be cured with current
treatment. Thus, understanding the biological mechanism of
metastasis is critical for development of effective clinical
treatment. The invasion-metastasis cascade consists of: i) invasion
into local tissue and induction of angiogenesis/lymphanginogenesis;
ii) intravasation; iii) survival in the circulation; iv) arrest at
a distant organ site; v) extravasation; vi) micrometastasis
formation; and vii) metastatic colonization. Metastatic process is
believed to be driven by metastasis genes that are involved in at
least one of these steps (1).
Metastasis signature genes and metastatic organ tropism have been
analyzed in clinical studies by transcriptomic analysis using DNA
microarrays (2–5). Previous studies showed that some
metastasis signature genes are involved in specific steps of the
invasion-metastasis cascade (6–8). In
some cases of metastasis genes, co-activation with other genes was
required for metastasis in distant organs (6).
The human breast carcinoma cell line MDA-MB-231 is
an ideal tool for metastatic study because it exhibits metastatic
activities to distant organs by the xenograft model using
immunodeficient mice. For example, the intra-cardiac injection
method produced metastases to lung, bone and brain, whereas, the
tail vein injection (TVI) method metastasizes to lung because
injected cells tend to be trapped in the lung (5). Highly metastatic cells can be
established by repetition of recovery of cancer cells from
metastatic lesions followed by their injection into blood vessels.
In the present study, we refer to this procedure as 'concentration
of metastatic activities'. Organ specific-metastatic signature
genes were previously identified by transcriptomic analysis in
highly metastatic cancer cells (3,5,9).
In the orthotopic xenograft (OX) model, tumor cells
are injected into organs from which they are derived. In the case
of breast cancer, the tumor cells are transplanted into the fat
pad. Transplanted breast cancer cells form primary tumors and
metastases to lung and bone, as well as liver and lymph node
(3,10,11).
Therefore, the OX model mimics the overall steps of the
invasion-metastasis cascade in contrast to the TVI method, which
only mimics the steps after extravasation.
In the present study we generated highly metastatic
cell lines using the OX or TVI method and compared both gene
expression profiles to determine the characteristics of early steps
of metastasis, including local invasion and leaking out into
vessels.
Materials and methods
Cell culture
MDA-MB-231 cells (ATCC, Manassas, VA, USA) were
cultured in RPMI-1640 (Wako Pure Chemical Industries, Ltd., Osaka,
Japan) supplemented with 10% heat-inactivated fetal bovine serum
(FBS), 100 µg/ml streptomycin (Meiji Seika Pharma Co., Ltd.,
Tokyo, Japan) and 100 U/ml penicillin (Meiji-Seika Pharma) at 37°C
with 5% CO2. Plat-E and 293T cells were cultured in DMEM
(Wako Pure Chemical Industries) supplemented with 10%
heat-inactivated FBS, 100 µg/ml streptomycin and 100 U/ml
penicillin at 37°C with 5% CO2. MDA-MB-231-EcoR cells
were generated by infection of MDA-MB-231 cells with recombinant
lentivirus (pLenti6-PUbc-mSlc7a1-HygR;
Addgene, Cambridge, MA, USA) and selection by 800 µg/ml
hygromycin (Wako Pure Chemical Industries). MDA-MB-231-EcoR-luc2
cells were generated by retroviral infection
(pMXd3-PEF1-luc2-IRES-BlaR) and selection by
2.0 µg/ml blastcidin (Invitrogen/Thermo Fisher Scientific,
Waltham, MA, USA). Plat-E cells for retroviral packaging were
kindly provided by T. Kitamura (Institute of Medical Science, The
University of Tokyo).
Viral infection
Lentiviral packaging was performed by
co-transfection of pLenti6-PUbc-mSlc7a1-HygR
(Addgene), HIV-based vectors including a cDNA expression cassette
and the pPACK packaging plasmids (System Biosciences, Palo Alto,
CA, USA). Plasmid DNAs were transfected into 293T cells by the
calcium phosphate transfection method. The culture supernatant was
harvested the following day and stored as virus stock. MDA-MB-231
cells were plated at a density of 2.5×10⁵ cells/well in
12-well plates, followed by infection with 5-fold diluted
lentiviral stock solution. After 18 h, virus solution was replaced
with fresh culture media or passaged to new dishes. Plat-E cells
were transfected with
pMXd3-PEF1-luc2-IRES-BlaR by calcium
phosphate transfection method. MDA-MB-231-EcoR cells
(2.5×10⁵ cells) plated in 12-well plates were infected
with 5-fold retroviral stock solution for 24 h. After infection,
the mixture was replaced with culture media or cells were passaged
to a new dish.
Mouse xenograft metastasis model and
bioluminescence imaging
NOD.CB-17-Prkdcscid/J mice (NOD-SCID;
Charles River Laboratories Japan, Inc., Kanagawa, Japan) were used
in xenograft models. For the TVI model, 5.0×10⁵ cancer
cells suspended in 100 µl D-PBS(−) (Wako Pure Chemical
Industries) were injected using a 27-gauge needle into the tail
vein. For the orthotopic xenograft model, 1.0×10⁶ cancer
cells in 10 µl D-PBS(−) were implanted orthotopically using
a 28-gauge needle into the fourth fat pads. Eight weeks after the
injection, primary tumors were removed under anesthetized
conditions with 2.5% isoflurane (Wako Pure Chemical Industries).
After the primary tumors were removed, mice were periodically
monitored for metastasis formation using an in vivo imaging
system for 2–4 weeks.
Mice were intraperitoneally injected with 200
µl D-Luciferin (15 mg/ml; Gold Biotechnology, Inc., St.
Louis, MO, USA) and 20–25 min later, luminescence and X-ray imaging
were taken under anesthesia using an in vivo imaging system
(IVIS Lumina XR3; Perkin-Elmer, Waltham, MA, USA). Animal
experiments in this study were conducted under the approval of the
Animal Committee of Waseda University.
Tumor cell isolation
Lung metastases removed from xenograft model mice
were finely cut by scissors for dissection in 5 ml of culture
medium in a 6-cm dish and incubated at 37°C with 5% CO2.
After 2–3 days, cells invaded from sliced organs were sufficiently
grown at the bottom of the dish and tumor-derived cells were
selected by 2–3 passages in the presence of 2.0 µg/ml
blastcidin to remove primary lung cells.
DNA microarray analysis
Total RNA extraction, RT-PCR and DNA microarray
analysis were performed as described (12).
Statistical data analysis and network
analysis
Statistical analyses of microarray data were
performed using software packages obtained from Bioconductor
(http://www.biocon-ductor.org/) and CRAN
(https://cran.r-project.org/) with the R
statistical programming language. Heatmap analyses were executed by
'ggplot2' and 'gplots' packages and graphical outputs in the form
of Venn diagram were produced by 'GeneVenn' (http://genevenn.sourceforge.net/). DAVID (version 6.7;
https://david.ncifcrf.gov/) (13) was used for GO (Gene Ontology)
enrichment analysis. Gene regulatory network analyses were
performed using 'igraph' package. Network visualization and
topological analysis was generated by Cytoscape ver.3.2.0.
(http://www.cytoscape.org/) (14–16).
Results
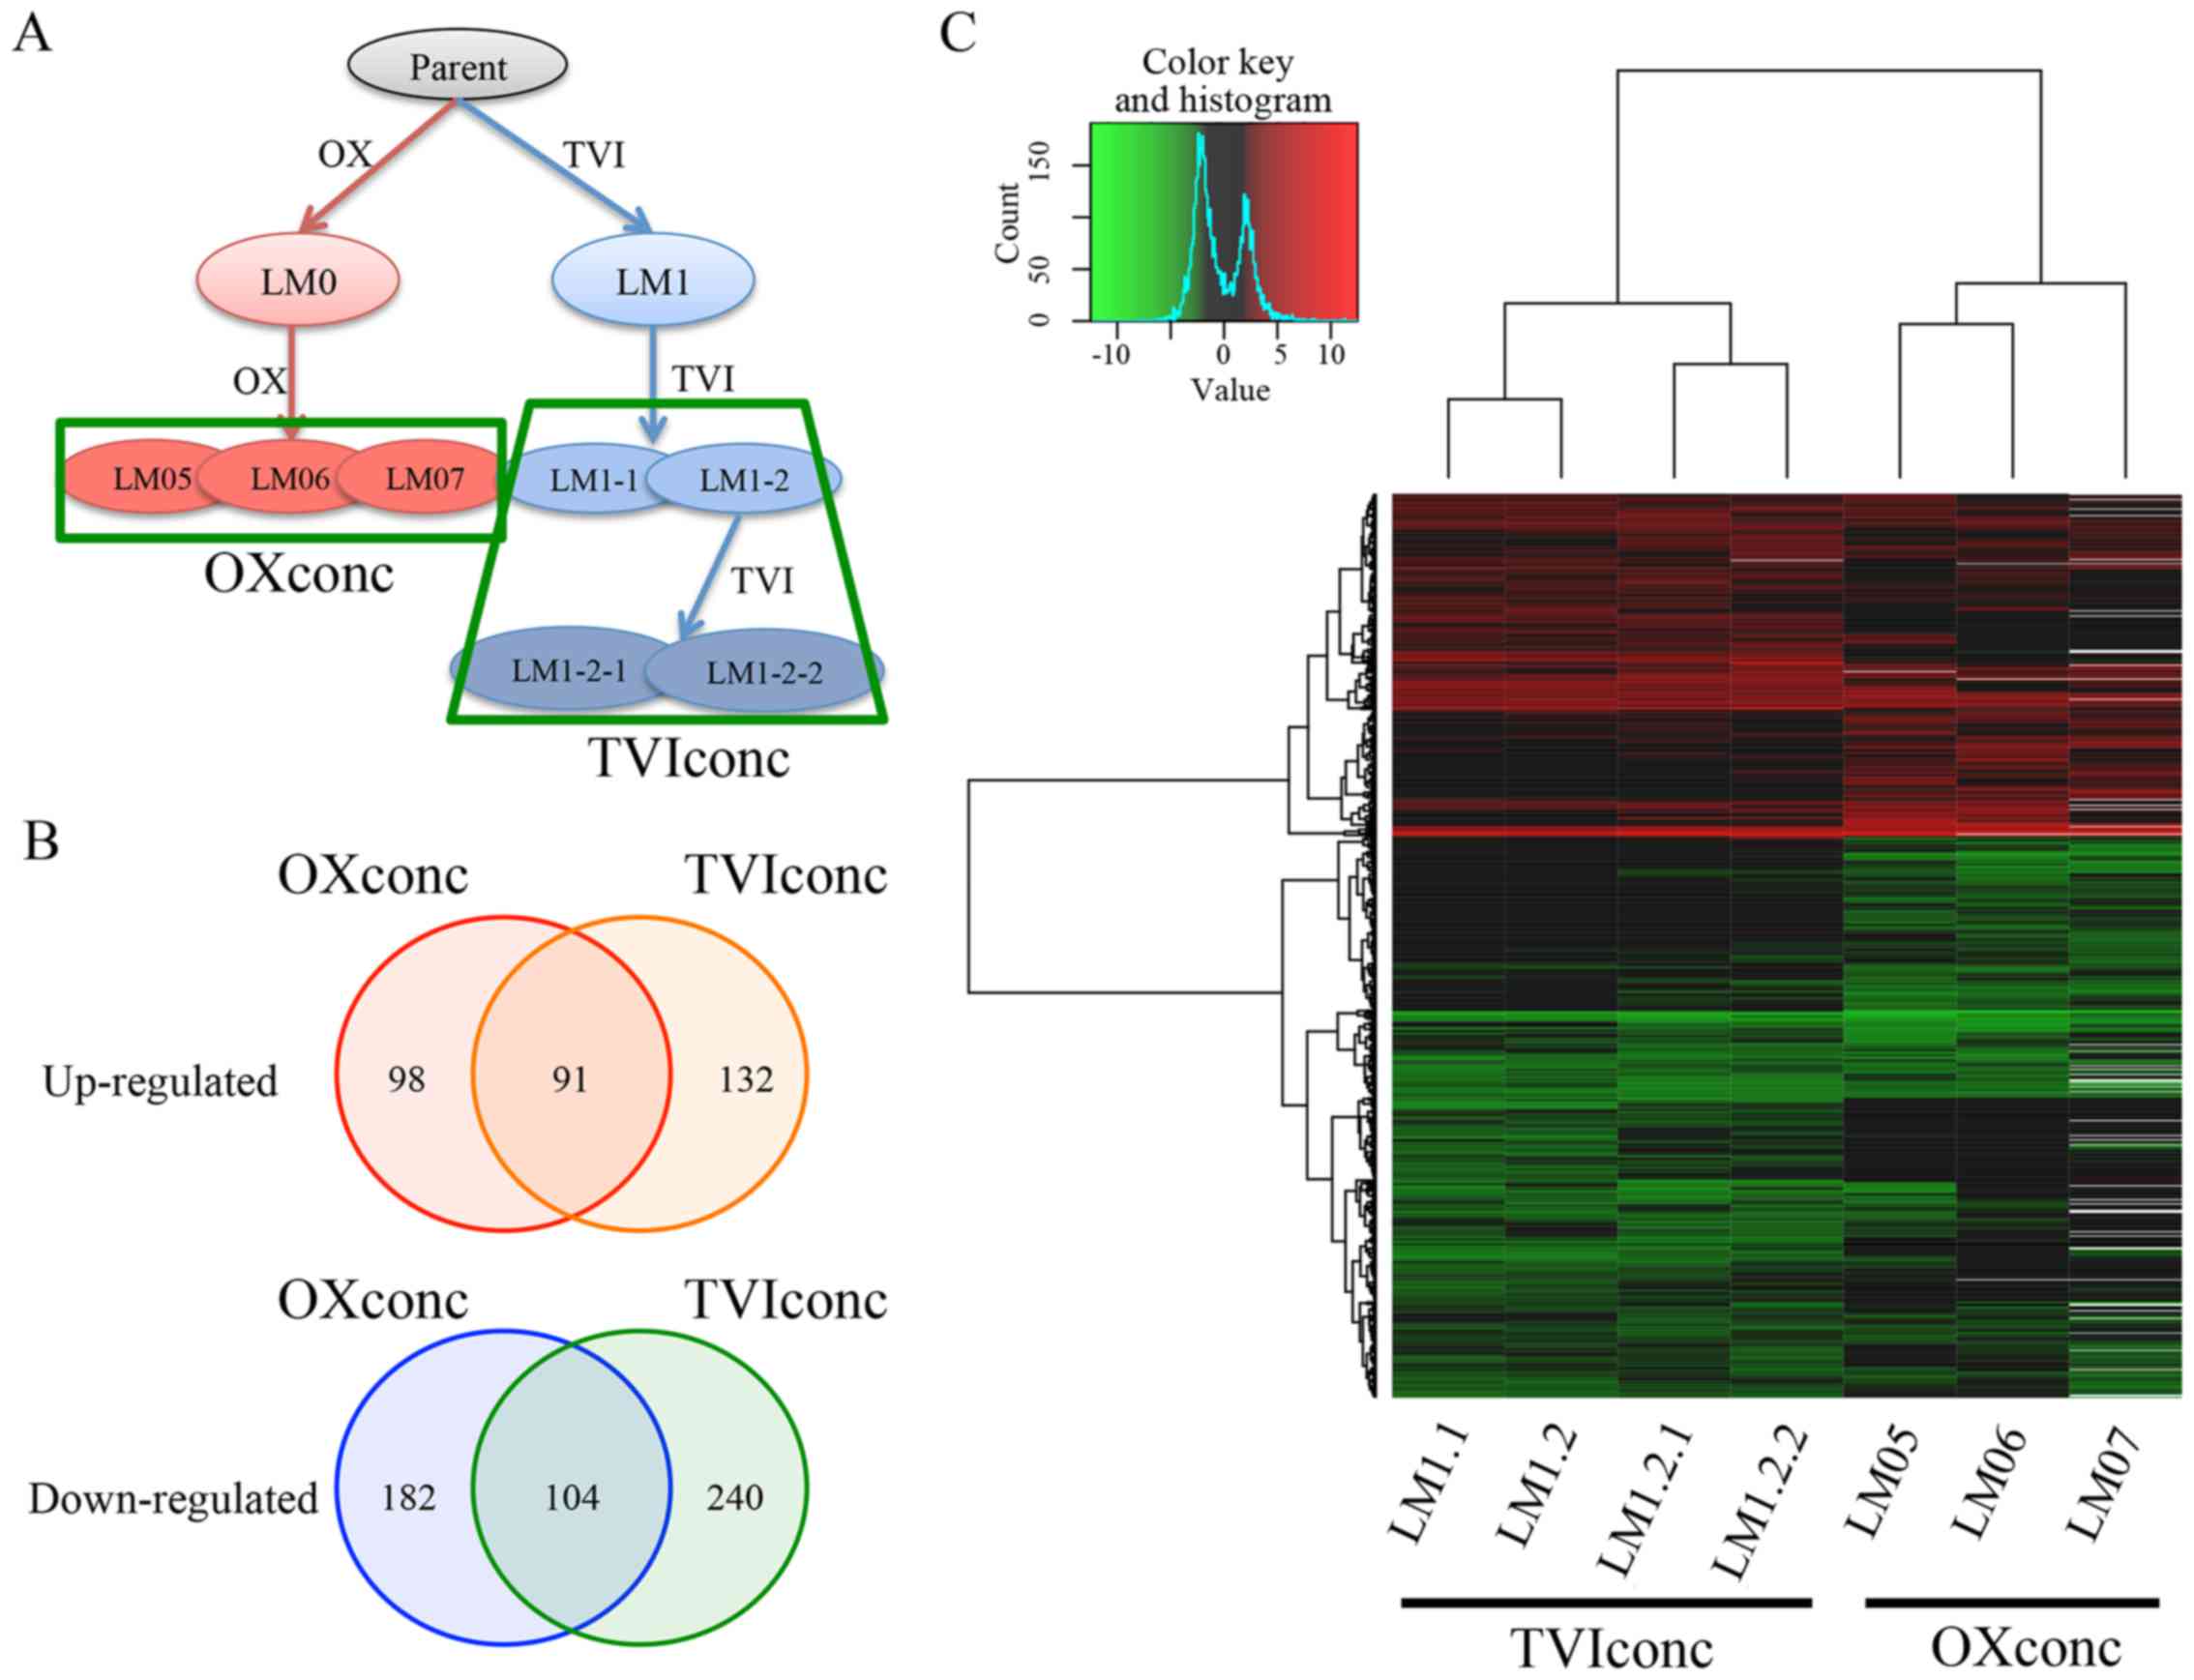
Establishment of highly metastatic cell
lines and gene expression analysis
MDA-MB-231-luc2 cells were transplanted into
NOD-SCID mice using either OX or TVI methods. Lung metastasis (LM)
cells were recovered and established from lung metastatic lesions.
LM cells were then re-injected into NOD-SCID mice using the same
method to concentrate cells with higher metastatic activity
(Fig. 1A). Established cell lines
exhibited higher metastatic activities to lung than the parental
cell line (data not shown).
We next analyzed gene expression profiles of LM cell
lines using cDNA microarrays and calculated the fold change (FC)
ratio of gene expression for each concentrated LM cell line vs.
parental cell line. We converted the FC ratios to z-scores and
selected genes that showed z-score >2.0 as metastasis signature
genes. As a result, 189 genes were upregulated and 286 genes
downregulated in the signature of OXconc (OX concentration), while
223 genes were upregulated and 344 genes downregulated in the
signature of TVIconc (TVI concentration). Analysis of these genes
by hierarchical clustering and Venn plot demonstrated that gene
expression profiles were different between OXconc and TVIconc, even
though both LM cell lines are derived from an identical cell line
(Fig. 1B and C and Table I).
 | Table ITop 10 genes regulated in OXconc and
TVIconc. |
Table I
Top 10 genes regulated in OXconc and
TVIconc.
| ID | Gene symbol | OXconc z-socre
ave. | TVIconc z-score
ave. |
|---|
| Upregulated in
OXconc |
| NM_002421 | MMP1 | 10.85713119 | 10.38631079 |
| NM_032744 | C6ORF105 | 7.353197074 | 0.519698021 |
| X97966 | CAPS | 7.102005496 | 6.482245813 |
| NM_021939 | FKBP10 | 7.01711925 | 5.597510346 |
| NM_000825 | GNRH1 | 5.906347541 | 6.171646277 |
| NM_005424 | TIE1 | 5.468619563 | 0.95133873 |
| NM_144650 | ADHFE1 | 5.464548106 | 4.515672606 |
| X84003 | TAF13 | 5.40888736 | 4.538398605 |
| NM_000079 | CHRNA1 | 5.184489038 | 5.029493896 |
| NM_003739 | AKR1C3 | 5.141155382 | 2.306068 |
| NM_000584 | IL8 | 5.064377448 | 1.340679004 |
| Upregulated in
TVIconc |
| NM_002421 | MMP1 | 10.85713119 | 10.38631079 |
| NM_021912 | GABRB3 | 8.488617576 | 7.398710432 |
| AF192259 | LOC100294275 | −1.154418998 | 6.716756187 |
| X97966 | CAPS | 7.102005496 | 6.482245813 |
| NM_000825 | GNRH1 | 5.906347541 | 6.171646277 |
| NM_001849 | COL6A2 | 3.041595714 | 6.055789712 |
| NM_021939 | FKBP10 | 7.01711925 | 5.597510346 |
| BC002831 | MGC4294 | 5.049699232 | 5.25073357 |
| NM_130467 | PAGE5 | 1.474724337 | 5.094903228 |
| NM_000079 | CHRNA1 | 5.184489038 | 5.029493896 |
| X84003 | TAF13 | 5.40888736 | 4.538398605 |
| Downregulated in
OXconc |
| NM_000782 | CYP24A1 | −7.08697021 | −3.3821009 |
| NM_004105 | EFEMP1 | −5.823406185 | −1.667764645 |
| NM_002832 | PTPN7 | −5.635932207 | −5.722217371 |
| NM_004852 | ONECUT2 | −5.162895035 | −4.953350067 |
| NM_000820 | GAS6 | −4.823851904 | −4.770537217 |
| NM_000093 | COL5A1 | −4.564581733 | −0.116120033 |
| NM_000541 | SAG | −4.499544857 | −4.04299429 |
| NM_006663 | PPP1R13L | −4.499225213 | −4.060105507 |
| NM_024682 | TBC1D17 | −4.46688297 | −4.275238798 |
| NM_015234 | GPR116 | −4.431324672 | −1.856370815 |
| Downregulated in
TVIconc |
| NM_002832 | PTPN7 | −5.635932207 | −5.722217371 |
| NM_145664 | SPANXB2 | 0.820012286 | −5.238287217 |
| AK055209 | ANKRD17 | −4.028084478 | −5.137378579 |
| NM_004852 | ONECUT2 | −5.162895035 | −4.953350067 |
| NM_000820 | GAS6 | −4.823851904 | −4.770537217 |
| NM_198449 | EMB | 0.696756501 | −4.296909426 |
| NM_024682 | TBC1D17 | −4.46688297 | −4.275238798 |
| NM_006663 | PPP1R13L | −4.499225213 | −4.060105507 |
| NM_000541 | SAG | −4.499544857 | −4.04299429 |
| AK002183 | MIER3 | −2.513486213 | −3.960036141 |
GO analysis and gene regulatory network
analysis
To evaluate the signature genes expressed in each
metastatic cell line, we next examined enrichment terms of the
biological process categories in GO by DAVID annotation tools
(Table II). In the OXconc
signature, genes associated with cell proliferation were repressed,
while genes associated with cell adhesion and chemotaxis were
upregulated. In the TVIconc signature, genes associated with
antigen recognition were enriched in addition to those with cell
adhesion.
| Table IITop 5 terms of biological process in
GO. |
Table II
Top 5 terms of biological process in
GO.
| Term | P-value | Bonferroni | FDR |
|---|
| OXconc
upregulated |
| GO:0007155~cell
adhesion | 4.18E-04 | 0.421154729 | 0.681110881 |
|
GO:0022610~biological adhesion | 4.25E-04 | 0.426351205 | 0.692306461 |
| GO:0060326~cell
chemotaxis | 5.31E-04 | 0.500690093 | 0.864454327 |
|
GO:0007610~behavior | 6.21E-04 | 0.555853784 | 1.009433266 |
| GO:0008285~negative
regulation of cell proliferation | 7.64E-04 | 0.631767293 | 1.241108958 |
| OXconc
downregulated |
|
GO:0042127~regulation of cell
proliferation | 3.33E-05 | 0.061001348 | 0.056809783 |
| GO:0008284~positive
regulation of cell proliferation | 4.58E-04 | 0.579599391 | 0.779301878 |
| GO:0000902~cell
morphogenesis | 7.66E-04 | 0.765190332 | 1.299678793 |
|
GO:0007010~cytoskeleton organization | 8.25E-04 | 0.790008941 | 1.399174442 |
| GO:0010647~positive
regulation of cell communication | 0.001039447 | 0.860215882 | 1.760794114 |
| TVIconc
upregulated |
| GO:0002504~antigen
processing and presentation of peptide or polysaccharide antigen
via MHC class II | 1.94E-05 | 0.024628491 | 0.031592274 |
| GO:0007155~cell
adhesion | 7.67E-04 | 0.627271392 | 1.242712326 |
|
GO:0022610~biological adhesion | 7.79E-04 | 0.633111739 | 1.262473127 |
|
GO:0006690~icosanoid metabolic
process | 0.001316141 | 0.816398686 | 2.124806716 |
| GO:0019882~antigen
processing and presentation | 0.001577084 | 0.868836337 | 2.541013583 |
| TVIconc
downregulated |
| GO:0032103~positive
regulation of response to external stimulus | 4.58E-05 | 0.083059484 | 0.078184221 |
| GO:0070120~ciliary
neurotrophic factor-mediated signaling pathway | 8.24E-05 | 0.144470972 | 0.140644741 |
| GO:0051272~positive
regulation of cell motion | 1.78E-04 | 0.286274159 | 0.303742875 |
| GO:0048584~positive
regulation of response to stimulus | 3.66E-04 | 0.500037902 | 0.623336012 |
| GO:0030335~positive
regulation of cell migration | 4.70E-04 | 0.589711307 | 0.800366129 |
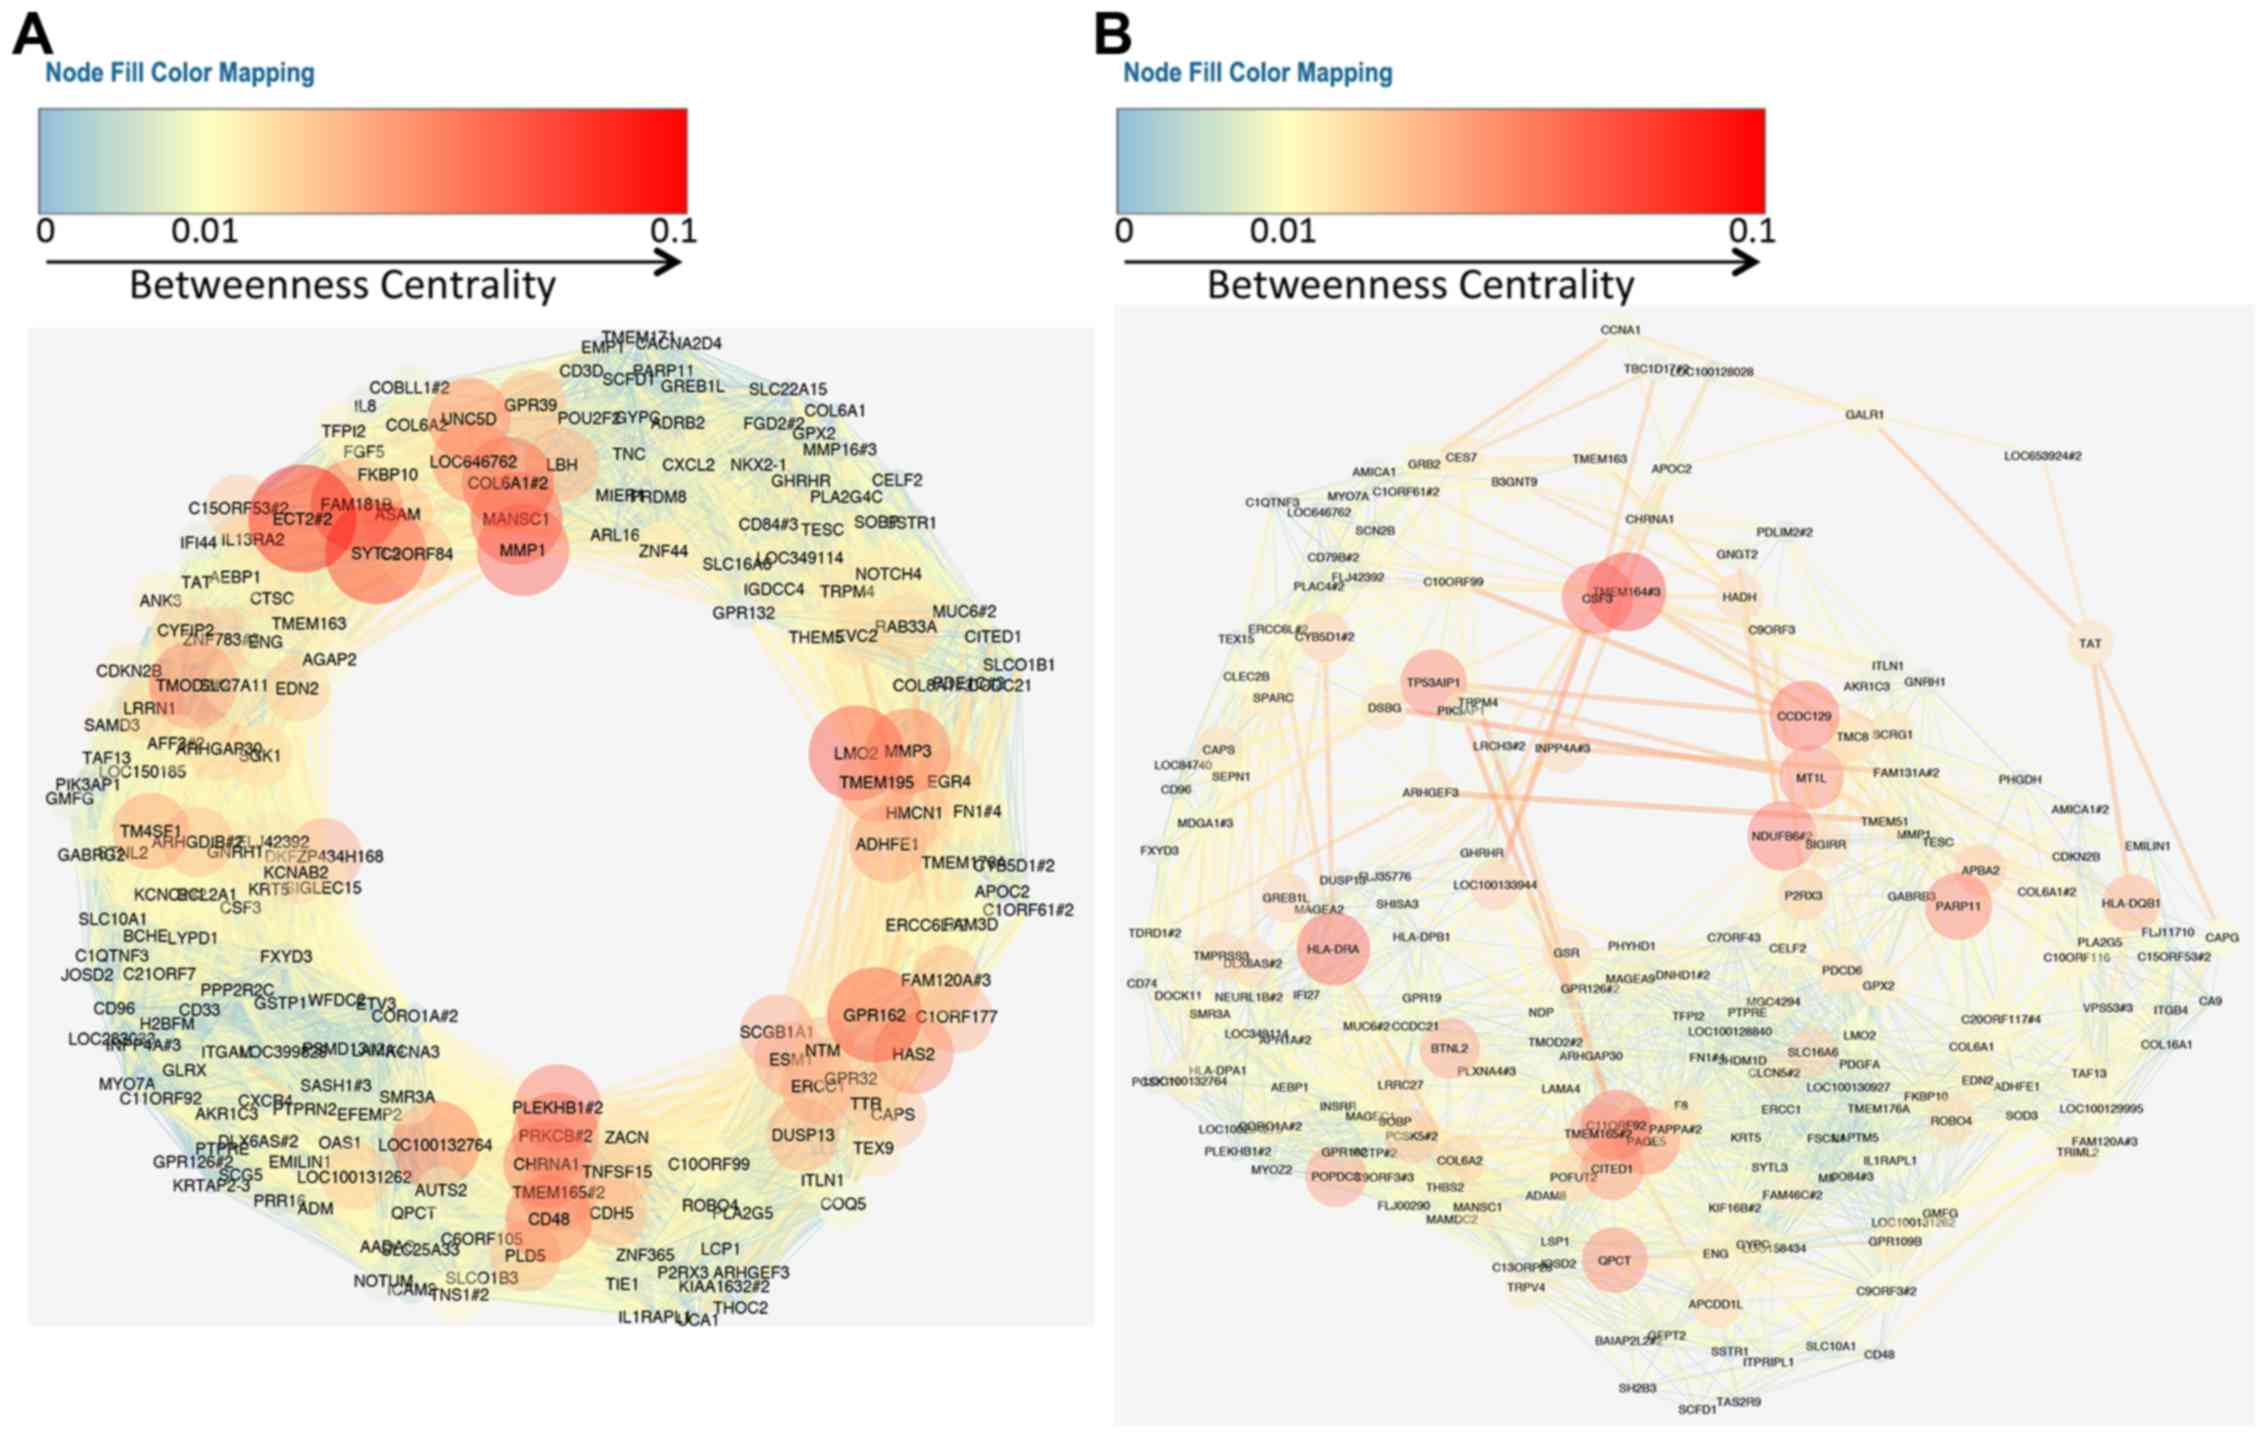
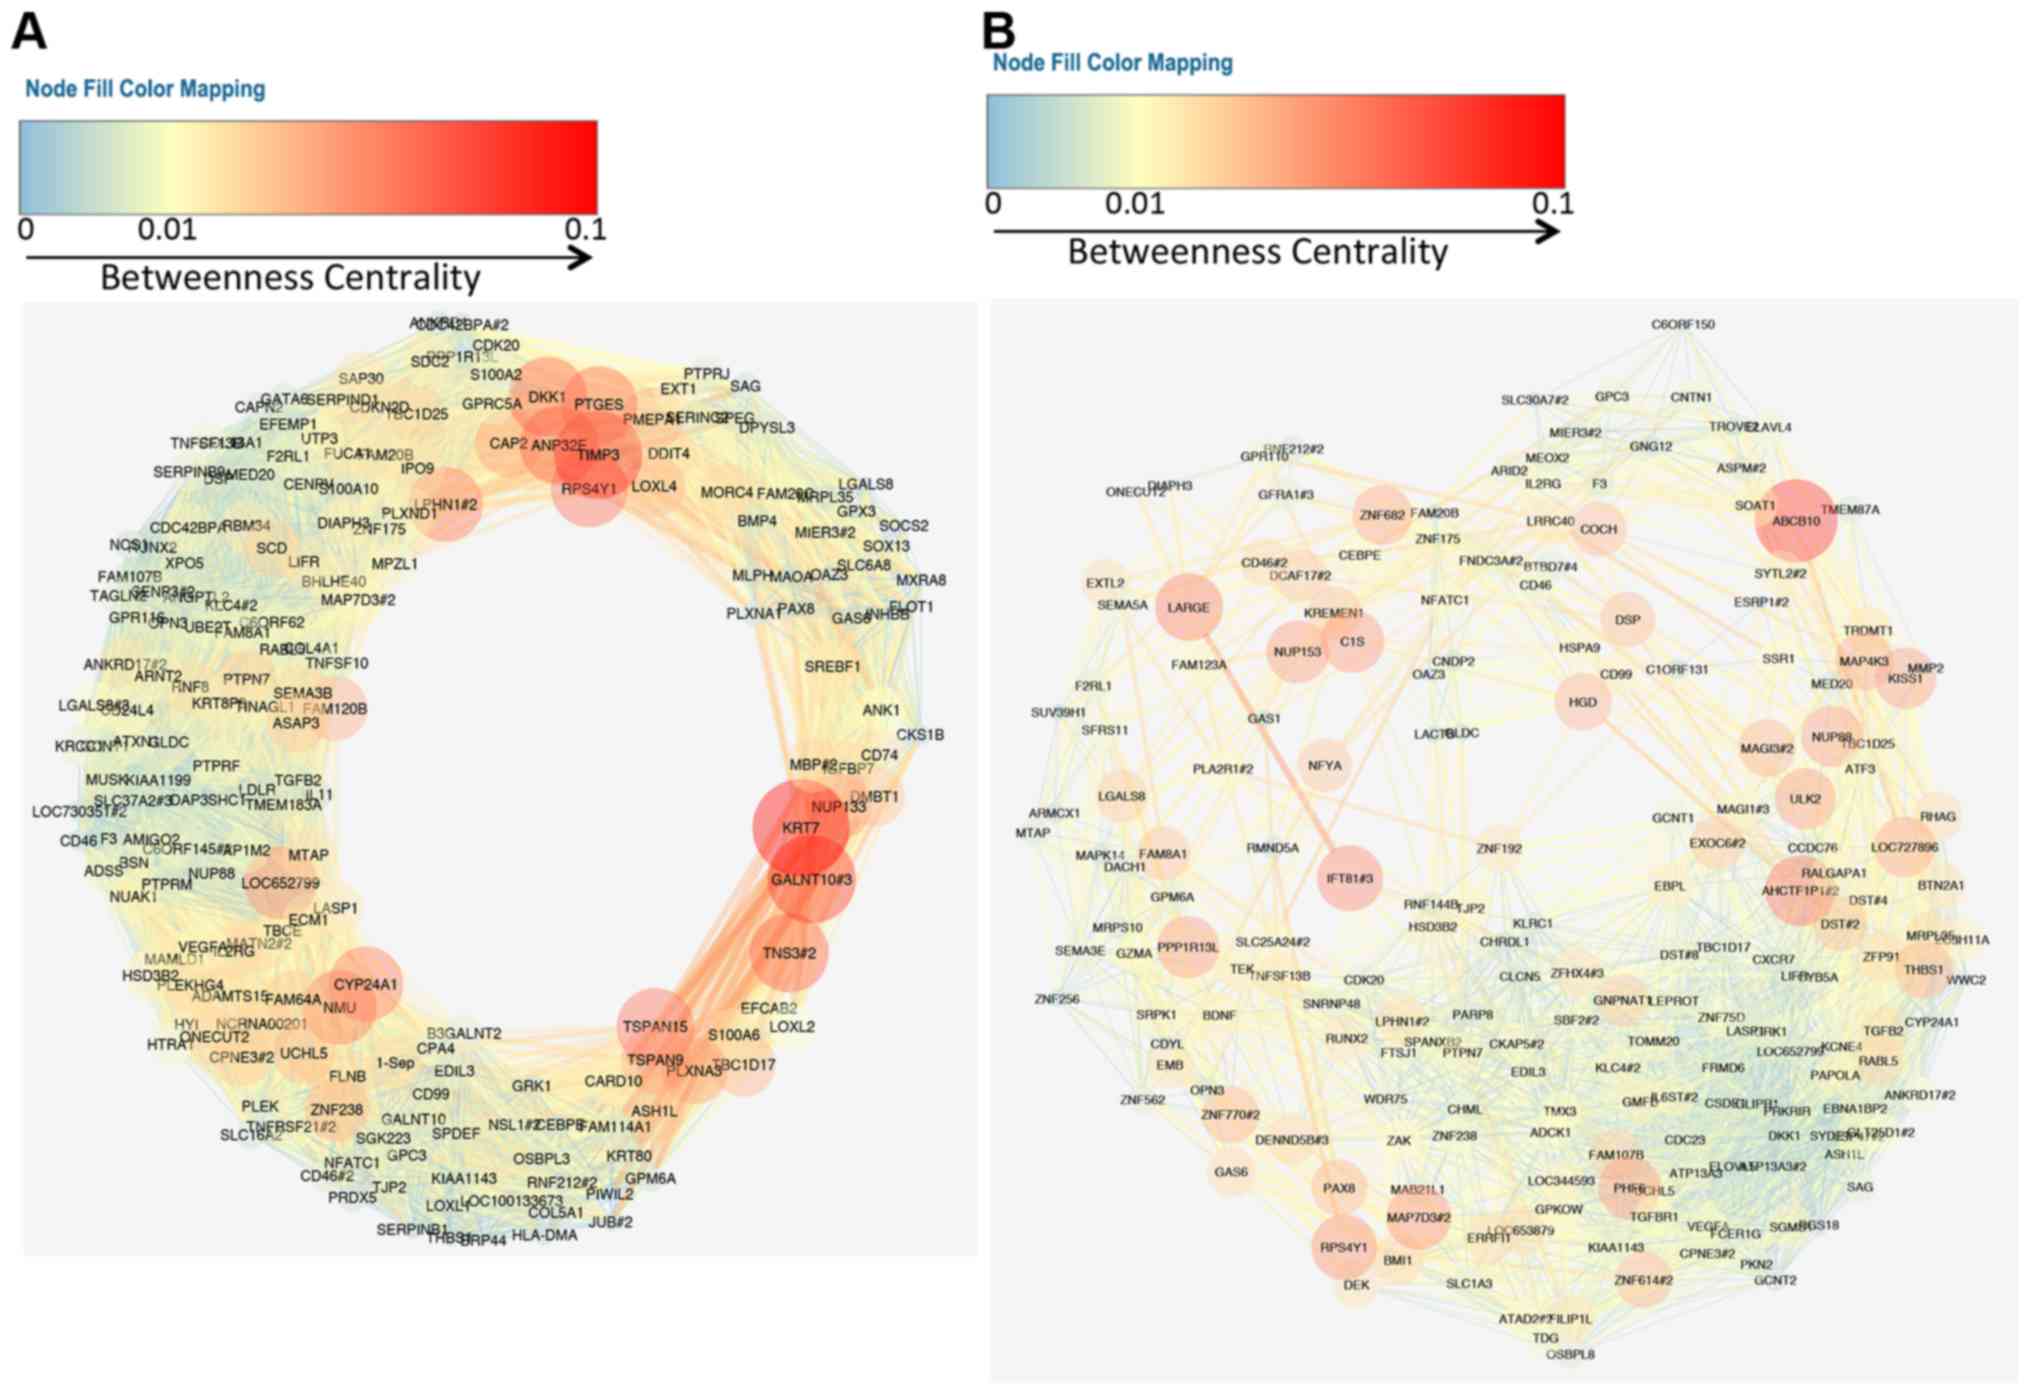
For gene regulatory network analysis, we focused on
correlations of gene expression patterns in each concentrated
metastatic cell line. We calculated each gene-gene Pearson's
correlation coefficient in each methodological metastatic cell line
using gene expression data. We performed network analysis using
Cytoscape for network visualization and topological analysis. To
display the gene regulatory network, we focused on the top 200
genes of the metastasis signature genes. We selected gene-gene
correlations in which the correlation coefficient value is >0.9
and displayed network with betweenness centrality using yFiles
organic layout (Figs. 2 and
3). Intriguingly, both the OXconc
gene regulatory network of upregulated genes and that of
downregulated genes formed circle network topologies.
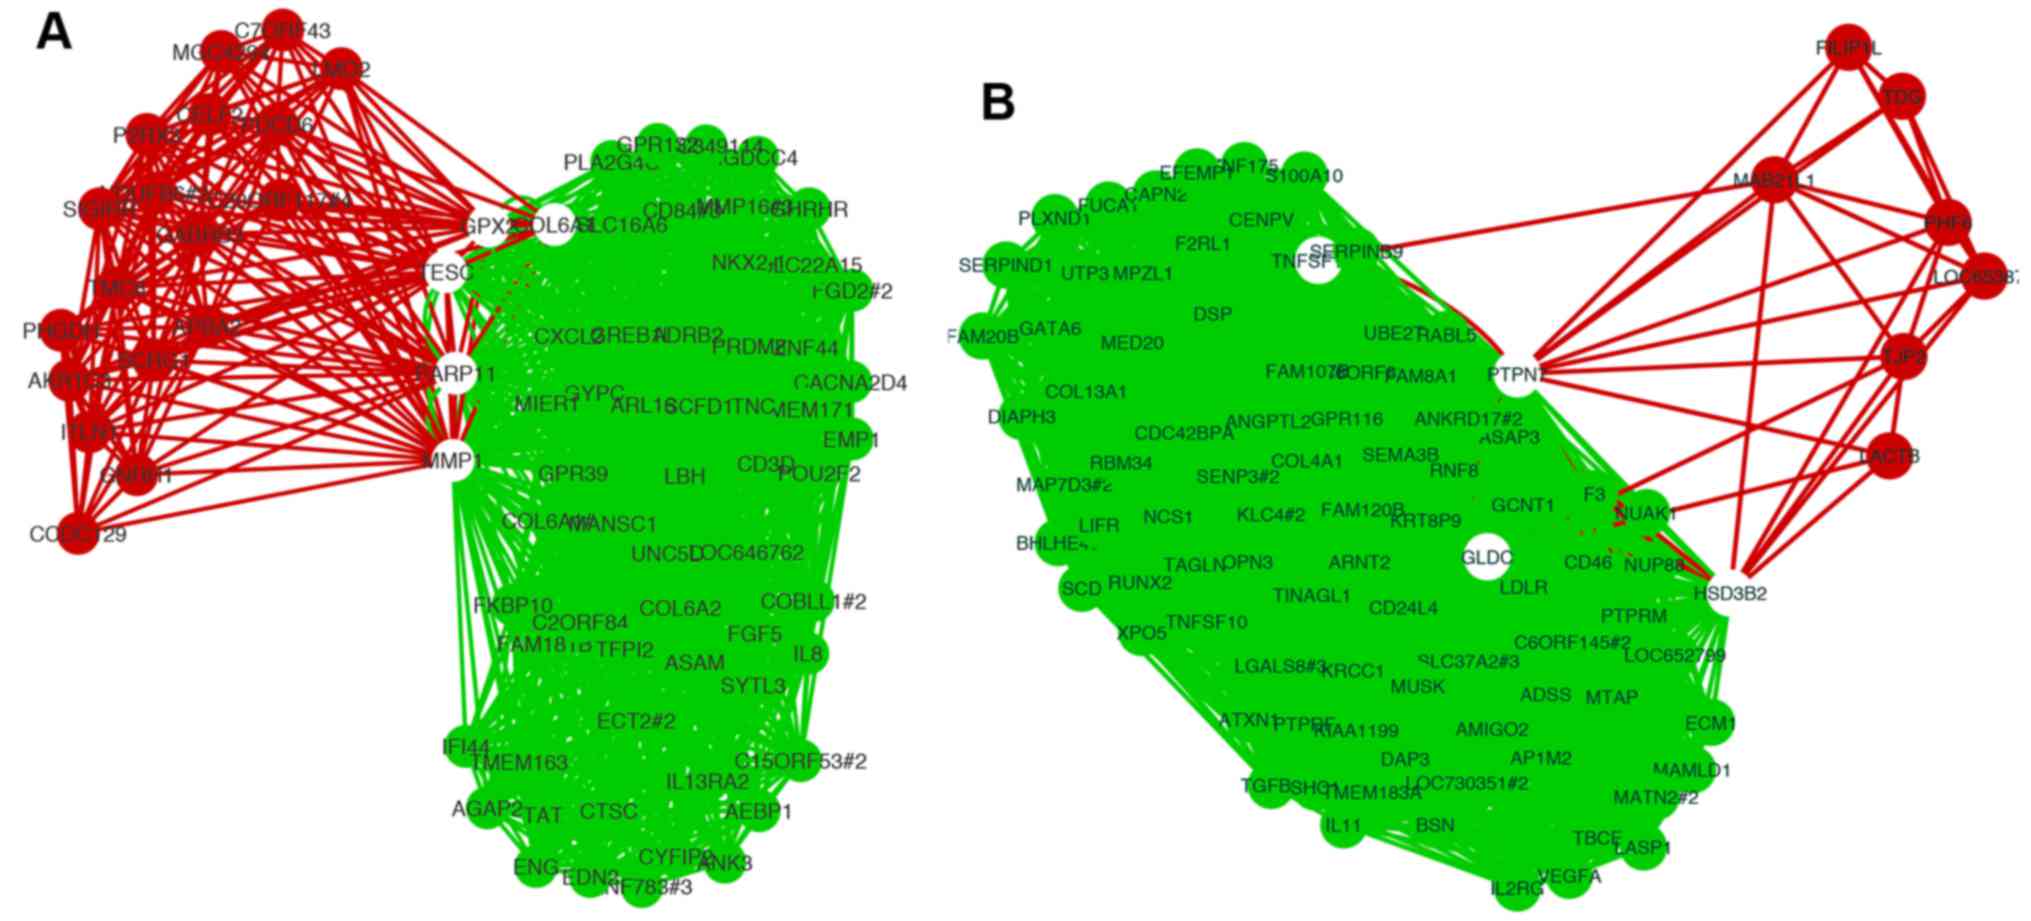
Among the common genes observed in the upregulated
gene regulatory network, a well-known metastasis gene, matrix
metalloproteinase 1 (MMP1), showed the highest z-score. We
extracted the sub-network related to MMP1 from each network
(Fig. 4A). The sub-network of MMP1
in the OXconc network had more edges and nodes than that in the
TVIconc network. Sub-networks of protein tyrosine phosphatase
non-receptor type 7 (PTPN7), which showed the lowest z-score in
common downregulated genes, also showed the same feature (Fig. 4B).
To evaluate the significance of genes encoding
transcription factors such as hub genes, we extracted genes
categorized as 'GO:0003700~ transcription factor activity,
sequence-specific DNA binding' in the molecular function (Table III). Contrary to expectations,
betweenness centrality of transcriptional factors had low values in
these gene regulatory networks (data not shown).
| Table IIITranscriptional factors in gene
regulatory network. |
Table III
Transcriptional factors in gene
regulatory network.
| ID | Gene name |
|---|
| OXconc
upregulated |
| NM_001129 | AEBP1 |
| NM_004143 | CITED1 |
| NM_003317 | NKX2-1 |
| NM_002698 | POU2F2 |
| X84003 | TAF13 |
| NM_001965 | EGR4 |
| NM_005240 | ETV3 |
| OXconc
downregulated |
| NM_001805 | CEBPE |
| NM_005257 | GATA6 |
| NM_012391 | SPDEF |
| NM_005686 | SOX13 |
| NM_014862 | ARNT2 |
| NM_003670 | BHLHE40 |
| NM_006162 | NFATC1 |
| NM_004852 | ONECUT2 |
| NM_013951 | PAX8 |
| NM_004176 | SREBF1 |
| NM_007147 | ZNF175 |
| TVIconc
upregulated |
| NM_001129 | AEBP1 |
| NM_004143 | CITED1 |
| X84003 | TAF13 |
| TVIconc
downregulated |
| AK097133 | ATAD2 |
| NM_001805 | CEBPE |
| NM_004024 | ATF3 |
| NM_080759 | DACH1 |
| NM_005924 | MEOX2 |
| NM_006162 | NFATC1 |
| NM_002505 | NFYA |
| NM_021705 | NFYA |
| NM_004852 | ONECUT2 |
| NM_013951 | PAX8 |
| NM_004348 | RUNX2 |
| AK095274 | ZFHX4 |
| NM_007147 | ZNF175 |
| NM_006298 | ZNF192 |
| NM_006352 | ZNF238 |
| NM_005773 | ZNF256 |
| NM_007131 | ZNF75D |
Discussion
Discovery of novel metastasis genes can help to
understand the metastatic mechanisms and establishment of
prognostic markers (17). Lung
metastasis genes in breast carcinoma were previously identified by
transcriptome analysis of metastatic cancer cells and patient
metastases using DNA microarray and by gene knockdown experiments
in highly metastatic cancer cells. However, the roles of some
metastasis genes have not been analyzed in detail.
MMP1 was most highly expressed gene in OXconc
and TVIconc networks. Previous research suggested that MMP1
activity alone was not enough for metastasis to lung and
MMP1 requires other metastasis genes to promote metastases
in the lung (6). In our studies,
the OXconc network revealed a group of genes whose expressions
highly correlated with MMP1 expression. These genes may
cooperate with MMP1 to contribute to lung metastasis. The
CXCR4 (C-X-C chemokine receptor type 4) gene was expressed
in only the OXconc signature. Expression of CXCR4 in
metastatic cancer cells highly expressing CXCL12 (C-X-C
chemokine motif ligand 12) enhanced metastasis to distant organs,
such as lung, liver and bone marrow. Thus, CXCR4 in breast
cancer is believed to decide the metastatic organ tropism (18,19).
In our studies, expression of CXCR4 may not be necessary to
form a pre-metastatic niche and metastatic colonization. Instead,
CXCR4 may especially regulate the early metastatic phase,
namely invasion from primary tumor. Expression of interleukin 8
(IL8) promotes angiogenesis and metastasis to distant organs
in an orthotopic xenograft model (20). Consistently, upregulation of
IL8 was observed in the OXconc signature. However, in this
and others studies, IL8 was not found in metastasis
signature genes by the intra-circulation model using MDA-MB-231
cells (3,5). Our findings suggest that some
important metastasis signature genes may have been missed in the
previous analysis using intracirculation injection methods. Thus,
establishing highly metastatic cell lines by different methods will
lead to novel insights into invasion-metastasis mechanisms and help
identify novel metastatic genes.
Shedding of tumor cells into the circulation occurs
at the early stage of metastasis. Circulating tumor cells (CTCs)
that survive in the circulation and spread in the whole body are
likely necessary for distant organ metastasis (21). In fact, the number of CTCs in
breast cancer patients is associated with prognosis (22). In GO analysis, the terms 'cell
adhesion' (23) and 'cell
chemotaxis' were enriched in OXconc, while 'chemotaxis' was not
enriched in TVIconc. CTCs require the abilities of chemotaxis and
cell adhesion with vascular endothelial cells for homing in distant
organs (22). Thus, our results
confirm the role of genes involved in chemotaxis and cell adhesion
for metastasis to distant organs.
A gene regulatory network analysis method using gene
expression data is most commonly used for comparative genomic data.
Analysis to examine the relationship between regulatory network and
phenotype is important to discover novel markers and understand
disease mechanisms (24,25). In previous studies, interference of
hub genes in networks showed that a hub gene and its neighbor genes
regulate the biological phenotype. For example, the hub genes
MYOG (myogenin) and CTNNA2 [catenin
(cadherin-associated protein) alpha 2] in a transcriptional network
of muscle satellite cells promote myoblast differentiation
(26). The metastasis gene
BACH1 (BTB and CNC homology 1) was found by transcriptional
network analysis of cancer cell lines using DNA microarrays
(27). Although these genes do not
have transcriptional activity, they contributed to the biological
phenotype as hub genes of the network. We used betweenness
centrality to extract hub genes. In our network, most genes of core
nodes do not encode transcription factors. Thus, the molecular
links and their biological importance between hub genes and
neighbor genes remain to be revealed.
In network analysis, the focus on similarities and
differences of correlation is an important strategy (28). Common regulated genes in OXconc and
TVIconc may be of importance in the invasion-metastasis cascade and
could be cancer prognosis markers. Among the common genes observed
in upregulated gene regulatory networks, CITED1
(Cbp/p300-interacting transactivator) may also be a metastasis
marker of breast cancer, because it is a known marker of lymph node
metastasis in colorectal carcinoma (29). Differential network analysis is now
becoming prevalent as a tool to more comprehensively interrogate
biological systems in a variety of organisms (30).
Comparative analysis of the sub-network of common
genes in OXconc and TVIconc showed that the OXconc sub-network had
a closer relationship than the TVIconc. Previous research in lung
cancer showed that the MMP1-MMP3-MMP12 gene cluster on
chromosome 11q22 plays important roles in prognosis and metastasis
(31). In our studies, the
sub-network of MMP1 revealed MMP1-MMP3 correlation in
the OXconc network. This finding suggests that some relationships
of metastasis genes have been missed in previous analyses using
intra-circulation injection methods.
To display gene regulatory networks, we used the
yFiles organic layout algorithm on the basis of the force-directed
paradigm. These structurally different regions of a organic network
can be identified by looking at the produced drawing (32). Our findings demonstrated that the
OXconc networks showed a circle structure. Circle topologies
suggest that genes involved in metastasis may have complementary
relationships at the gene community level and have the potential
for strong robustness.
In the present study, we performed transcriptional
profiling of highly metastatic cell lines established by two
different methods: the orthotopic transplantation method and
intra-circulation method. Although these metastatic lines are
derived from an identical cell line, gene expression profiles and
gene regulatory networks were different in OXconc and TVIconc
signatures, suggesting that those cell lines were activated at
different steps of the invasion-metastasis cascade. Our findings
will contribute to the understanding of the detailed metastatic
mechanisms and development of therapeutics or diagnostic tools.
Acknowledgments
We thank our laboratory members for valuable
discussion. The present study was conducted in part as a program
through the Fukushima Translational Research Project and was
supported in part by JSPS KAKENHI (grant no. 23241064),
Grant-in-Aid for Scientific Research (A) and MEXT-Supported Program
for the Strategic Research Foundation at Private Universities.
References
|
1
|
Valastyan S and Weinberg RA: Tumor
metastasis: Molecular insights and evolving paradigms. Cell.
147:275–292. 2011. View Article : Google Scholar : PubMed/NCBI
|
|
2
|
van de Vijver MJ, He YD, van't Veer LJ,
Dai H, Hart AA, Voskuil DW, Schreiber GJ, Peterse JL, Roberts C,
Marton MJ, et al: A gene-expression signature as a predictor of
survival in breast cancer. N engl J Med. 347:1999–2009. 2002.
View Article : Google Scholar : PubMed/NCBI
|
|
3
|
Minn AJ, Gupta GP, Siegel PM, Bos PD, Shu
W, Giri DD, Viale A, Olshen AB, Gerald WL and Massagué J: Genes
that mediate breast cancer metastasis to lung. Nature. 436:518–524.
2005. View Article : Google Scholar : PubMed/NCBI
|
|
4
|
Van Veer LJ, Dai H, Van De Vijver MJ, Van
Der Kooy K, Marton MJ, Witteveen AT, Schreiber GJ, Kerkhoven RM,
Roberts C, Bernards Â, et al: Gene expression profiling predicts
clinical outcome of breast cancer. Nature. 415:530–536. 2002.
View Article : Google Scholar
|
|
5
|
Minn AJ, Kang Y, Serganova I, Gupta GP,
Giri DD, Doubrovin M, Ponomarev V, Gerald WL, Blasberg R and
Massagué J: Distinct organ-specific metastatic potential of
individual breast cancer cells and primary tumors. J Clin Invest.
115:44–55. 2005. View
Article : Google Scholar : PubMed/NCBI
|
|
6
|
Gupta GP, Nguyen DX, Chiang AC, Bos PD,
Kim JY, Nadal C, Gomis RR, Manova-Todorova K and Massagué J:
Mediators of vascular remodelling co-opted for sequential steps in
lung metastasis. Nature. 446:765–770. 2007. View Article : Google Scholar : PubMed/NCBI
|
|
7
|
Oskarsson T, Acharyya S, Zhang XH,
Vanharanta S, Tavazoie SF, Morris PG, Downey RJ, Manova-Todorova K,
Brogi E and Massagué J: Breast cancer cells produce tenascin C as a
metastatic niche component to colonize the lungs. Nat Med.
17:867–874. 2011. View
Article : Google Scholar : PubMed/NCBI
|
|
8
|
Padua D, Zhang XH, Wang Q, Nadal C, Gerald
WL, Gomis RR and Massagué J: TGFbeta primes breast tumors for lung
metastasis seeding through angiopoietin-like 4. Cell. 133:66–77.
2008. View Article : Google Scholar : PubMed/NCBI
|
|
9
|
Bos PD, Zhang XH, Nadal C, Shu W, Gomis
RR, Nguyen DX, Minn AJ, van de Vijver MJ, Gerald WL, Foekens JA, et
al: Genes that mediate breast cancer metastasis to the brain.
Nature. 459:1005–1009. 2009. View Article : Google Scholar : PubMed/NCBI
|
|
10
|
De Larco JE, Wuertz BR, Rosner KA,
Erickson SA, Gamache DE, Manivel JC and Furcht LT: A potential role
for interleukin-8 in the metastatic phenotype of breast carcinoma
cells. Am J Pathol. 158:639–646. 2001. View Article : Google Scholar : PubMed/NCBI
|
|
11
|
Yang S, Zhang JJ and Huang XY: Mouse
models for tumor metastasis. Methods Mol Biol. 928:221–228.
2012.PubMed/NCBI
|
|
12
|
Kato H, Honma R, Sanda T, Fujiwara T, Ito
E, Yanagisawa Y, Imai J, Okamoto T and Watanabe S: Knock down of
hSNF5/Ini1 causes cell cycle arrest and apoptosis in a
p53-dependent manner. Biochem Biophys Res Commun. 361:580–585.
2007. View Article : Google Scholar : PubMed/NCBI
|
|
13
|
Huang DW, Sherman BT, Tan Q, Collins JR,
Alvord WG, Roayaei J, Stephens R, Baseler MW, Lane HC and Lempicki
RA: The DAVID Gene Functional Classification Tool: A novel
biological module-centric algorithm to functionally analyze large
gene lists. Genome Biol. 8:R1832007. View Article : Google Scholar : PubMed/NCBI
|
|
14
|
Shannon P, Markiel A, Ozier O, Baliga NS,
Wang JT, Ramage D, Amin N, Schwikowski B and Ideker T: Cytoscape: A
software environment for integrated models of biomolecular
interaction networks. Genome Res. 13:2498–2504. 2003. View Article : Google Scholar : PubMed/NCBI
|
|
15
|
Saito R, Smoot ME, Ono K, Ruscheinski J,
Wang PL, Lotia S, Pico AR, Bader GD and Ideker T: A travel guide to
Cytoscape plugins. Nat Methods. 9:1069–1076. 2012. View Article : Google Scholar : PubMed/NCBI
|
|
16
|
Cline MS, Smoot M, Cerami E, Kuchinsky A,
Landys N, Workman C, Christmas R, Avila-Campilo I, Creech M, Gross
B, et al: Integration of biological networks and gene expression
data using Cytoscape. Nat Protoc. 2:2366–2382. 2007. View Article : Google Scholar : PubMed/NCBI
|
|
17
|
Talmadge JE and Fidler IJ: AACR centennial
series: the biology of cancer metastasis: historical perspective.
Cancer Res. 70:5649–5669. 2010. View Article : Google Scholar : PubMed/NCBI
|
|
18
|
Sun X, Cheng G, Hao M, Zheng J, Zhou X,
Zhang J, Taichman RS, Pienta KJ and Wang J: CXCL12/CXCR4/CXCR7
chemokine axis and cancer progression. Cancer Metastasis Rev.
29:709–722. 2010. View Article : Google Scholar : PubMed/NCBI
|
|
19
|
Balkwill F: Cancer and the chemokine
network. Nat Rev Cancer. 4:540–550. 2004. View Article : Google Scholar : PubMed/NCBI
|
|
20
|
Waugh DJ and Wilson C: The interleukin-8
pathway in cancer. Clin Cancer Res. 14:6735–6741. 2008. View Article : Google Scholar : PubMed/NCBI
|
|
21
|
Kim MY, Oskarsson T, Acharyya S, Nguyen
DX, Zhang XH, Norton L and Massagué J: Tumor self-seeding by
circulating cancer cells. Cell. 139:1315–1326. 2009. View Article : Google Scholar
|
|
22
|
Alix-Panabières C and Pantel K: Challenges
in circulating tumour cell research. Nat Rev Cancer. 14:623–631.
2014. View
Article : Google Scholar : PubMed/NCBI
|
|
23
|
Joyce JA and Pollard JW:
Microenvironmental regulation of metastasis. Nat Rev Cancer.
9:239–252. 2009. View
Article : Google Scholar : PubMed/NCBI
|
|
24
|
Gaiteri C, Ding Y, French B, Tseng GC and
Sibille E: Beyond modules and hubs: The potential of gene
coexpression networks for investigating molecular mechanisms of
complex brain disorders. Genes Brain Behav. 13:13–24. 2014.
View Article : Google Scholar
|
|
25
|
Lee WP and Tzou WS: Computational methods
for discovering gene networks from expression data. Brief
Bioinform. 10:408–423. 2009.PubMed/NCBI
|
|
26
|
Malik A, Lee EJ, Jan AT, Ahmad S, Cho KH,
Kim J and Choi I: Network analysis for the identification of
differentially expressed hub genes using myogenin knock-down muscle
satellite cells. PLoS One. 10:e01335972015. View Article : Google Scholar : PubMed/NCBI
|
|
27
|
Liang Y, Wu H, Lei R, Chong RA, Wei Y, Lu
X, Tagkopoulos I, Kung SY, Yang Q, Hu G, et al: Transcriptional
network analysis identifies BACH1 as a master regulator of breast
cancer bone metastasis. J Biol Chem. 287:33533–33544. 2012.
View Article : Google Scholar : PubMed/NCBI
|
|
28
|
Bergmann S, Ihmels J and Barkai N:
Similarities and differences in genome-wide expression data of six
organisms. PLoS Biol. 2:E92004. View Article : Google Scholar : PubMed/NCBI
|
|
29
|
Nasu T, Oku Y, Takifuji K, Hotta T,
Yokoyama S, Matsuda K, Tamura K, Ieda J, Yamamoto N, Takemura S, et
al: Predicting lymph node metastasis in early colorectal cancer
using the CITED1 expression. J Surg Res. 185:136–142. 2013.
View Article : Google Scholar : PubMed/NCBI
|
|
30
|
Ideker T and Krogan NJ: Differential
network biology. Mol Syst Biol. 8:5652012. View Article : Google Scholar : PubMed/NCBI
|
|
31
|
Sun T, Gao Y, Tan W, Ma S, Zhang X, Wang
Y, Zhang Q, Guo Y, Zhao D, Zeng C, et al: Haplotypes in matrix
metalloproteinase gene cluster on chromosome 11q22 contribute to
the risk of lung cancer development and progression. Clin Cancer
Res. 12:7009–7017. 2006. View Article : Google Scholar : PubMed/NCBI
|
|
32
|
LaPorte J and Varela C: Organic and
hierarchical concentric layouts for distributed system
visualization. RPI Comput Sci Tech Rep. 1–8. 2008.
|