Introduction
Thyroid cancer is one of the fastest growing
diagnoses; more cases of thyroid cancer are found every year than
all leukemias and cancers of the liver, pancreas, and stomach
(1). Papillary thyroid cancer
(PTC) represents the most common type of thyroid cancer, accounting
for 80–85% of all thyroid cancer cases. The majority of patients
with thyroid cancer generally have good prognoses after appropriate
treatment. Unfortunately, 20–50% of patients of PTC are diagnosed
with lymph node metastasis (2). At
the same time, the recurrence of differentiated thyroid cancer is
up to 30% after initial treatment at 30 years of follow-up
(3). Retrospective
population-based studies have illustrated that cervical lymph node
metastases conferred independent risk in all patients with
follicular carcinoma and in those patients with papillary carcinoma
aged ≥45 years (4). Therefore, it
is urgent to identify new predictive biomarkers for lymph node
metastasis and novel therapeutic targets for thyroid cancer.
Astrocyte-elevated gene-1 (AEG-1), also known as
Metadherin or Lyric, was originally identified as a novel gene
induced by human immunodeficiency virus (HIV)-1 or tumor necrosis
factor (TNF)-α in primary human fetal astrocytes (PHFA) (5,6).
Numerous recent studies have revealed that AEG-1 is markedly
overexpressed in various types of human cancer, including
hepatocarcinoma, gastrointestinal cancer and malignant glioma
(7,8). AEG-1 played an important role in
transformation, proliferation, cell survival, evasion of apoptosis,
migration and invasion, metastasis, angiogenesis, chemoresistances
and epithelial-mesenchymal transition (9). For example, some researcher
identified two novel factors, AKR1C2 (positive factor) and NF1
(negative factor), as the AEG-1 downstream players in the process
of metastasis in liver cancer through deep sequencing and
expression regulation analysis in liver cancer cells (10).
AEG-1 is associated with pro-tumorigenic signal
transduction pathways, including AKT, NF-κB, PI3K-AKT and Wnt
pathways to regulate invasion and metastasis of carcinoma cells
(11,12). Upregulation of AEG-1 could induced
the transcriptional activity and the cytoplasm/nucleus
translocation of NF-κB; and inhibition of NF-κB markedly reversed
AEG-1-induced agar cloning efficiency and matrigel invasion in Hela
cells and human glioma cells (13,14).
Aberrant expression of AEG-1 affects the migration and invasiveness
of non-small cell lung cancer cell lines via the NF-κB and PI3K-AKT
pathways (12). Recombinant AEG-1
activated Wnt signaling, and its stimulatory effects on squamous
cell carcinoma of tongue cell invasiveness and
epithelial-mesenchymal transition were reversed by an anti-Wnt5a
neutralizing antibody or by inhibition of Rac1 or ROCK (15). The evidence suggested that AEG-1
was an important oncogene contributing to the progression and
metastasis of human cancers. However, the role of AEG-1 is not
known in thyroid cancer.
In the present study, we found that AEG-1 was
observably overexpressed in thyroid cancer and positively
correlated with lymph node metastasis. Additionally, AEG-1 siRNA
could significantly decrease the migration and invasion by
modulating MMP2 and MMP9 activity in thyroid cancer cells.
Moreover, for the first time the interaction between AEG-1 and MMP9
was found, which might be a possible mechanism of AEG-1-mediated
tumor cell migration and invasion. NF-κB signaling pathways might
be involved in this process.
Materials and methods
Cell lines
Human thyroid cancer cell lines BCPAP and SW579
(human thyroid carcinoma cell line) were obtained from Cell Banks
at the department of Pathology, Zhongshan School of Medicine, Sun
Yat-sen University, Guangzhou, China [originally from American type
culture collection (ATCC)]. BCPAP (16) was derived from an thyroid papillary
carcinoma and SW579 (17) from a
thyroid cancer with squamous carcinoma differentiation. Cells were
cultured in RPMI-1640 media (Gibco, Grand Island, NY, USA)
supplemented with 10% fetal bovine serum (Hyclone, Tauranga, New
Zealand), 100 µg/μl streptomycin and 100 µg/µl
penicillin in humidified incubator at 37°C with 5%
CO2.
Tissue specimen
Tissue specimens and controls were obtained from
patients who underwent surgery at the First Affiliated Hospital at
Sun Yat-sen University from 2006 to 2008. Paraffin-embedded tissue
blocks were retrieved from 204 pairs of PTC tissues, their adjacent
non-cancerous tissues (ANT), and 83 corresponding metastatic PTC
tissues in lymph nodes (due to their tiny size, 2 corresponding
lymph node metastatic PTC tissues were unavailable). Moreover,
eight pairs of fresh PTC tissues and adjacent non-cancerous tissues
(ANT) were obtained from the Department of Vacular and Thyroid
Surgery, the First Affiliated Hospital, Sun Yat-sen University.
Samples were collected immediately after surgical removal and
snap-frozen in liquid nitrogen and conserved at −80°C. This study
was approved by the Research Ethics Committee of The First
Affiliated Hospital at Sun Yat-sen University.
The histopathology of the disease was determined
according to the criteria of the World Health Organization by two
pathologists. Pathological staging was done according to the
tumour-node-metastasis (TNM) classification of the Union for
International Cancer Control (UICC). For the research purposes of
these clinical materials, prior patient's consents and approval
from the Institutional Research Ethics Committee were obtained.
Detailed clinical information about these patients, including age,
gender, TNM stage, tumor size, lymph node metastasis and distant
metastasis is summarized in Table
I.
 | Table IAEG-1 expression in PTC and their
relation with clinicopathological features of PTC. |
Table I
AEG-1 expression in PTC and their
relation with clinicopathological features of PTC.
| Variable | Cases (n) | % | Expression level of
AEG-1 | P-value |
|---|
| Age (years) | 8–78 (mean age:
39) | | | 0.186 |
| <45 | 141 | 69.1 | 0.1540±0.0498 | |
| ≥45 | 63 | 30.9 | 0.1435±0.0563 | |
| Sex | | | | 0.226 |
| Male | 50 | 24.5 | 0.1543±0.0520 | |
| Female | 154 | 75.5 | 0.1496±0.0521 | |
| Tumor size
(cm) | | | | 0.164 |
| ≤2 | 122 | 59.8 | 0.1466±0.0521 | |
| >2 | 82 | 40.2 | 0.1569±0.0514 | |
| TNM stage | | | | 0.233 |
| I- II | 184 | 90.2 | 0.1493±0.0512 | |
| III- IV | 20 | 9.8 | 0.1639±0.0584 | |
| Lymph node
metastasis | | | | 0.007a |
| Present | 85 | 41.7 | 0.1622±0.0538 | |
| Absent | 119 | 58.3 | 0.1425±0.0492 | |
| Distant
metastasis | | | | 0.284 |
| Yes | 3 | 1.5 | 0.1827±0.0589 | |
| No | 201 | 98.5 | 0.1503±0.0519 | |
Tissue microarray
Tissue microarrays (TMAs) were constructed according
to standard procedures (Unitma Co., Ltd., Seoul, Korea). Briefly,
utilizing the hematoxylin and eosin (H&E) sections as
templates, representative areas of each case were identified and
marked on a section of the donor block. Approximately 3-mm-thick
(2-mm diameter) tissue cylinders were punched from each donor
paraffin block using Quick-Ray tissue microarray instrument (Unitma
Co., Ltd.). The donor cores were placed into the corresponding
recipient block holes. To better represent each case, two tumor and
two normal tissue cores were punched from each case. After
construction, recipient blocks were pressed down by a slide for a
moment to flatten the surface, put into embedding molds and
incubated in an oven at 60°C for 30 min, then removed. Serial
4-µm sections were cut with a Leica micro-tome (Leica
Microsystems; Wetzlar, Germany) and mounted onto polylysine-coated
slides.
Immunohistochemistry
Sections (4 µm) were deparaffinized,
rehydrated in serially graded ethanol, heated in citric buffer (pH
6.0) once for 15 min in a microwave oven for antigen retrieval, and
blocked with 3% hydrogen peroxide. They were then labeled with
anti-AEG-1 antibody (1:500, Abnova), anti-MMP2 antibody (1:300,
Abgent) and anti-MMP9 antibody (1:200, Abgent) at 4°C overnight.
The next day, after washing with phosphate-buffered saline (PBS),
the sections were incubated with EnVision-HRP secondary antibody
(Dako, Carpinteria, CA, USA) for 30 min at 37°C in a water bath,
washed with PBS, stained with 0.5% diaminobenzidine and
counterstained with Mayer's hematoxylin, then air dried, and
mounted with resinene.
Evaluation of immunohistochemistry
The immunohisto-chemical staining in TMAs of
cancerous and adjacent tissues was subjected to microscope and
image analysis (Nanozoomer, Hamamatsu, Japan). Brown-yellow
granules in the cytoplasm were recorded as positive immunostaining.
The areas from both cancer and its adjacent normal tissue were
selected for analysis. The intensity of the staining signal was
measured and documented by using the Image-Pro Plus 6.0 image
analysis software (Media Cybernetics, Inc., Silver Spring, MD,
USA). The mean densitometry of the digital image (×400) was
designated as representative IHC staining intensity. In the equal
areas, the positive areas and the average optical density (AOD)
were detected, respectively. The staining positive index = positive
area × average optical density. The signal density of tissue areas
from three randomly selected visions were counted in a blinded
manner and subjected for statistical analysis.
RNA interference
Cells were seeded in 6-well plate wells with
3×10⁵ cells per well. After the density of cells growing
to approximately 50%, cells were starved in medium without serum
for 3 h. By mixing 50 nM siRNA with 5 µl Lipofectamine
RNAiMAX (Invitrogen, Carlsbad, CA, USA) in 500 µl OPTI-MEM
(Gibco) at room temperature for at least 20 min, cationic lipid
complex were prepared and then were added to the cells. After 6 h
of incubation, the media were replaced with fresh medium and the
cells were cultured for another 24 or 48 h after transfection, and
then were harvested for analysis. The siRNA specifically for AEG-1
and scrambled siRNA as negative control were purchased from (Ruibo,
Guangzhou, China). The following oligonucleotides for AEG-1: sense
5′-GGU CUC AGA UGA UGA UAA ATT-3′ and anisense: 5′-UUU AUC AUC AUC
UGA GAC CTT-3′; Control siRNA: sense 5′-UUC UCC GAA CGU GUC ACG
UTT-3′ and anisense: 5′-ACG UGA CAC GUU CGG AGA ATT-3′.
RNA extraction and quantitative
RT-PCR
Total RNA from fresh tissues was extracted using
TRIzol reagent (Invitrogen) according to the manufacturer's
instruction, and the RNA from cells was extracted using RNApure
Tissue kit (CWBiotech, Beijing, China). RNA (2 µg) from each
sample was used for cDNA synthesis (Roche, Basel, Switzerland) and
quantitative real-time PCR analysis (Roche). The primers for
amplification were: AEG-1 sense 5′-CGA GAA GCC CAA ACC AAA TG-3′,
antisense 5′-TGG TGG CTG CTT TGC TGT T-3′; MMP2 sense 5′-CTG GGA
GCA TGG CGA TGG ATA-3′, antisense 5′-GGA AGC GGA ATG GAA ACT TG-3′;
MMP9 sense 5′-GCC ATG TCT GCT GTT TTC TAG AGG-3′, antisense 5′-CAC
ACT CCA GGC TCT GTC CTC TTT-3′. GADPH (sense 5′-GTG GAC CTG ACC TGC
CGT CT-3′, antisense 5′-GGA GGA GTG GGT GTC GCT GT-3′) was used as
an internal control. Target gene expression was calculated using
ΔΔCt and comparative methods after normalization to GAPDH
expression. All experiments were performed in triplicates.
Protein extraction and western
blotting
Cells were lysed in RIPA buffer, agitated for 30 min
at 4°C, sonicated for 15 sec using sonic oscillator and centrifuged
at 14000 rpm for 15 min. The concentration of total proteins was
determined using BCA method. Total proteins (30 µg) in equal
volume were then denatured and loaded on 10% SDS polyacrylamide
gels for separation. The proteins were transferred onto
polyvinylidene difluoride membranes that were subsequently blocked
in 5% nonfat milk in TBST. The membranes were incubated with
primary antibodies including rabbit anti-AEG-1 (1:4000, Abnova),
mouse anti-MMP2 (1:1000, Abgent), rabbit anti-MMP9 (1:1500,
Abgent), rabbit anti-p65 (1:1000), rabbit anti-phospho-p65
(1:1000), and rabbit anti-GAPDH (1:2000) (Cell Signaling
Technology, Danvers, MA, USA) at 4°C overnight. After washing with
TBST, the membranes were probed with secondary antibody
HRP-conjugated goat anti-rabbit (1:5000, Cell Signaling Technology)
or goat anti-mouse (1:4000, CWBiotech) and visualized by enhanced
chemiluminescence. The gray scale value was calculated and analyzed
by using the Image-Pro Plus 6.0 image analysis software.
Immunofluorescence staining
BCPAP and SW579 cell lines were transfected with
AEG-1 siRNA and scrambled siRNA as negative control. At 24 h after
transfection, cells were rinsed with PBS two times and fixed in 4%
paraformaldehyde for 10 min at room temperature, washed three times
with PBS, then permeabilized in 0.4% Triton X-100 in PBS for 15 min
at room temperature. Cells were blocked in 5% bovine serum albumin
in PBS for 45 min at 37°C and then incubated with AEG (1:500,
Abnova), MMP2 (1:300, Abgent), and MMP9 (1:200, Abgent) at 4°C
overnight. After three 5-min washes in PBS, TRITC-conjugated goat
anti-rabbit IgG secondary antibody (1:400) or FITC-conjugated goat
anti-mouse IgG secondary antibody (1:400) (EarthOx, San Francisco,
CA, USA) were used for 30 min. Staining with diamidino phenylindole
was performed at a dilution of 1:1000 in PBS for 5 min to visualize
the nuclei. Slides were mounted using 90% glycerine and visualized
using an Olympus BX51 fluorescence microscope (Olympus, Tokyo,
Japan).
Transwell cell invasion and migration
assay
For invasion assay, BCPAP and SW579 transfected with
AEG-1 siRNA or Scrambled siRNA were trypsinized and resuspended to
a density of 1×10⁵/ml in serum-free RPMI-1640 medium. A
200 µl cell suspension was plated into the top side of
polycarbonate Transwell filter coated with 30 mg/cm2 of
Matrigel in the upper chamber of the BioCoat™ invasion chambers (BD
Bioscience, Bedford, MA, USA). After incubated at 37°C for 36 h,
cells on the upper chamber were removed by wiping gently with
cotton swabs. Cells on the lower membrane surface were fixed in 1%
paraformaldehyde for 20 min, stained with 0.3% Crystal Violet
solution for 20 min, and then counted (five high-power fields per
chamber). The migration assay was performed the same as the
invasion assay except that no matrigel was added to the transwell
membrane. Both experiments were performed in triplicate and the
data were presented as mean ± standard deviation (SD).
Zymography
Cells were cultured in serum-free medium for 24 h
after 48 h transfection. The conditioned medium was concentrated by
using Amicon Ultra-15 centrifugal filter devices (Millipore,
Boston, MA, USA) to preserve the supernatant. Gelatin zymography
required 20 µg protein of culture media separated by
electrophoreses on an 8% SDS-polyacrylamide gel (SDS-PAGE) with
0.1% gelatin and without reducing agent at 4°C. After
electrophoresis, gels were washed in 3% Triton 2 times on the
shaker for 30 min at room temperature to remove the SDS. Gels were
incubated for 48 h at 37°C in incubation buffer then stained for 2
h with 0.1% Coomassie blue R250 (Sigma, USA) dissolved in 10%
acetic acid and 40% methanol in H2O. Following the
instructions of the gelatin zymography regent (Applygen, Beijing,
China), clear digested bands appeared and then was photographically
scanned.
Co-immunoprecipitation (Co-IP)
Co-IP was operated as instructed by the manufacturer
by using the Pierce Co-Immunoprecipitation kit (Thermo Fisher
Scientific, Waltham, MA, USA). In brief, cells were lysed in
immunoprecipitation buffer. Total cell lysate (1 mg), 30 µg
of anti-AEG-1 antibody or normal IgG, and 50 µl of the resin
slurry were mixed and transferred to the Pierce Spin Column. The
mixture was incubated overnight at 4°C with continuous agitation.
After washing three times with 200 µl of IP Lysis/Wash
Buffer, the immunocomplexes were eluted by adding 60 µl of
Elution Buffer. The eluted sample was fractionated by sodium
dodecyl sulfate-polyacrylamide gel electrophoresis, and western
blot analysis was used to detect MMP2 and MMP9 with anti-MMP2 and
anti-MMP9 antibody (Abgent) respectively. A reverse IP (IP with
MMP9, western blotting with anti-AEG-1) was conducted as above.
Statistical analyses
All data are presented as mean ± SD and analyzed
using SPSS 16.0 statistics software. The significance of the
observed differences was determined with the Student's t-test or
one-way analysis of variance. The relations between AEG-1 and MMP2,
MMP9 were analyzed by Spearman's correlation coefficients.
P<0.05 was considered to indicate a statistically significant
difference.
Results
AEG-1 expression in fresh PTC and
ANT
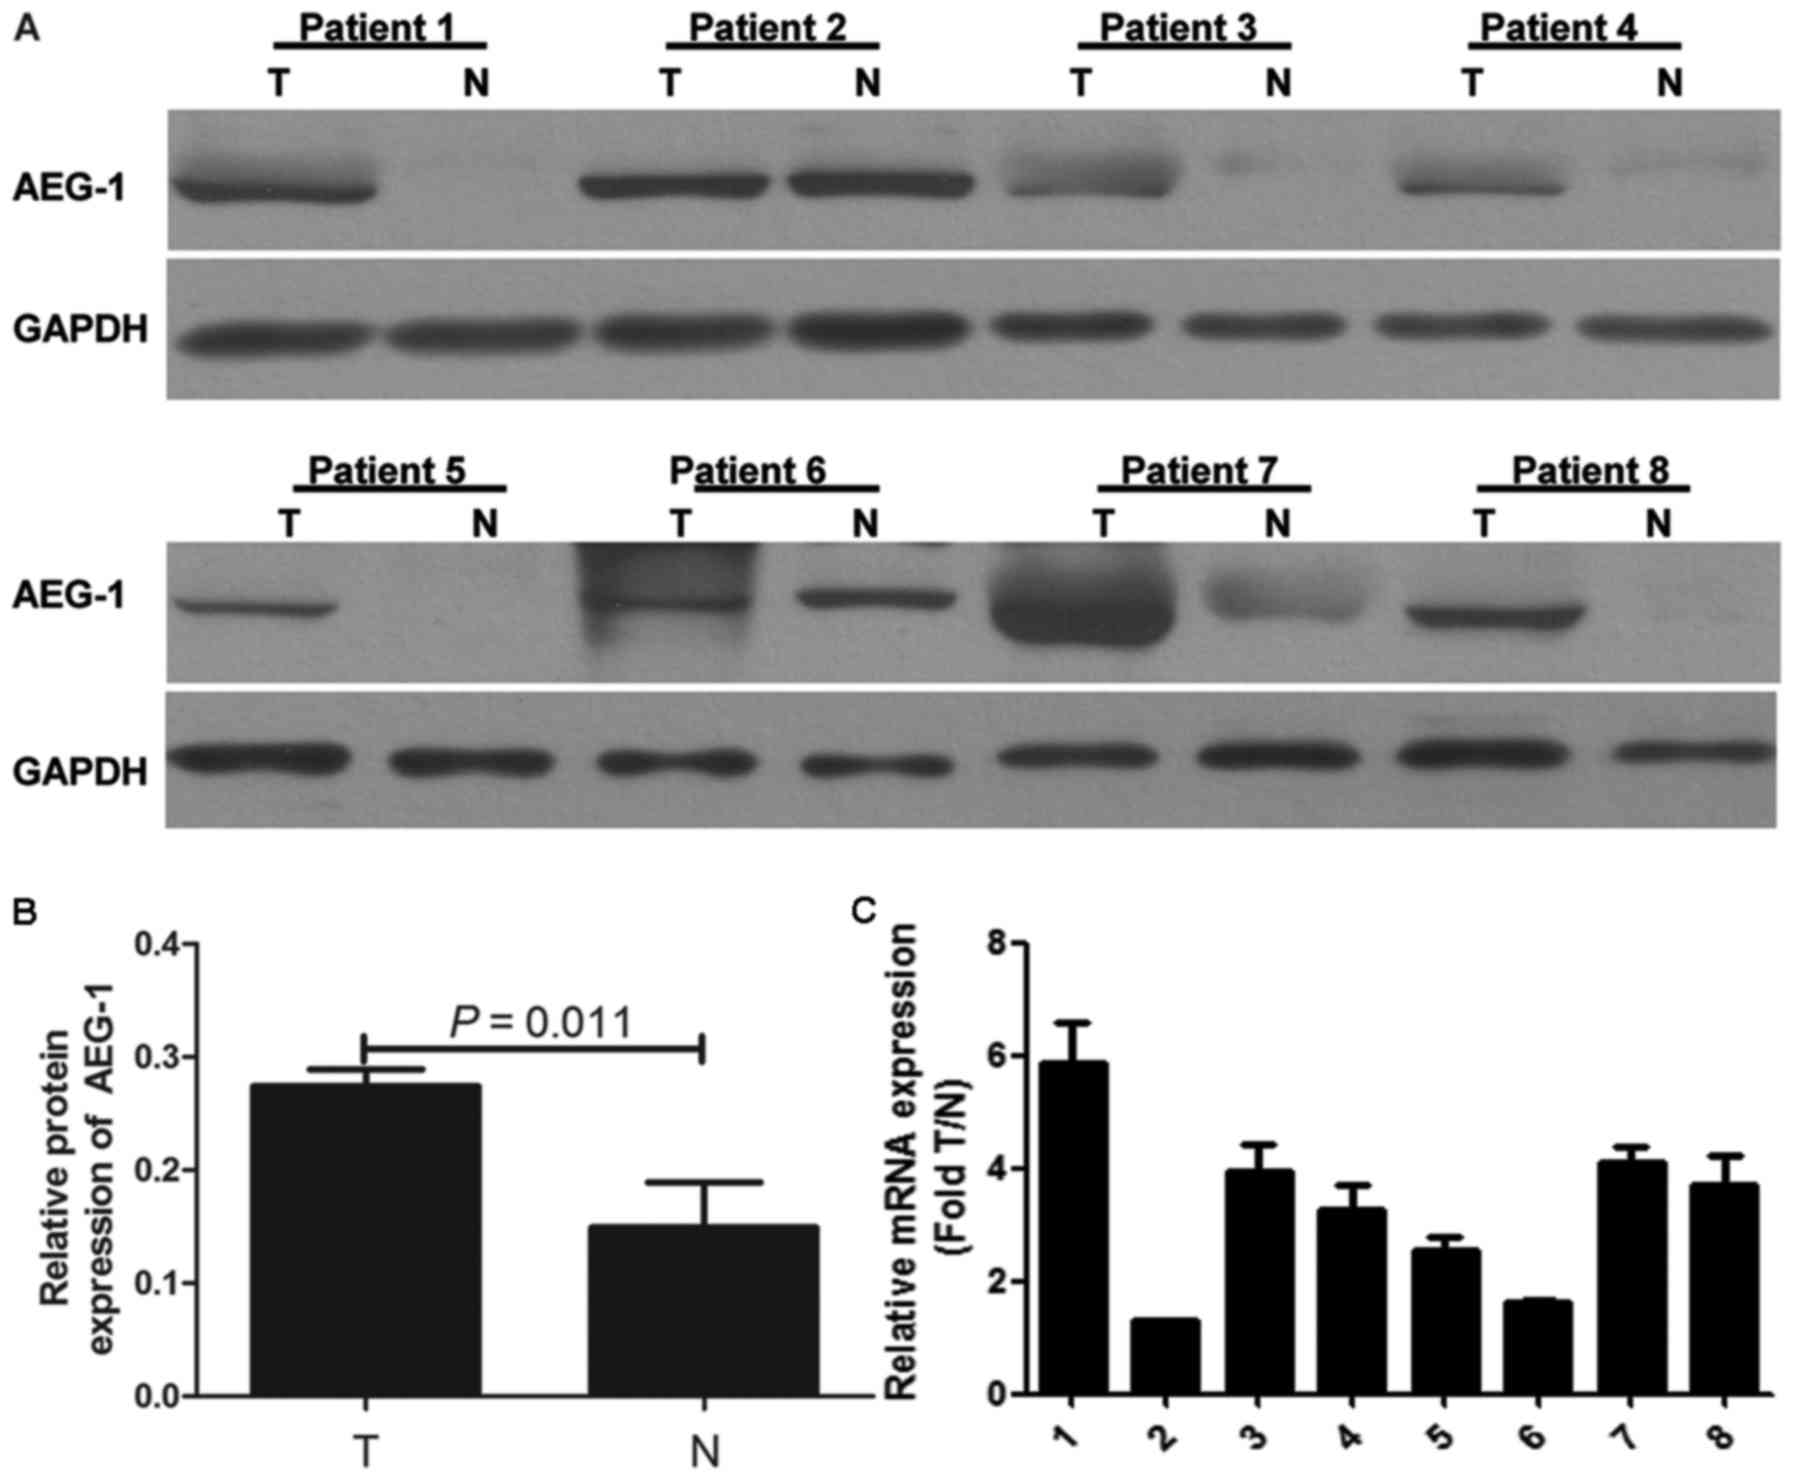
Western blotting was performed in eight pairs of
fresh PTC tissue and ANT. Our results demonstrated that AEG-1
protein expression was higher in most PTC samples compared with
that in paired ANT (Fig. 1A). The
gray intensity of AEG-1 of PTC tissue is higher than ANT (P=0.011)
(Fig. 1B). Real-time PCR analysis
was carried out to further determine AEG-1 mRNA expression in eight
pairs of fresh PTC and ANT. The results were consistent with
protein expression (Fig. 1C).
AEG-1 expression was upregulated in PTC.
AEG-1 expression in primary PTC, adjacent
non-cancerous tissue and corresponding lymph node metastatic PTC
tissue
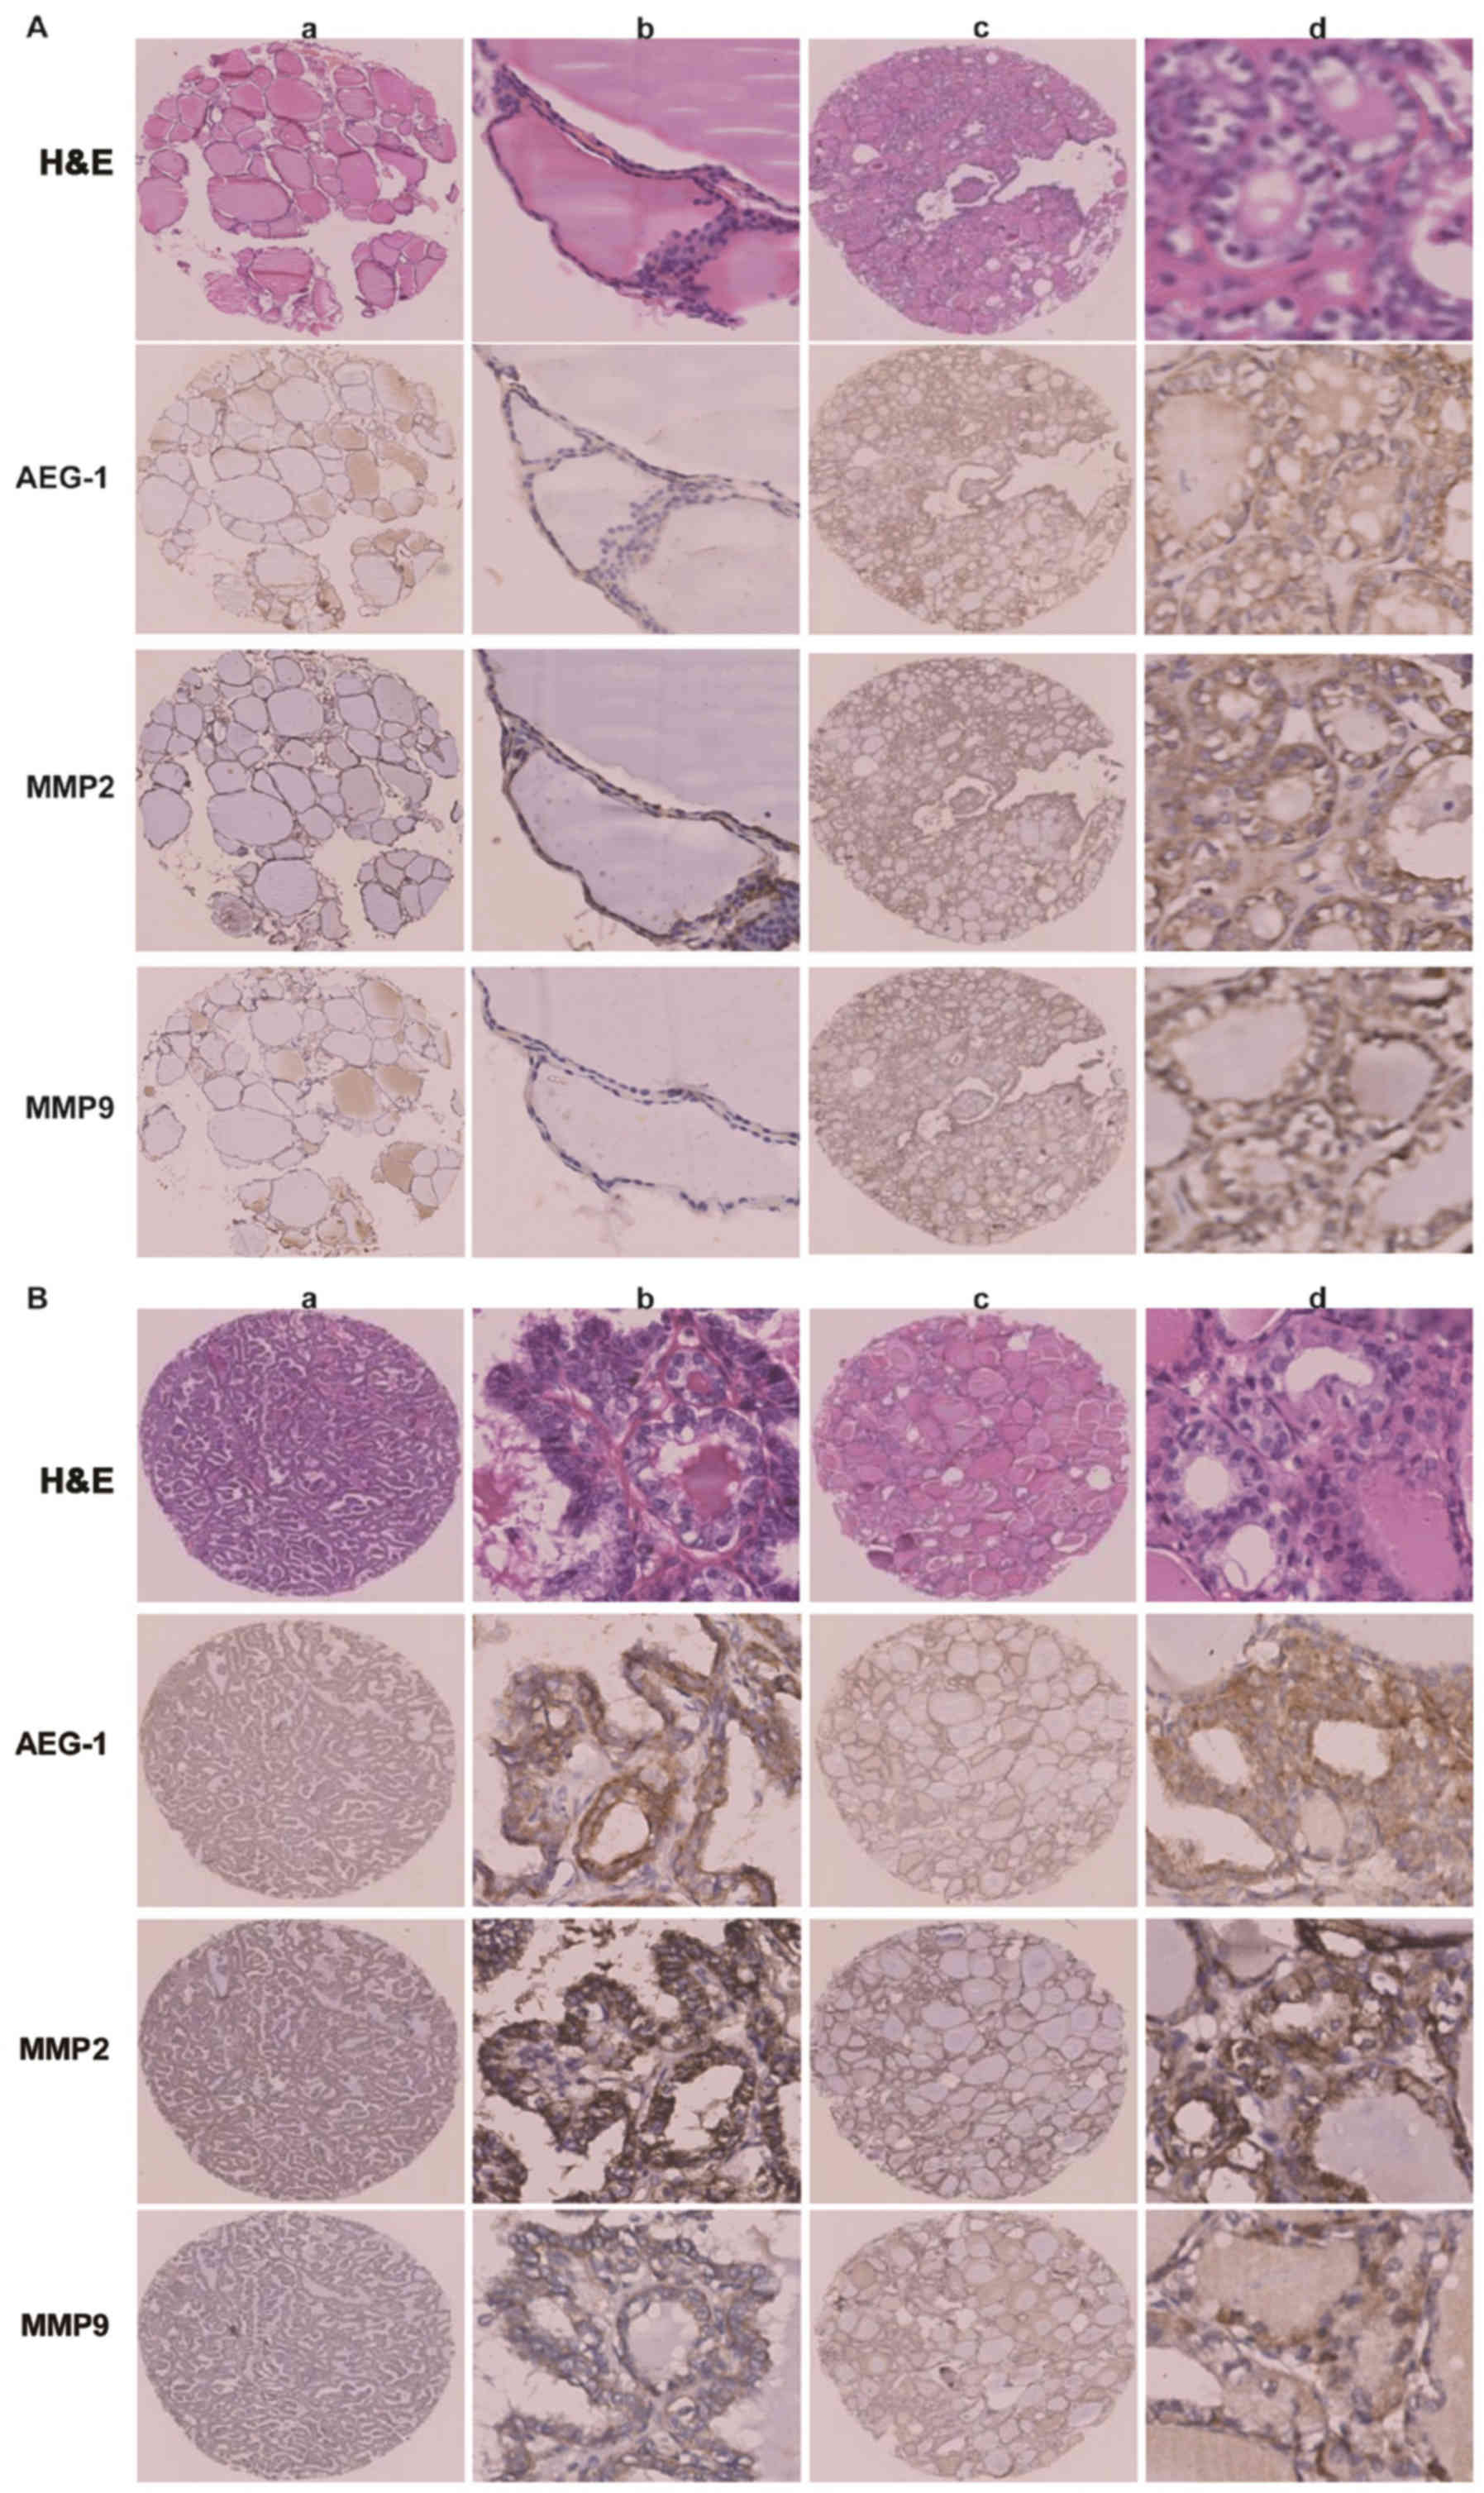
We analyzed overall AEG-1 expression in primary PTC,
their ANT and corresponding lymph node metastatic PTC tissues by
performing IHC on 204 cases of PTC tissues (Fig. 2A). The 204 primary PTC included 119
cases without lymphatic metastasis and 85 cases with lymphatic
metastasis. AEG-1 positive signals were located in the cytoplasm of
cells by immunohistochemistry. The degree of AEG-1 positive
staining in PTC cells were stronger than that in normal cells. The
density of the immunohistochemical staining was measured by using
the Image-Pro Plus 6.0 image analysis software. High levels of
AEG-1 expression (0.1507±0.0520) were measured in all 204 primary
PTC sections. By contrast, AEG-1 was undetectable or only slightly
detectable (0.0236±0.0152) in the ANT sections. The result
suggested a significantly higher level of AEG-1 expression in PTC
tissues compared with the ANT (P=0.015, Fig. 2B). The higher AEG-1 levels in PTC
were because of the increased expression, but not more cells.
Furthermore, we found the difference between PTC with lymph node
metastasis (85 cases) and PTC without lymph node metastasis (119
cases). The mean density of former cases is 0.1622±0.0538, while
the density of latter cases is 0.1425±0.0492 (P=0.027, Fig. 2C). In addition, the staining
intensity of AEG-1 expression was significantly higher in lymph
node metastatic PTC tissue (0.2220±0.0439) compared with
corresponding primary PTC (0.1622±0.0545) (P<0.001, Fig. 2D).
The interrelationship between AEG-1
expression and clinicopathologic parameters
To determine the association between AEG-1
expression and clinicopathological implications of thyroid cancer,
we conducted spearman's correlation according to age, gender, TNM
stage, T classification, N and M classification (Table I). Statistical analysis exhibited
that the expression of AEG-1 was significantly related to the N
classification (P=0.007). However, no significant association of
AEG-1 expression with the rest of clinical parameters was
found.
AEG-1 increased migration and invasion of
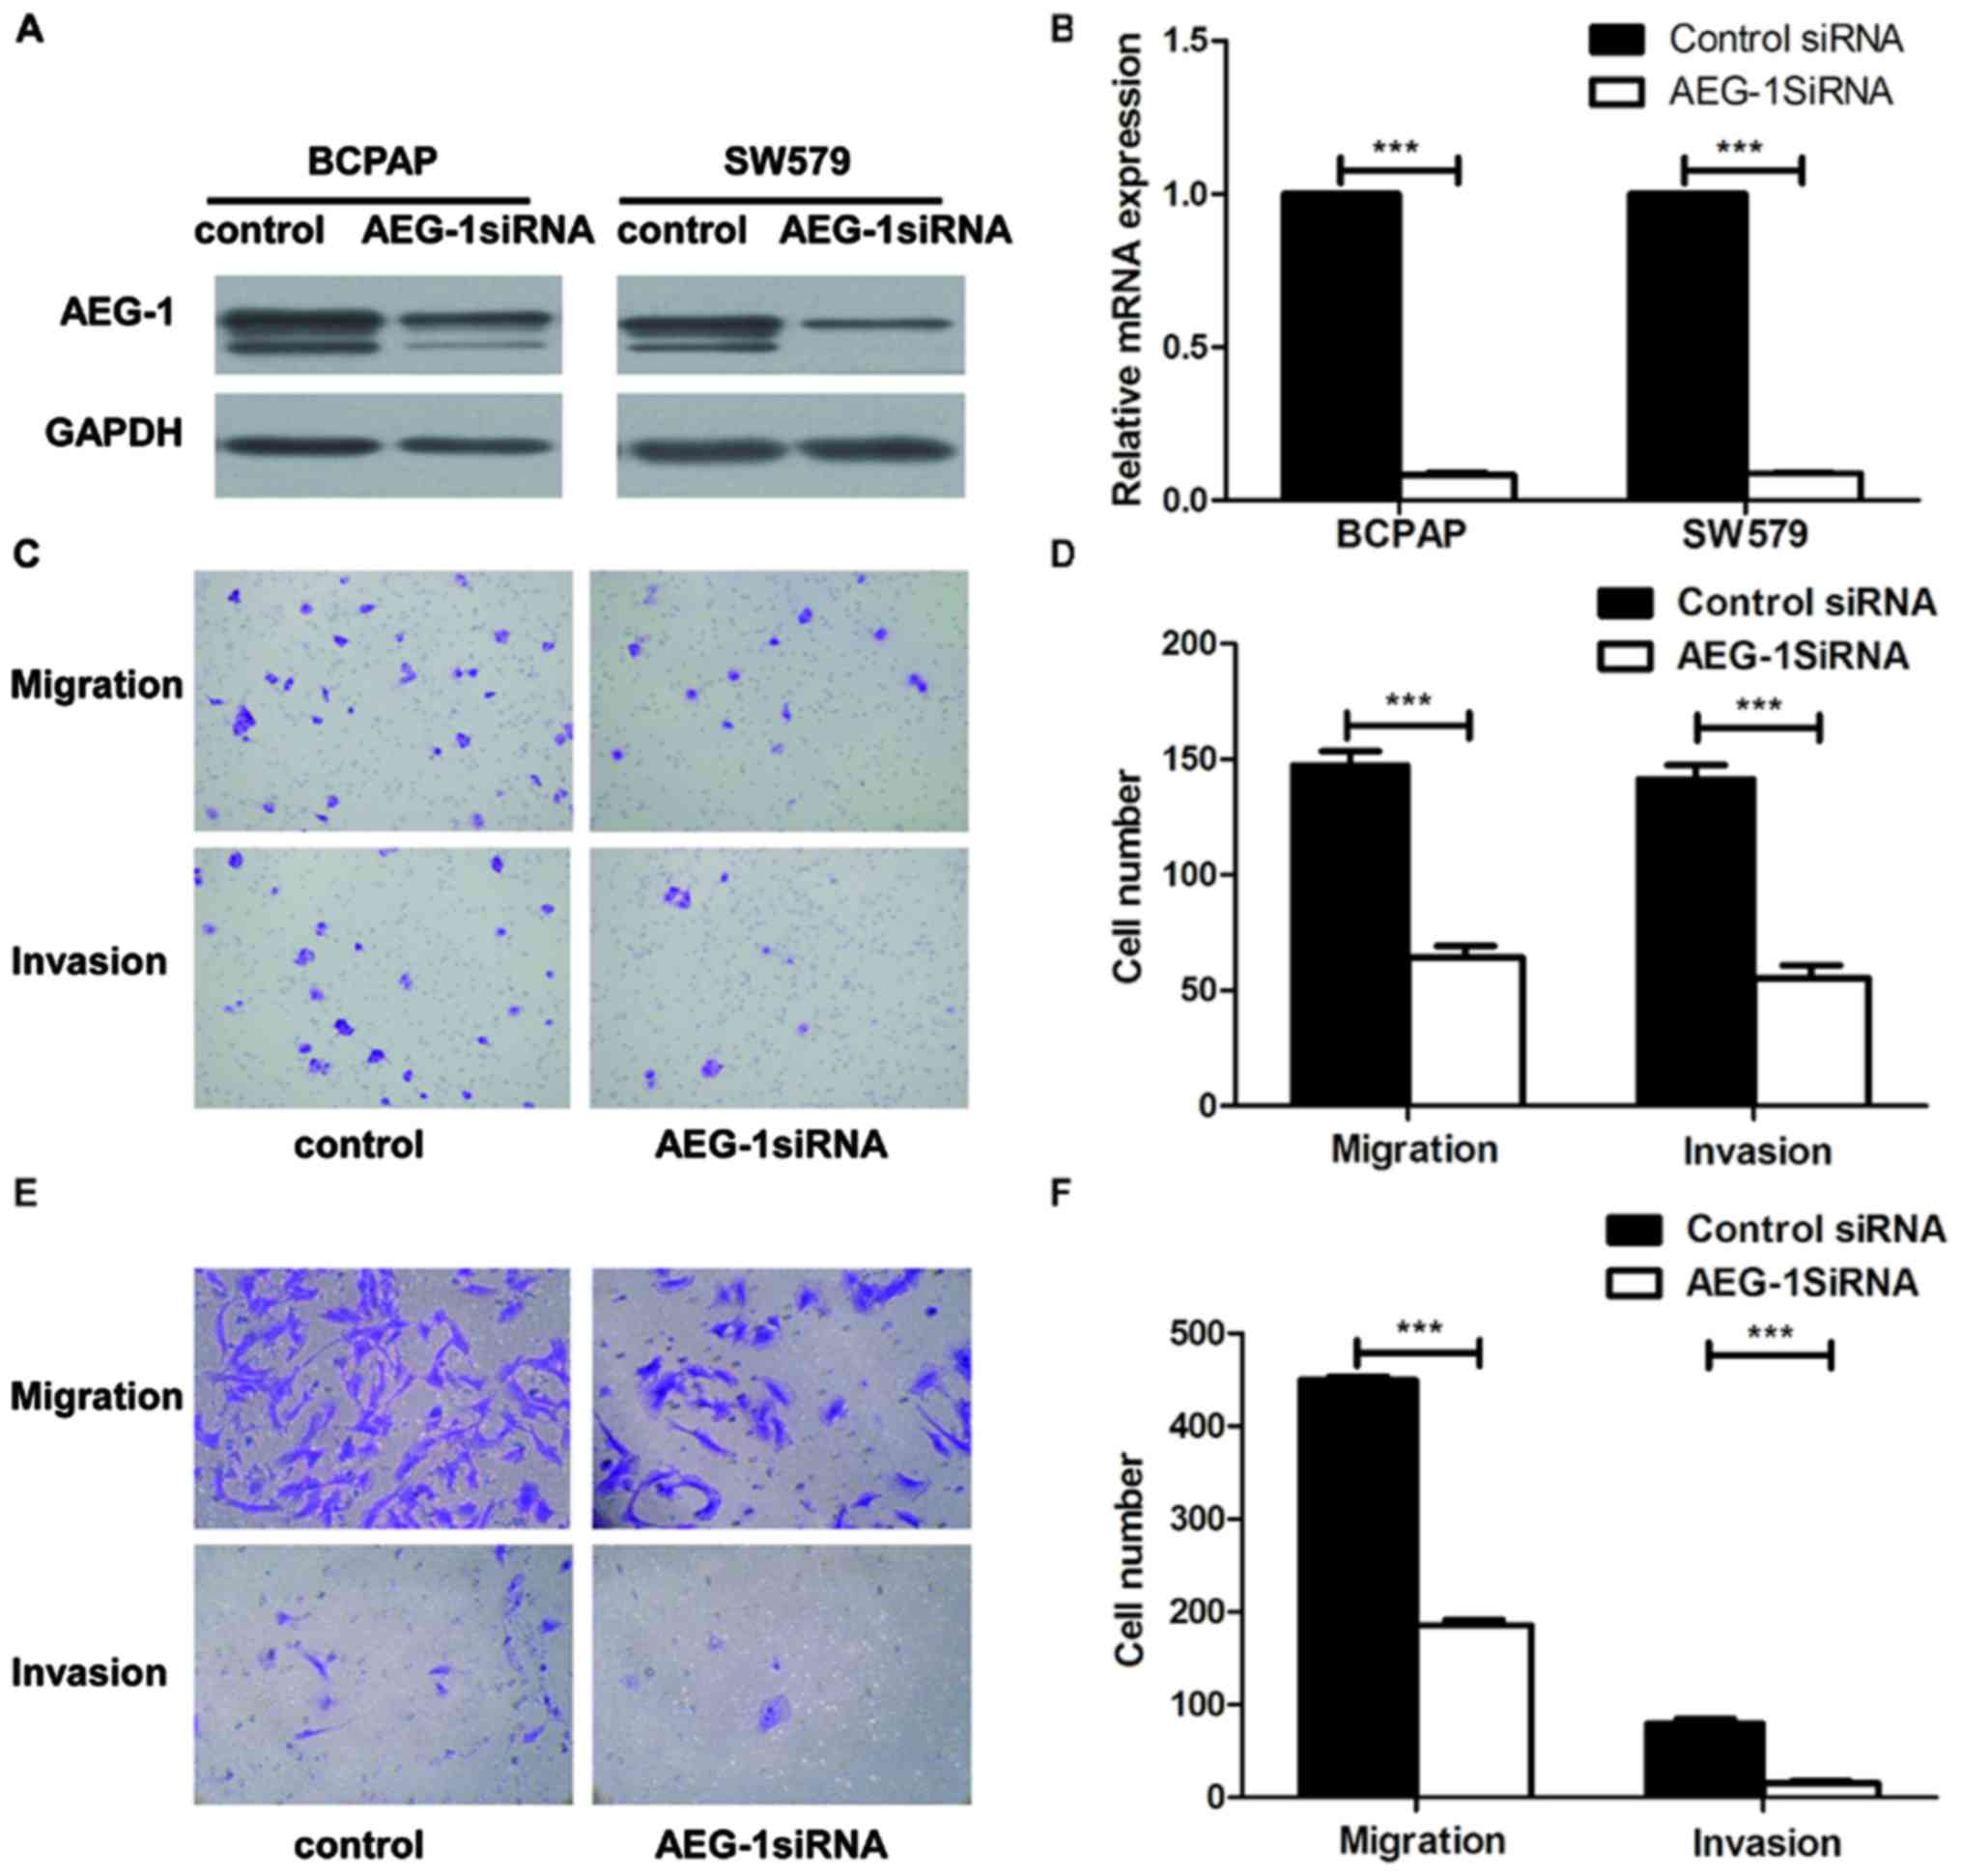
thyroid cancer cells in vitro
To explore the biological role of AEG-1 on the
progression of PTC, we used small interfering RNA (siRNA)
approaches to reduce AEG-1 expression in BCPAP and SW579 cell
lines. AEG-1 siRNA successfully knocked down AEG-1 expression at
protein levels (Fig. 3A) and mRNA
levels (Fig. 3B), using western
blotting and real-time PCR. Transwell cell migration assay revealed
that silencing of AEG-1 expression significantly inhibited the
migratory ability of BCPAP and SW579 cell lines. Moreover,
transwell matrix penetration assay showed that knockdown of AEG-1
significantly reduced the invasive properties of both cell lines
(Fig. 3C–F). Taken together, these
results suggest that AEG1 promotes migration and invasion of PTC
cells.
AEG-1-mediated cancer cell migration and
invasion is linked to MMP2 and MMP9
The association between the expression levels of
AEG-1 and MMP2 or MMP9 was examined in all 204 pairs of PTC
tissues. PTC samples with high-level AEG-1 expression exhibited
strong MMP2 staining signals, whereas MMP2 expression in specimens
with low AEG-1 levels was also low or absent (Fig. 4A). The outcome was sthe same when
AEG-1 and MMP9 expression was analyzed (Fig. 4B). Spearman correlation analysis
showed positive correlations between AEG-1 and MMP2, AEG-1 and MMP9
expression in the tested tissue samples (r=0.160; P=0.022; r=0.140;
P=0.045). It suggested that AEG-1 overexpression was clinically
relevant to upregulation of MMP2 and MMP9 in human PTC tissue.
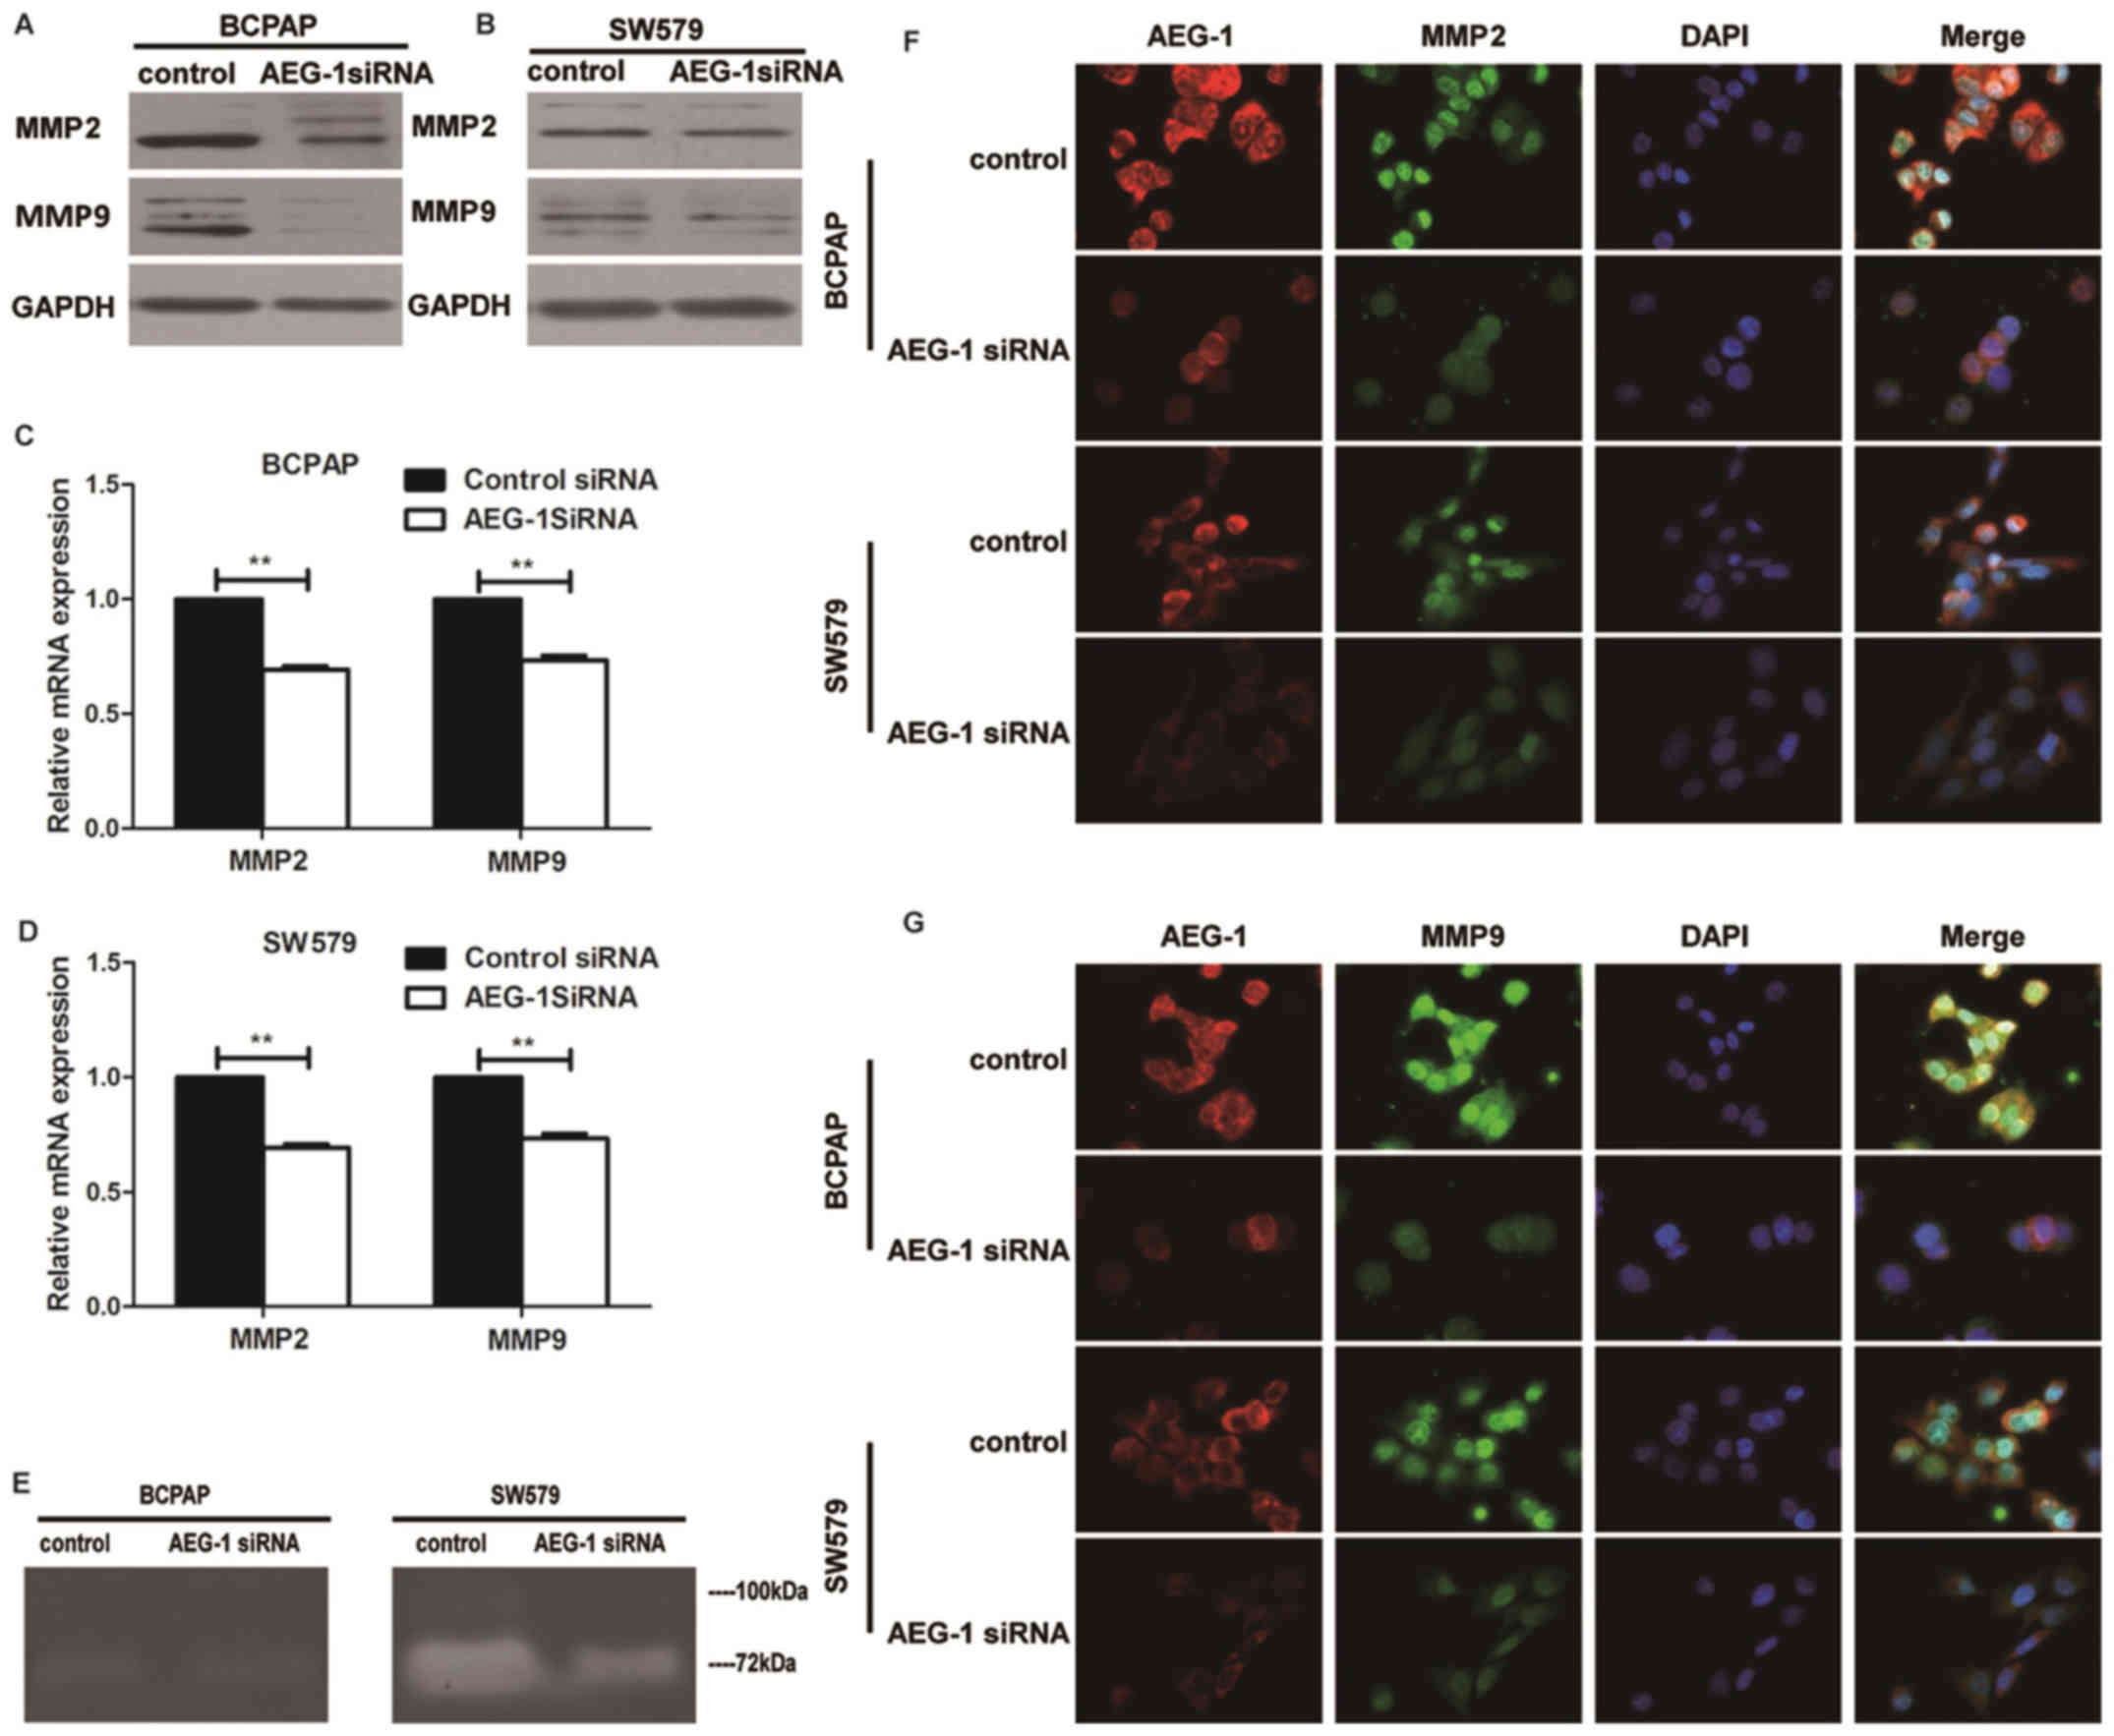
Western blot and real-time PCR analysis were done to
determine the expression levels of MMP2 and MMP9 in cell lines
transfected with AEG-1 siRNA. Knockdown of AEG-1 repressed MMP2 and
MMP9 in protein and mRNA expression in BCPAP and SW579 cells
(Fig. 5A–D). Consistent with
western blot and RT-PCR data, immunofluorescence showed that AEG-1
siRNA inhibited the expression of MMP2 and MMP9 than negative
control (Fig. 5F–G). Moreover, the
activities of MMP2 and MMP9 in SW579 were found to be reduced by
AEG-1 siRNA using zymography assay, while the results in BCPAP
showed no obvious difference (Fig.
5E). It indicated that AEG-1 could regulate the activities of
MMP2 and MMP9.
AEG-1 interacts with MMP9
To further study whether AEG-1 interacts with MMP2
and MMP9 in thyroid cancer, we conducted co-immunoprecipitation
assay on BCPAP and SW579 cell lines. Our result showed that AEG-1
interacted with MMP9 in vitro (Fig. 6), but there was no interaction
between AEG-1 and MMP2.
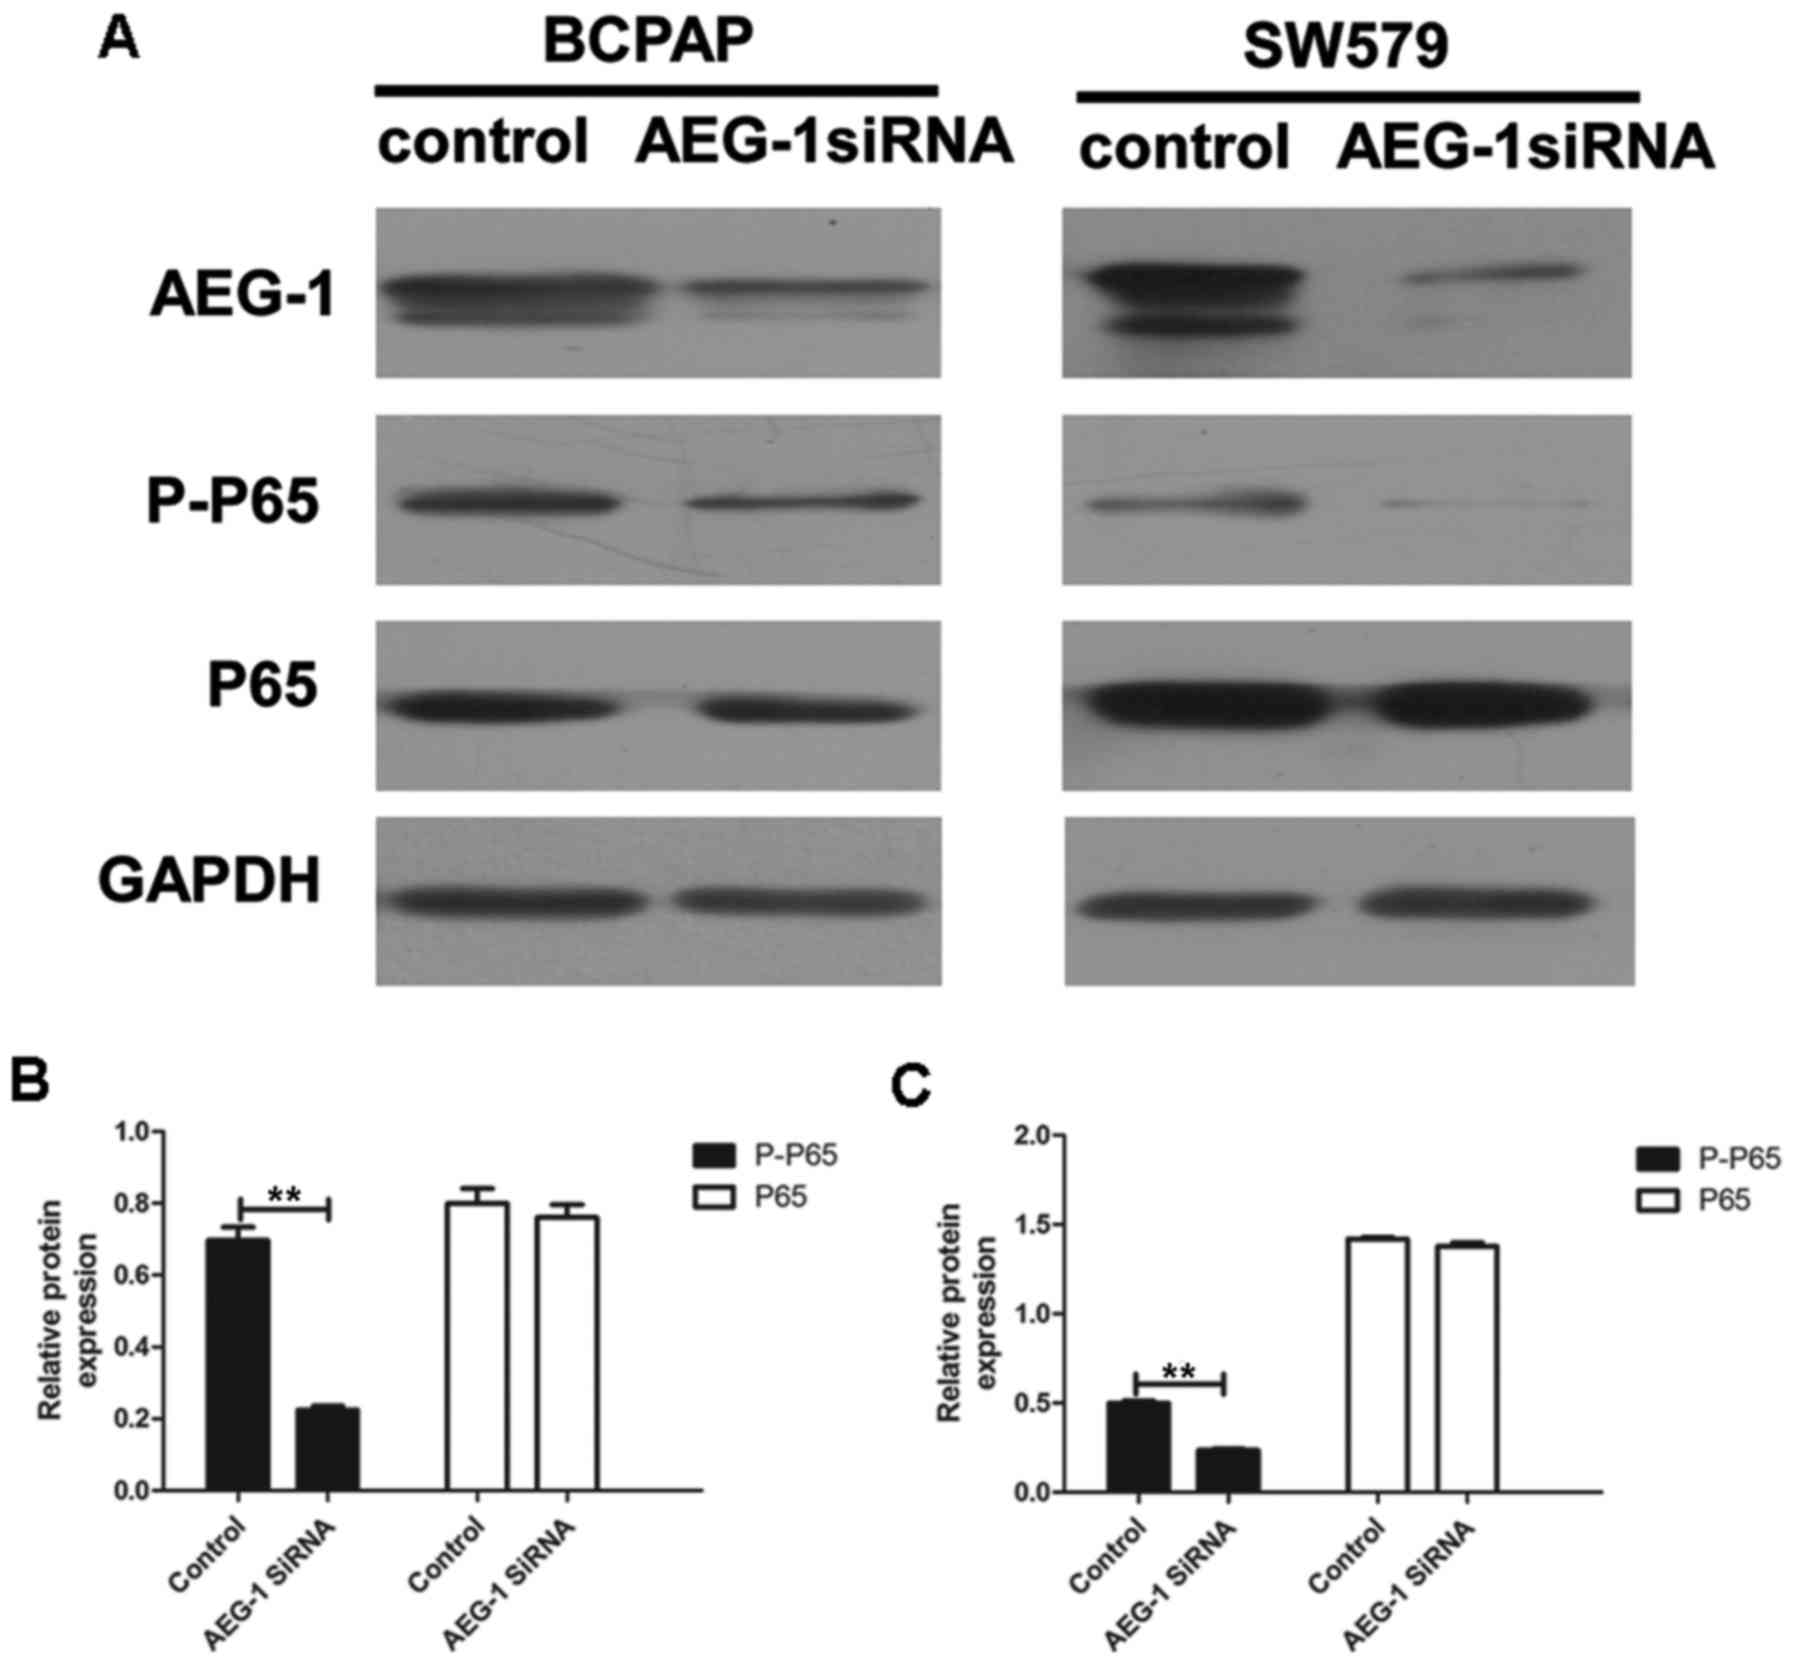
AEG-1 mediates aggressiveness of thyroid
cancer via the NF-κB pathway
We performed western blot analysis and image
analysis to illustrate whether AEG-1 mediated invasion and
metastasis of thyroid cancer by modulating the NF-κB pathway. Our
results showed that the levels of phospho-p65 were significantly
downregulated by AEG-1 siRNA (P=0.007 in BCPAP; P=0.004 in SW579),
with no significant changes in total p65 (a subunit of NF-κB)
levels (P=0.552 in BCPAP; P=0.229 in SW579) (Fig. 7). This result demonstrate that
AEG-1 could influence the development thyroid cancer at least
partially by the NF-κB signaling pathway.
Discussion
The diverse roles of AEG-1 in tumor progression in
most cancers are now being elucidated. For instance, AEG-1 is
essential for NF-κB activation, hepatocarcinogenesis and shaping
the tumor microenvironment for hepatocellular carcinoma development
(18). Moreover, AEG-1 is
overexpressed in a great portion of epithelial ovarian cancer
patients with peritoneal dissemination and/or lymph node
metastasis. AEG-1 may be clinically useful for predicting
metastasis in epithelial ovarian cancer (19). However, the role of AEG-1 in
thyroid cancer is confused. In this study, we found that the
expression of AEG-1 was elevated in PTC tissues compared with that
in normal thyroid controls. At the same time, the higher expression
of AEG-1 was correlated with lymph node metastasis in thyroid
carcinoma. Moreover metastatic lesions displayed significantly
higher AEG-1 expression than primary lesions in PTC. So our results
suggest that AEG-1 might play an important role in the progression
and metastasis of PTC, which is consistent with other reports.
AEG-1 may be a useful metastatic predictor in PTC.
Recent studies have documented that AEG-1 insights
into a novel gene involved in tumor progression and metastasis. The
function of MMPs was believed to not only degrade the extracellular
matrix but also involve in development, angio-genesis,
inflammation, cancer progression, and especially in promoting
migration and invasion of cancer cells (20–22).
Research has shown that MMP2 and MMP9 were involved in
AEG-1-mediated invasion of glioma cells (23). Moreover, AEG-1 contributes to the
progression and invasion of glioma by enhancing MMP9 transcription
(24). MMP-1 may be a downstream
factor of AEG-1 in determining the invasion and metastasis in head
and neck squamous cell carcinoma (25). At the same time, our previous study
showed that AEG-1-mediated carcinogenesis and invasiveness might be
through upregulating MMP2 in osteosarcoma (26). Epidermal growth factor-containing
fibulin-like extracellular matrix protein 1 played a part as the
mediator between AEG-1 and MMP2 in metastasis of osteosarcoma
(27). Since studies showed that
AEG-1-mediated metastasis was closely related to MMP2/9, we tried
to find out the relationship between AEG-1 and MMP2/9 in the
progression of PTC. In our study, AEG-1 was specifically
upregulated in thyroid cancer and associated with the invasion and
migration in thyroid cancer. Additionally, we found that AEG-1
siRNA inhibited the activation of MMP2 and MMP9 in SW579.
Curiously, the activation of MMP2 and MMP9 in BCPAP did not show
the same obvious change, which might be due to the weak metastasis
capacity of BCPAP. So our data suggested that AEG-1-mediated
migratory and invasiveness might be through upregulating MMP2 and
MMP9 in thyroid cancer.
Of note, we found that AEG-1 could directly interact
with MMP9 through Co-immunoprecipitation (Co-IP) test. To our
knowledge, this was the first report to show that AEG-1 interacted
with MMP9. Previous studies had already exhibited that AEG-1
exerted multiple functions by interacting with other proteins in
protein complexes, such as NF-κB (13,14),
PLZF (28), BCCIPα (29), SND1 (30) and β-catenin (31). For example, AEG-1 promoted tumor
cell migration and invasion through activation of the transcription
factor of NF-κB by directly interacting with the p65 subunit of
NF-κB (13,14). Staphylococcal nuclease domain
containing 1 (SND1), a nuclease in the RNA-induced silencing
complex (RISC), facilitating RNAi-mediated gene silencing, was
revealed as an AEG-1 interacting protein (30). The inhibition of enzymatic activity
of SND1 abrogates AEG-1 function in regulating cell growth and
proliferation. Now we found that MMP9 was also an AEG-1-interacting
protein. What effect it has on tumor progression is not yet known.
It may affect the stability of MMP9 structure, or promote the
function of MMP9 by the formation of the protein complex. Further
studies are required to confirm these hypotheses.
NF-κB is responsible for the induction of MMP9
expression through targeting the promoter directly (32). AEG-1 interacts with cyclic
AMP-responsive element binding protein-binding protein (CBP),
indicating that it might act as a bridging factor between NF-κB,
CBP, and the basal transcription machinery (14). The above indicated that AEG-1 could
indirectly affect MMP9 expression through NF-κB pathway. We found
that downregulating AEG-1 could significantly reduce the expression
of pp65, a subunit of NF-κB, which supported our hypothesis that
AEG-1 might indirectly mediate MMP9 expression through the NF-κB
pathway. In addition, other research has shown the direct
interaction between AEG-1 and p65 (13). We found the AEG-1-MMP9 interaction.
There is the possibility that the functional complex was formed by
AEG-1, p65 and MMP9. Whether AEG-1 acts as a bridging molecule
between NF-κB and MMP9 is of interest for further study. Perhaps it
is a new possible mechanism that AEG-1 promotes tumor cell
migration and invasion by MMP9.
In summary, our data showed that high expression of
AEG-1 played a crucial role of invasion and metastasis in thyroid
cancer through MMP2 and 9. At the same time, the activation of
NF-κB pathway might be a possible working mechanism. Moreover, the
new finding of the interaction of AEG-1 and MMP9 is another
potential form that AEG-1 promoted tumor cell migration and
invasion.
Acknowledgments
This work was supported by the Foundation of China
National Natural Science (nos. 81172232, 81372865 and 81402465) and
the Foundation of China Guangdong Science and Technology (no.
2013B021800128). The authors thank Mr. Yuefeng Wang (Department of
Pathology, the First Affiliated Hospital of Sun Yat-Sen University)
for his assistance with zymography analyses.
References
|
1
|
Brito JP, Hay ID and Morris JC: Low risk
papillary thyroid cancer. BMJ. 348:g30452014. View Article : Google Scholar : PubMed/NCBI
|
|
2
|
Grubbs EG and Evans DB: Role of lymph node
dissection in primary surgery for thyroid cancer. J Natl Compr Canc
Netw. 5:623–630. 2007. View Article : Google Scholar : PubMed/NCBI
|
|
3
|
Mazzaferri EL and Jhiang SM: Long-term
impact of initial surgical and medical therapy on papillary and
follicular thyroid cancer. Am J Med. 97:418–428. 1994. View Article : Google Scholar : PubMed/NCBI
|
|
4
|
Zaydfudim V, Feurer ID, Griffin MR and
Phay JE: The impact of lymph node involvement on survival in
patients with papillary and follicular thyroid carcinoma. Surgery.
144:1070–1077; discussion 1077–1078. 2008. View Article : Google Scholar : PubMed/NCBI
|
|
5
|
Su ZZ, Kang DC, Chen Y, Pekarskaya O, Chao
W, Volsky DJ and Fisher PB: Identification and cloning of human
astrocyte genes displaying elevated expression after infection with
HIV-1 or exposure to HIV-1 envelope glycoprotein by rapid
subtraction hybridization, RaSH. Oncogene. 21:3592–3602. 2002.
View Article : Google Scholar : PubMed/NCBI
|
|
6
|
Kang DC, Su ZZ, Sarkar D, Emdad L, Volsky
DJ and Fisher PB: Cloning and characterization of HIV-1-inducible
astrocyte elevated gene-1, AEG-1. Gene. 353:8–15. 2005. View Article : Google Scholar : PubMed/NCBI
|
|
7
|
Yoo BK, Emdad L, Lee SG, Su ZZ,
Santhekadur P, Chen D, Gredler R, Fisher PB and Sarkar D: Astrocyte
elevated gene-1 (AEG-1): A multifunctional regulator of normal and
abnormal physiology. Pharmacol Ther. 130:1–8. 2011. View Article : Google Scholar : PubMed/NCBI
|
|
8
|
Luo Y, Zhang X, Tan Z, Wu P, Xiang X, Dang
Y and Chen G: Astrocyte elevated gene-1 as a novel
clinicopathological and prognostic biomarker for gastrointestinal
cancers: A meta-analysis with 2999 patients. PLoS One.
10:e01456592015. View Article : Google Scholar : PubMed/NCBI
|
|
9
|
Emdad L, Das SK, Dasgupta S, Hu B, Sarkar
D and Fisher PB: AEG-1/MTDH/LYRIC: Signaling pathways, downstream
genes, interacting proteins, and regulation of tumor angiogenesis.
Adv Cancer Res. 120:75–111. 2013. View Article : Google Scholar : PubMed/NCBI
|
|
10
|
Li C, Wu X, Zhang W, Li J, Liu H, Hao M,
Wang J, Zhang H, Yang G, Hao M, et al: AEG-1 promotes metastasis
through downstream AKR1C2 and NF1 in liver cancer. Oncol Res.
22:203–211. 2014. View Article : Google Scholar
|
|
11
|
Sarkar D, Emdad L, Lee SG, Yoo BK, Su ZZ
and Fisher PB: Astrocyte elevated gene-1: Far more than just a gene
regulated in astrocytes. Cancer Res. 69:8529–8535. 2009. View Article : Google Scholar : PubMed/NCBI
|
|
12
|
Song L, Li W, Zhang H, Liao W, Dai T, Yu
C, Ding X, Zhang L and Li J: Over-expression of AEG-1 significantly
associates with tumour aggressiveness and poor prognosis in human
non-small cell lung cancer. J Pathol. 219:317–326. 2009. View Article : Google Scholar : PubMed/NCBI
|
|
13
|
Emdad L, Sarkar D, Su ZZ, Randolph A,
Boukerche H, Valerie K and Fisher PB: Activation of the nuclear
factor kappaB pathway by astrocyte elevated gene-1: Implications
for tumor progression and metastasis. Cancer Res. 66:1509–1516.
2006. View Article : Google Scholar : PubMed/NCBI
|
|
14
|
Sarkar D, Park ES, Emdad L, Lee SG, Su ZZ
and Fisher PB: Molecular basis of nuclear factor-kappaB activation
by astrocyte elevated gene-1. Cancer Res. 68:1478–1484. 2008.
View Article : Google Scholar : PubMed/NCBI
|
|
15
|
Pan Y, Guo X, Yang Z, Chen S, Lei Y, Lin
M, Wang L, Feng C and Ke Z: AEG-1 activates Wnt/PCP signaling to
promote metastasis in tongue squamous cell carcinoma. Oncotarget.
7:2093–2104. 2016. View Article : Google Scholar :
|
|
16
|
Fabien N, Fusco A, Santoro M, Barbier Y,
Dubois PM and Paulin C: Description of a human papillary thyroid
carcinoma cell line. Morphologic study and expression of tumoral
markers. Cancer. 73:2206–2212. 1994. View Article : Google Scholar : PubMed/NCBI
|
|
17
|
Fogh J, Wright WC and Loveless JD: Absence
of HeLa cell contamination in 169 cell lines derived from human
tumors. J Natl Cancer Inst. 58:209–214. 1977. View Article : Google Scholar : PubMed/NCBI
|
|
18
|
Robertson CL, Srivastava J, Siddiq A,
Gredler R, Emdad L, Rajasekaran D, Akiel M, Shen XN, Guo C,
Giashuddin S, et al: Genetic deletion of AEG-1 prevents
hepatocarcinogenesis. Cancer Res. 74:6184–6193. 2014. View Article : Google Scholar : PubMed/NCBI
|
|
19
|
Li C, Liu J, Lu R, Yu G, Wang X, Zhao Y,
Song H, Lin P, Sun X, Yu X, et al: AEG -1 overexpression: A novel
indicator for peritoneal dissemination and lymph node metastasis in
epithelial ovarian cancers. Int J Gynecol Cancer. 21:602–608. 2011.
View Article : Google Scholar : PubMed/NCBI
|
|
20
|
Boire A, Covic L, Agarwal A, Jacques S,
Sherifi S and Kuliopulos A: PAR1 is a matrix metalloprotease-1
receptor that promotes invasion and tumorigenesis of breast cancer
cells. Cell. 120:303–313. 2005. View Article : Google Scholar : PubMed/NCBI
|
|
21
|
McQuibban GA, Gong JH, Wong JP, Wallace
JL, Clark-Lewis I and Overall CM: Matrix metalloproteinase
processing of monocyte chemoattractant proteins generates CC
chemokine receptor antagonists with anti-inflammatory properties in
vivo. Blood. 100:1160–1167. 2002.PubMed/NCBI
|
|
22
|
Yu Q and Stamenkovic I: Cell
surface-localized matrix metal-loproteinase-9 proteolytically
activates TGF-beta and promotes tumor invasion and angiogenesis.
Genes Dev. 14:163–176. 2000.PubMed/NCBI
|
|
23
|
Emdad L, Sarkar D, Lee SG, Su ZZ, Yoo BK,
Dash R, Yacoub A, Fuller CE, Shah K, Dent P, et al: Astrocyte
elevated gene-1: A novel target for human glioma therapy. Mol
Cancer Ther. 9:79–88. 2010. View Article : Google Scholar : PubMed/NCBI
|
|
24
|
Liu L, Wu J, Ying Z, Chen B, Han A, Liang
Y, Song L, Yuan J, Li J and Li M: Astrocyte elevated gene-1
upregulates matrix metalloproteinase-9 and induces human glioma
invasion. Cancer Res. 70:3750–3759. 2010. View Article : Google Scholar : PubMed/NCBI
|
|
25
|
Wang YP, Liu IJ, Chiang CP and Wu HC:
Astrocyte elevated gene-1 is associated with metastasis in head and
neck squamous cell carcinoma through p65 phosphorylation and
upregulation of MMP1. Mol Cancer. 12:1092013. View Article : Google Scholar : PubMed/NCBI
|
|
26
|
Wang F, Ke ZF, Sun SJ, Chen WF, Yang SC,
Li SH, Mao XP and Wang LT: Oncogenic roles of astrocyte elevated
gene-1 (AEG-1) in osteosarcoma progression and prognosis. Cancer
Biol Ther. 12:539–548. 2011. View Article : Google Scholar : PubMed/NCBI
|
|
27
|
Wang Z, Cao CJ, Huang LL, Ke ZF, Luo CJ,
Lin ZW, Wang F, Zhang YQ and Wang LT: EFEMP1 promotes the migration
and invasion of osteosarcoma via MMP-2 with induction by AEG-1 via
NF-κB signaling pathway. Oncotarget. 6:14191–14208. 2015.
View Article : Google Scholar : PubMed/NCBI
|
|
28
|
Thirkettle HJ, Mills IG, Whitaker HC and
Neal DE: Nuclear LYRIC/AEG-1 interacts with PLZF and relieves
PLZF-mediated repression. Oncogene. 28:3663–3670. 2009. View Article : Google Scholar : PubMed/NCBI
|
|
29
|
Ash SC, Yang DQ and Britt DE: LYRIC/AEG-1
overexpression modulates BCCIPalpha protein levels in prostate
tumor cells. Biochem Biophys Res Commun. 371:333–338. 2008.
View Article : Google Scholar : PubMed/NCBI
|
|
30
|
Yoo BK, Chen D, Su ZZ, Gredler R, Yoo J,
Shah K, Fisher PB and Sarkar D: Molecular mechanism of
chemoresistance by astrocyte elevated gene-1. Cancer Res.
70:3249–3258. 2010. View Article : Google Scholar : PubMed/NCBI
|
|
31
|
Zhang F, Yang Q, Meng F, Shi H, Li H,
Liang Y and Han A: Astrocyte elevated gene-1 interacts with
β-catenin and increases migration and invasion of colorectal
carcinoma. Mol Carcinog. 52:603–610. 2013. View Article : Google Scholar
|
|
32
|
Farina AR, Tacconelli A, Vacca A, Maroder
M, Gulino A and Mackay AR: Transcriptional up-regulation of matrix
metalloproteinase-9 expression during spontaneous epithelial to
neuroblast phenotype conversion by SK-N-SH neuroblastoma cells,
involved in enhanced invasivity, depends upon GT-box and nuclear
factor kappaB elements. Cell Growth Differ. 10:353–367.
1999.PubMed/NCBI
|